Embed Size (px)
Citation preview
1
On the Relationship between Competition
and Efficiency in the EU Banking Sectors
Laurent Weill1
LARGE, Université Robert Schuman, Institut d’Etudes Politiques,
47 avenue de la Forêt-Noire, 67082 Strasbourg Cedex, France.
November 2003
1 Tel : 33-3-88-41-77-21 ; fax : 33-3-88-41-77-78 ; e-mail : [email protected]
2
On the Relationship between Competition
and Efficiency in the EU Banking Sectors
Abstract:
Evidence is scarce regarding the impact of competition on efficiency in banking, even if it
represents a very relevant issue to assess the benefits of a heightened banking competition. This work
investigates the relationship between competition and efficiency in banking on a sample of 12 EU
countries during the period 1994-1999. Competition is measured by the Rosse-Panzar H-Statistic,
while efficiency is estimated with stochastic frontier approach. We provide support to a negative
relationship between competition and efficiency in banking, which does not then corroborate the
intuitive positive influence of competition on efficiency.
Keywords: banking, competition, efficiency, EMU, Rosse-Panzar model, stochastic frontier approach.
JEL Classification: G21, L12.
3
On the Relationship between Competition
and Efficiency in the EU Banking Sectors
I. Introduction
During the last decade, many efforts have been made to favor the
implementation of a Single Banking Market in the European Union. The most notable
measure was the Second Banking Directive, aiming to make the cross-border
expansion of banks easier. These efforts were motivated by the will of increasing
banking competition in the EU. Indeed, a higher degree of competition in banking
markets is expected to provide welfare gains through the reduction of prices, as for
every market of goods and services, but also through the impact of the reduction of
loan rates favoring investment and therefore growth. These latter gains should in fact
come from two channels of transmission. On the one hand, a higher degree of banking
competition should result in a lower monopoly power for banks, and therefore a
decrease of banking prices. On the other hand, a heightened competition should
encourage banks to reduce their costs so that their cost efficiency, meaning their
ability to produce with the minimal costs, would improve. This latter channel is
particularly promising in terms of welfare gains, as the order of magnitude of cost
inefficiencies in the EU banking sectors has been shown to average around 20 and
30% (e.g. Allen and Rai (1996), Dietsch and Weill (2000), Altunbas et al. (2001)).
However, a striking feature of the empirical literature in banking is the lack of
evidence with respect to the relationship between competition and efficiency. Apart
from the commonly accepted view in favor of a positive relationship, theoretical
literature provides some arguments on a negative link between competition and
efficiency. The “efficient-structure” hypothesis, proposed by Demsetz (1973),
suggests a negative relationship, as the most efficient banks benefit from lower costs
and therefore higher market shares. Furthermore, the rare empirical studies on this
issue in European banking find mixed results (Fecher and Pestieau (1993), Lang
(1996), Goldberg and Rai (1996), Punt and Van Rooij (2003)).
Our aim is to shed some light on the relationship between competition and
efficiency in banking, by testing this link on the EU countries during the period 1994-
4
1999. This issue is of utmost interest for banking integration in the EU, as this process
has been motivated by the opinion that its benefits through the reduction of monopoly
rents and the increase of cost efficiency would exceed its potential losses. Indeed, an
increase in banking competition may weaken financial stability, as there is a financial
interdependence between banks due notably to interbank deposits and loans.
Furthermore, a heightened competition may incite banks to take excessive risks when
granting loans, resulting in a higher probability of bankruptcy (e.g. Besanko and
Thakor (1993)). It is therefore important to provide evidence regarding the efficiency
gains expected from the increasing competition to check if benefits of banking
competition really exceed costs.2
To do so, we assess competition and efficiency on a large sample of EU banks
during the period 1994-1999. Banking efficiency is estimated with stochastic frontier
approach, which is commonly applied to estimate a cost efficiency frontier (e.g. Allen
and Rai (1996), Altunbas et al. (2001)). To measure competition, we use the non-
structural test proposed by Rosse and Panzar (1977) and Panzar and Rosse (1987),
which is commonly used to measure banking competition (De Bandt and Davis
(2000), Bikker and Haaf, (2002)). We consider this non-structural measure of
competition as more relevant for our analysis than structural indicators such as
concentration ratios, because it does take contestability into account.
The structure of the paper is as follows. Section 2 provides a brief survey on
former literature on the relationship between competition and efficiency. Section 3
presents the methodologies developed for the tests of competition and the cost
efficiency measures. Data and variables are described in section 4. Section 5 outlines
the empirical results. Finally, we provide some concluding remarks in section 6.
II. Background
This section presents the theoretical and empirical background of the
relationship between competition and efficiency in banking. Relatively little
theoretical literature has been done on the link between competition and efficiency.
As observed by Caves (1980, p.88), economists have « a vague suspicion that
2 See Cetorelli (2001) for a comprehensive survey of positive and negative effects of banking
5
competition is the enemy of sloth ».3 This suspicion is nonetheless supported by a
couple of arguments in the literature. First, Hicks (1935) considers that monopoly
power allows to relax efforts. This “quiet life” assumption resorts to the idea that
monopoly power allows managers to grab a share of the monopoly rents through
discretionary expenses or a reduction of their effort. However, the existence of a
monopoly rent does not explain its appropriation by managers. Indeed, there is no
obvious reason why owners of monopolistic firms would exert a weaker control of
managerial effort than those of competitive firms. Therefore, complementary theories
have been suggested by Leibenstein (1966) and Demsetz (1973).
Leibenstein (1966) explains why inefficiencies inside firms (the “X-
inefficiencies”) exist, and why they are reduced by the degree of competition in
product markets. X-inefficiencies would result from the existence of imperfections in
the internal organization of firms: those imperfections have an impact on the level of
information asymmetries between owners and managers. Indeed, the incompleteness
of labor contracts makes the effort of managers at least partially discretionary. The
discretionary share of the effort would not be the source of any problem if the owners
would have means to control firm performance. But the production function is not
wholly known. Therefore, owners can not check the level of effort exerted by
managers. Leibenstein then considers that the main determinant of the reduction of
inefficiencies is the increase of competitive pressures for two reasons.
First, competition provides incentives to managers to exert a higher effort. As
they are aware of the increase of competition, managers have to improve their
performance unless their firm leaves the market. Thus, managers are motivated by
their will to avoid the personal costs of bankruptcy. Second, a higher number of firms
on the market improves the possibilities for owners to assess firm performance,
relative to other firms. They acquire in this way a better knowledge about the
production function of the firm. Owners are then able to make a better assessment of
managerial performance and consequently to proceed to changes in management if
necessary. Being informed about the comparative possibilities of competition,
managers are inclined to exert a higher effort. Following Leibenstein’s works, a few
studies have proposed a formalization of his ideas (Hart (1983), Selten (1986),
competition 3 For instance, Adam Smith (1776) vaguely argued that “monopoly… is a great enemy to management.”
6
Scharfstein (1988)). The X-efficiency theory from Leibenstein lies in fact within the
scope of the “Structure – Conduct - Performance” paradigm proposed by Bain (1951).
According to this paradigm, the market structure would influence firm behavior in
terms of prices and quantities, and therefore firm profits.
An alternative assumption has however been proposed by Demsetz (1973),
which predicts a reverse causality between competition and cost efficiency: the
efficient-structure hypothesis. He considers that the best-managed firms have the
lowest costs and consequently the largest market shares, which leads to a higher level
of concentration. Thus, the causality of the relationship between competition and
efficiency is reversed in comparison to the “Structure – Conduct - Performance”
paradigm: efficiency determines competition. As concentration can be considered as
an inverse measure of the competition, there should then exist a negative link between
competition and efficiency. The efficient-structure hypothesis received some
theoretical support with the influence of scale economies on efficiency of firms
(Martin (1992), Bertoletti et Poletti (1996)). Indeed, the existence of scale economies
on a market means that an increase of the number of competitors results in higher
average costs for each incumbent firm. Consequently, competition would decrease
cost efficiency.
This survey has until now only presented some theoretical references about the
link between competition and efficiency, which are not specific to the banking
industry. This generality matters, as banking markets have some specific
characteristics in comparison to other markets. First of all, banking markets have a
structure of imperfect competition, as observed in most studies on banking
competition (e.g. Hannan (1991), Molyneux, Lloyd-Williams and Thornton (1994),
De Bandt and Davis (2000), Bikker and Haaf (2002)). In fact, theoretical literature in
banking suggests that imperfect competition may result from the information
asymmetries between the lender and the borrower in the credit activity. As a
consequence, banks have to implement some mechanisms to solve the resulting
problems such as adverse selection and moral hazard. 4 One is the implementation by
the bank of a customer relationship, meaning a long-term repeated relationship, to
gain some information on the borrower. Banks can then reduce the problems related
to information asymmetries. In summary, banks are inclined to implement customer
4 See Freixas and Rochet (1997) for further details on the role of information asymmetries on banking activities.
7
relationships, which are repeated and based on the proximity to have more
information. This element leads to some characteristics of the banking markets, such
as their local nature as banks need an information based on the proximity with
customers. Furthermore, banking activities require sunk costs, as banking markets
have high barriers to exit. These barriers come from the need to implement a customer
relationship through a network of branches, but also from the fact that a loan portfolio
is a rather illiquid asset as the potential buyers are not able to know its real value.
Sunk costs have been observed to lead to excess capacities on EU banking markets
(Davis and Salo (1998)). Therefore, these overcapacities of banking markets are
endogenous barriers to the entry of new competitors.
These specific characteristics of the banking industry may consequently modify
the relationship between competition and efficiency in banking. Diamond (1984) has
shown that banks have a comparative advantage in the ex post monitoring of
borrowers, in comparison to investors, because of the existence of scale economies
resulting from their role of delegated monitor. These scale economies mean then that
an increase in competition may decrease cost efficiency. Furthermore, an increase in
banking competition may reduce the length of customer relationship. But this
relationship allows to reduce monitoring costs resulting from information
asymmetries in the loan activity. As a consequence, competition may increase
monitoring costs because of the existence of scale economies, and of the reduction of
the length of the customer relationship. In other words, the specificities of the banking
industry provide some additional arguments in favor of a negative relationship
between competition and cost efficiency.
We now turn to the empirical studies on the relationship between competition
and efficiency in banking. Only a few works have been performed on this issue, most
of them regressing cost efficiency on a set of variables for market structure: Berger
(1995) and Berger and Hannan (1997) on US banks, Lang (1996) on German banks,
Goldberg and Rai (1996) and Punt and Van Rooij (2003) on European banks. In these
works, cost efficiency is generally measured with stochastic frontier approach, while
market structure is taken through market share or concentration indices into account.
These papers tend to support a positive relationship between cost efficiency and
concentration / market share. Therefore, they are rather in favor of the “efficient-
structure” hypothesis. However, Fecher and Pestieau (1993) analyze the correlation
8
between technical efficiency and concentration in the financial sector in 11 OECD
countries, and conclude in favor of a negative correlation.
In summary, theoretical literature provides conflicting arguments with respect to
the relationship between competition and efficiency, while empirical literature is
scarce on this issue in the EU banking sectors. It seems therefore relevant to provide
new empirical evidence with respect to the relationship between competition and
efficiency in EU banking sectors. Furthermore, no study on this relationship has to
our knowledge used the Rosse-Panzar model to measure competition, while it is
commonly applied in works assessing banking competition. We then bring new
empirical elements where competition and efficiency are measured using some of the
most commonly accepted tools in banking literature.
III. Methodology
Before investigating the relationship between competition and efficiency in
banking, one must be able to measure these characteristics. In this section, we
therefore explain how we estimate competition and efficiency. We finally present our
regression model to provide evidence on the link between competition and efficiency.
1 Measurement of competition
We aim to measure banking competition by computing the so-called Rosse-
Panzar model (Rosse and Panzar (1977), Panzar and Rosse (1987)). This model has
been widely applied in banking (e.g. Molyneux, Lloyd-Williams and Thornton
(1994), De Bandt and Davis (2000), Bikker and Groeneveld (2000), Bikker and Haaf
(2002) for applications on European countries). It is a non-structural test, as it
assesses the competitive behavior of banks without using information on the structure
of the banking market. Furthermore, it does not request information on output prices,
which partly explains its numerous applications in banking, as output prices are hard
to collect in this industry.
The major advantage of such a test in comparison to structural measures of
competition such as the concentration ratio C5 or the Herfindahl index is that it takes
9
the actual behavior of the bank into account by including contestability. Indeed, as
observed by Claessens and Laeven (2003), the actual behavior of a bank is not only
related to market structure but also to the barriers to entry influencing the likelihood
of the entry of new competitors and therefore the behavior of incumbents forecasting
such an entry.
This non-structural test is based upon the estimation of the H-statistic, which
aggregates the elasticities of total revenues to the input prices. The H-statistic
determines the nature of market structure: it is equal to 0 in monopoly, between 0 and
1 in monopolistic competition, and 1 in perfect competition. Former studies using this
test of competition generally conclude to monopolistic competition in EU banking
markets. Molyneux, Lloyd-Williams and Thornton (1994) conclude in this sense
during the period 1986-1989 with the exception of Italy where monopoly is observed.
Analyzing the period 1992-1996, De Bandt and Davis (2000) find monopolistic
competition for Italian banks, but also for large French and German banks, whereas
their conclusion is in favor of monopoly for small French and German banks. Bikker
and Groeneveld (2000), and Bikker and Haaf (2002) observe monopolistic
competition in all EU countries during the period 1988-1998.
Our aim is to have a measure of banking competition for each year and each
country so that we can have enough couples of observations (country, year) to test the
relationship between competition and efficiency. Therefore, we need to separately run
the Rosse-Panzar model for each country and each year to obtain estimates of input
prices which are specific to each country and each year.
The problem of this approach is that some national samples are very small,
meaning that the estimations of the Rosse-Panzar model are very poor on a statistical
basis. Therefore, we need to perform this test on our whole sample for each year.
However, we need to have country-specific estimates of the coefficients of input
prices to analyze banking competition for each country and not for the EU as a whole,
In this aim, we include interactive terms for each input price, jointing the variable
with a dummy variable for each country. Consequently, we estimate the following
equation for the measurement of Rosse-Panzar statistic :
10
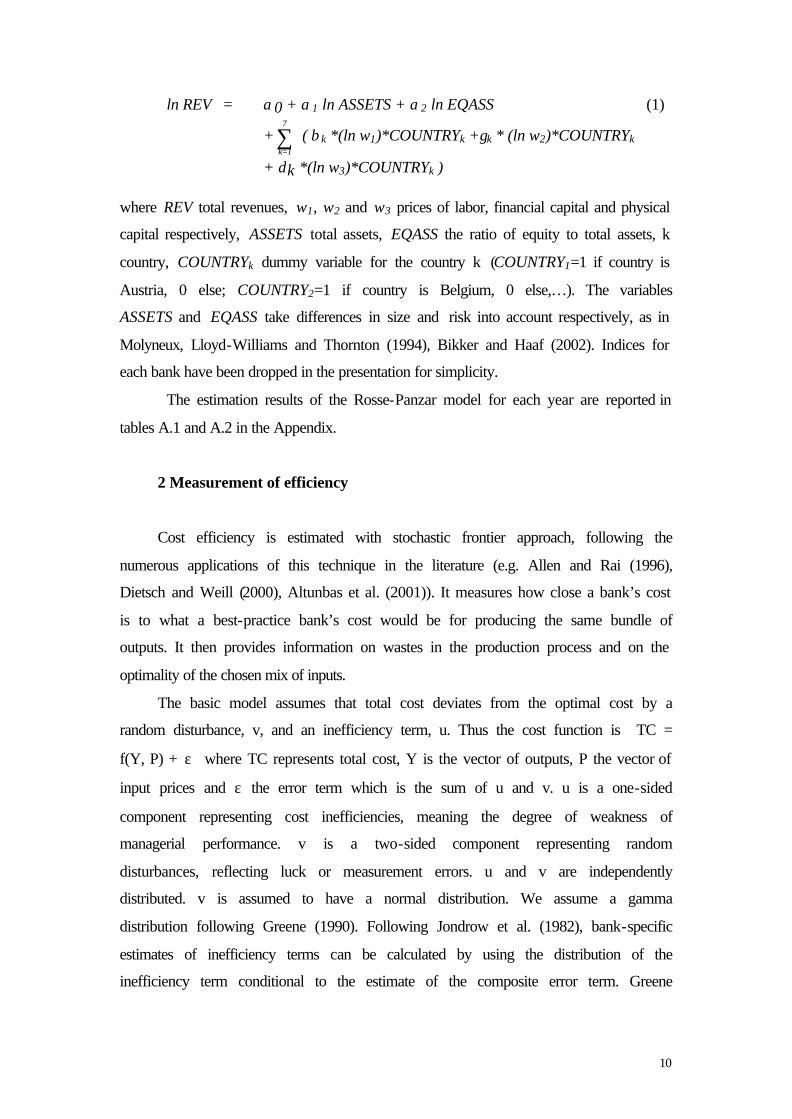
ln REV = α0 + α1 ln ASSETS + α2 ln EQASS (1)
+∑=
7
1k
( βk *(ln w1)*COUNTRYk +γk * (ln w2)*COUNTRYk
+ δk *(ln w3)*COUNTRYk )
where REV total revenues, w1, w2 and w3 prices of labor, financial capital and physical
capital respectively, ASSETS total assets, EQASS the ratio of equity to total assets, k
country, COUNTRYk dummy variable for the country k (COUNTRY1=1 if country is
Austria, 0 else; COUNTRY2=1 if country is Belgium, 0 else,…). The variables
ASSETS and EQASS take differences in size and risk into account respectively, as in
Molyneux, Lloyd-Williams and Thornton (1994), Bikker and Haaf (2002). Indices for
each bank have been dropped in the presentation for simplicity.
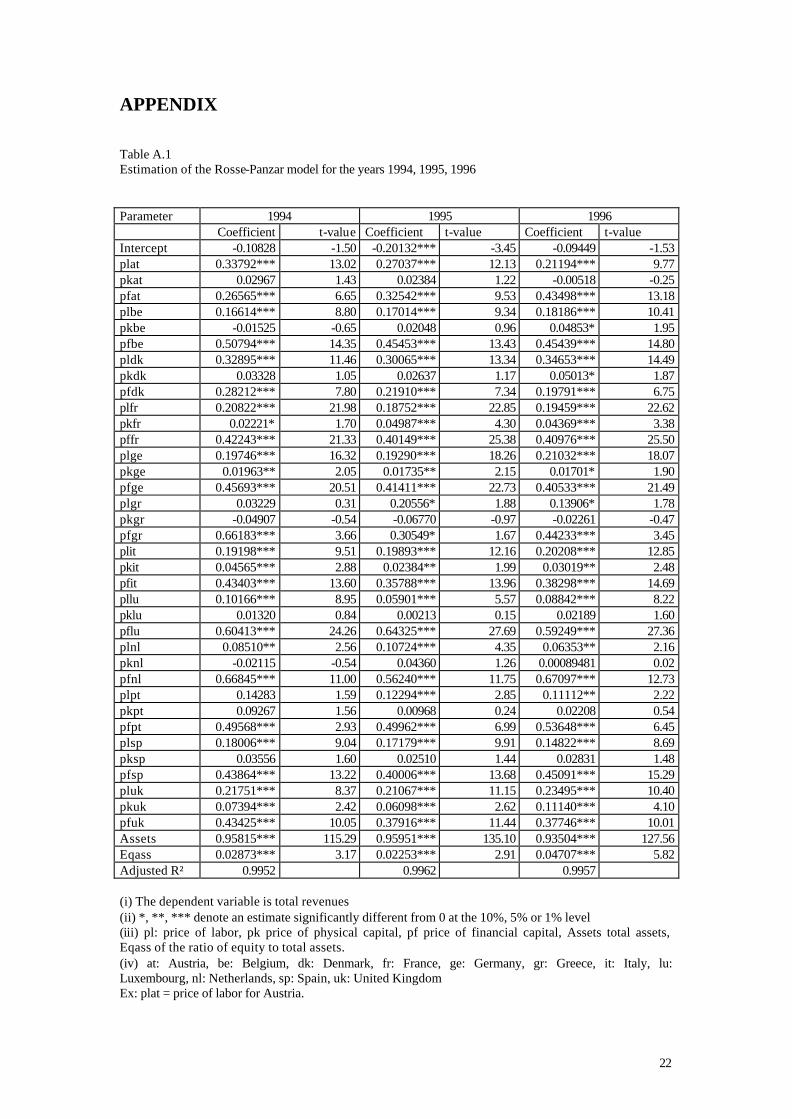
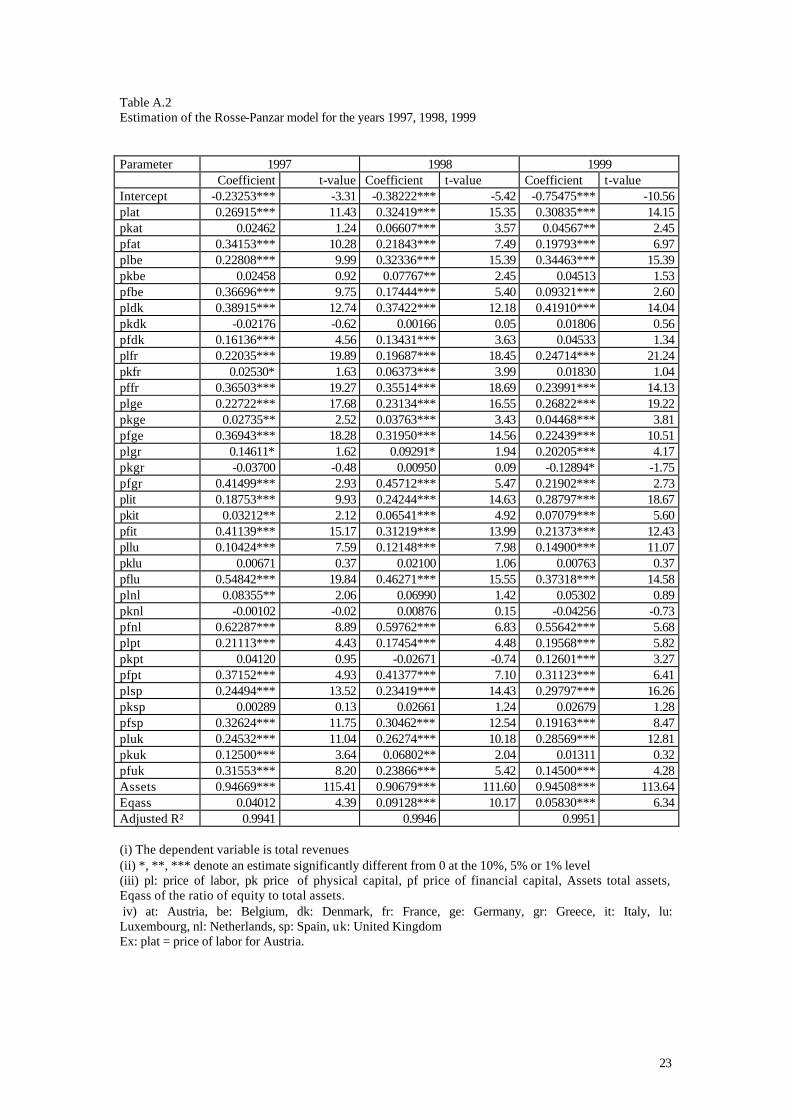
The estimation results of the Rosse-Panzar model for each year are reported in
tables A.1 and A.2 in the Appendix.
2 Measurement of efficiency
Cost efficiency is estimated with stochastic frontier approach, following the
numerous applications of this technique in the literature (e.g. Allen and Rai (1996),
Dietsch and Weill (2000), Altunbas et al. (2001)). It measures how close a bank’s cost
is to what a best-practice bank’s cost would be for producing the same bundle of
outputs. It then provides information on wastes in the production process and on the
optimality of the chosen mix of inputs.
The basic model assumes that total cost deviates from the optimal cost by a
random disturbance, v, and an inefficiency term, u. Thus the cost function is TC =
f(Y, P) + ε where TC represents total cost, Y is the vector of outputs, P the vector of
input prices and ε the error term which is the sum of u and v. u is a one-sided
component representing cost inefficiencies, meaning the degree of weakness of
managerial performance. v is a two-sided component representing random
disturbances, reflecting luck or measurement errors. u and v are independently
distributed. v is assumed to have a normal distribution. We assume a gamma
distribution following Greene (1990). Following Jondrow et al. (1982), bank-specific
estimates of inefficiency terms can be calculated by using the distribution of the
inefficiency term conditional to the estimate of the composite error term. Greene
11
(1990) has then provided the estimate of the cost inefficiency term with a gamma
distribution.
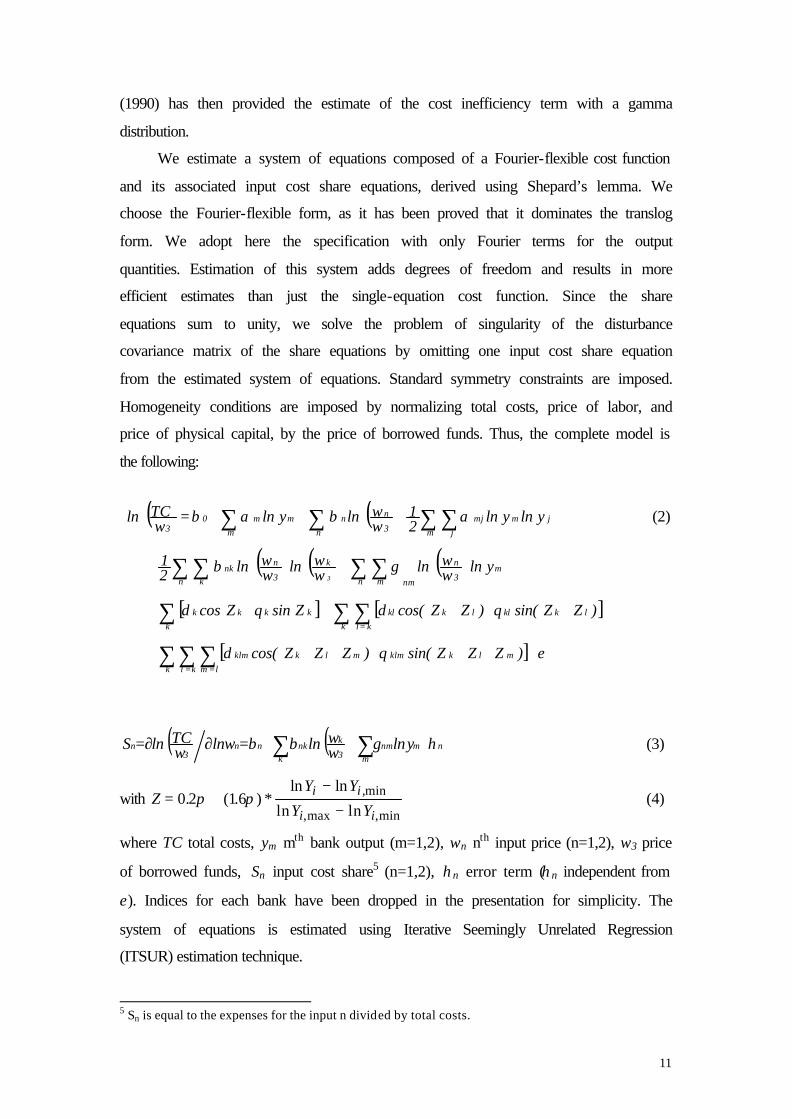
We estimate a system of equations composed of a Fourier-flexible cost function
and its associated input cost share equations, derived using Shepard’s lemma. We
choose the Fourier-flexible form, as it has been proved that it dominates the translog
form. We adopt here the specification with only Fourier terms for the output
quantities. Estimation of this system adds degrees of freedom and results in more
efficient estimates than just the single-equation cost function. Since the share
equations sum to unity, we solve the problem of singularity of the disturbance
covariance matrix of the share equations by omitting one input cost share equation
from the estimated system of equations. Standard symmetry constraints are imposed.
Homogeneity conditions are imposed by normalizing total costs, price of labor, and
price of physical capital, by the price of borrowed funds. Thus, the complete model is
the following:
(2)
( ) ( ) ∑∑ +++=∂∂=m
nmnmk 3
knknn
3n ylnw
w lnwlnwTC lnS ηγββ (3)
with ZY Y
Y Yi i
i i= +
−
−0 2 1 6. ( . ) *
ln ln
ln ln,min
,max ,minπ π (4)
where TC total costs, ym mth bank output (m=1,2), wn nth input price (n=1,2), w3 price
of borrowed funds, Sn input cost share5 (n=1,2), ηn error term (ηn independent from
ε). Indices for each bank have been dropped in the presentation for simplicity. The
system of equations is estimated using Iterative Seemingly Unrelated Regression
(ITSUR) estimation technique.
5 Sn is equal to the expenses for the input n divided by total costs.
( ) ( )( ) ( ) ( )
[ ] [ ]
[ ] εθδ
θδθδ
γβ
αβαβ
+++++++
++++++
++
+++=
∑ ∑ ∑
∑ ∑∑
∑ ∑∑ ∑
∑ ∑ ∑∑
= =
=
k kl lmmlkklmmlkklm
k kllkkllkkl
kkkkk
m3
n
nmn mn k
k
3
nnk
n m jjmmj
3
nnm
mm03
)ZZZsin()ZZZcos(
)ZZsin()ZZcos( ZsinZcos
yln ww lnw
w ln ww ln2
1
ylnyln21
ww lnyln
wTC ln
3
12
3 The regression model
We now turn to the model adopted to analyze the link between competition and
efficiency in banking. We perform a regression of the mean of cost efficiency on a set
of variables including the measure of competition. Our sample of observations
includes 12 countries and 6 years, meaning 72 country-year observations. We
incorporate fixed effects for countries in the regression to disentangle the country
effects. The dependent variable is the mean of cost efficiency scores. The main
explaining variable is competition, measured by the H-statistic.
Several recent studies aiming to explain banking competition have recently
used the H-statistic as a measure of competition in regressions. While Bikker and
Groeneveld (2000), Bikker and Haaf (2002) and Jansen and de Haan (2003) analyze
the impact of banking concentration on competition in developed countries, Claessens
and Laeven (2003) test the influence of numerous variables taking banking structure
and legal and economic development into account on banking competition.
As the dependent variable is bounded by construction between 0 and 1, an OLS
regression model would provide biased results. We therefore resort to a Tobit
procedure for the regression.
We also include some control variables as a natural robustness check of the
relationship between competition and efficiency. However, due to the limited size of
our sample, we consider only three control variables, relating to banking structure and
economic development: per capita income, the density of demand, the intermediation
ratio. The choice of these three variables is notably based on their proven influence on
banking efficiency (Dietsch and Lozano-Vivas (2000), Cavallo and Rossi (2002)).
Per capita income is obtained by dividing GDP by the number of inhabitants. It
is expected to have a positive influence on banking efficiency, as countries with
higher per capita income may have clients consuming more banking products. The
density of demand is measured by the ratio of total deposits per square kilometer. This
variable is expected to have a positive influence on bank efficiency, as banks
operating on markets with a lower density of demand would likely incur higher
expenses. The intermediation ratio is the ratio of total loans to total deposits. This
ratio is assumed to have a positive influence on efficiency, because the higher the
13
ratio, the lower the quantity of deposits needed to produce loans will be, and so will
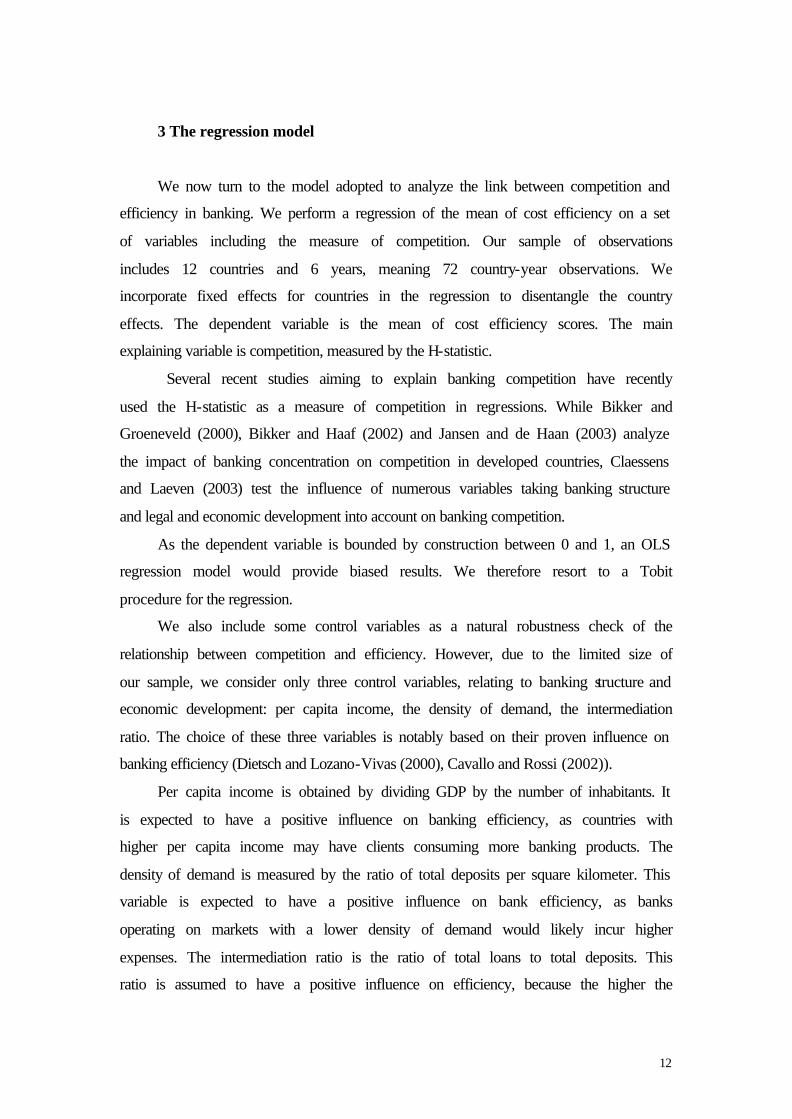
be the cost of the production of loans. The regression model is then as follows:
Efficiencyit = f (Competitionit, GDPit, Demandit, Intermit, ∑=
11
1j
Countryj) (5)
for i=1,…, I where I is the number of countries and t=1,…, N where N is the
number of years observed. Subscripts i and t refer to country i for year t. Efficiencyit is
the mean efficiency score of banks. And Competitionit, GDPit, Demandit, Intermit the
H-statistic, per capita income, the density of demand and the intermediation ratio for
the country i and year t respectively. Finally, the variables Countryj are dummy
variables for each country, being equal to one if the bank comes from the country and
else zero. One dummy variable is dropped. These variables are included to take
country effects into account. We proceed to two Tobit regressions. While both include
fixed effects for countries, they differ on the introduction of the three control variables
to analyze their influence on the results.
IV. Data and variables
Data for banks were gathered from the "Bankscope" database of BVD-IBCA.
We use unconsolidated accounting data for 1746 banks from 12 EU member countries
(156 from Austria, 62 from Belgium, 92 from Denmark, 279 from France, 347 from
Germany, 20 from Greece, 453 from Italy, 110 from Luxembourg, 17 from the
Netherlands, 25 from Portugal, 152 from Spain, 33 from the United Kingdom). We do
not include in our study all the fifteen member countries of the EU, given the lack of
sufficient data in our database for the three missing countries (Finland, Ireland,
Sweden).
We use an unbalanced panel during the period 1994-1999.6 It includes
commercial, cooperative and savings banks. We adopt the Tukey box-plot, based on
the use of interquartile range to clean data : banks with observations out of the range
6 We choose an unbalanced panel rather than a balanced panel, to take banks gone into bankrupt or those being absorbed into account. Indeed the use of a balanced panel may overestimate cost efficiency as it ignores these banks, which may be less efficient on average.
14
defined by the first and third quartiles that are greater or less than one and half the
interquartile range were dropped for each mean input price over the period.
We adopt the intermediation approach for the definition of inputs and outputs.
It assumes that the bank collects deposits to transform them, using labor and capital,
into loans as opposed to the production approach, which views the bank as using labor
and capital to produce deposits and loans. Two outputs are adopted in the cost
efficiency frontier: loans, and investment assets. The inputs, whose prices are used to
estimate the cost efficiency frontier and the Rosse-Panzar statistic, include labor,
physical capital and borrowed funds.
As data on the number of employees are not available, the price of labor is
measured by the ratio of personnel expenses to total assets, following Altunbas, Evans
and Molyneux (2001) and Bikker and Haaf (2002). The price of physical capital is
defined as the ratio of other non-interest expenses to fixed assets. The price of
borrowed funds is measured by the ratio of paid interests to all funding. Total costs
requested in the cost frontier are the sum of personnel expenses, other non-interest
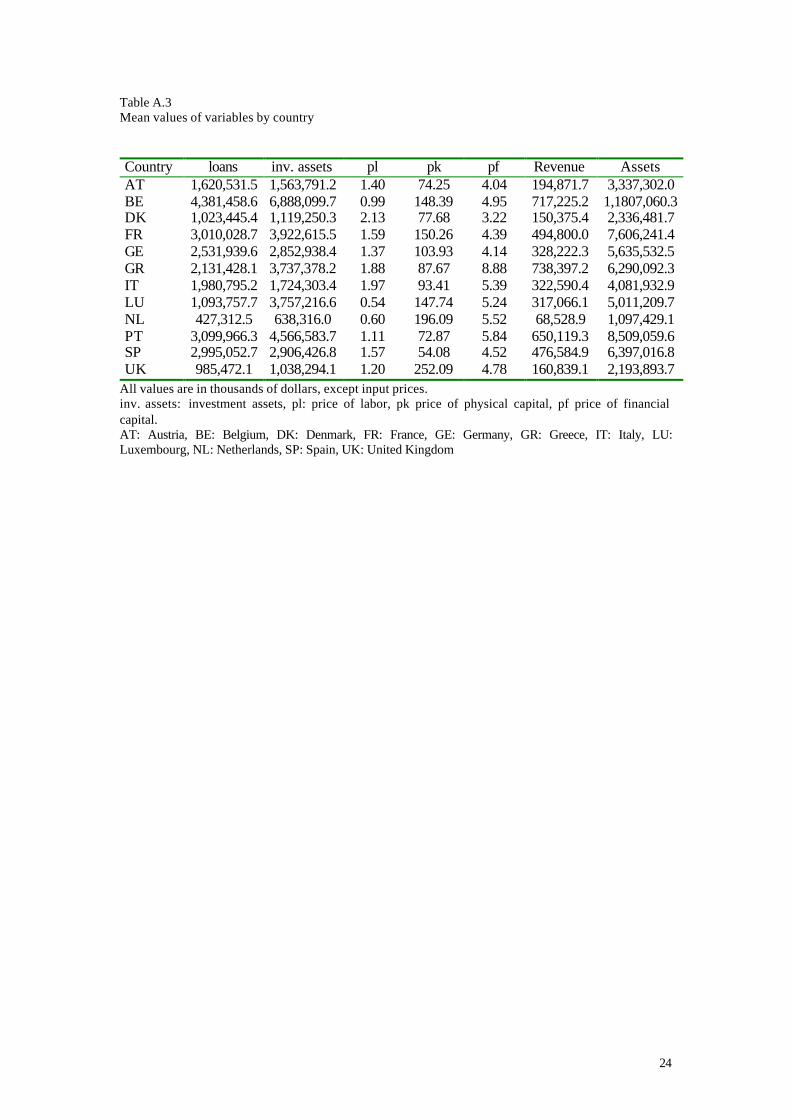
expenses and paid interest. Summary statistics by country are reported in table A.3 in
the Appendix. Finally, data for control variables come from OECD (2001).
V. Results
We now present the results on the relationship between competition and
efficiency in banking. We first display the estimations by country and year for the
competition and efficiency measures. Even if the analysis of the evolution of
competition and efficiency in EU banking is not the core of this paper, it may provide
a first glance on the relationship between competition and efficiency in banking. The
results of the Rosse-Panzar tests and the estimation of efficiency scores for each
country and each year are respectively shown in tables 1 and 2.
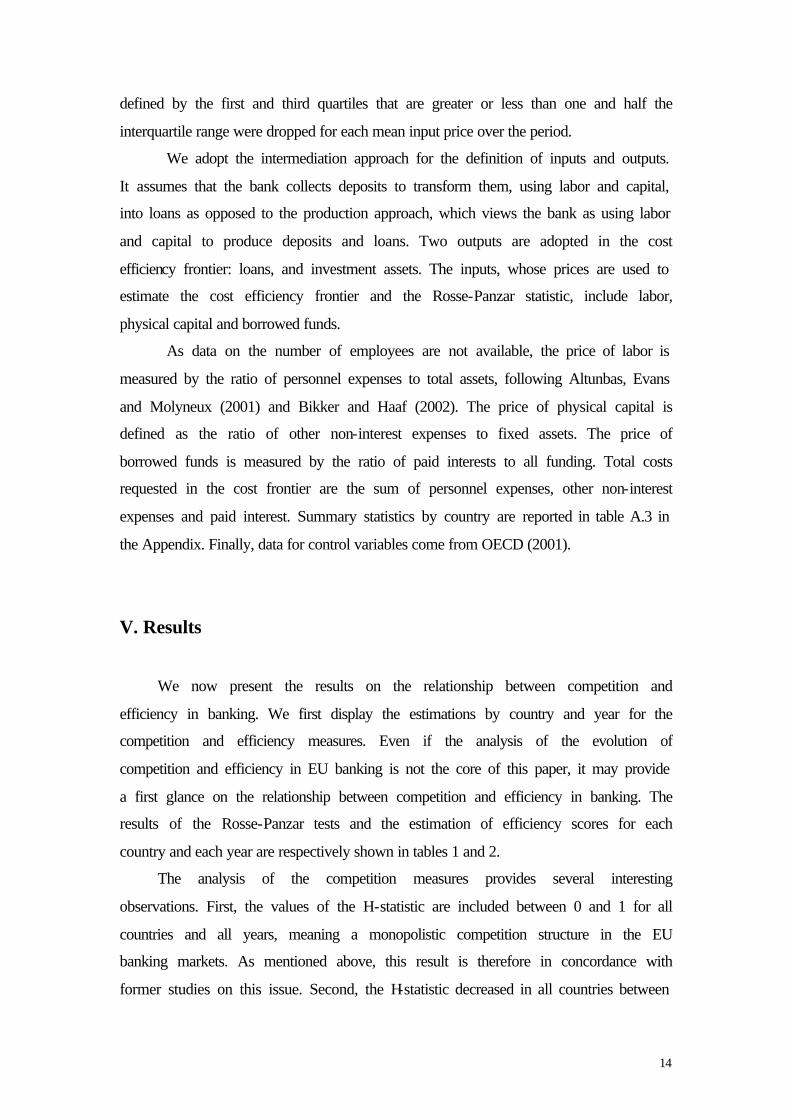
The analysis of the competition measures provides several interesting
observations. First, the values of the H-statistic are included between 0 and 1 for all
countries and all years, meaning a monopolistic competition structure in the EU
banking markets. As mentioned above, this result is therefore in concordance with
former studies on this issue. Second, the H-statistic decreased in all countries between
15
1994 and 1999. In other words, there was no improvement of competition during this
period, but rather an increase of distance between the market structure of banking
markets and perfect competition.
Table 1 H-statistic by country and year
Country 1994 1995 1996 1997 1998 1999 Mean AT 0.6332 0.6196 0.6417 0.6353 0.6087 0.5520 0.5572 BE 0.6588 0.6452 0.6848 0.6196 0.5755 0.4830 0.5629 DK 0.6444 0.5461 0.5946 0.5287 0.5102 0.4825 0.4389 FR 0.6529 0.6389 0.6480 0.6107 0.6157 0.5054 0.5775 GE 0.6740 0.6244 0.6327 0.6240 0.5885 0.5373 0.5814 GR 0.6451 0.4433 0.5588 0.5241 0.5595 0.2921 0.5410 IT 0.6717 0.5807 0.6153 0.6310 0.6200 0.5725 0.6175 LU 0.7190 0.7044 0.7028 0.6594 0.6052 0.5298 0.5529 NL 0.7324 0.7132 0.7354 0.7054 0.6763 0.5669 0.5935 PT 0.7312 0.6322 0.6697 0.6238 0.5616 0.6329 0.7338 SP 0.6543 0.5969 0.6274 0.5741 0.5654 0.5164 0.5314 UK 0.7257 0.6508 0.7238 0.6858 0.5694 0.4438 0.5698
AT: Austria, BE: Belgium, DK: Denmark, FR: France, GE: Germany, GR Greece, IT: Italy, LU: Luxembourg, NL: Netherlands, SP: Spain, UK: United Kingdom
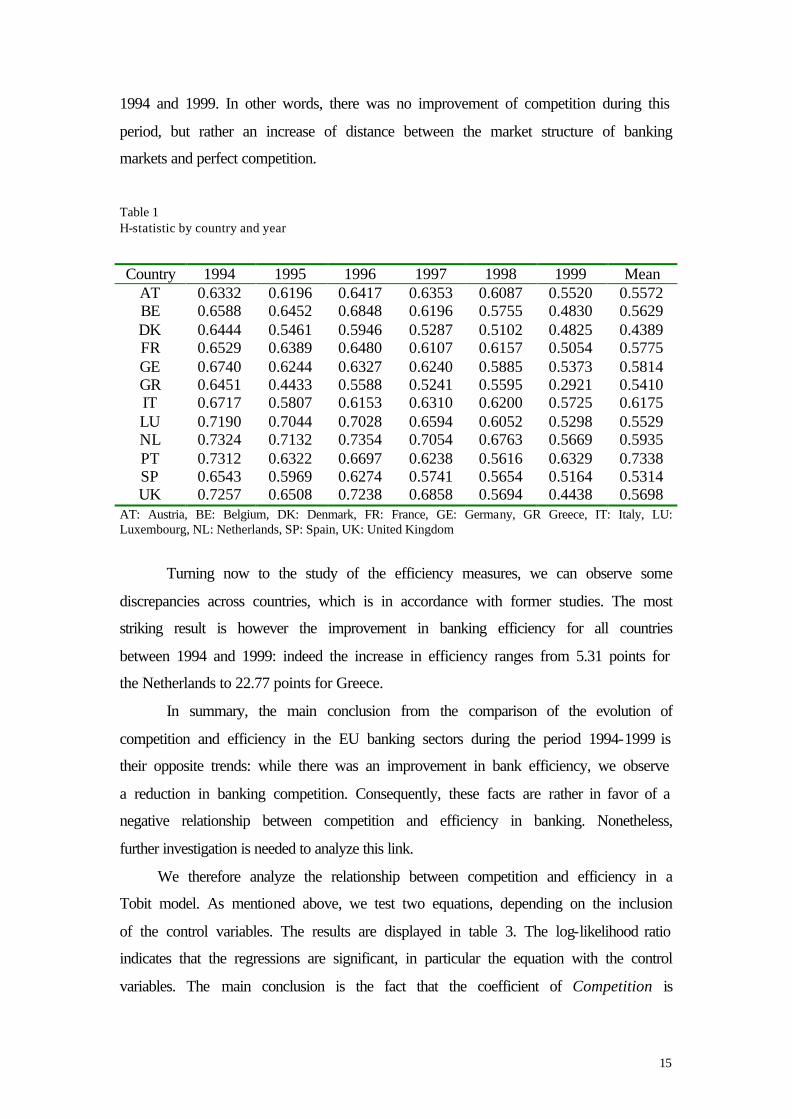
Turning now to the study of the efficiency measures, we can observe some
discrepancies across countries, which is in accordance with former studies. The most
striking result is however the improvement in banking efficiency for all countries
between 1994 and 1999: indeed the increase in efficiency ranges from 5.31 points for
the Netherlands to 22.77 points for Greece.
In summary, the main conclusion from the comparison of the evolution of
competition and efficiency in the EU banking sectors during the period 1994-1999 is
their opposite trends: while there was an improvement in bank efficiency, we observe
a reduction in banking competition. Consequently, these facts are rather in favor of a
negative relationship between competition and efficiency in banking. Nonetheless,
further investigation is needed to analyze this link.
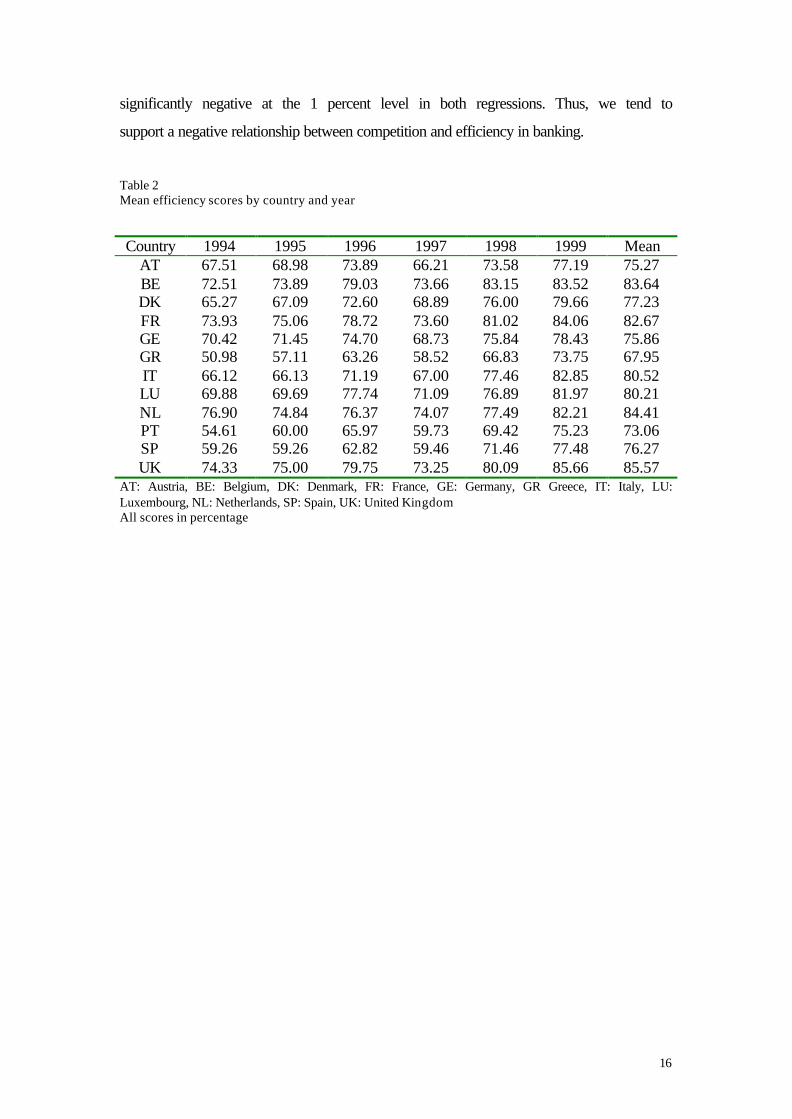
We therefore analyze the relationship between competition and efficiency in a
Tobit model. As mentioned above, we test two equations, depending on the inclusion
of the control variables. The results are displayed in table 3. The log-likelihood ratio
indicates that the regressions are significant, in particular the equation with the control
variables. The main conclusion is the fact that the coefficient of Competition is
16
significantly negative at the 1 percent level in both regressions. Thus, we tend to
support a negative relationship between competition and efficiency in banking.
Table 2 Mean efficiency scores by country and year
Country 1994 1995 1996 1997 1998 1999 Mean AT 67.51 68.98 73.89 66.21 73.58 77.19 75.27 BE 72.51 73.89 79.03 73.66 83.15 83.52 83.64 DK 65.27 67.09 72.60 68.89 76.00 79.66 77.23 FR 73.93 75.06 78.72 73.60 81.02 84.06 82.67 GE 70.42 71.45 74.70 68.73 75.84 78.43 75.86 GR 50.98 57.11 63.26 58.52 66.83 73.75 67.95 IT 66.12 66.13 71.19 67.00 77.46 82.85 80.52 LU 69.88 69.69 77.74 71.09 76.89 81.97 80.21 NL 76.90 74.84 76.37 74.07 77.49 82.21 84.41 PT 54.61 60.00 65.97 59.73 69.42 75.23 73.06 SP 59.26 59.26 62.82 59.46 71.46 77.48 76.27 UK 74.33 75.00 79.75 73.25 80.09 85.66 85.57
AT: Austria, BE: Belgium, DK: Denmark, FR: France, GE: Germany, GR Greece, IT: Italy, LU: Luxembourg, NL: Netherlands, SP: Spain, UK: United Kingdom All scores in percentage
17
Table 3 Regression results
Without control variables With control variables Intercept 0.985*** (19.89) 0.560*** (4.97) Competition -0.535*** (-7.32) -0.354*** (-4.04) Per capita GDP 0.113E-5** (2.13) Deposits per km² -0.689E-10 (-1.11) Intermediation ratio 0.207*** (3.64) AT 0.056** (2.47) -0.121*** (-2.85) BE 0.118*** (5.18) 0.038 (0.82) DK 0.026 (1.09) -0.072 (-1.58) FR 0.120*** (5.24) -0.060 (-1.45) GE 0.076*** (3.32) -0.059 (-1.49) GR -0.098*** (–3.94) 0.005 (0.15) IT 0.062*** (2.72) -0.106*** (-2.75) LU 0.110*** (4.84) 0.380 (1.00) NL 0.153*** (6.66) 0.028 (0.45) SP -0.020 (–0.88) -0.049** (-2.37) UK 0.134*** (5.89) 0.039 (1.30) Sigma 0.039 0.034 Log-likelihood 130.742 142.131 *, **, *** denote an estimate significantly different from 0 at the 10%, 5% or 1% level AT, BE, DK, FR, GE, GR, IT, LU, NL, SP, UK respectively dummy variables for the countries Austria, Belgium, Denmark, France, Germany, Greece, Italy, Luxembourg, Netherlands, Spain, United Kingdom
How to interpret this result? It may seem surprising at first glance, as a positive
link may seem more intuitive. However several explanations may justify such a result.
First, the “efficient-structure” hypothesis can explain this result. Namely, the most
efficient banks may have increased their market share, following the acquisition or the
bankruptcy of the least efficient banks. It can notably be argued that the wave of
domestic mergers in EU countries during the nineties led to an improvement in cost
efficiency as some evidence suggests that the acquirers were more efficient than the
acquired banks (Huizinga, Nelissen and Vander Vennet (2001)).
Second, the specificities of banking competition may also explain this result.
Namely, a decrease in competition may have favored cost efficiency for banks, as
they can benefit more from scale economies in monitoring and also from a higher
length in the customer relationship, providing best information on the borrowers.
Third, we can also consider that some elements may have influenced both
competition and efficiency. Indeed the perspective of the single banking market with
the implementation of the single currency and more particularly the expected cross-
18
border mergers may have incited banks to improve efficiency through two channels.
On the one hand, banks have realized gains in cost efficiency so as they have more
chances to survive on the new market structure. On the other hand, banks were
inclined to increase their market share so that they create some barriers to entry of
new competitors. Yafeh and Yosha (2001) and Weill (2002) have thus shown that
banks can implement barriers to entry by increasing their customership, so that the
switching costs for the customers prevent the potential competitors to come on the
market.
Thus, we do not reject the positive influence of competition on efficiency, but
we show that other factors play a prominent role on the relationship between
competition and efficiency in banking. These latter factors are strong enough to
counterbalance this positive influence for the EU banking sectors during the recent
years.
Regarding the other explaining variables, the significance of the coefficients of
the country dummy variables varies according to the country and of the regression.
These differences come from the fact that these variables measure the existence of an
advantage or a weakness in efficiency for each country in comparison to Portugal, as
the dummy variable for Portugal was dropped. As a result, the significance is linked
to the existence of such a significant difference in efficiency. Furthermore, a dummy
variable for a country may be significant in the first regression while non significant
in the second regression, because the inclusion of the control variables may explain
the cross-country differences in banking efficiency. Therefore, including a variable
such as GDP may reduce the gap in efficiency between two countries where
discrepancies in GDP explain different efficiency levels. Regarding the three control
variables, we observe as expected a positive and significant coefficient for GDP and
Interm, but the coefficient is not significant for Demand.
19
VI. Concluding remarks
This research has provided new evidence with respect to the relationship
between competition and efficiency in banking. We measure these variables with
tools commonly used in empirical banking literature. Competition is measured by the
Rosse-Panzar H-statistic, while efficiency is estimated with stochastic frontier
approach.
We provide evidence in favor of a negative link between competition and
efficiency in banking. This result may appear counterintuitive. Nevertheless the
“efficient-structure” hypothesis provides some theoretical support for such a result.
Furthermore, the specificities of the banking industry, where a fall in competition
results in lower monitoring costs, may also explain this result. Finally, it may also be
explained by the efforts of banks to be prepared to the forthcoming single banking
market with the implementation of the single currency and the expected cross-border
mergers. As a result, banks may have been inclined to improve their cost efficiency,
but also to increase their market share so that they create some barriers to entry
In normative terms, we do not provide support to the efforts from the
European authorities to promote banking competition, as competition does not favor
efficiency in EU banking. However, even if these efforts were not successful in
improving banking efficiency, they may have allowed a reduction of monopoly rents
and therefore may have led to welfare gains. The observed reduction in banking
competition is not however in favor of this assumption, even if further research is
needed to assess the evolution of monopoly rents in the EU banking sectors.
In summary, the aim of the paper was to analyze the relevance of one of the
expected benefits of a heightened competition in banking, the increase in cost
efficiency, keeping in mind that the existence of potential losses from higher banking
competition makes necessary such benefits to justify the policies promoting banking
competition. We provide empirical elements against this expected benefit, meaning
that favoring competition in banking may therefore be negative. Our results should,
however, be considered with care as this issue needs further analysis to assess the
relevance of the different explanations proposed to explain them.
20
REFERENCES
ALLEN L. and RAI A. (1996). "Operational Efficiency in Banking: An International Comparison", Journal of Banking and Finance 20, 655-672.
ALTUNBAS Y., GARDENER E.P.M., MOLYNEUX P. and MOORE B. (2001). "Efficiency in European Banking", European Economic Review 45, 10, 1931-1955.
BAIN J. (1951). “Relation of Profit Rate to Industry Concentration”, Quarterly Journal of Economics 65, 293-324.
BERGER A. (1995). "The Profit-Structure Relationship in Banking – Tests of Market-Power and Efficient-Structure Hypotheses", Journal of Money, Credit, and Banking 27, 404-431.
BERGER A. and HANNAN T. (1997). "Using Efficiency Measures to Distinguish among Alternative Explanations of the Structure-Performance Relationship in Banking", Managerial Finance 1, 23, 6-31.
BERTOLETTI P. and POLETTI C. (1996). "A Note on Endogenous Firm Efficiency in Cournot Models of Incomplete Information", Journal of Economic Theory 71, 303-310.
BESANKO D. and THAKOR A. (1993). "Relationship Banking, Deposit Insurance and Bank Portfolio", in Capital Markets and Financial Intermediation (Editors: C. Mayer and X. Vives), Cambridge University Press, 292-318.
BIKKER J. and GROENEVELD J. (2000). "Competition and Concentration in the EU Banking Industry", Kredit und Kapital 33, 62-98.
BIKKER J. and HAAF K. (2002). "Competition, Concentration and their Relationship: An Empirical Analysis of the Banking Industry", Journal of Banking and Finance 26, 2191-2214.
CAVALLO L. and ROSSI S. (2002). "Do Environmental Variables Affect the Performance and Technical Efficiency of the European Banking System? A Stochastic Frontier Approach", European Journal of Finance 8, 1, 123-146.
CAVES R. (1980). "Industrial Organization, Corporate Strategy and Structure", Journal of Economic Literature 18, 64-92.
CETORELLI N. (2001). "Competition among Banks: Good or Bad ?", Economic Perspectives, Federal Reserve Bank of Chicago, 25, 2, 38-48.
CLAESSENS S. and LAEVEN L. (2003). "What Drives Bank Competition? Some International Evidence " . World Bank Policy Research Working Paper 3113.
DAVIS E. and SALO S. (1998). "Excess Capacity in EU and US banking sectors – Conceptual, Measurement and Policy Issues", LSE Financial Markets Group Special Paper n°105.
DE BANDT O. and DAVIS P. (2000). "Competition, Contestability and Market Structure in European Banking Sectors on the Eve of EMU", Journal of Banking and Finance 24, 1045-1066.
DEMSETZ H. (1973). "Industry Structure, Market Rivalry and Public Policy", Journal of Law and Economics 16, 1-9.
DIAMOND D. (1984). "Financial Intermediation and Delegated Monitoring", Review of Economic Studies 51, 393-414.
DIETSCH M. and LOZANO-VIVAS A. (2000). "How the Environment Determines the Efficiency of Banks: A Comparison between French and Spanish Banking Industry", Journal of Banking and Finance 24, 6, 985--1004.
DIETSCH M. and WEILL L. (2000). "The Evolution of Cost and Profit Efficiency in European Banking", in Research in Banking and Finance (Eds: I. Hasan and W. Hunter), vol.1, JAI Press / Elsevier.
FECHER F. et PESTIEAU P. (1993). "Efficiency and Competition in OECD Financial Services", in The Measurement of Productive Efficiency: Techniques and Applications (Editors: H.Fried, C.A.K. Lovell, P. Schmidt), Oxford University Press, 374-385.
FREIXAS X. and ROCHET J.C. (1997). Microeconomics of Banking, MIT Press. GOLDBERG and RAI (1996): "The Structure-Performance Relationship in European Banking",
Journal of Banking and Finance 20, 745-771. GREENE W.H. (1990). "A Gamma-Distributed Stochastic Frontier Model", Journal of Econometrics
46, 141-163. HANNAN T. (1991). "Bank Commercial Loan Markets and the Role of Market Structure: Evidence
from Surveys of Commercial Lending", Journal of Banking and Finance 15, 133-149. HART O. (1983). "The Market Mechanism As an Incentive Scheme", Bell Journal of Economics l4,
366-382. HICKS J. (1935). "The Theory of Monopoly", Econometrica 3, 1-20.
21
HUIZINGA H., NELISSEN J. and VANDER VENNET R. (2001). "Efficiency Effects of Bank Mergers and Acquisitions in Europe", Tinbergen Institute Discussion Paper TI 2001-088/3.
JANSEN D. and DE HAAN J. (2003). "Increasing Concentration in European Banking: A Macro-Level Analysis". Research Memorandum WO n°743, De Nederlandsche Bank.
JONDROW J., LOVELL C.A.K., MATEROV I. and SCHMIDT P. (1982). "On the Estimation of Technical Inefficiency in the Stochastic Frontier Production Function Model", Journal of Econometrics 19, 233-238.
LANG G. (1996)."Efficiency, Profitability and Competition", IFO Studien 4, 537-561. LEIBENSTEIN H. (1966). "Allocative Efficiency versus X-Efficiency", American Economic Review,
56, 392-415. MARTIN S. (1993). "Endogenous Firm-Efficiency in a Cournot Principal Agent Model", Journal of
Economic Theory, Vol.59, 2, 445-450. MOLYNEUX P., LLOYD-WILLIAMS D.M. and THORNTON J. (1994). "Competitive Conditions in
European Banking", Journal of Banking and Finance 18, 445-459. OECD (2001). Bank Profitability, 1992-1999, Paris. PANZAR J.C. and ROSSE J.N. (1987). "Testing for Monopoly equilibrium". Journal of Industrial
Economics 35, 443-456. PUNT L. and VAN ROOIJ M. (2003). "The Profit-Structure Relationship and Mergers in the European
Banking Industry: An Empirical Assessment ". Kredit und Kapital 36, 1, 1-29. ROSSE J.N. and PANZAR J.C (1977). "Chamberlin vs Robinson: An Empirical Study for Monopoly
Rents". Bell Laboratories Economic Discussion Paper. SCHARFSTEIN D. (1988). "Product-Market Competition and Managerial Slack", Rand Journal of
Economics 19, 147-155. SELTEN R. (1986). "Elementary Theory of Slack-Ridden Imperfect Competition", in New
Developments in the Analysis of Market Structure (Editors: J.E.Stiglitz et G.F. Mathewson), Macmillan, 126-146.
SMITH A. (1776). An Inquiry into the Nature and Causes of the Wealth of Nations, Chicago University Press.
WEILL L. (2002). "Le Rôle de la Relation de Clientèle comme Barrière Stratégique sur les Marchés Bancaires", Revue Economique 2, 53, 201-222.
YAFEH Y. and YOSHA O. (2001). "The Industrial Organization of Financial Systems and the Strategic Use of Relationship Banking", European Finance Review 5, 1-2, 63-78.
22
APPENDIX Table A.1 Estimation of the Rosse-Panzar model for the years 1994, 1995, 1996 Parameter 1994 1995 1996 Coefficient t-value Coefficient t-value Coefficient t-value Intercept -0.10828 -1.50 -0.20132*** -3.45 -0.09449 -1.53 plat 0.33792*** 13.02 0.27037*** 12.13 0.21194*** 9.77 pkat 0.02967 1.43 0.02384 1.22 -0.00518 -0.25 pfat 0.26565*** 6.65 0.32542*** 9.53 0.43498*** 13.18 plbe 0.16614*** 8.80 0.17014*** 9.34 0.18186*** 10.41 pkbe -0.01525 -0.65 0.02048 0.96 0.04853* 1.95 pfbe 0.50794*** 14.35 0.45453*** 13.43 0.45439*** 14.80 pldk 0.32895*** 11.46 0.30065*** 13.34 0.34653*** 14.49 pkdk 0.03328 1.05 0.02637 1.17 0.05013* 1.87 pfdk 0.28212*** 7.80 0.21910*** 7.34 0.19791*** 6.75 plfr 0.20822*** 21.98 0.18752*** 22.85 0.19459*** 22.62 pkfr 0.02221* 1.70 0.04987*** 4.30 0.04369*** 3.38 pffr 0.42243*** 21.33 0.40149*** 25.38 0.40976*** 25.50 plge 0.19746*** 16.32 0.19290*** 18.26 0.21032*** 18.07 pkge 0.01963** 2.05 0.01735** 2.15 0.01701* 1.90 pfge 0.45693*** 20.51 0.41411*** 22.73 0.40533*** 21.49 plgr 0.03229 0.31 0.20556* 1.88 0.13906* 1.78 pkgr -0.04907 -0.54 -0.06770 -0.97 -0.02261 -0.47 pfgr 0.66183*** 3.66 0.30549* 1.67 0.44233*** 3.45 plit 0.19198*** 9.51 0.19893*** 12.16 0.20208*** 12.85 pkit 0.04565*** 2.88 0.02384** 1.99 0.03019** 2.48 pfit 0.43403*** 13.60 0.35788*** 13.96 0.38298*** 14.69 pllu 0.10166*** 8.95 0.05901*** 5.57 0.08842*** 8.22 pklu 0.01320 0.84 0.00213 0.15 0.02189 1.60 pflu 0.60413*** 24.26 0.64325*** 27.69 0.59249*** 27.36 plnl 0.08510** 2.56 0.10724*** 4.35 0.06353** 2.16 pknl -0.02115 -0.54 0.04360 1.26 0.00089481 0.02 pfnl 0.66845*** 11.00 0.56240*** 11.75 0.67097*** 12.73 plpt 0.14283 1.59 0.12294*** 2.85 0.11112** 2.22 pkpt 0.09267 1.56 0.00968 0.24 0.02208 0.54 pfpt 0.49568*** 2.93 0.49962*** 6.99 0.53648*** 6.45 plsp 0.18006*** 9.04 0.17179*** 9.91 0.14822*** 8.69 pksp 0.03556 1.60 0.02510 1.44 0.02831 1.48 pfsp 0.43864*** 13.22 0.40006*** 13.68 0.45091*** 15.29 pluk 0.21751*** 8.37 0.21067*** 11.15 0.23495*** 10.40 pkuk 0.07394*** 2.42 0.06098*** 2.62 0.11140*** 4.10 pfuk 0.43425*** 10.05 0.37916*** 11.44 0.37746*** 10.01 Assets 0.95815*** 115.29 0.95951*** 135.10 0.93504*** 127.56 Eqass 0.02873*** 3.17 0.02253*** 2.91 0.04707*** 5.82 Adjusted R² 0.9952 0.9962 0.9957 (i) The dependent variable is total revenues (ii) *, **, *** denote an estimate significantly different from 0 at the 10%, 5% or 1% level (iii) pl: price of labor, pk price of physical capital, pf price of financial capital, Assets total assets, Eqass of the ratio of equity to total assets. (iv) at: Austria, be: Belgium, dk: Denmark, fr: France, ge: Germany, gr: Greece, it: Italy, lu: Luxembourg, nl: Netherlands, sp: Spain, uk: United Kingdom Ex: plat = price of labor for Austria.
23
Table A.2 Estimation of the Rosse-Panzar model for the years 1997, 1998, 1999 Parameter 1997 1998 1999 Coefficient t-value Coefficient t-value Coefficient t-value Intercept -0.23253*** -3.31 -0.38222*** -5.42 -0.75475*** -10.56 plat 0.26915*** 11.43 0.32419*** 15.35 0.30835*** 14.15 pkat 0.02462 1.24 0.06607*** 3.57 0.04567** 2.45 pfat 0.34153*** 10.28 0.21843*** 7.49 0.19793*** 6.97 plbe 0.22808*** 9.99 0.32336*** 15.39 0.34463*** 15.39 pkbe 0.02458 0.92 0.07767** 2.45 0.04513 1.53 pfbe 0.36696*** 9.75 0.17444*** 5.40 0.09321*** 2.60 pldk 0.38915*** 12.74 0.37422*** 12.18 0.41910*** 14.04 pkdk -0.02176 -0.62 0.00166 0.05 0.01806 0.56 pfdk 0.16136*** 4.56 0.13431*** 3.63 0.04533 1.34 plfr 0.22035*** 19.89 0.19687*** 18.45 0.24714*** 21.24 pkfr 0.02530* 1.63 0.06373*** 3.99 0.01830 1.04 pffr 0.36503*** 19.27 0.35514*** 18.69 0.23991*** 14.13 plge 0.22722*** 17.68 0.23134*** 16.55 0.26822*** 19.22 pkge 0.02735** 2.52 0.03763*** 3.43 0.04468*** 3.81 pfge 0.36943*** 18.28 0.31950*** 14.56 0.22439*** 10.51 plgr 0.14611* 1.62 0.09291* 1.94 0.20205*** 4.17 pkgr -0.03700 -0.48 0.00950 0.09 -0.12894* -1.75 pfgr 0.41499*** 2.93 0.45712*** 5.47 0.21902*** 2.73 plit 0.18753*** 9.93 0.24244*** 14.63 0.28797*** 18.67 pkit 0.03212** 2.12 0.06541*** 4.92 0.07079*** 5.60 pfit 0.41139*** 15.17 0.31219*** 13.99 0.21373*** 12.43 pllu 0.10424*** 7.59 0.12148*** 7.98 0.14900*** 11.07 pklu 0.00671 0.37 0.02100 1.06 0.00763 0.37 pflu 0.54842*** 19.84 0.46271*** 15.55 0.37318*** 14.58 plnl 0.08355** 2.06 0.06990 1.42 0.05302 0.89 pknl -0.00102 -0.02 0.00876 0.15 -0.04256 -0.73 pfnl 0.62287*** 8.89 0.59762*** 6.83 0.55642*** 5.68 plpt 0.21113*** 4.43 0.17454*** 4.48 0.19568*** 5.82 pkpt 0.04120 0.95 -0.02671 -0.74 0.12601*** 3.27 pfpt 0.37152*** 4.93 0.41377*** 7.10 0.31123*** 6.41 plsp 0.24494*** 13.52 0.23419*** 14.43 0.29797*** 16.26 pksp 0.00289 0.13 0.02661 1.24 0.02679 1.28 pfsp 0.32624*** 11.75 0.30462*** 12.54 0.19163*** 8.47 pluk 0.24532*** 11.04 0.26274*** 10.18 0.28569*** 12.81 pkuk 0.12500*** 3.64 0.06802** 2.04 0.01311 0.32 pfuk 0.31553*** 8.20 0.23866*** 5.42 0.14500*** 4.28 Assets 0.94669*** 115.41 0.90679*** 111.60 0.94508*** 113.64 Eqass 0.04012 4.39 0.09128*** 10.17 0.05830*** 6.34 Adjusted R² 0.9941 0.9946 0.9951 (i) The dependent variable is total revenues (ii) *, **, *** denote an estimate significantly different from 0 at the 10%, 5% or 1% level (iii) pl: price of labor, pk price of physical capital, pf price of financial capital, Assets total assets, Eqass of the ratio of equity to total assets. iv) at: Austria, be: Belgium, dk: Denmark, fr: France, ge: Germany, gr: Greece, it: Italy, lu: Luxembourg, nl: Netherlands, sp: Spain, uk: United Kingdom Ex: plat = price of labor for Austria.
24
Table A.3 Mean values of variables by country Country loans inv. assets pl pk pf Revenue Assets AT 1,620,531.5 1,563,791.2 1.40 74.25 4.04 194,871.7 3,337,302.0 BE 4,381,458.6 6,888,099.7 0.99 148.39 4.95 717,225.2 1,1807,060.3 DK 1,023,445.4 1,119,250.3 2.13 77.68 3.22 150,375.4 2,336,481.7 FR 3,010,028.7 3,922,615.5 1.59 150.26 4.39 494,800.0 7,606,241.4 GE 2,531,939.6 2,852,938.4 1.37 103.93 4.14 328,222.3 5,635,532.5 GR 2,131,428.1 3,737,378.2 1.88 87.67 8.88 738,397.2 6,290,092.3 IT 1,980,795.2 1,724,303.4 1.97 93.41 5.39 322,590.4 4,081,932.9 LU 1,093,757.7 3,757,216.6 0.54 147.74 5.24 317,066.1 5,011,209.7 NL 427,312.5 638,316.0 0.60 196.09 5.52 68,528.9 1,097,429.1 PT 3,099,966.3 4,566,583.7 1.11 72.87 5.84 650,119.3 8,509,059.6 SP 2,995,052.7 2,906,426.8 1.57 54.08 4.52 476,584.9 6,397,016.8 UK 985,472.1 1,038,294.1 1.20 252.09 4.78 160,839.1 2,193,893.7
All values are in thousands of dollars, except input prices. inv. assets: investment assets, pl: price of labor, pk price of physical capital, pf price of financial capital. AT: Austria, BE: Belgium, DK: Denmark, FR: France, GE: Germany, GR: Greece, IT: Italy, LU: Luxembourg, NL: Netherlands, SP: Spain, UK: United Kingdom


![COMPETITION AND INNOVATION: AN INVERTED-U RELATIONSHIP* · 2016-01-29 · relationship between competition and innovation was hinted at by Scherer [1967], who showed a positive relationship](https://img.pdfslide.net/doc/110x75/5e995a4499a1c0012f438248/competition-and-innovation-an-inverted-u-relationship-2016-01-29-relationship.jpg)