Embed Size (px)
Citation preview
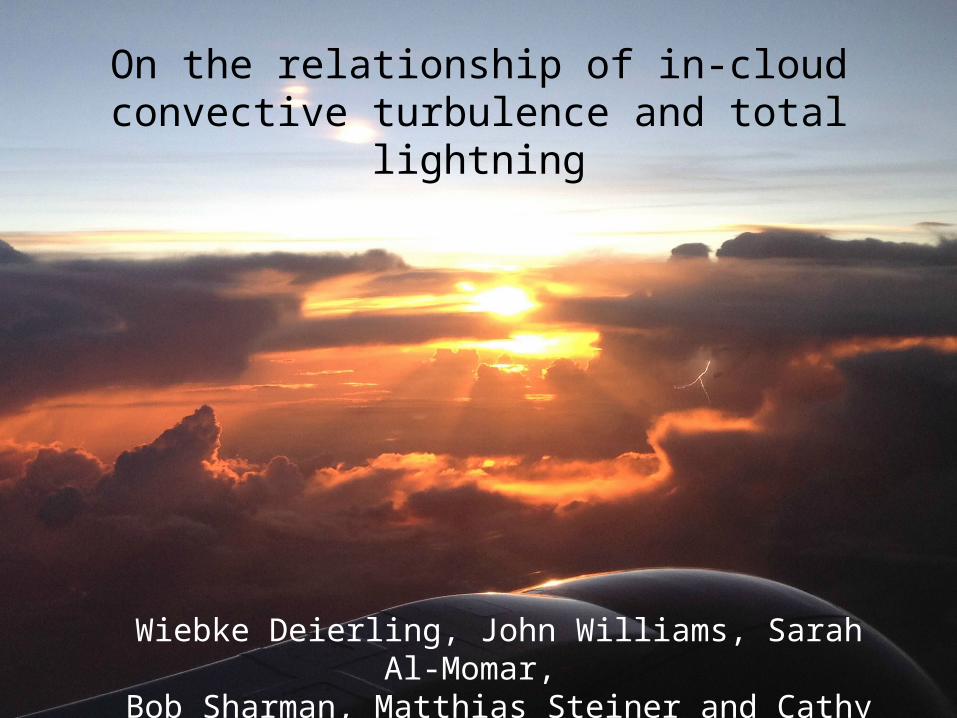
On the relationship of in-cloud convective turbulence and total lightning
Wiebke Deierling, John Williams, Sarah Al-Momar, Bob Sharman, Matthias Steiner and Cathy Kessinger
Our Purpose
• Examine possible relationships between lightning occurrence and turbulence production for different storm types
• Examine relationships over CONUS first because of good data coverage
• Extend examination to oceanic storms in the near future • If successful, GLM on GOES-R may provide valuable
information for underserved regions to help identify regions of convective turbulence
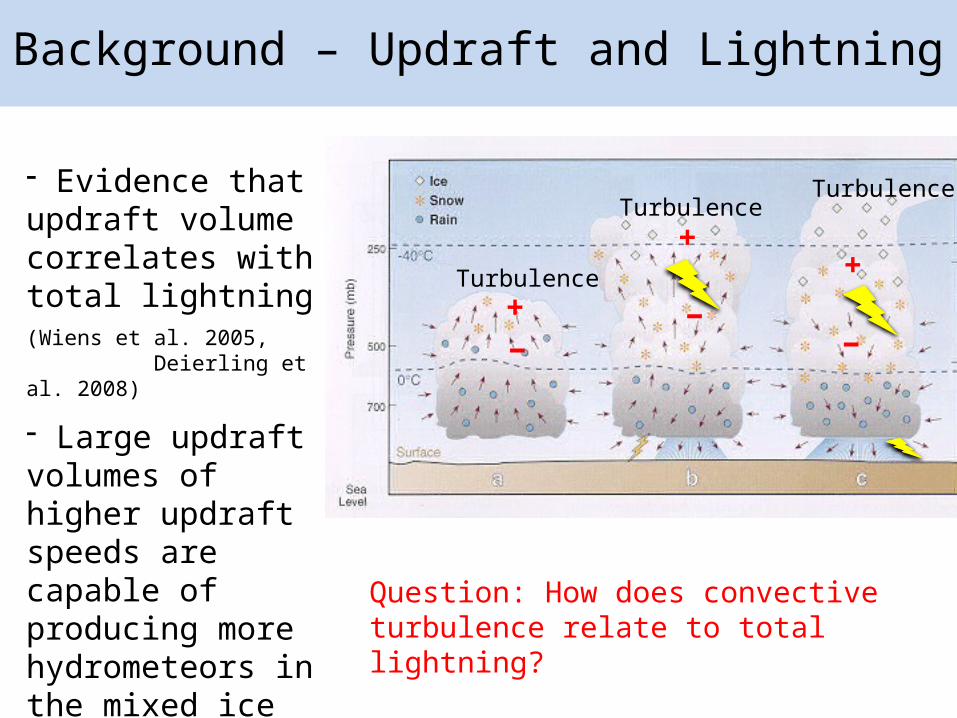
Background – Updraft and Lightning
Reflectivity 5.5 km MSL- Evidence that updraft volume correlates with total lightning (Wiens et al. 2005, Deierling et al. 2008)
- Large updraft volumes of higher updraft speeds are capable of producing more hydrometeors in the mixed ice phase region, promoting electrification
++
+ −−
TurbulenceTurbulence
Turbulence
−
Question: How does convective turbulence relate to total lightning?
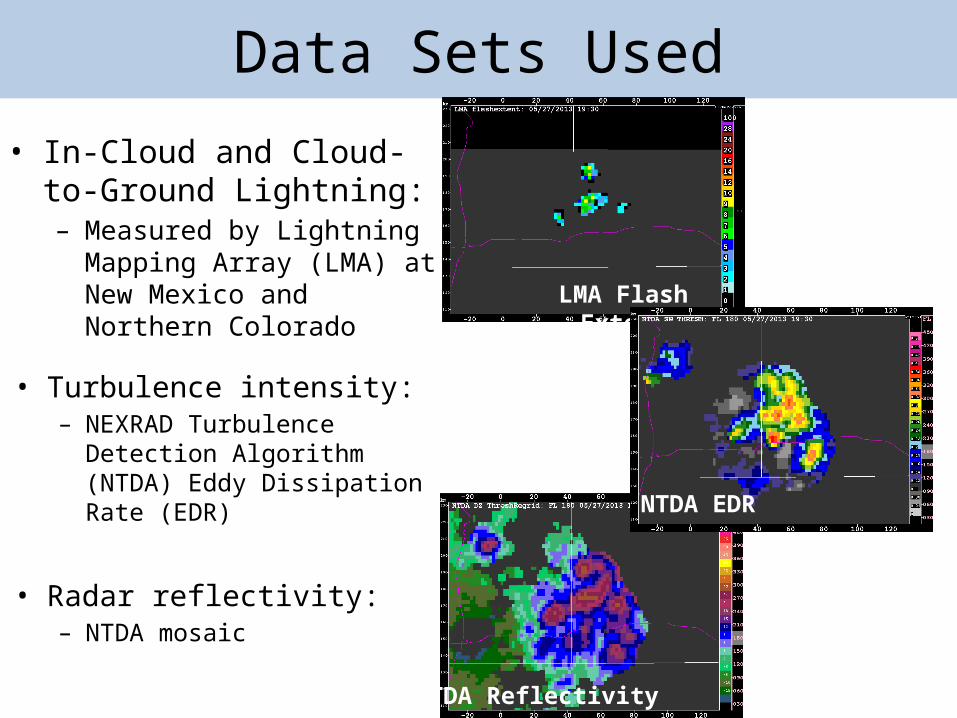
Data Sets Used
• Turbulence intensity:– NEXRAD Turbulence Detection
Algorithm (NTDA) Eddy Dissipation Rate (EDR)
• Radar reflectivity:– NTDA mosaic
NTDA Turbulence
PIDEast-West Distance [km]
Nor
th-S
outh
Dist
ance
[k
m]
Height [km
Hei
ght
[km
Hei
ght
[km
Time [ms]
LMA Detected Lightning• In-Cloud and Cloud-to-Ground
Lightning:– Measured by Lightning Mapping
Array (LMA) at New Mexico and Northern Colorado LMA Flash Extent
NTDA Reflectivity
NTDA EDR
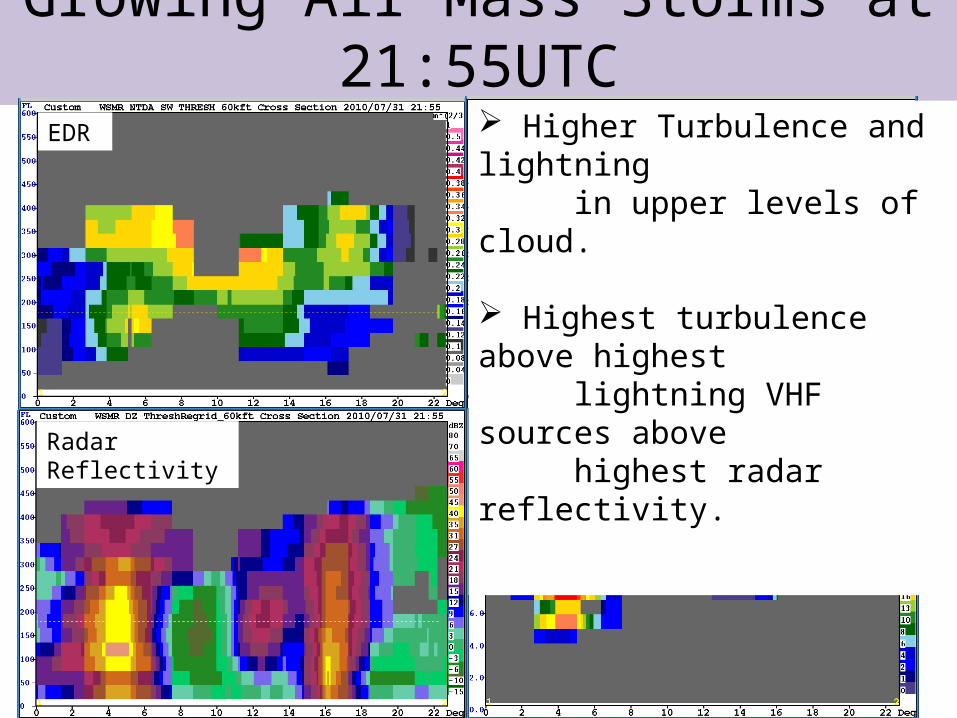
Growing Air Mass Storms at 21:55UTCEDR – light-moderate-severe color scale
EDR
LMA 3D lightningRadar Reflectivity
Higher Turbulence and lightning in upper levels of cloud.
Highest turbulence above highest lightning VHF sources above highest radar reflectivity.
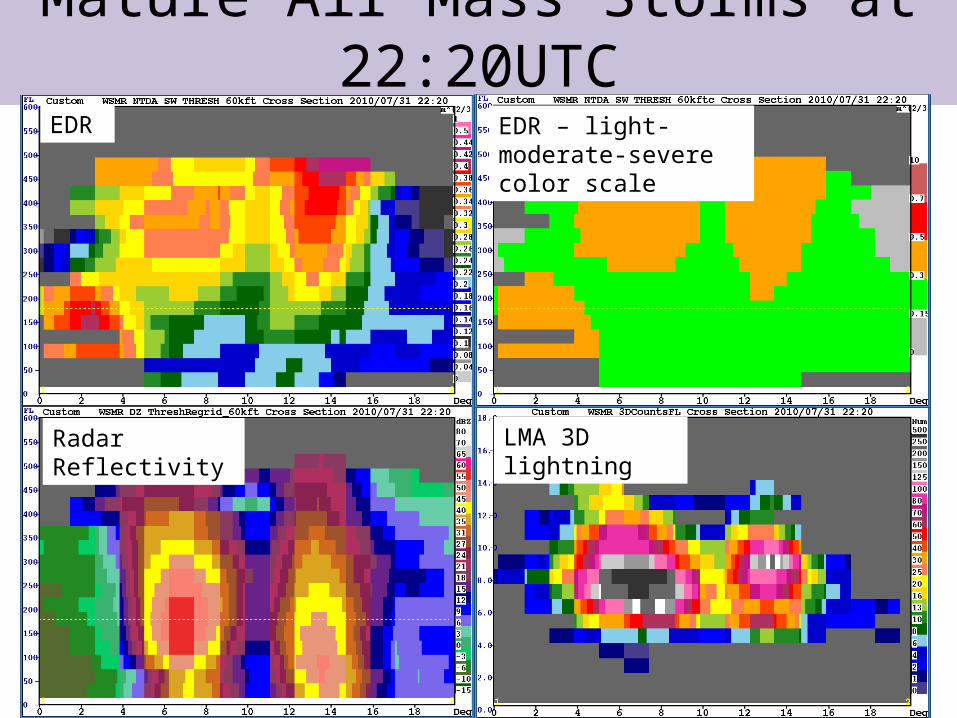
Mature Air Mass Storms at 22:20UTC
Radar Reflectivity
EDR – light-moderate-severe color scale
EDR
LMA 3D lightningRadar Reflectivity
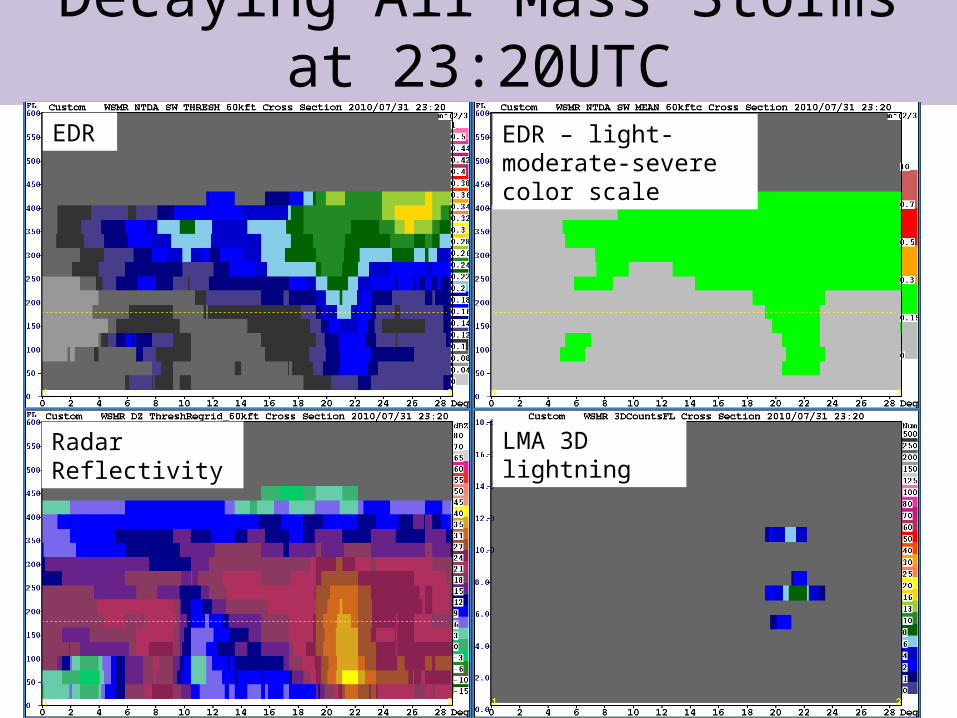
Decaying Air Mass Storms at 23:20UTC
EDR – light-moderate-severe color scale
EDR
LMA 3D lightningRadar Reflectivity
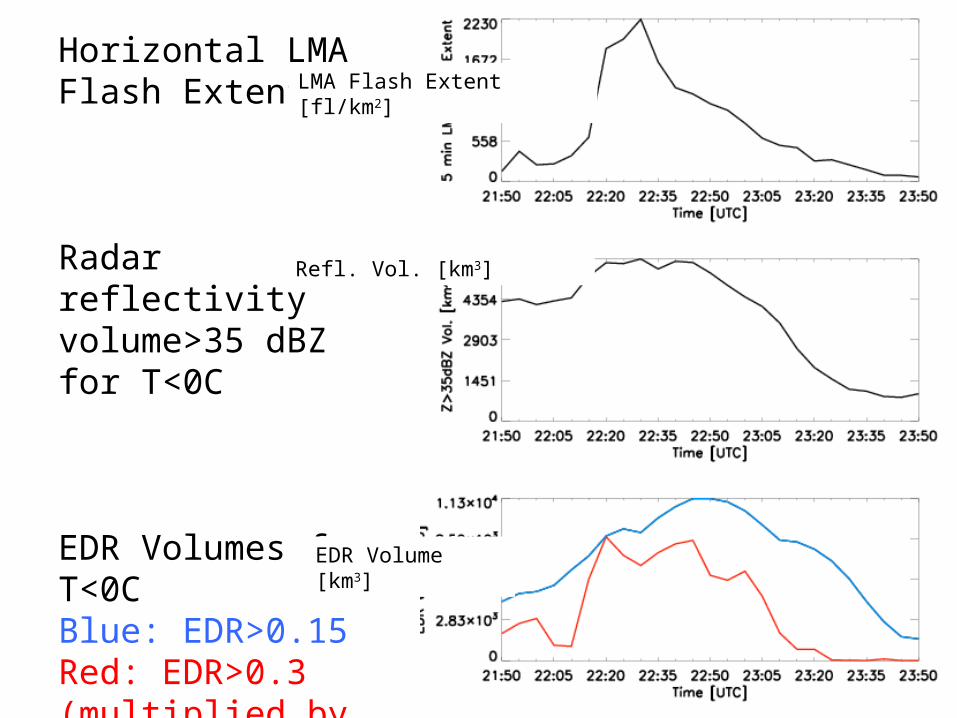
Horizontal LMA Flash Extent
Radar reflectivity volume>35 dBZ for T<0C
EDR Volumes for T<0C Blue: EDR>0.15Red: EDR>0.3 (multiplied by 5) ED
R Vo
lum
e [k
m3 ]
Refl.
Vol
. [km
3 ]LM
A Fl
ash
Exte
nt [fl
/km
2 ]
EDR
Volu
me
of E
DR>
0.3
[km
3 ]
Refl.
Vol
. of Z
>35d
BZ [k
m3 ]
LMA Flash Extent [fl/km2] LMA Flash Extent [fl/km2]
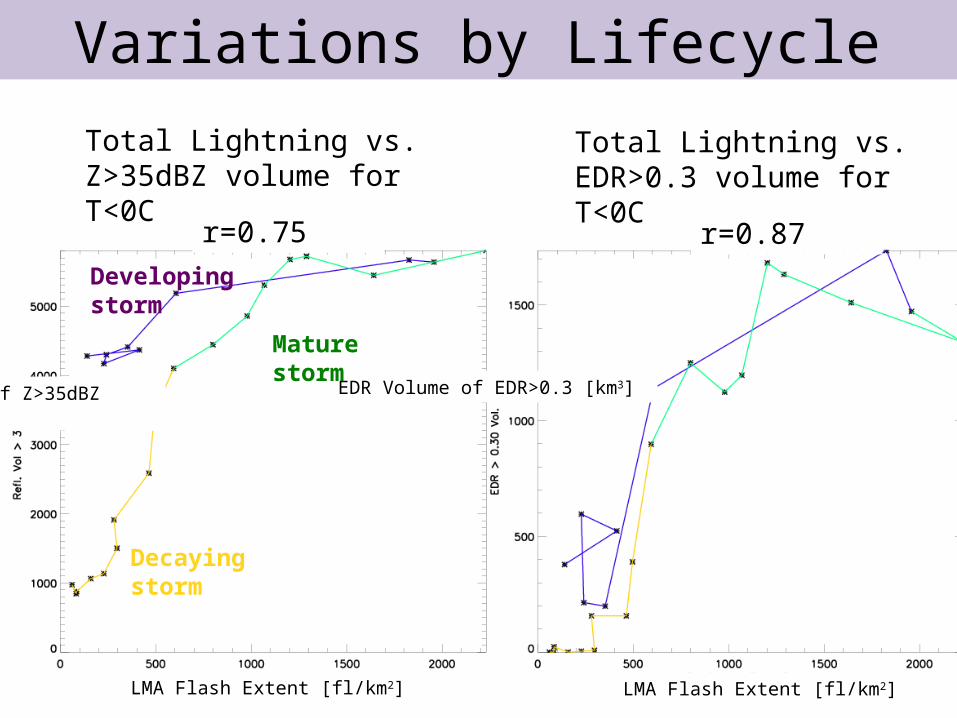
Variations by Lifecycle
Developing storm
Mature storm
Decaying storm
r=0.75 r=0.87
Total Lightning vs. Z>35dBZ volume for T<0C
Total Lightning vs. EDR>0.3 volume for T<0C
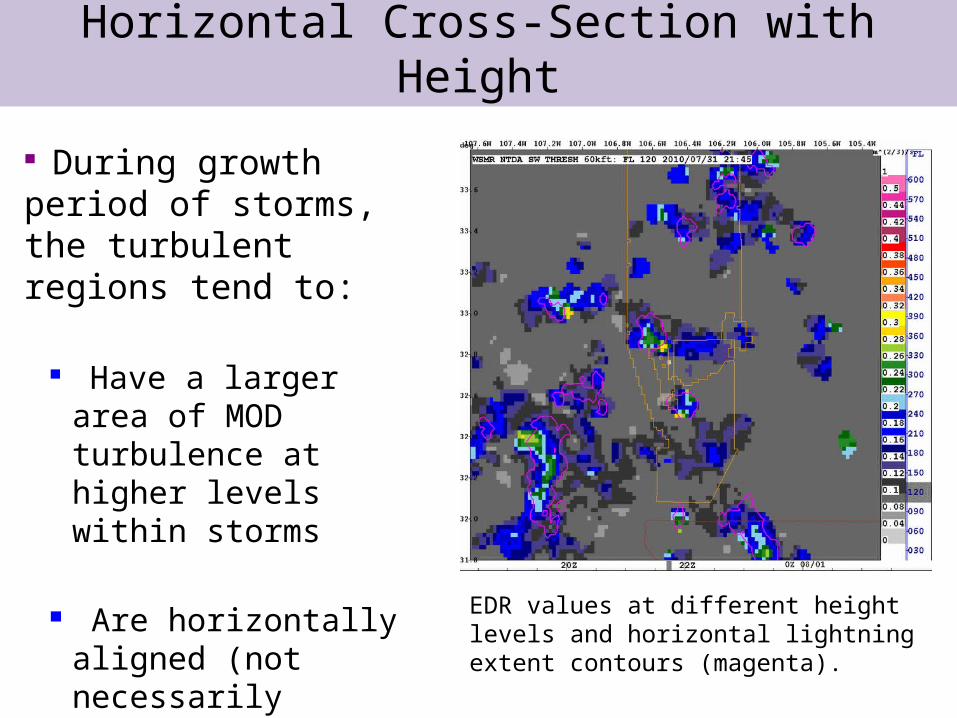
Horizontal Cross-Section with Height
Light
Moderate
Severe
Light
Moderate
Severe
Reflectivity 5.5 km MSL
EDR FL 150 EDR FL 330
Extreme Extreme
EDR values at different height levels and horizontal lightning extent contours (magenta).
During growth period of storms, the turbulent regions tend to:
Have a larger area of MOD turbulence at higher levels within storms
Are horizontally aligned (not necessarily vertically aligned) with lightning regions
5 min Total Lightning
EDR
Volu
me
of E
DR>
0.2
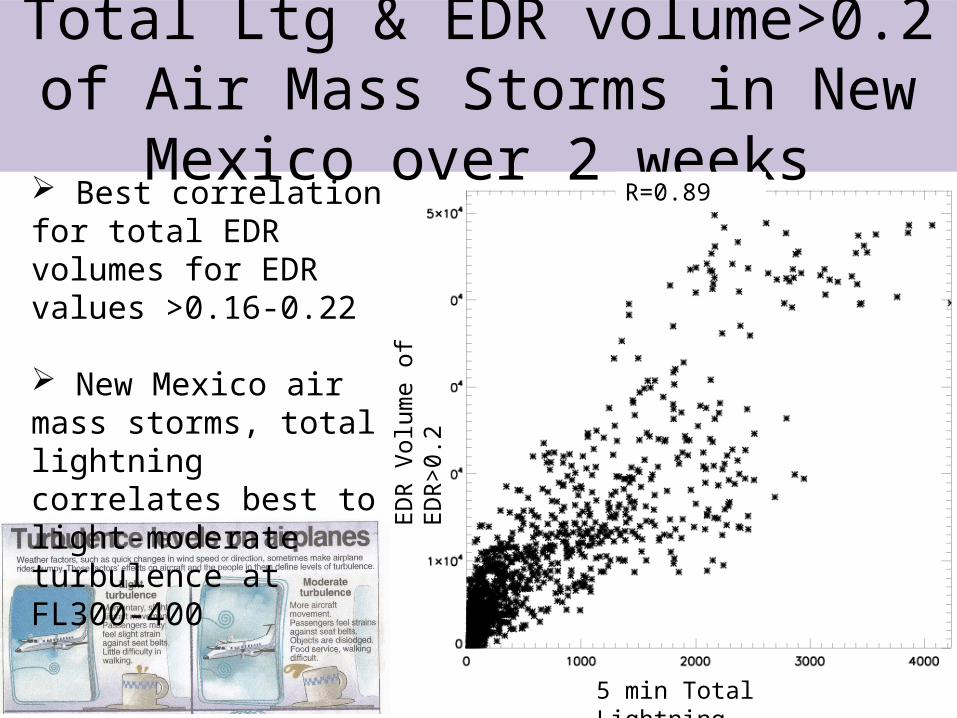
Best correlation for total EDR volumes for EDR values >0.16-0.22
New Mexico air mass storms, total lightning correlates best to light-moderate turbulence at FL300-400
Total Ltg & EDR volume>0.2 of Air Mass Storms in New Mexico over 2 weeks
R=0.89
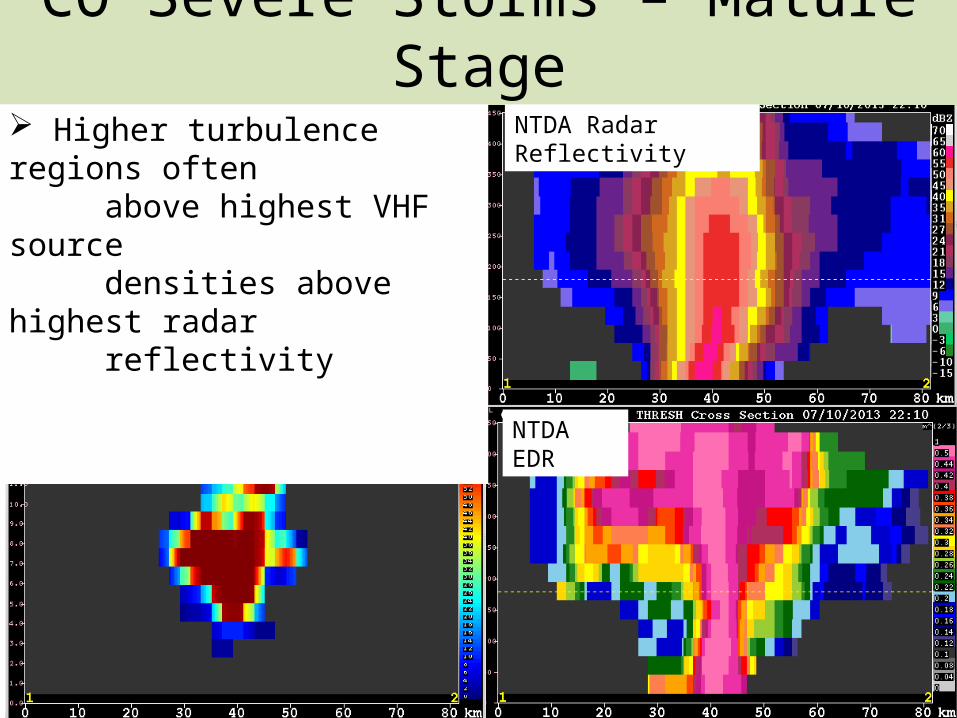
CO Severe Storms – Mature Stage
NTDA EDRLMA 3D lightning
NTDA Radar Reflectivity Higher turbulence regions often above highest VHF source densities above highest radar reflectivity
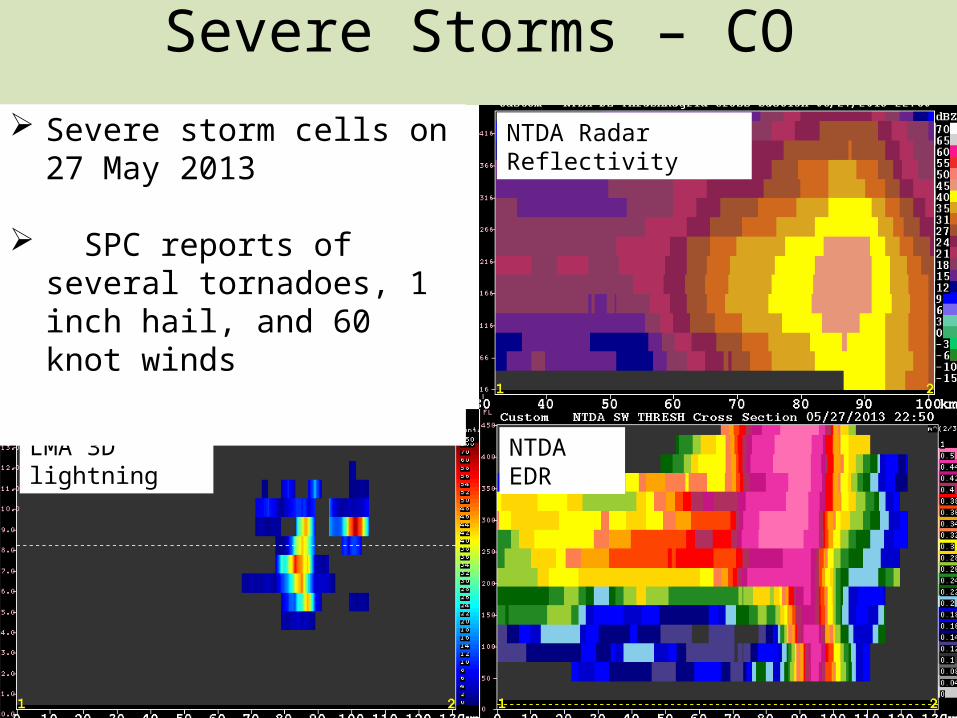
Severe Storms – CO
NTDA EDRLMA 3D lightning
NTDA Radar Reflectivity Severe storm cells on 27 May 2013
SPC reports of several tornadoes, 1 inch hail, and 60 knot winds
VHF sources 35 dBZ Refl.
EDR>0.15 EDR>0.3
EDR>0.4EDR>0.3EDR>0.15
EDR
Volu
me
[km
3 ]
Time [UTC]
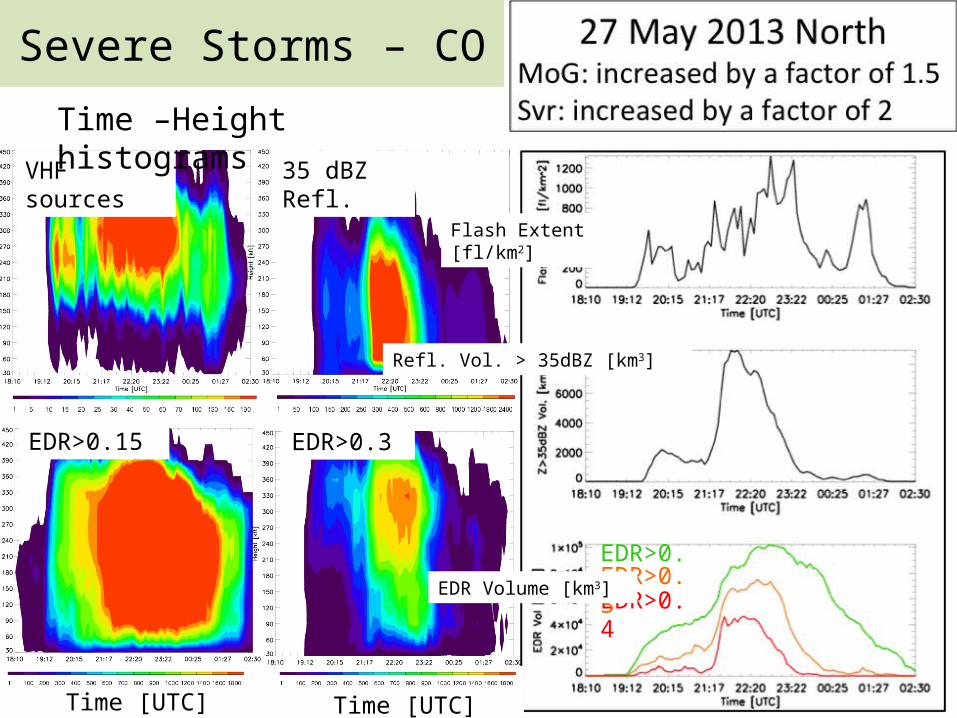
Severe Storms – COTime –Height histograms
Time [UTC]
Refl.
Vol
. > 3
5dBZ
[km
3 ]Fl
ash
Exte
nt [fl
/km
2 ]
Higher lightning frequencies relate to higher turbulence intensities
Most storms exhibited charge centers in between the maximum reflectivity cores and peak turbulence during a storms mature stage
Regions of higher EDR are horizontally collocated with higher flash extents for air mass storms
EDR and lightning relationship looks promising for air mass storms but more complicated for severe storms, needs more investigation
Look at more storm types, including oceanic storms Compare with modeling studies
Summary & Outlook
Thank you!