Embed Size (px)
Citation preview
Aerospace Science and Technology, 1998, no. I, 425-437
On the validation of high enthalpy wind tunnel tsinmlations
P. Sagnier*, J.-L. V&ant
Fundamental and Applied Energetics Department, ONERA, Chgtillon, France
(Received 19 February 1997, accepted 15 December 1997)
Sagnier P., V&ant J.-L., Aerospace Science and Technology, 1998, no. 7, 425437.
Abstract In the frame of the Ground-to-Flight Transposition methodology for reentry vehicles, Europe has built high enthalpy facilities, the ONERA hot shot wind tunnel F4 and the DLR piston driven shock tube wind tunnel HEG. Both facilities can provide flows at high velocity (5 to 6 km/s) and at high reservoir pressure (several hundreds atmospheres). These facilities are operational since a few years. Despite technological difficulties attached to high thermal loads, they have allowed to study topics of great importance in hypersonics, such as the influence of real gas (i.e. high temperature gas with thermochemistry) on flare- induced boundary layer separation. After discussing on the Ground-to-Flight Transposition methodology in hypersonics, the F4 wind tunnel is presented. Finally, the problem of the validation of high enthalpy wind tunnel experiments is discussed through the analysis of typical experimental results and of the related rebuilding computations. 0 Elsevier, Paris
ONERA F4 wind tunnel / hiah enthalpy / shock tube / hypersonics / real gas thermochemistry / 0 wind tunnel simulation
Nomenclature
CP = pressure coefficient = (P - P,)/(O.5p,VL) Hi = reservoir enthalpy HW = enthalpy at wall conditions L = length of the Hyperboldid-flare model
(0.111 m in F4, 0.059 m in RSCh) L =P boundary layer separation length,
measured upstream of the hinge line MCU = free stream Mach number P = static pressure pi = reservoir pressure P,! = pitot pressure PO3 = free stream static pressure
%
= heat flux norm = normalized heat flux, see eq. (1) stag = stagnation point heat flux
* Correspondence and reprints
Aerospace Science and Technology, 1270-9638, 98/07/O Elsevier, Paris
R = perfect gas constant (288.2 J/Kg/K for air) Re,L = free stream Reynolds number for length L R nose = nose radius RP = = Rarefaction Parameter
s
t T TV To VCO X
Y Pm
= Mco/(Re,L)0.5 = curvilinear abscissa (s/R = curvilinear
abscissa divided by nose radius) = time = translational temperature = vibrational temperature = reference temperature (273.15 K) = free stream velocity = Cartesian abscissa = isentropic expansion exponent = free stream density
426 P. S@er, J.-L. V&ant
1. Introduction
Since the 1960s the constantly increasing power of computers has largely influenced the research in fluid dynamics. The improvement of algorithms and the high computational speed allow to predict the aerodynamic characteristics of complex vehicles. It can be said that, in a next future, laminar perfect gas flows will be reasonably predicted by numerical simulation. But none vehicle, from low speed to hypersonic regimes, actually flies under these conditions. In the atmosphere, perfect gas flows always present turbulent zones and pure laminar flows are encountered only around reentry vehicles at high altitude, then with the presence of real gas effects. These real-life flows are significantly more complicated than laminar perfect gas flows. Therefore, it is not possible to rely on numerics only, and the validation of computations from wind tunnel or flight experiments is still mandatory. At the same time, the experimental results must be validated too, i.e. must be accurate and free of undesirable effects (e.g. 3D effects if considering 2D flows, approximate knowledge of free stream conditions,...). Before going further into validation problems, let us examine the Ground-to- Flight Transposition methodology. Let us assume we are interested on some aerodynamic coefficient of a reentry vehicle. Figure I shows the evolution of this coefficient versus the vehicle velocity (this coefficient is symbolic and does not exist). In the transsonic regime, similarity parameters do exist, then wind tunnel prediction can be done at flight conditions (cryogenic wind tunnels) and computational prediction is less accurate than wind tunnel prediction, due to phenomena still difficult to model, such as transition/turbulence or shock wave boundary layer interaction. At hypersonic speeds, partial similarities only can link flight and wind tunnel, because of the
different scalings to be duplicated simultaneously. Wind tunnels cannot reproduce the high velocities of early reentry either (5 to 6 km/s are possible in wind tunnels with the present technology compared to 7 km/s or more at reentry). Computational predictions cannot be very accurate due to the large uncertainties attached to high temperature flow physical modellings.
Then, for high velocity flight, in the absence of flight test results, the only way for an efficient Ground-to- Flight Transposition is to compute the experimental cases, which were obtained at wind tunnel conditions as close as possible to flight conditions. If, at these wind tunnel conditions, experiment and computation agree fairly, then the flight point computation can be reasonably trusted. Such methodology needs also to trust experimental results. The uncertainties displayed in jigwe I imply that safety margins are generally considered in the vehicle design. Nevertheless if such margins can be relatively large (US Space Shuttle), reducing them with the help of accurate predictions is a valuable task anyway, yielding improved vehicle performances and reduced cost. Both experimental and numerical sides will contribute to the prediction accuracy. On the experimental side, firstly, the measurement accuracy itself must be as good as possible, meaning that the experimental techniques and the data reduction methods must be well suited to the wind tunnel environment. Secondly, the test conditions must be known as well as possible, in order to provide valuable entry conditions for the rebuilding computations. In high enthalpy wind tunnels, this is not as easy as in low enthalpy (perfect gas) wind tunnels because of the large number of parameters to be known simultaneously (such as free stream density, velocity, chemical composition, vibrational temperatures). When all the parameters cannot be measured simultaneously (this is generally the case), the missing parameters must be deduced
FLIGHT I
COEFFICIENT A
Wind tunnel possible domain 1 ~-------------- I
WT similitude with flight m!&Q&j&
TRANSSONIC HYPERSONIC
Figure 1. principle of ground-to-flight transposition.
Aerospace Science and Technology
On the validation of high enthalpy wind tunnel simulations 427
by making some assumptions on the wind tunnel flow thermochemical state (e.g. in the chapter “Experiments and validation”). A systematic crosschecking of the measurement techniques must be applied, especially in high enthalpy impulse facilities where short duration and high energy make difficult measurements that are routine in conventional wind tunnels. On the numerical side, sensitivity studies must be performed either on the numerical parameters (schemes, grid density) or on the physical models (thermochemical kinetics, transport parameters) in order to achieve the best accuracy and to determine the modelling relevance. For example, questions as the following ones must be answered: can the same thermochemical set be used for the wind tunnel case and for the flight computation, considering that the higher stagnation conditions in flight can yield additional physical phenomena not present in wind tunnel? How a flight-relevant thermochemical model can be validated by mean of wind tunnel experimentation? The experimental and numerical results presented herein are a contribution in answering these questions.
This paper focuses on the validation of high enthalpy testing in the ONERA F4 high enthalpy wind tunnel. F4 will be shortly described first. Then the validation problems of the wind tunnel and of the experiments will be discussed with the help of typical experimental examples, in a non exhaustive manner since neither all test campaigns nor all measurement techniques can be addressed in a short expose, particularly concerning spectroscopic results.
2. The ONERA F4 hot shot wind tunnel
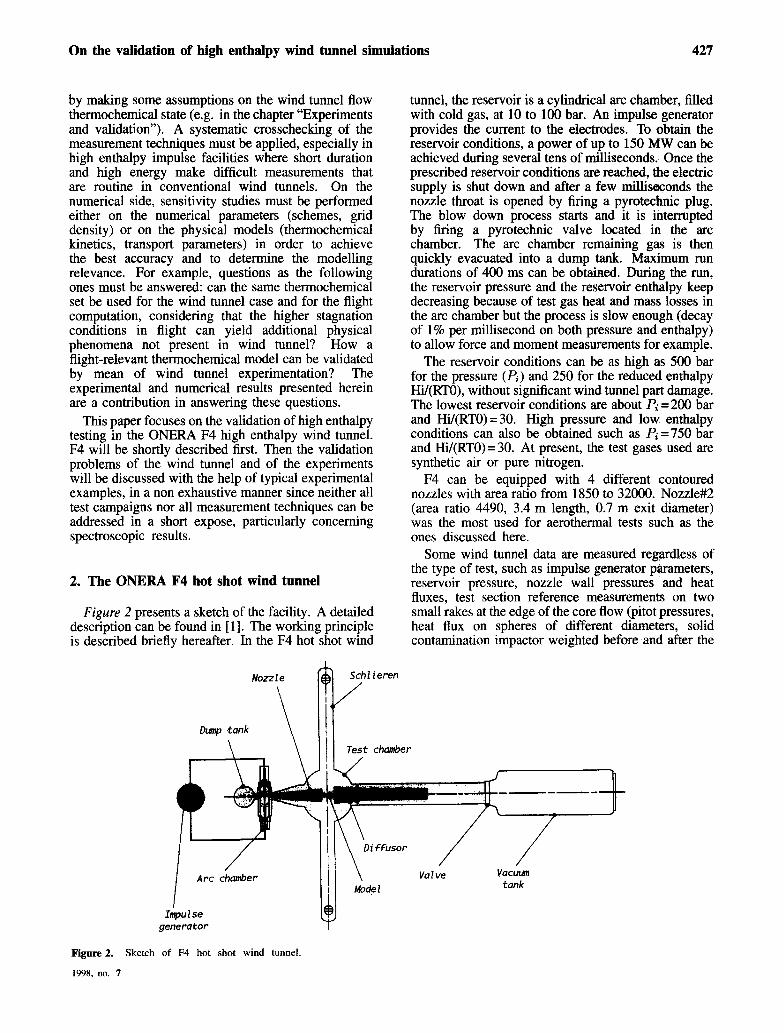
Figure 2 presents a sketch of the facility. A detailed description can be found in [ 11. The working principle is described briefly hereafter. In the F4 hot shot wind
Figure 2. Sketch
1998, no. 7
Dump tank
tunnel, the reservoir is a cylindrical arc chamber, filled with cold gas, at 10 to 100 bar. An impulse generator provides the current to the electrodes. To obtain the reservoir conditions, a power of up to 150 MW can be achieved during several tens of milliseconds. Once the prescribed reservoir conditions are reached, the electric supply is shut down and after a few milliseconds the nozzle throat is opened by firing a pyrotechnic plug. The blow down process starts and it is interrupted by firing a pyrotechnic valve located in the arc chamber. The arc chamber remaining gas is then quickly evacuated into a dump tank. Maximum run durations of 400 ms can be obtained. During the run, the reservoir pressure and the reservoir enthalpy keep decreasing because of test gas heat and mass losses in the arc chamber but the process is slow enough (decay of 1% per millisecond on both pressure and enthalpy) to allow force and moment measurements for example.
The reservoir conditions can be as high as 500 bar for the pressure (Pi) and 250 for the reduced enthalpy Hi/(RTO), without significant wind tunnel part damage. The lowest reservoir conditions are about Pi = 200 bar and Hi/(RTO)=30. High pressure and low enthalpy conditions can also be obtained such as Pi = 750 bar and Hi/(RTO)=30. At present, the test gases used are synthetic air or pure nitrogen.
F4 can be equipped with 4 different contoured nozzles with area ratio from 1850 to 32000. Nozzle#2 (area ratio 4490, 3.4 m length, 0.7 m exit diameter) was the most used for aerothermal tests such as the ones discussed here.
Some wind tunnel data are measured regardless of the type of test, such as impulse generator parameters, reservoir pressure, nozzle wall pressures and heat fluxes, test section reference measurements on two small rakes at the edge of the core flow (pitot pressures, heat flux on spheres of different diameters, solid contamination impactor weighted before and after the
Jest chmber
generator
of F4 hot shot wind tunnel.
P. Sag&r, J.-L. V&ant
run), schlieren visualisations either one view/run or high speed cinema (3000 images/s).
Other measurement techniques are used depending on the type of test, such as force and moment measurements with six-components balance and inertia compensation, model pressure and heat transfer, infrared thermography either with the scanning line technique (2500 Hz) or with the 2D high rate ONERA camera (400 Hz), emission spectroscopy, absorption spectroscopy and velocity measurement (Doppler effect) with the Diode Laser infrared Absorption Spectroscopy (DLAS) technique (on NO and H20 species), Electron Beam Fluorescence (EBF) spectroscopy technique (on NO and N2 species) and EBF time-of-flight velocimetry technique. DLAS and EBF are well documented in [24]. For calibration tests, a large cross rake equipped with pitot pressure probes and several types of beat flux probes can be employed.
Expected outcome using these techniques is to determine the free stream and the model flow properties as accurately as possible, for result normalization and for rebuilding computations input conditions, and, in particular, to allow the design of new thermochemical modellings as it will appear necessary from results shown further on.
3. Expwinmnts and valid&ion
Before validating the experiments on models, the wind tunnel flow itself must be validated in terms of reservoir conditions and test section free stream characteristics. This wind tunnel flow validation is summarized hereafter.
3.1. DetermiWiou of the wind tunnel flow condmns
where all variables are in SI units. Exponent and constant in this equation were obtained with a least- square fitting of the numerical heat fluxes. It was demonstrated [8] that for perfect gas, the Fay- Riddell formula can be simplified to the same form. Similar correlations to eq. (1) were proposed in the USA for flight results [8, 91. Note that eq. (1) implies no knowledge of the free stream properties, which are a source of uncertainty in high enthalpy conditions. Furthermore, this correlation can be also employed to normalize heat transfer distribution over models [7] at least as well as the scheme proposed by Miller [lo]. Using eq. (1), the F4 total enthalpy is monitored in situ by two heat transfer spherical probes of 30 and 15 mm diameter located at the nozzle exit. The uncertainty on spherical probe enthalpy determination is about f20% when summing experimental and correlation uncertainties. The spherical probes surface temperature-to-heat flux data reduction takes into account the 2D conduction effect, assuming a surface heat flux distribution from Lees [ll], and temperature effect on wall thermal properties [12]. Without entering into the details, the relevance of this methodology used to determine the reservoir enthalpy has been demonstrated by recent comparisons with velocity measurements with the DLAS Doppler-effect technique and the EBF time- of-flight technique [ 13-161.
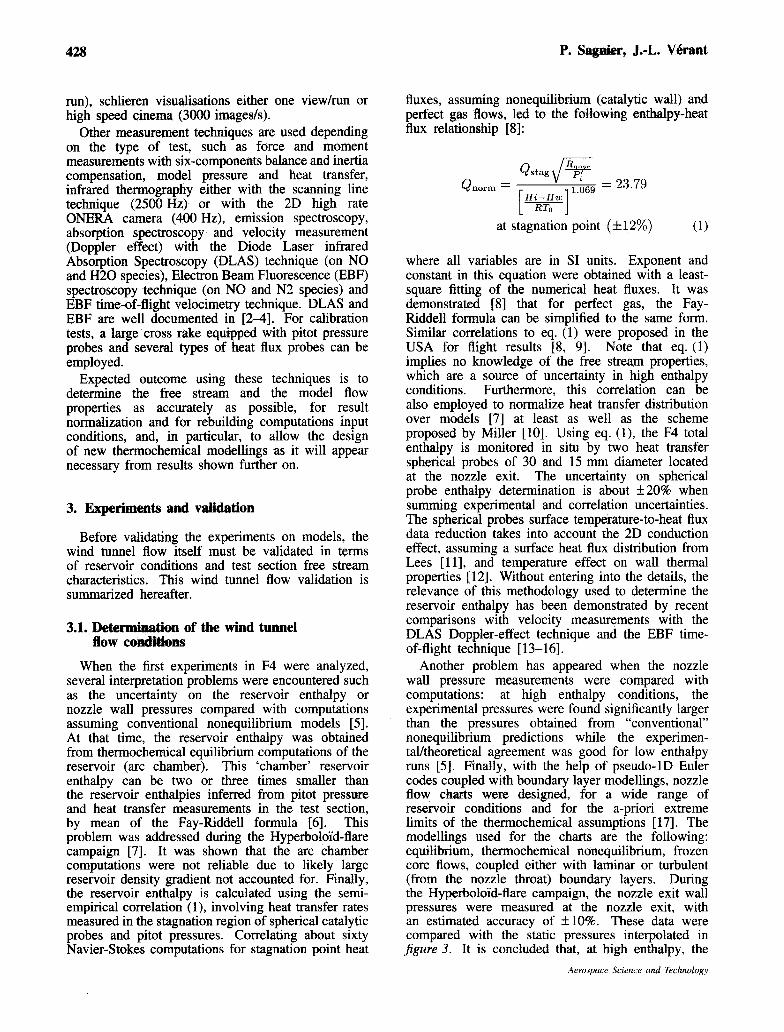
When the first experiments in F4 were analyzed, Another problem has appeared when the nozzle several interpretation problems were encountered such wall pressure measurements were compared with as the uncertainty on the reservoir enthalpy or computations: at high enthalpy conditions, the nozzle wall pressures compared with computations experimental pressures were found significantly larger assuming conventional nonequilibrium models [5]. than the pressures obtained from “conventional” At that time, the reservoir enthalpy was obtained nonequilibrium predictions while the experimen- from thermochemical equilibrium computations of the tal/theoretical agreement was good for low enthalpy reservoir (arc chamber). This ‘chamber’ reservoir runs [5]. Finally, with the help of pseudo-1D Euler enthalpy can be two or three times smaller than codes coupled with boundary layer modellings, nozzle the reservoir enthalpies inferred from pitot pressure flow charts were designed, for a wide range of and heat transfer measurements in the test section, reservoir conditions and for the a-priori extreme by mean of the Fay-Riddell formula [6]. This limits of the thermochemical assumptions [ 171. The problem was addressed during the Hyperboldid-flare modellings used for the charts are the following: campaign [7]. It was shown that the arc chamber equilibrium, thermochemical nonequilibrium, frozen computations were not reliable due to likely large core flows, coupled either with larninar or turbulent reservoir density gradient not accounted for. Finally, (from the nozzle throat) boundary layers. During the reservoir enthalpy is calculated using the semi- the Hyperboloid-flare campaign, the nozzle exit wall empirical correlation (l), involving heat transfer rates pressures were measured at the nozzle exit, with measured in the stagnation region of spherical catalytic an estimated accuracy of f 10%. These data were probes and pitot pressures. Correlating about sixty compared with the static pressures interpolated in Navier-Stokes computations for stagnation point heat figure 3. It is concluded that, at high enthalpy, the
fluxes, assuming nonequilibrium (catalytic wall) and perfect gas flows, led to the following enthalpy-heat flux relationship [ 81:
Q
at stagnation point (&12%) (1)
Aerospace Science and Technology
On the validation of high enthalpy wind tunnel simulations 429
nozzle exit pressure is close to the value in equilibrium flow [7], [18], with a nozzle boundary layer switching from turbulent to larninar as the reservoir enthalpy increases, according to the corresponding decrease in Reynolds number. Even accounting for a reservoir enthalpy uncertainty of f 30% the conclusion reached from the analysis of figure 3 is not modified. The Electre campaign analysis [9] has validated the relevance of nozzle wall pressure measurements and has allowed the same conclusion on the static pressure behavior [20], as shown hereafter.
3.2. Validation of the wind tunnel flow on Electre
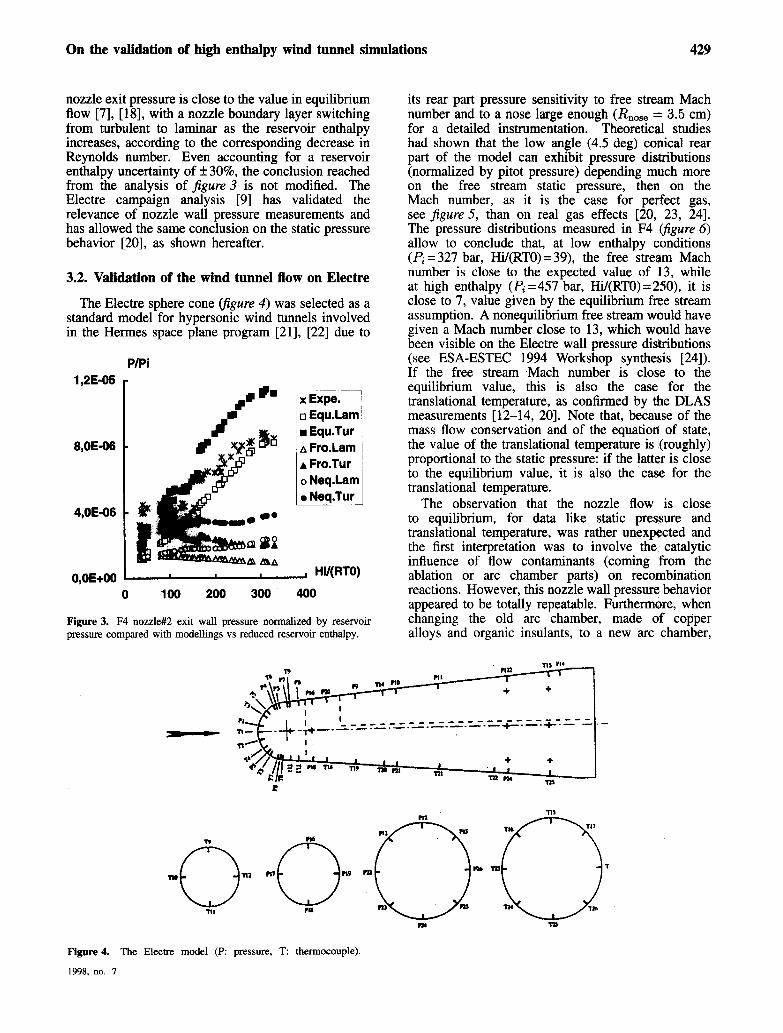
The Electre sphere cone (figure 4) was selected as a standard model for hypersonic wind tunnels involved in the Hermes space plane program [21], [22] due to
P/Pi 1.2E-05 I-
am MBA
, HU(RT0)
Figure 3. F4 nozzle#k2 exit wall pressure normalized by reservoir pressure compared with modellings vs reduced reservoir enthalpy.
its rear part pressure sensitivity to free stream Mach number and to a nose large enough (R,,, = 3.5 cm) for a detailed instrumentation. Theoretical studies had shown that the low angle (4.5 deg) conical rear part of the model can exhibit pressure distributions (normalized by pitot pressure) depending much more on the free stream static pressure, then on the Mach number, as it is the case for perfect gas, see figure 5, than on real gas effects [20, 23, 241. The pressure distributions measured in F4 (figure 6) allow to conclude that, at low enthalpy conditions (P; =327 bar, Hi/(RTO)= 39) the free stream Mach number is close to the expected value of 13, while at high enthalpy (P; =457 bar, Hi/(RTO)=250), it is close to 7, value given by the equilibrium free stream assumption. A nonequilibrium free stream would have given a Mach number close to 13, which would have been visible on the Electre wall pressure distributions (see ESA-ESTEC 1994 Workshop synthesis [24]). If the free stream -Mach number is close to the equilibrium value, this is also the case for the translational temperature, as confirmed by the DLAS measurements [ 12-14, 201. Note that, because of the mass flow conservation and of the equation of state, the value of the translational temperature is (roughly) proportional to the static pressure: if the latter is close to the equilibrium value, it is also the case for the translational temperature.
The observation that the nozzle flow is close to equilibrium, for data like static pressure and translational temperature, was rather unexpected and the first interpretation was to involve the catalytic influence of flow contaminants (coming from the ablation or arc chamber parts) on recombination reactions. However, this nozzle wall pressure behavior appeared to be totally repeatable. Furthermore, when changing the old arc chamber, made of copper alloys and organic insulants, to a new arc chamber,
Figure 4. The Electre model (P: pressure, T: thermocouple).
1998, no. I
430 P. Sag&x-, J.-L. V&ant
F---NswMf: /--MSPtJMiO/ I- NS PO Ml3 ~
0,Ol 1 1
0 2 4 6 6 10 sm 12
Figure 5. Electre wall pressure distributions normalized by pitot pressure given by Navier-Stokes perfect gas (NS PC) computations in function of the free stream Mach number (7, 10 and 13).
made of graphite and carbon-carbon parts, yielding a dramatic improvement on flow contamination [ 13, 161, the nozzle wall pressures still remain close to equilibrium values. So the idea arised that this equilibrium proximity is an effect caused by the physics of flow expansion and it is not linked to flow contamination quenching. When investigating in past research, it appears that F4 (as well as HEG) performances are quite unique in the wind tunnel world. We have not found yet in the literature detailed experimental data at such high reservoir pressures and reservoir enthalpies for high area ratio nozzles.The nozzle real gas flow experiments studied by Park and Lee [25] to validate thermochemical models exhibit much lower reservoir conditions than the present ones and/or concern nozzles with small
P/PI 1
~ + Run610227b26
-NS PG (HOMAR) k-=43 I
o Run 670 457b260
- - CzEgOE;NASCE 467b260 qu.frW
0,Ol u
0 2 4 6 6 10 sm 12
Fire 6. Comparison of Electre wall pressure distributions normal- ized by pitot pressure between cold (Pi =327 bar, Hii(RT0) = 39) and hot (P; = 457 bar, Hii(RT0) = 250) experiments with perfect gas iI4, = 13 and nonequilibrium (with equilibrium free stream, A&, = 7) Navier-Stokes computations.
aera ratio. It seems that such expanding flows at high reservoir conditions have been much less studied than compressed tlows behing shock waves, from which most of the thermochemical kinetics used for high temperature air have been derived. As it was discussed during recent Workshops [26, 271, such accelerated relaxation in nozzle flows could be linked with vibration-dissociation-recombination couplings. These couplings can speed up chemical reaction kinetics when vibrational temperatures are significantly higher than translational temperature [28, 291, as it is the case for wind tunnel nozzle flows. Dissociating a molecule will ease the colliding partner to bring energy if the molecule is already in a high vibrational state. At the inverse, recombining two atoms (that can be electronically excited) into a highly vibrating molecule will need the colliding partner to evacuate less energy than if the molecule recombines at a low vibrational state, and then the recombination rate is faster than for a recombination of atoms to a molecule vibrating at the ground state (high energy jump). Coupling simulations by using a simplified approach, like Park’s coupling for dissociation reactions [30], in which a geometric average of the translational and vibrational temperatures (2’ Z’V)~.~ is used to compute forward and backward chemical rates (see details in [13, 15]), effectively yield the nozzle static pressure and translational temperature distributions close to equilibrium values [13-l& 261. In F4, the use of the Coherent Anti-Stokes Raman Scattering (CARS 1321) technique and of EBF spectroscopy is planned in the next future in order to obtain enough data (in particular N2 concentrations and temperatures) to design a relevant thermochemical model. Considering HEG, there are not enough experimental results to conclude on the nozzle flow thermochemistry. However, the analysis of Electre pressure distributions measured in HEG seems to indicate that the actual free stream Mach number could be smaller than given by conventional non-equilibrium free stream assumption [23, 241.
So, the analysis of nozzle flow experimental results allows the conclusion that F4 test section static pressure and translational temperature are close to equilibrium values at high enthalpy. Presently, the thermochemical equilibrium assumption is used for test data reduction in F4. A full thermochemical equilibrium flow does not correspond to the exact nozzle flow description, as indicated by the relatively large concentration of nitric oxide NO given by the DLAS technique [12-14, 203. A better candidate could be a nonequilibrium flow driven by vibration-dissociation-recombination coupling, as already discussed. In this case, the test section flow will present still some vibrational nonequilibrium [14, 151. But, only new test campaigns with adapted optical diagnostics would allow to select the right modelling, in particular, vibrational temperatures will be attempted to be measured during further tests with the EBF and CARS techniques, as mentioned
Aerospace Science and Technology
On the validation of high enthalpy wind tunnel simulations 431
before. At the moment, we wonder if assuming a full thermochemical equilibrium (FKE) is enough for validation of test section conditions, keeping in mind that no more than 10% of the reservoir enthalpy can
be stored in species in high nonequilibrium vibrational state. We have seen that FACE has given a correct description of pressure distributions over the Electre model [23, 241. More complicated flowfields can
QRAF’HI’IE INSERT
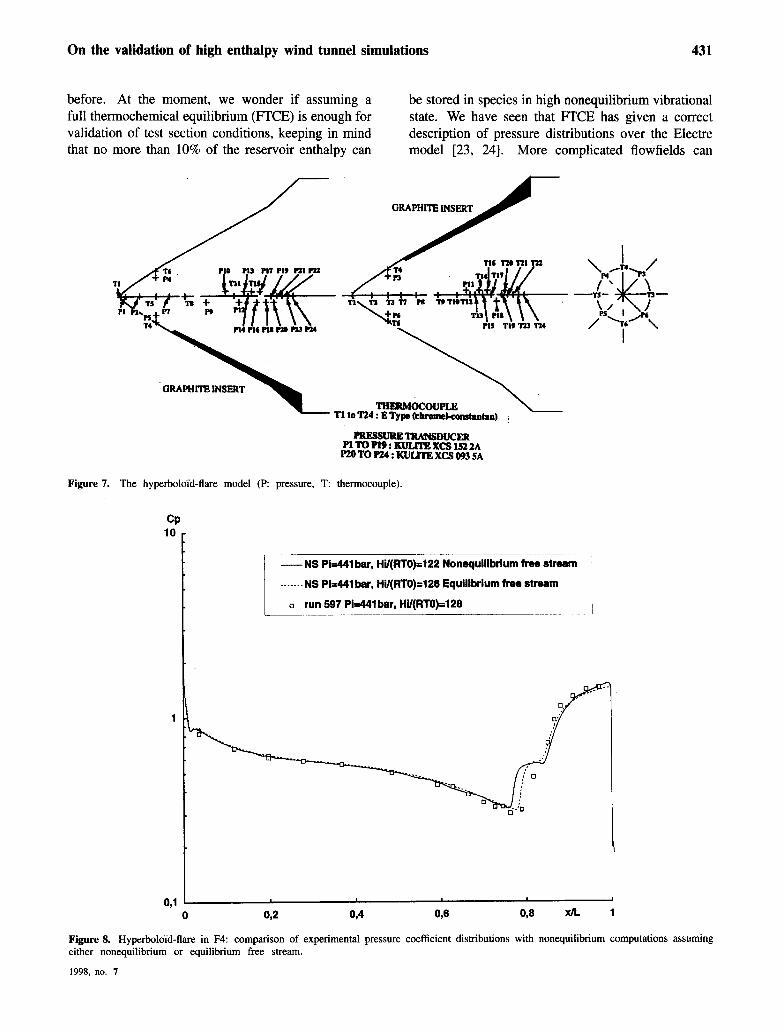
Figure 7. The hyperboldid-flare model (P: pressure, T: thermocouple).
CP 10
/ PM41 bar, Hi/(RTO)=l22 Nonequilibrium f&r1
/ -------NS Pi=441bar, Hii(FtTO)=l28 Equilibrium free stream I
I q run 597 PM41 bar, Hi/(RTO)=129 1
091 1
0 092 054 096 0,8 x/L 1
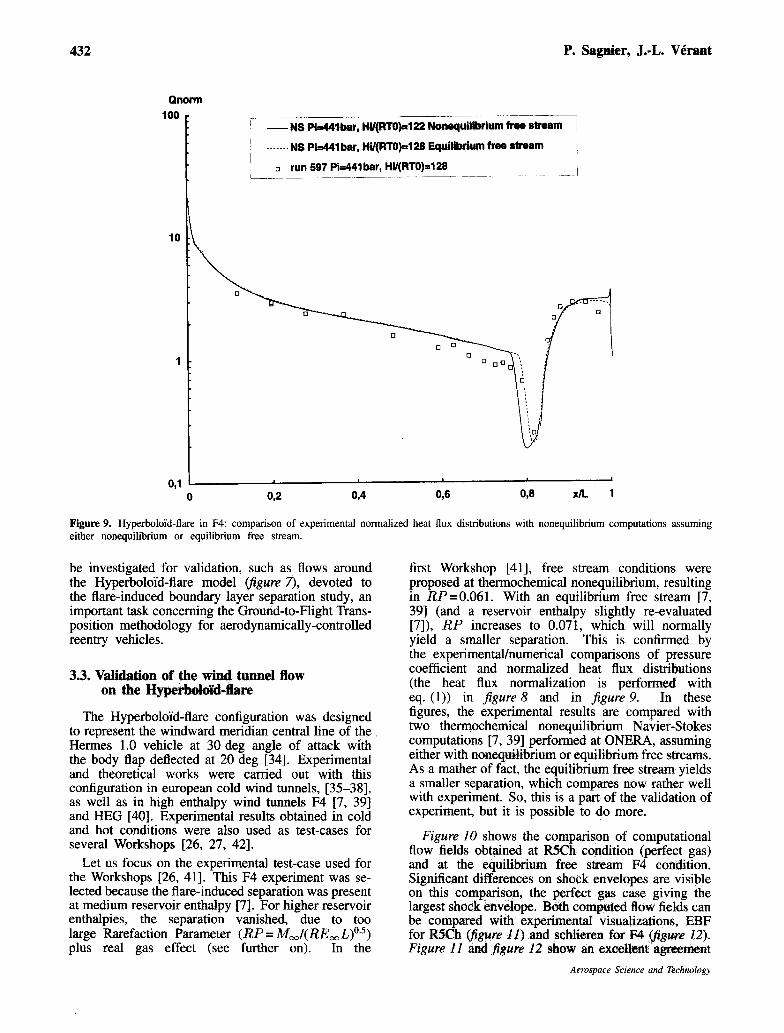
Figure 8. Hyperboldid-flare in F4: comparison of experimental pressure coefficient distributions with nonequilibrium computations assuming either nonequilibrium or equilibrium free stream.
1998, no. 7
432
Qnorm 100
P. Sqmier, J.-L. V&ant
---.--NS Piz44lbsr; Hi/(RTO)el2Q EquiQbriumfrss stream / I
10
1
0.1 0 094 098 x/L 1
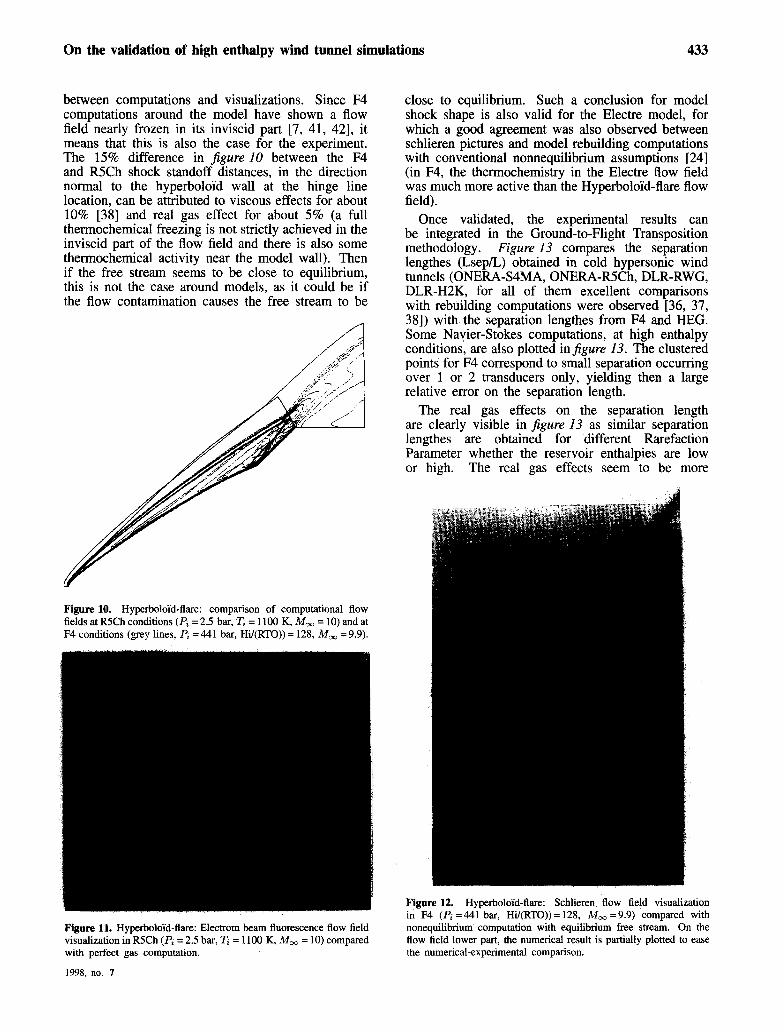
Figure 9. Hyperboloid-flare in F4: comparison of experimental normalized heat flux distributions with nonequilibrium computations assuming either nonequilibrium or equilibrium free stream.
be investigated for validation, such as flows around the Hyperboloid-flare model (figure 7), devoted to the flare-induced boundary layer separation study, an important task concerning the Ground-to-Flight Trans- position methodology for aerodynamically-controlled reentry vehicles.
3.3. Validation of the wind tunnel flow on the Hyperbloid-flare
The Hyperboloid-flare configuration was designed to represent the windward meridian central line of the Hermes 1.0 vehicle at 30 deg angle of attack with the body flap deflected at 20 deg [34]. Experimental and theoretical works were carried out with this configuration in european cold wind tunnels, [35-381, as well as in high enthalpy wind tunnels F4 [7, 391 and HEG [40]. Experimental results obtained in cold and hot conditions were also used as test-cases for several Workshops [26, 27, 421.
Let us focus on the experimental test-case used for the Workshops [26, 411. This F4 experiment was se- lected because the flare-induced separation was present at medium reservoir enthalpy [7]. For higher reservoir enthalpies, the separation vanished, due to too large Rarefaction Parameter (RP = M,/(RE,L)0.5) plus real gas effect (see further on). In the
first Workshop [41], free stream conditions were proposed at thermochemical nonequilibrium, resulting in RP=0.061. With an equilibrium free stream [7, 391 (and a reservoir enthalpy slightly re-evaluated [7]), RP increases to 0.071, which will normally yield a smaller separation. This is confirmed by the experimental/numerical comparisons of pressure coefficient and normalized heat flux distributions (the heat flux normalization is performed with eq. (1)) in figure 8 and in figure 9. In these figures, the experimental results are compared with two thermochemical nonequilibrium Navier-Stokes computations [7, 391 performed at ONERA, assuming either with nonequilibrium or equilibrium free streams. As a mather of fact, the equilibrium free stream yields a smaller separation, which compares now rather well with experiment. So, this is a part of the validation of experiment, but it is possible to do more.
Figure 10 shows the comparison of computational flow fields obtained at RSCh condition (perfect gas) and at the equilibrium free stream F4 condition. Significant differences on shock envelopes are visible on this comparison, the perfect gas case giving the largest shock envelope. Both computed flow fields can be compared with experimental visualizations, EBF for R5Ch @gure II) and schlieren for F4 @gure 12). Figwe II and jTgure 12 show an excel&m agreement
Aerospace Science and Technology
On the validation of high enthalpy wind tunnel simulations 433
between computations and visualizations. Since F4 computations around the model have shown a flow field nearly frozen in its inviscid part [7, 41, 421, it means that this is also the case for the experiment. The 15% difference in figure 10 between the F4 and RSCh shock standoff distances, in the direction normal to the hyperboloid wall at the hinge line location, can be attributed to viscous effects for about 10% [38] and real gas effect for about 5% (a full thermochemical freezing is not strictly achieved in the inviscid part of the flow field and there is also some thermochemical activity near the model wall). Then if the free stream seems to be close to equilibrium, this is not the case around models, as it could be if the flow contamination causes the free stream to be
Fire 10. Hyperboloid-flare: comparison of computational flow fields at RSCh conditions (Pi = 2.5 bar, T, = 1100 K, M, = 10) and at F4 conditions (grey lines, Pi = 441 bar, Hi/(RTO)) = 128, M, = 9.9).
Figure 11. Hyperboloid-flare: Electrom beam fluorescence flow field visualization in RSCh (9 = 2.5 bar, Ti = 1100 K, Mm = 10) compared with perfect gas computation.
1998, no. I
close to equilibrium. Such a conclusion for model shock shape is also valid for the Electre model, for which a good agreement was also observed between schlieren pictures and model rebuilding computations with conventional nonnequilibrium assumptions [24] (in F4, the thermochemistry in the Electre flow field was much more active than the Hyperboloid-flare flow field).
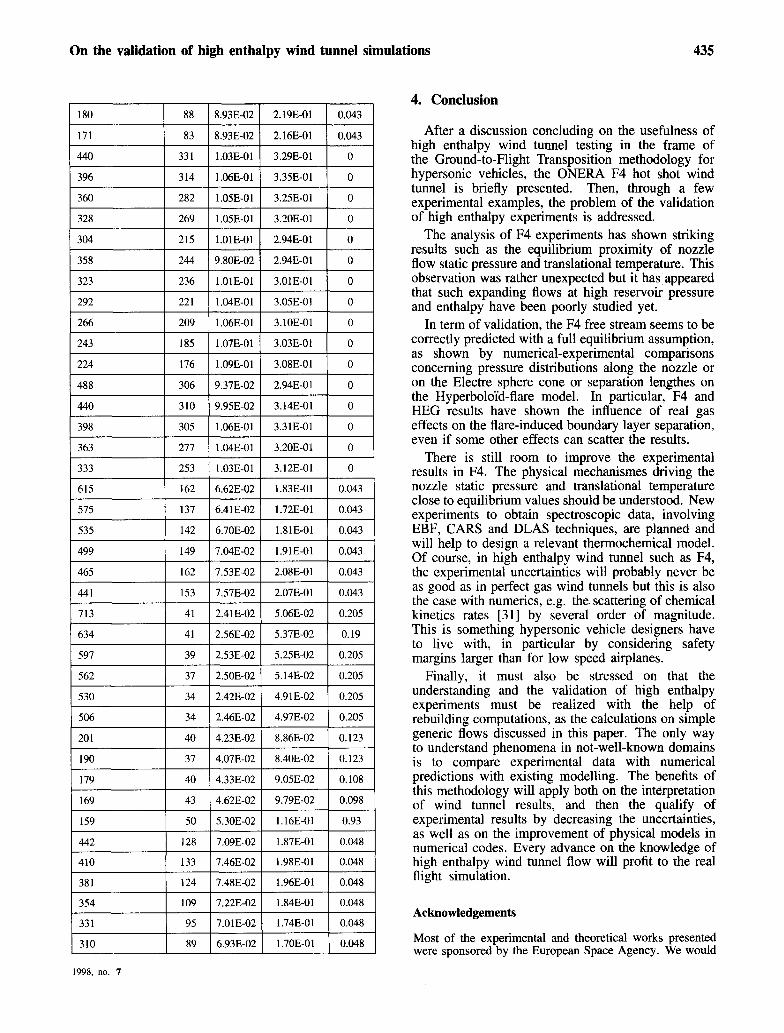
Once validated, the experimental results can be integrated in the Ground-to-Flight Transposition methodology. Figure 13 compares the separation lengthes (LsepIL) obtained in cold hypersonic wind tunnels (ONERA-S4MA, ONERA-RSCh, DLR-RWG, DLR-H2K, for all of them excellent comparisons with rebuilding computations were observed [36, 37, 381) with the separation lengtbes from F4 and HEG. Some Navier-Stokes computations, at high enthalpy conditions, are also plotted in Jigure 13. The clustered points for F4 correspond to small separation occurring over 1 or 2 transducers only, yielding then a large relative error on the separation length.
The real gas effects on the separation length are clearly visible in figure 13 as similar separation lengthes are obtained for different Rarefaction Parameter whether the reservoir enthalpies are low or high. The real gas effects seem to be more
Figure 12. Hyperboloid-flare: Schlieren flow field visualization in F4 (Pi =441 bar, Hi/(RTO)) = 128, M, =9.9) compared with nonequilibrium computation with equilibrium free stream. On the flow field lower part, the numerical result is partially plotted to ease the numerical-experimental comparison.
434 P. Sag&x, J.-L. V&ant
L%pn w5 - 0
~sxp.F4-30<HII@llO)&0
0,20 - a: omp.lRt3-160<HyRm)~270
x0 q *Xp.H24itR5u).RWQ,~~ .N8vbr.sldms-loo<H~fl7o)~oo I_- -~ -.___
0,15 - 0
LX: 0,lO -
+3& o l .
om - &*
o,w ’ w!sx 1
0,Ol 091 M- /(b-L)‘.5 1
Figure 13. Hyperboloid-flare: experimental separation lengths in cold wind tunnels RSCh, H2K, RWG, S4MA, high enthalpy wind tunnels F4, HEG compared with numerical results vs rarefaction parameter M,/(RemL)o.5.
0,25
0,20
0,15
0,lO
o,=
xx “x”o
is “8, . 1Pi&cxr 0,oo 1..
0,Ol ‘I1 MS /(Rw4)*’ [HWi7O)~* 1
Figure 14. Hyperboloid-flare: experimental separation lengths in cold wind tunnels MCh, H2K, RWG, S4MA, high enthalpy wind tunnels F4, HEG compared with numerical results vs Rarefaction Parameter with reservoir entbalpy effect, M, /(Rem L)‘,’ [Hi@TO)]“.2.
Table I. Experimental and numerical results related to figure 13 and jigure 14.
I I I I I I Cold WT test
t I I I I I
P, = 430 bar F4 Nonequ. freestreami 260 1 9.3OE-02 1 2.83E-01 / 0.0433 1
I I I I I I I I I
effective in I-$l3G than in F4. Large separations for the F4 noz@##2 Aow conditions are Only obtained at low enthalpy conditions, contrarily to the HEG nozzle flow cotitions, because of the different Rarefaction Parameters at the exist of the two nozzles, at similar reservoir conditions (tubbe 1). An attempt to correlate roughly the efk%t of the reservoir enthalpy on the separation is displayed in fisure 14. Here, the Rarefktiun Parameter is multiplied by the factor [Hik@KJ)]“.2. The justification to this correlation attempt comes from the observation of a separation length that decreases when the reservoir enthalpy increases, at given Ramfaction Pammeter. The theoretical j.p&ication is yet to be flaalized. It will Iikely involve the e&t of model flow field th.eriBochenristry, yieldiag shocks closer to the body than for perfect gas. Figure 14 shows that the separation lengh evolutions vs the Rarefaction Parameter effectively collapse better if the influence of the reservoir enthalpy is (empirically) accounted for.
Aerospace Science and Technology
On the validation of high enthalpy wind tunnel simulations 435
1998, no. 7
4. Conclusion
After a discussion concluding on the usefulness of high enthalpy wind tunnel testing in the frame of the Ground-to-Flight Transposition methodology for hypersonic vehicles, the ONERA F4 hot shot wind tunnel is briefly presented. Then, through a few experimental examples, the problem of the validation of high enthalpy experiments is addressed.
The analysis of F4 experiments has shown striking results such as the equilibrium proximity of nozzle flow static pressure and translational temperature. This observation was rather unexpected but it has appeared that such expanding flows at high reservoir pressure and enthalpy have been poorly studied yet.
In term of validation, the F4 free stream seems to be correctly predicted with a full equilibrium assumption, as shown by numerical-experimental comparisons concerning pressure distributions along the nozzle or on the Electre sphere cone or separation lengthes on the Hyperboloid-flare model. In particular, F4 and HEG results have shown the influence of real gas effects on the flare-induced boundary layer separation, even if some other effects can scatter the results.
There is still room to improve the experimental results in F4. The physical mechanismes driving the nozzle static pressure and translational temperature close to equilibrium values should be understood. New experiments to obtain spectroscopic data, involving EBF, CARS and DLAS techniques, are planned and will help to design a relevant thermochemical model. Of course, in high enthalpy wind tunnel such as F4, the experimental uncertainties will probably never be as good as in perfect gas wind tunnels but this is also the case with numerics, e.g. the. scattering of chemical kinetics rates [31] by several order of magnitude. This is something hypersonic vehicle designers have to live with, in particular by considering safety margins larger than for low speed airplanes.
Finally, it must also be stressed on that the understanding and the validation of high enthalpy experiments must be realized with the help of rebuilding computations, as the calculations on simple generic flows discussed in this paper. The only way to understand phenomena in not-well-known domains is to compare experimental data with numerical predictions with existing modelling. The benefits of this methodology will apply both on the interpretation of wind tunnel results, and then the qualify of experimental results by decreasing the uncertainties, as well as on the improvement of physical models in numerical codes. Every advance on the knowledge of high enthalpy wind tunnel flow will profit to the real flight simulation.
Acknowledgements
Most of the experimental and theoretical works presented were sponsored by the European Space Agency. We would
436
like to thank also ONERA people from the Large Testing Facilities Department and from the Physics Department, who performed tests and measurements.
References
[l] Francois G., Masson A., Ledy J.P., ONERA-F4 high enthalpy wind tunnel, presented at the 82th meeting of the Supersonic Tunnel Association (STA), Wright Patterson Air Force Base, Ohio (USA), October 16-18, 1994, ONERA TP no 1994-150.
[2] Mohammed A., Rosier B., Sagnier Ph., Henry D., Louvet Y., Applications of infrared diode laser absorption spectroscopy to the F4 high enthalpy wind tunnel, to be published (accepted), in Aerospace Science and Technology 2 (4) (1998) 241-250.
[3] Soutade J., Direct measurement of the velocity in the F4 wind tunnel with the pseudospark electron gun, and with the Electre model in the test section (study no 8057 GH 740 G), ONERA test report no PV l/8057 GY, April 1997.
[4] Soutade J., Tests of the Hyperboldid-flare model with a direct velocity measurement device in the F4 wind tunnel (Study no 8046 GH 740 G), ONERA test report no PV 118046 GY, May 1997.
[5] Sagnier Ph., Francois G., Analysis of calibration results in high enthalpy F4 hot shot wind tunnel, presented at the 19th International Symposium on Shock Waves - held in Marseille - July 26-30, 1993, printed in Proceedings Shock Waves @ Marseille I, Springer, 1995.
[6] Fay J.A., Riddel F.R., Theory of stagnation point heat transfer in dissociated air, J. of the Aeronautical Sciences, V. 25, no 2, February 1958.
[7] Sagnier Ph., Synthesis of the hyperbolo’id-flare campaign in F4 (January-February 1994), ONERA RT no 70/6121 SY, December 1994.
[8] V&ant J.-L., Numerical enthalpies rebuilding for perfect gas and nonequilibrium flows. Application to high enthalpy wind tunnels, ONERA RT no 69/612 1 SY, September 1994.
[9] Bertin J.J., General characterization of hypersonic flows, 1st Joint Europe-US Short Course on Hyper- sonics, December 7-11 1987. 1
[lo] Miller Ch. G., Laminar heat-transfer distributions on biconics at incidence in hypersonic-hyperveolcity fiows, NASA TP 2213, 1985.
[ 111 Lees L., Laminar heat transfer over blunt-nosed bodies at hypersonic flight speeds, Jet Propulsion, April 1956.
[ 121 Sagnier Ph., Comparison of nozzle flow simulations with LDIAS measurements obtained during the manned space transportation program phase 1 F4 nozzle#Q calibration campaign, ONERA RT 7416121 SY, July 1995.
[ 131 Sagnier Ph., Synthesis of 1997 Electre and hyperboldid- flare F4 test campaigns, ONERA RT 95/6121 SY, August 1997.
[14] Sagnier Ph., V&ant J.L., Devezeaux D., Mohamed A.K., Masson A., Real gas flow characterization in the ONERA F4 high enthalpy wind tunnel, 17th ICIASF, Naval Postgraduate School, Monterey, California,
P. Sagaier, J.-L. V&ant
September 29-October 2, 1997, ICIASF’97 Record 97CH36121, ONERA TP 1997-161.
[15] V&ant J.L., Sagnier Ph., Flow characterization in the ONERA F4 high enthalpy wind tunnel, AIAA Journal 36 (4) (1998).
[16] Sagnier Ph., Devezeaux, V&ant J.L., Masson A., Mohamed A.K., Mesure de flux de chaleur dam la soufflerie F4 de I’ONERA, SFI 97, Congr&s Franqais de Thermique, Toulouse, 20, 21, et 22 mai 1997, ONERA TP-n” 1997-88.
[ 171 Sagnier Ph., F4 nozzle number 2 exit flow charts for air and nitrogen, ONERA RT no 71/6121 SY, December 1994.
[18] Sagnier Ph., Masson A., Mohamed A.K., V&ant J.L., Devezeaux D., Synthesis of the manned space transportation program calibration campaigns in ONERA F4 hot shot wind tunnel, International Congress on Instrumentation in Aerospace Simulation Facilities, Wright-Patterson AFB, Ohio, USA, July 18- 21, 1995, ICIASF’95 Record 95-CH3428-7, ONERA TP no 1995-86.
[19] Masson A., Allemane M.L., Electre model test in F4 wind tunnel (study no 8908 GY 740 G), ONERA Test Report 318908 GY, June 1995.
[20] Sagnier Ph., Synthesis of the Electre standard model numerical and experimental activities at ONERA, ONERA RT 718908 GY, January 1996.
[21] Muylaert J., Walpot L., Hauser J., Sagnier Ph., Devezeaux D., Papimyk O., Lourme D., Standard model testing in the European high enthalpy facility F4 and extrapolation to flight, AIAA paper 92-3905, AIAA 15 th Ground Testing Conference, Nashville (TN), July 6-8, 1992.
[22] Muylaert J., Voiron T., Sagnier Ph., Papimyk O., Biitefish K., Koppenwallner G., Review of the Hermes hypersonic wind tunnel performance and simulation requirements, First European symposium on Aerothermodynamics for Space Vehicles, Noordwijk (NL), 1991.
[23] Sagnier Ph., Summary of computations on the Electre standard model in the frame of test campaigns in ONERA wind tunnels, F4, R3Ch, S4MA, ONERA RT
~24
125
no 6/8908 GY, October 1995. .] Sagnier Ph., Kordulla W., Synthesis of contributions to
the Electre test cases within the Fourth European High- Velocity Database Workshop held at ESA/ESTEC, Noordwijk, the Netherlands, 24-25 November 1994, ONERA RT no 73/6121 SY, H-TR-E34-601-ONERA Part l/2, September 1995.
] Park C., Lee S.-H., Validation of multi-temperature nozzle flow code NOZNT, AIAA paper 93-2862, AIAA 28th Thermophysics Conference, Orlando FL, July 6-9, 1993.
[26] US-Europe Workshop on High Speed Flow Field, held in University of Houston, November 8-9, 1995, Proceedings to be published.
[27] Manned Space Transportation Workshop on Reentry Aerothermodynamics and Ground-to-Flight Extrapola- tion, held in ESAIESTEC, Noordwijk, The Netherland, March 25-27, 1996, Proceedings to be published.
[28] Ford D.I., Johnson D.E., Dependence of rate constants on vibrational temperatures: an Arrhenius description,
Aerospace Science and Technology
On the validation of high enthalpy wind tunnel simulations 437
AIAA paper 88-0461, AIAA 26 th Aerospace Sciences Meeting, Reno, Nevada, January 11-14, 1988.
[29] Candler G., Translation-vibration-dissociation cou- plings in nonequilibrium hypersonic flows, AIAA paper 89-1739, AIAA 24th Thermophysics Conference, Buffalo, New York, June 12-14, 1989.
[30] Park C., Assessment of two-temperature kinetic model for ionizing air, AIAA paper 87-1574, 1987.
[31] Sagnier Ph., Marraffa L., Parametric study of themal and chemical nonequilibrium nozzle flow, AIAA Journal, vol. 29, no 3, March 1991.
[32] Grish F., Bouchardy P., Koch U., Giilhan A., Rotational and vibrational temperature and density measurements by coherent anti-stokes raman scattering in a nonequilibrium flow, RTO/AGARD fluid dynamics panel symposium, advanced aerodynamic measurement Technology , Seattle, USA, September 22-25, 1997.
[33] Krek R.M., Ueda S., Kastell D., Eitelberg G., Electre experiments in the HEG facility, DLR-IB 223-95, A 65, December 1995.
[34] Durand G., Hyperboloid-flare combination: an hy- personic test case for the qualification of laminar compressible Navier-Stokes codes including high temperature effects, Note CNES no DLA/EDI3A, no 032.09.92, September 1992.
[35] Sagnier Ph., Synthesis of measurement results over an hyperboloid-flare configuration in ONERA RSCh wind tunnel, ONERA RT, no 64/6121 SY, 1994.
[36] Sagnier Ph., Synthesis of hyperboldid-flare experiments in ONERA F4, S4MA, R3Ch, RSCh wind tunnels
and DLR H2K, RWG wind tunnels, ONERA RT, no 72/6121 SY, February 1995.
[37] Bousquet J.M., Faubert A., Oswald J., Computations of laminar hypersonic flows around the hyperboldid- flare geometry with FLU3M, ONERA RT 57/6122 AY, February 1994.
[38] Bousquet J.M., Faubert A., Synthesis of hyperboldid- flare results in RSCh, R3Ch and S4MA wind tunnel conditions, ONERA RT 63/6122 SY, February 1995.
[39] Sagnier Ph., JOly V., Marmignon C., Analysis of nonequilibrium flow calculations and experimental results around an hyperboloid-flare configuration, in Proceedings of the Second European Symposium on Aerothermodynamics for Space Vehicles, held in ESTEC, Noordwijk, the Netherlands, 21-25 November 1994, ESA SP-367, p. 491-496, February 1995, ONERA TP, no 1994-26.
[40] Krek R.M., Eitelberg G., Beck W.H., Hyperboldid- flare experiments in the HEG, presented at the 20th Shock Waves International Symposium, Pasadena (CA) - USA, Jult 23-28, 1995.
[41] Devezeaux D., Hollanders H., Synthetis of workshop test-case no 4, Hyperboldid-flare in F4, ONERA RT 7716121 SY, September 1995.
[42] Sagnier Ph., Joly V., Navier-Stokes calculations in thermochemical nonequilibrium on an hyperboldid- flare configuration for ground-to-flight transposition, ONERA RT 63/6121 SY, March 1994.
1998, no. 7


![Thermochemistry [Thermochemical Equations, Enthalpy Change and Standard Enthalpy of Formation]](https://img.pdfslide.net/doc/110x75/557ddcecd8b42a4e358b4995/thermochemistry-thermochemical-equations-enthalpy-change-and-standard-enthalpy-of-formation.jpg)