Embed Size (px)
Citation preview

Article Title:Anisotropic rigidity sensing on grating topography directs human mesenchymal stem cell elongation
Journal:Biomechanics and Modeling in Mechanobiology
Authors:S. T. Wong, S. K. Teo, K.-H. ChiamA*STAR Institute of High Performance [email protected]
S. ParkDepartment of Chemistry and Nano Science, Ewha Womans University
S. T. Wong, E. K. F. YimDepartment of Bioengineering, National University of [email protected]
E. K. F. YimDepartment of Surgery, National University of Singapore
S. Park, K.-H. Chiam, E. K. F. YimMechanobiology Institute, National University of Singapore
ONLINE RESOURCE 1Characterization of PDMS with different crosslinker to prepolymer ratio
Figure S1 PDMS Young’s Modulus as a function of crosslinker to prepolymer ratio. As the ratio of PDMS crosslinker to prepolymer is decreased from 1:10 to 1:20, the Young’s modulus of the substrate decreases from 1.43 ± 0.259 MPa to 0.066 ± 0.0176 MPa. The ratio of 1:10 is suggested by the manufacturer for normal use of PDMS Sylgard 184. Previous mechanical tensile testing conducted using PDMS Sylgard 184 has shown that the Young’s modulus reached a plateau below a ratio of 1:10. Conversely, substrates with crosslinker: base ratios beyond 1:20 became harder to handle and appeared slightly ‘sticky’ because the amount of uncrosslinked PDMS prepolymer is increased.
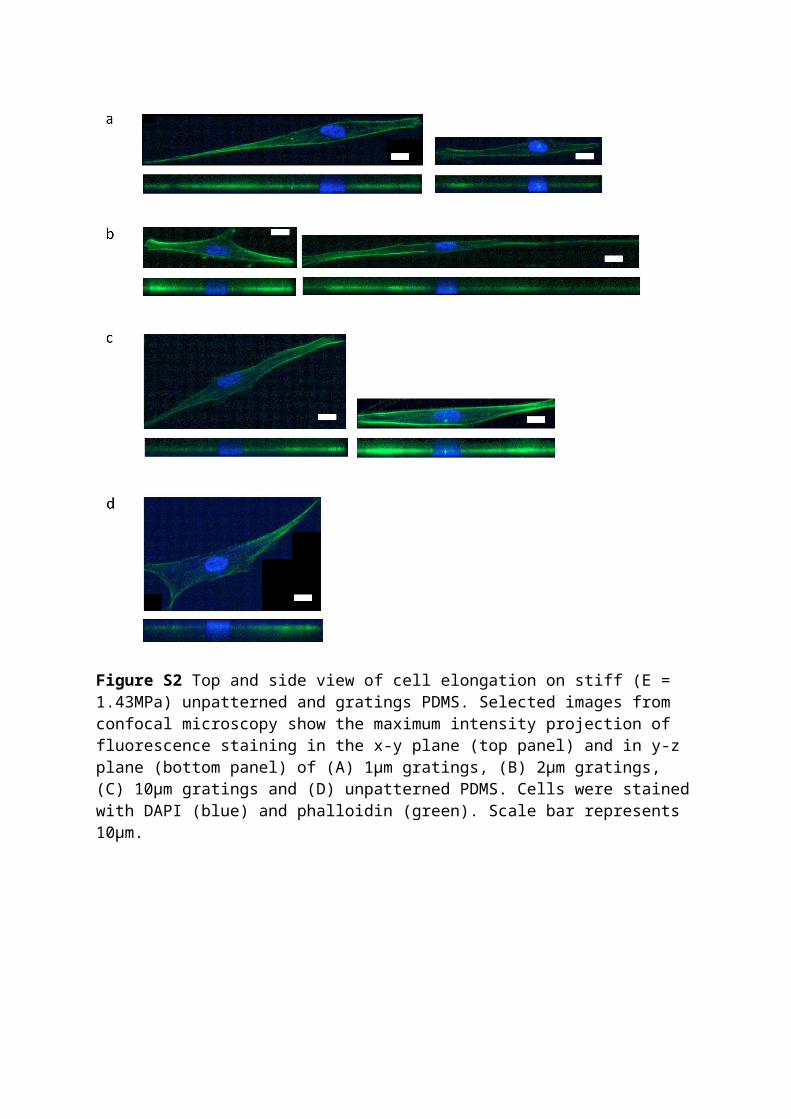
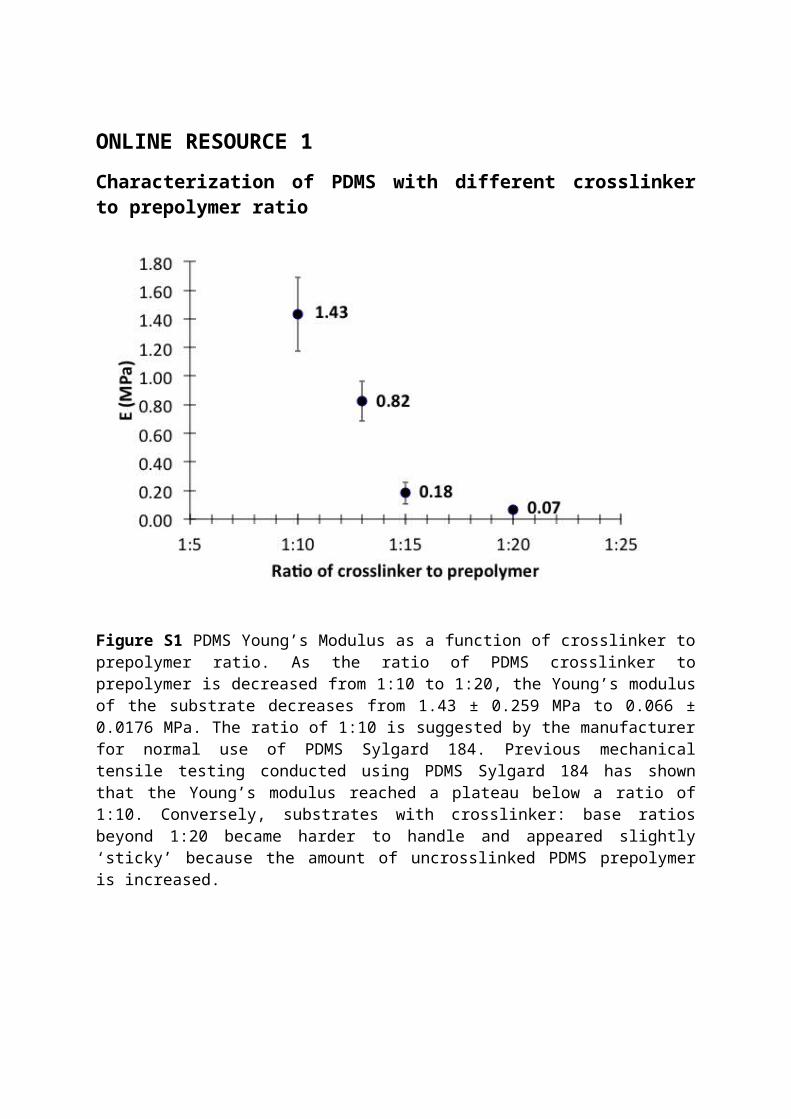
Figure S2 Top and side view of cell elongation on stiff (E = 1.43MPa) unpatterned and gratings PDMS. Selected images from confocal microscopy show the maximum intensity projection of fluorescence staining in the x-y plane (top panel) and in y-z plane (bottom panel) of (A) 1μm gratings, (B) 2μm gratings, (C) 10μm gratings and (D) unpatterned PDMS. Cells were stained with DAPI (blue) and phalloidin (green). Scale bar represents 10μm.
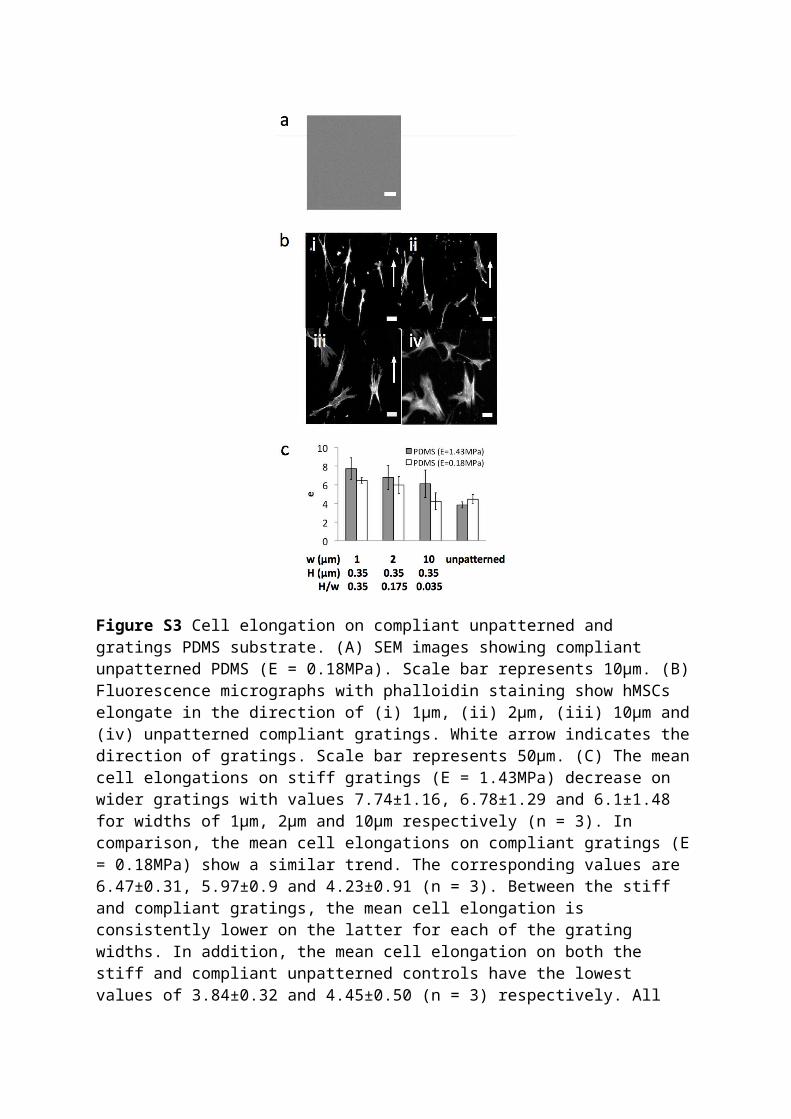
Figure S3 Cell elongation on compliant unpatterned and gratings PDMS substrate. (A) SEM images showing compliant unpatterned PDMS (E = 0.18MPa). Scale bar represents 10μm. (B) Fluorescence micrographs with phalloidin staining show hMSCs elongate in the direction of (i) 1μm, (ii) 2μm, (iii) 10μm and (iv) unpatterned compliant gratings. White arrow indicates the direction of gratings. Scale bar represents 50μm. (C) The mean cell elongations on stiff gratings (E = 1.43MPa) decrease on wider gratings with values 7.74±1.16, 6.78±1.29 and 6.1±1.48 for widths of 1μm, 2μm and 10μm respectively (n = 3). In comparison, the mean cell elongations on compliant gratings (E = 0.18MPa) show a similar trend. The corresponding values are 6.47±0.31, 5.97±0.9 and 4.23±0.91 (n = 3). Between the stiff and compliant gratings, the mean cell elongation is consistently lower on the latter for each of the grating widths. In addition, the mean cell elongation on both the stiff and compliant unpatterned controls have the lowest values of 3.84±0.32 and 4.45±0.50 (n = 3) respectively. All grating have the same height of 350nm. Error bar denotes standard error of mean.

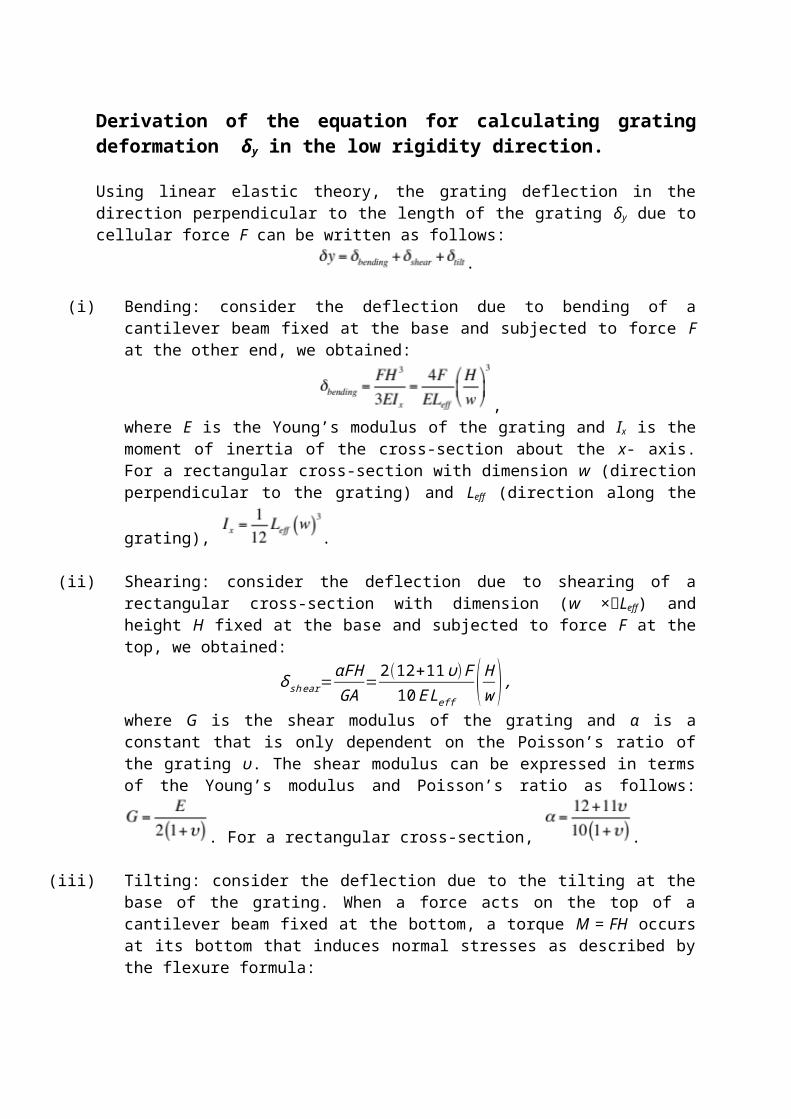
Derivation of the equation for calculating grating deformation δy in the low rigidity direction.
Using linear elastic theory, the grating deflection in the direction perpendicular to the length of the grating δy due to cellular force F can be written as follows:
.
(i) Bending: consider the deflection due to bending of a cantilever beam fixed at the base and subjected to force F at the other end, we obtained:
,where E is the Young’s modulus of the grating and Ix is the moment of inertia of the cross-section about the x- axis. For a rectangular cross-section with dimension w (direction perpendicular to the grating) and Leff (direction along the grating),
.
(ii) Shearing: consider the deflection due to shearing of a rectangular cross-section with dimension (w ×Leff) and height H fixed at the base and subjected to force F at the top, we obtained:
δ sh ear=αFHGA
=2 (12+11υ)F10 E Leff
(Hw ),
where G is the shear modulus of the grating and α is a constant that is only dependent on the Poisson’s ratio of the grating υ. The shear modulus can be expressed in terms of the
Young’s modulus and Poisson’s ratio as follows: . For a rectangular cross-
section, .
(iii) Tilting: consider the deflection due to the tilting at the base of the grating. When a force acts on the top of a cantilever beam fixed at the bottom, a torque M = FH occurs at its bottom that induces normal stresses as described by the flexure formula:
,
with σmax occuring at (assuming the neutral axis passes through the centroid of the beam). This implies that:
.The moment M causes a warping of the substrate beneath the base of the beam. This warping leads to a tilting of the pillar base by an angle θtilt, that is proportional to the Young’s modulus E of the PDMS:
,where ktilt is a constant that is only dependent on the Poisson’s ratio of the grating υ. Substituting the expression for σmax into the equation for θtilt, we obtain:
.
The tilting of the base causes a deflection at the top of the beam given by: . For small rotation, ,
Combining (i), (ii) and (iii), we can obtain an expression for the deflection of the grating in
the direction perpendicular to the grating in terms of the grating aspect ratio :
,where ktilt is a constant dependent only on υ.
For gratings that are fabricated using PDMS with a Poisson’s ratio υ = 0.5, we can further simplify the above equation:
.We make a further assumption that ktilt for a rectangular cross-sectional area beam can be approximated by that for an elliptical cross-sectional beam derived by Schoen et al. (Schoen et al, 2010). Using Eq. (8) in their paper with the free fitting parameter α = 1.3 and υ = 0.5, we obtained:
.Therefore, we can further simplify the equation for δy for PDMS gratings to:
REFERENCES
Schoen I, Hu W, Klotzsch E, and Vogel V (2010) Probing cellular traction forces by micropillar arrays: contribution of substrate warping to pillar deflection. Nano Letters 10: 1823–30