Embed Size (px)
Citation preview
Opening up Telecommunications to Competition and MENA Integration in the World Economy
by
Carlo Maria Rossotto (1)
Khalid Sekkat (2)
Aristomene Varoudakis (1)
July 2003
(1) The World Bank; Washington D.C., USA (2) University of Brussels and European Commission, Belgium Discussion papers are not formal publications of the World Bank. They represent preliminary and often unpolished results of country analysis and research. Circulation is intended to encourage discussion and comments; citation and the use of the paper should take account of its provisional character. The findings and conclusions of the paper are entirely those of the authors and should not be attributed to the World Bank, its affiliated organizations, or to members of its Board of Executive Directors or the countries they represent.
________________________ The authors wish to thank Hamid Alavi, Mustapha Nabli, Kamal Shehadi; and Bjorn Wellenius for helpful comments on an early version of the paper. Comments may be directed to: [email protected]
Pub
lic D
iscl
osur
e A
utho
rized
Pub
lic D
iscl
osur
e A
utho
rized
Pub
lic D
iscl
osur
e A
utho
rized
Pub
lic D
iscl
osur
e A
utho
rized
Pub
lic D
iscl
osur
e A
utho
rized
Pub
lic D
iscl
osur
e A
utho
rized
Pub
lic D
iscl
osur
e A
utho
rized
Pub
lic D
iscl
osur
e A
utho
rized
Table of Contents
Summary 1. Introduction and Overview .....................................................................................................................................1 2. The Process of International Fragmentation of Production and Services Trade Liberalization..............................3 3. Assessing Market Openness in Telecommunications .............................................................................................5
4. Market Openness and Performance in Telecommunications...........................................................................8 5. Telecommunications Performance and Participation in the World of Economy..................................................13
6. Conclusion and Policy Implications ..............................................................................................................16 References...................................................................................................................................................................25 Figures Figure 1: Performance in telecommunications ........................................................................................................6 Figure 2: Privatization and competition in mobile networks per region ..................................................................7 Figure 3: Progress in liberalization across countries................................................................................................8 Figure 4: Potential impacts of further liberalization ..............................................................................................12 Tables Table 1: Cross-country differences in telecommunications performance: empirical estimates .................................9 Table 2: Telecommunications performance and integration in the World economy: empirical estimates...............14 Table 3: Indicators of telecommunications availability in selected regions (1990/1999) ........................................15 Annex Part A: Factors of Market Openness in Telecommunications ................................................................................17 Part B: An Indicator of Market Openness in Telecommunications: Country Groups............................................19 Part C: MENA Country Ratings: Components of the Telecommunications Market Openness Indicator..............20 Part D: MENA Country Liberalization Profiles in Telecommunications: A snapshot ...........................................21

موجز تبحث هذه الدراسة األثر المحتمل لفتح قطاع االتصاالت السلكية والالسلكية في بلدان منطقة الشرق األوسط وشمال أفريقيا أمام المنافسة
راك في شبكات ويقّيم هذا األثر األخير فيما يتعلق بالصادرات المصّنعة، واالشت. على أداء هذا القطاع وعلى اشتراك المنطقة في االقتصاد العالميوتدخل الدراسة أوال نموذجا يقّيم المنافع التي يمكن أن تتحقق من تحرير قطاع االتصاالت . اإلنتاج، وإمكانية جذب االستثمار األجنبي المباشر
) 2( الثابتة والمتحرآة؛ درجة المنافسة الفعلية في الشبكات) 1: (ويستند التقييم إلى ثالثة عوامل رئيسية. السلكية والالسلكية على أداء القطاعوتؤآد النتائج أن تحرير القطاع وفتح األسواق يساعدان على زيادة . اللوائح التنظيمية المحبذة للمنافسة) 3(االنفتاح أمام االستثمار األجنبي؛ و
التحليل أنه بعد أخذ تأثير العوامل الهيكلية وفيما يتعلق بدمج المنطقة في االقتصاد العالمي، يؤآد. الكفاءة في قطاع االتصاالت السلكية والالسلكيةاألخرى في االعتبار، فإن تحسن أداء قطاع االتصاالت السلكية والالسلكية يقوي أداء صادرات الصناعات التحويلية بما فيها صادرات المنتجات
طنية وتخفيض تكاليف أداء العمل، وجد أن تحسن وعالوة على ذلك، وعن طريق تسهيل الروابط مع شبكات اإلنتاج العابرة للحدود الو. الوسيطة. أداء قطاع االتصاالت السلكية والالسلكية يعتبر عامال محددا لتدفقات االستثمار األجنبي المباشر إلى البلدان النامية
Résumé Le présent document examine l'impact potentiel de l'ouverture des télécommunications à la
concurrence dans la région MENA sur la performance du secteur et sur la participation de la région à l'économie mondiale. Cette dernière est évaluée à travers les exportations de produits manufacturés, la participation aux réseaux de production et l�attrait de l'IDE. Le document introduit tout d'abord un modèle qui évalue les avantages de la libéralisation des télécommunications sur la performance sectorielle. La libéralisation des télécommunications est évaluée sur la base de trois facteurs : (i) le degré de concurrence dans les réseaux fixes et mobiles, (ii) l'ouverture à l'investissement extérieur, et (iii) la réglementation pro-concurrentielle. Les résultats confirment que la libéralisation et les marchés ouverts contribuent à accroître l'efficacité du secteur des télécommunications. En ce qui concerne l'intégration de la région à l'économie mondiale, l'analyse confirme qu�une meilleure performance des télécommunications renforce la vocation exportatrice du secteur manufacturier, y compris les exportations de produits intermédiaires. En outre, en facilitant les interactions aux réseaux de production transnationaux et en réduisant le coût lié à la marche des affaires, il ressort qu'une meilleure performance du secteur des télécommunications est un déterminant des entrées d'investissement direct étranger.
Summary This paper investigates the potential impact of opening up telecommunications to competition
in MENA on the sector�s performance and on the participation of the region in the World economy. The latter is assessed with respect to manufactured exports, participation in production networks and attractiveness to FDI. The paper first introduces a model to assess the benefits of telecommunications liberalization on sector performance. Telecommunication liberalization is evaluated on the basis of: (i) degree of effective competition in fixed and mobile networks ; (ii) openness to foreign investment; and (iii) pro-competitive regulation. The results confirm that liberalization and open markets promote efficiency in telecommunications. Regarding the integration of the region in the world economy, the analysis confirms that, better performance of telecommunications strengthens export performance in manufacturing, including exports of intermediate products. Moreover, by facilitating linkages with transnational production networks and reducing the cost of doing business, better telecommunications performance is found to be a determinant of foreign direct investment inflows.
1. Introduction and Overview
A common pattern of integration in today�s global economy is the increasing fragmentation of production chains across borders (Arndt and Kierzkowski, 1999). This is reflected in far above average growth of global trade in components and partially assembled manufactured goods (Yeats, 2000). These transformations are having broad repercussions on developing countries. A number of developing countries have entered global production sharing chains without either the basis of a broad local market for the final products or strong initial technological capabilities. Export-oriented FDI has been the vehicle that reinforced existing competitive advantages (for example in low-cost labor for textile and clothing exports), or helped to reshape advantages by introducing technologies, skills, brand names and networks not available to local firms (UNCTAD, 2001).
A strong investment climate has been the main ingredient in every success story to date. But international experience suggests that good quality and low cost of backbone services (such as transport, ICT services, finance) and important production inputs (such as electricity), have also been key elements of success. Competitive backbone services reduce the cost of exporting and strengthen the linkages with global production networks. Regulatory reforms that inject more competition in markets for services and network industries are, in turn, instrumental in forcing operators to improve efficiency and pass on the lower production costs to users. But because in many developing countries domestic providers of services often operate below international efficiency standards, opening up markets to competition has to go in tandem with lowering trade barriers in services and making room for increased foreign entry in domestic markets.1
Telecommunications play a key role among backbone services because they affect efficiency and growth across a wide range of user industries. The quality and price of telecommunication services directly affects business costs, but also affects the capacity of firms to network and compete in foreign and domestic markets. Good quality and low cost of leased lines and backbone networks also facilitates internet penetration and the spread of IT applications in businesses that spur productive efficiency. Moreover, services are intertwined: Efficiency in transport and finance, key services that facilitate trade, depends on information technology, and thus on the performance of the ICT sector.
Reflecting the rapid pace of innovation in information and communications technologies (ICT), competitive market forces are becoming increasingly important in the provision of telecommunication and networking services, definitely moving the sector away of the �natural monopoly� market model. International evidence suggests that market openness in telecommunications services and the quality of the regulatory regime are drivers of ICT sector development (OECD, 2000b). In high-income countries there is evidence that greater market openness encourages expansion of the network at lower cost, while improving the efficiency of incumbent operators and lowering the costs of services to ICT-using sectors (Boylaud and Nicoletti, 2000).
1 The WTO General Agreement on Trade in Services (GATS) commits members governments to undertake
negotiations on specific issues and to enter into successive rounds of negotiations to progressively liberalize trade in services. The first round of negotiations started officially in early 2000 under the auspices of the Council for Trade in Services. The Doha Declaration endorsed the work already done, reaffirms the negotiating guidelines and procedures, and establishes some key elements of the timetable including, most importantly, the deadline for the conclusion of the negotiations as part of a single undertaking.
2
MENA countries face the challenge of boosting growth, to create employment opportunities for a rapidly growing young population. Trade expansion can help MENA countries rise to this challenge, as in a number of countries that successfully integrated into global markets, where export-led growth eventually brought large employment dividends (Dasgupta et al., 2002). Services liberalization could greatly facilitate the integration of MENA into global trade by improving competitiveness and relaxing the �beyond-the-border constraints to trade�. But, contrary to steps taken elsewhere in developing countries, and despite recent initiatives, MENA still lags behind in regulatory reform to liberalize markets in services. However, the stakes of more ambitious liberalization in services are high for a number of reasons:
• Market openness in telecommunications services would be a driver of broader ICT sector
growth by stimulating demand for ICT services. The increase in the size of the ICT sector would be, on its own, a major short-term impulse to economic growth.
• In addition to being a high growth sector per se, ICT growth would have positive spillovers on other sectors of the economy as well, spurring supply-driven growth. Falling costs of key networking technologies would benefit communications intensive industries that provide key �backbone services� to the economy, such as transport, distribution and finance. This would improve competitiveness of exporting industries by reducing the �cost of doing business� and facilitating the integration of MENA countries to transnational production networks.
• ICT growth would also enable businesses take advantage of technological developments, thus helping exporters move further up in the scale of technological specialization.
• In addition to its benefits for trade, liberalization in services can create more investment opportunities for the domestic private sector, and help attract more non-debt creating foreign financing in the form of FDI and portfolio investment. Stepped up investment can offset the short-term adjustment costs stemming from lower protection of import-competing industries.
This study, first, empirically looks at the determinants of telecommunications sector
performance, based on international evidence across a wide range of high-income and developing countries, and strongly confirms that market openness and pro-competitive regulation improve Telecom sector performance. But, despite recent progress in a number of countries, market liberalization in telecom has been slower in MENA than elsewhere in the developing world. The study offers an assessment of unrealized potential in ICT sector development, and provides estimates of the likely impact of telecommunications liberalization on export performance and FDI inflows.
Section 2 briefly discuss the ongoing process of production fragmentation and highlights its connection with services liberalization. Section 3 benchmarks MENA countries with regard to liberalization in telecommunications, by developing an indicator of market openness that encompasses elements of competition, openness to FDI, and quality of the regulatory regime. Section 4 examines the empirical linkages between market openness and telecommunications sector performance. Then, based on econometric evidence, section 5 examines whether telecommunication services performance affects manufactured exports, intermediate good exports, and FDI inflows in developing countries and the MENA region. Section 6 concludes and draws the policy implications of the analysis.
3
2. The Process of International Fragmentation of Production and Services Trade Liberalization
The process of fragmentation is not new in the literature of international trade but took
several forms and different names such as "disintegration� (Feenstra, 1998), �internationalization� (Grossman and Helpman, 1999), or �multistage production� (Dixit and Grossman, 1982). Others have used standard terms such as �subcontracting� and �outsourcing� (Feenstra and Hanson, 1996). Fragmentation allows countries to specialize in the components of production processes in which they have the greatest comparative advantages. Therefore, by locating these different parts of the production process in different countries and coordinating them internationally, the world economy can achieve significant gains in productive efficiency.
Sharp reductions in the cost of moving goods across borders have enabled firms to better co-ordinate production in different locations, and have facilitated exporters� linkages with vertical production chains that stretch increasingly across borders (Hummels et al., 2001). Lower logistics costs have resulted from an accelerating “logistics revolution”�driven by the more widespread use of containers in trade; the adoption of �just-in-time� manufacturing techniques; enhanced supply-chain management; and the more wide-spread use of information technology and the internet in logistics. Lower levels of trade protection have also enabled the fragmentation of production across borders. The favorable trade environment that emerged after the Uruguay Round has spurred vertical trade especially in high-tech products�thanks to the largely duty-free trade in information technology products that came into force with the �Information Technology Agreement� (ITA).
The increased possibilities of �dividing up the value chain� of production allowed the development of internationalization of the production process on unprecedented scale with deep implications for the global division of labor. The result of these developments is (Feenstra (1998)) integration of trade and disintegration of production in the global economy. In other words, the rising integration of world markets has brought with it a disintegration of the production process, in which manufacturing or services activities done abroad are combined with those performed at home. Companies are now finding it profitable to outsource increasing amounts of the production process, a process which can happen either domestically or abroad. This represents a breakdown in the vertically-integrated mode of production � the so-called �Fordist� production, exemplified by the automobile industry � on which American manufacturing was built.
Cross-country production sharing chains have especially spread at a regional level, particularly in East Asia, as evidenced by the fast growth in regional trade in parts and components. Over 1984-96, regional exports of components to other East Asian countries grew at an annual rate of 21 percent, twice as fast as the growth of total East Asian exports (Ng and Yeats, 2000). Within the region, high-income countries like Japan, Singapore and Taiwan increased their specialization in the manufacturing of components, while assembly operations have tended to migrate to the relatively low-wage countries, such as the Philippines, Indonesia, Thailand, and Malaysia.2 As industrial restructuring is increasingly stretching across national borders, the stages of production in a number of manufacturing industries have become �locationally footloose�. Semi-conductors, electronic tuners, valves, and other components are now commonly assembled for TNCs in Mexico, Malaysia, Thailand, or the Philippines. 2 In 1996, components accounted for about 30 and 25 per cent of total Philippines and Malaysian imports,
while they totaled only about 7 per cent of Japanese and Taiwanese imports. By contrast, components represented as much as 20 per cent of Japanese and Taiwanese exports, but only about 17 per cent of total exports in the Philippines and Malaysia (see Ng and Yeats, 2000).
4
The process of fragmentation of production allows the development of internationalization of the production process on unprecedented scale with deep implications for the global division of labor. By locating different parts of the production process in different countries and coordinating them internationally, firms can achieve significant gains in productive efficiency. For developing countries, fragmentation of production may bring other gains. In addition to managerial and technological expertise, another important advantage is that foreign participation�in form of either �outsourcing� or direct investment�may offer direct access to global networks of a parent company. Becoming part of a production and distribution network of an MNC offers a �cheap way� to market products. Firms do not incur marketing cost, which are usually quite significant for new comers (Roberts and Tybout 1998). Given the increasing sophistication of the division of labor in the global economy, efficient trade-related services are becoming key in enabling producers at various stages of production chains better coordinate their activities with intermediate input suppliers located in other countries. Speed, flexibility, reliability, and low cost of transport and information logistics are particularly adding value to companies participating in production chains around the globe. Slow or unpredictable delivery delays the response to new market opportunities and rapidly changing demand patterns, force customers to hold costly buffer stocks, and make supply-chain management ineffective. Countries that have strengthened their positions in global production chains have improved their ICT capabilities; lowered the cost of transport; and created more competitive finance and insurance markets. Better service delivery has greatly contributed to reducing the cost of doing business, thus improving the attractiveness of these countries to both foreign and domestic investment.
Moreover, improvements in the quality of services are mutually reinforcing, because services are mutually complementary in facilitating trade. Transport logistics is intensive in information and, thus, depends heavily on the efficiency of telecommunications and information technology. Fast and reliable processing of information is a prerequisite for the efficient flow of goods, since transport is �perishable��the spare capacity of a plane or ship cannot be sold once the trip has been made. Information flows in transportation are facilitated by a variety of ICT applications�such as inventory and warehouse management systems; route optimization; tracing and tracking software; and satellite-based fleet management systems.
MENA countries are still poorly integrated in global production sharing networks, as reflected by the small share of MENA countries in global FDI flows and trade. The share of components in manufactured exports remains far below that seen in other developing countries such as Singapore, Malaysia or Taiwan (Ng and Yeats, 2000). One exception is textile and clothing, especially reflecting Tunisia�s strong position in EU companies� outsourcing chains. Trade liberalization, especially in the countries that have signed the Association Agreements with the EU (Tunisia, Egypt, Morocco, Jordan, and most recently Algeria), will help MENA producers improve their competitiveness by purchasing inputs at internationally competitive cost. Moreover, MENA countries could be attractive locations for assembly operations due to low labor costs and a good quality of human resources. The decrease in tariffs on imported intermediate inputs, scheduled in the first stages of the Association Agreements, has the potential to increase trade in components across the Mediterranean and facilitate the integration of MENA countries into EU production networks. However, MENA has yet to rise to this challenge. Domestic weaknesses, due to the weak investment climate and the poor quality of backbone services that facilitate trade, dilute the potential advantages of MENA countries.
5
3. Assessing Market Openness in Telecommunications
Market openness in telecommunications is underpinned by three main factors: • degree of effective competition, • openness to FDI, • pro-competitive regulation and independence of the regulatory bodies.
The annex (Part A) presents a brief overview of the way these factors affect market
outcomes. While it is difficult to quantify and assess the importance of these variables in an econometric model, an attempt is made to capture some of the benefits associated to regulatory reform and independence. An indicator of telecommunications liberalization can be used as a benchmark of differences in market openness across countries and help assess the payoff of different regulatory reform options. The indicator covers 151 high-income and developing countries, with the regulatory status of the sector in 1998-99 serving as point of reference.3
The indicator combines four criteria of market openness and pro-competitive regulation. • Average degree of competition in the different segments of the fixed telephony network and
services (local; domestic long distance; international; leased lines). Competition indices in each segment range as follows: 1 for monopoly; 2 for partly competitive conditions; and 3 for full competition.
• Average degree of competition in the analogue and digital segments of the mobile telephony network and services. As for fixed telephony, competition indices in each segment range from 1 to 3, for monopoly, partly competitive, and competitive conditions.
• Openness to foreign direct investment in the fixed and mobile networks (1 if FDI is allowed in each case, 0 otherwise)
• Presence of an independent regulatory body (1 if yes), and extent of its powers in handling interconnection issues (1 if interconnection pricing is entrusted to the regulatory body, 0 otherwise).
The indicator of market openness is constructed by adding the country scores on each of
those four criteria. It ranges from 2 (least open) to 10 (full market openness). Depending on individual country scores (S), four broader categories are considered:
3 The data source is a 1998 ITU survey on Telecommunications regulation (http://www.itu.int/ITU-
D/treg/index.html). The data presently available does not allow to refine the indicator assessing the distinction between competition at a service provision level only, and competition at both network operation and service provision. Ideally we would define �partly competitive conditions� the degree of competition associated to services only, as opposed to network operation and services, or the presence of a duopoly on network and services. �Full competition� is when there would be free entry on both networks and services. Developing a more refined indicator could be the object of future research.
A. Restricted market access: S ≤ 3 B. Limited degree of market openness: 3 < S ≤ 5.5 C. Moderate market openness: 5.5 < S ≤ 7.5 D. Full market openness. 7.5 < S ≤ 10
6
Other indicators of liberalization in telecommunications include those developed by Mattoo et al. (2001) and Warren (2000). The present indicator is similar in spirit to those developed earlier, but incorporates two additional elements: First, it includes a separate assessment of market openness in the mobile and fixed segments of the market. Second, it includes as a separate factor the regulatory body�s effective power in handling interconnection pricing. Excessive market power of the incumbent operator in setting interconnection prices has often preempted competition in otherwise liberalized telecommunications markets.
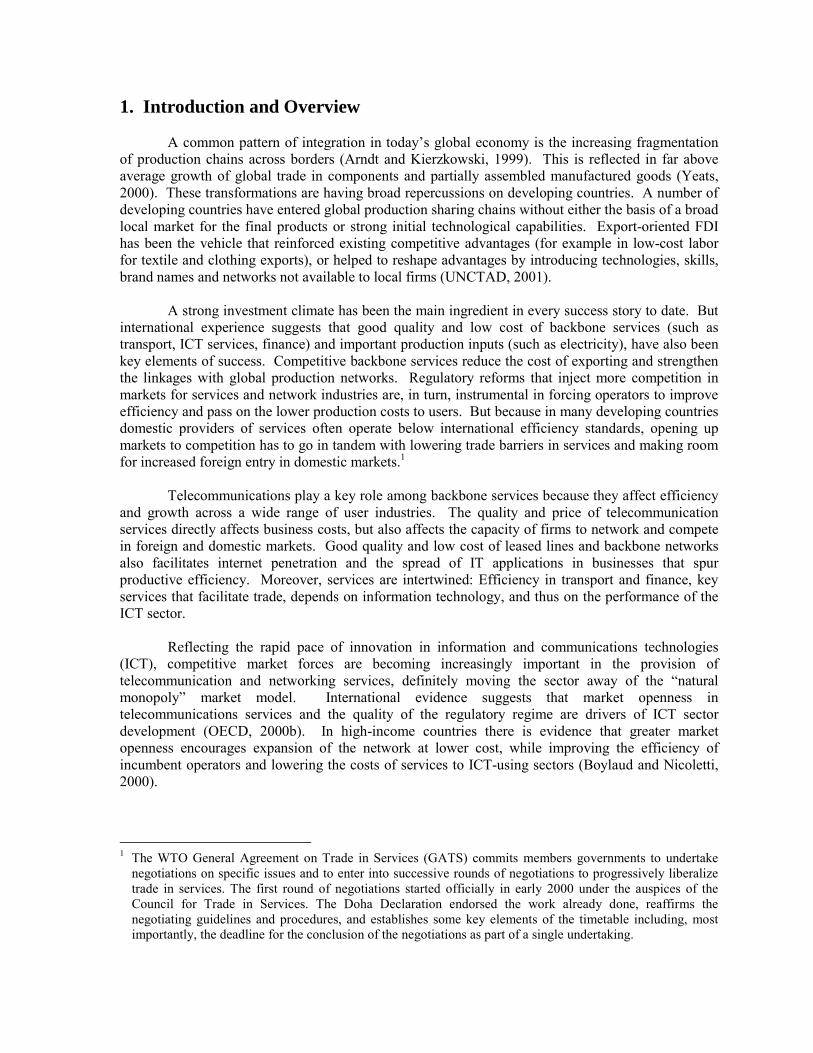
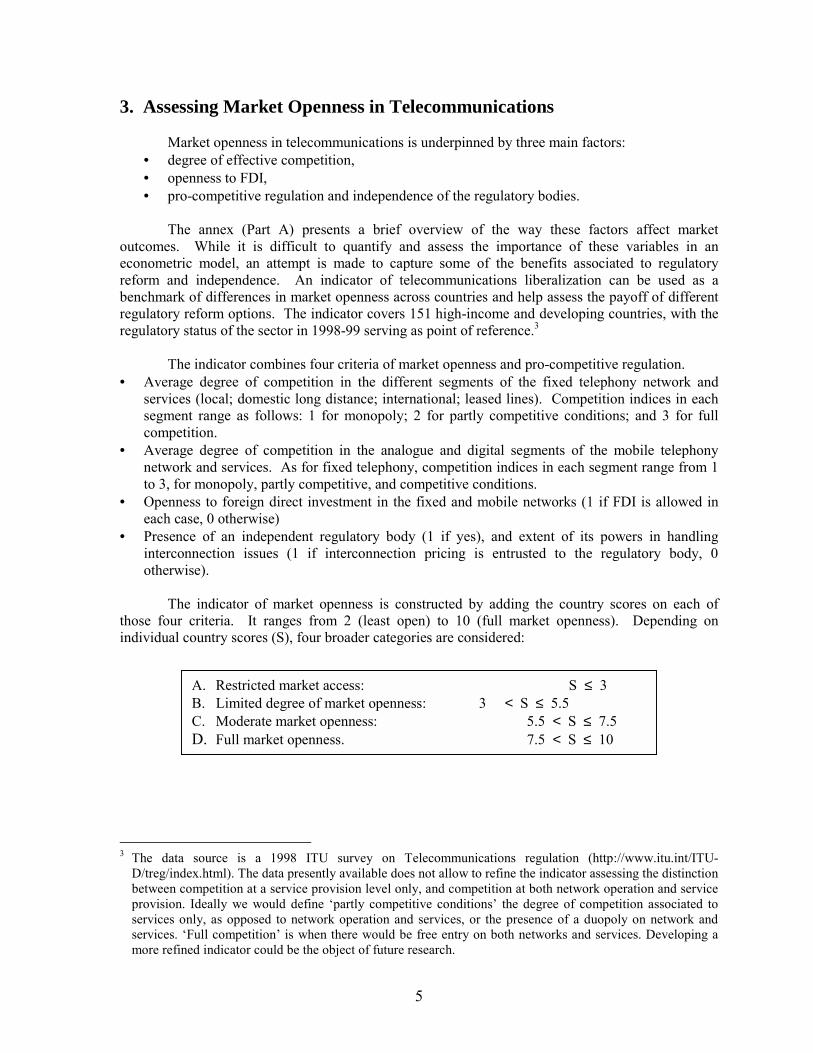
High-income countries have taken the lead in telecommunications liberalization. But opening up of telecommunications markets to competition has been ambitious in many developing countries as well (Cowhey and Klimenko, 2000). Countries in Latin America have been ahead of others, closely followed by countries in South Asia and in East Asia and the Pacific. By contrast, regulatory reform in telecommunications has been slow in MENA, where markets remain less competitive than elsewhere in the developing world (Figure 1.a).
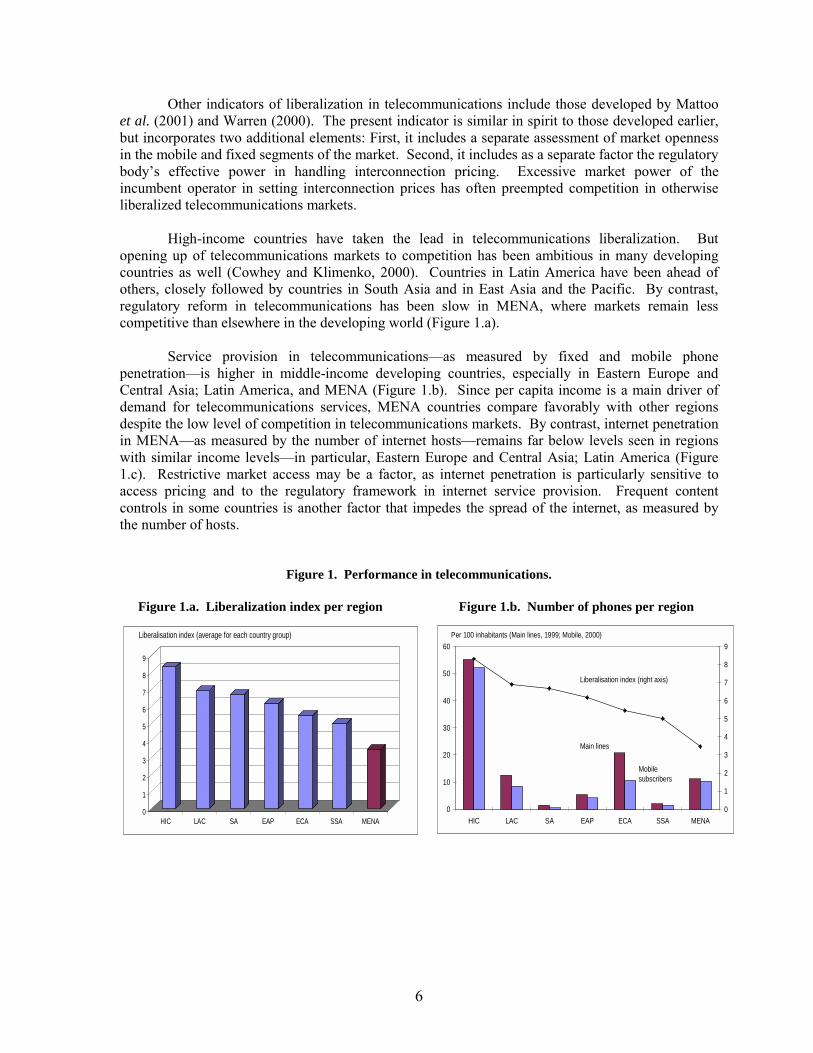
Service provision in telecommunications�as measured by fixed and mobile phone penetration�is higher in middle-income developing countries, especially in Eastern Europe and Central Asia; Latin America, and MENA (Figure 1.b). Since per capita income is a main driver of demand for telecommunications services, MENA countries compare favorably with other regions despite the low level of competition in telecommunications markets. By contrast, internet penetration in MENA�as measured by the number of internet hosts�remains far below levels seen in regions with similar income levels�in particular, Eastern Europe and Central Asia; Latin America (Figure 1.c). Restrictive market access may be a factor, as internet penetration is particularly sensitive to access pricing and to the regulatory framework in internet service provision. Frequent content controls in some countries is another factor that impedes the spread of the internet, as measured by the number of hosts.
Figure 1. Performance in telecommunications.
Figure 1.a. Liberalization index per region Figure 1.b. Number of phones per region
0
1
2
3
4
5
6
7
8
9
HIC LAC SA EAP ECA SSA MENA
Liberalisation index (average for each country group)
0
10
20
30
40
50
60
HIC LAC SA EAP ECA SSA MENA0
1
2
3
4
5
6
7
8
9
Main lines
Mobile subscribers
Liberalisation index (right axis)
Per 100 inhabitants (Main lines, 1999; Mobile, 2000)
7
Figure 1.c. Number of Internet hosts per region Figure 1.d. Number of phones per country
Source: Authors� calculations.
Across MENA countries, telecommunications markets are more competitive in Israel and Morocco, while Bahrain, Egypt, Jordan, and Lebanon fall into the upper range of countries that ensure a limited degree of market openness (Figure 1d).4 Market access is restricted in all other countries, due to various regulatory impediments to entry and competition. However, despite lack of competition, high-income MENA countries, such as Kuwait and Oman, outperform in terms of fixed and mobile line penetration.
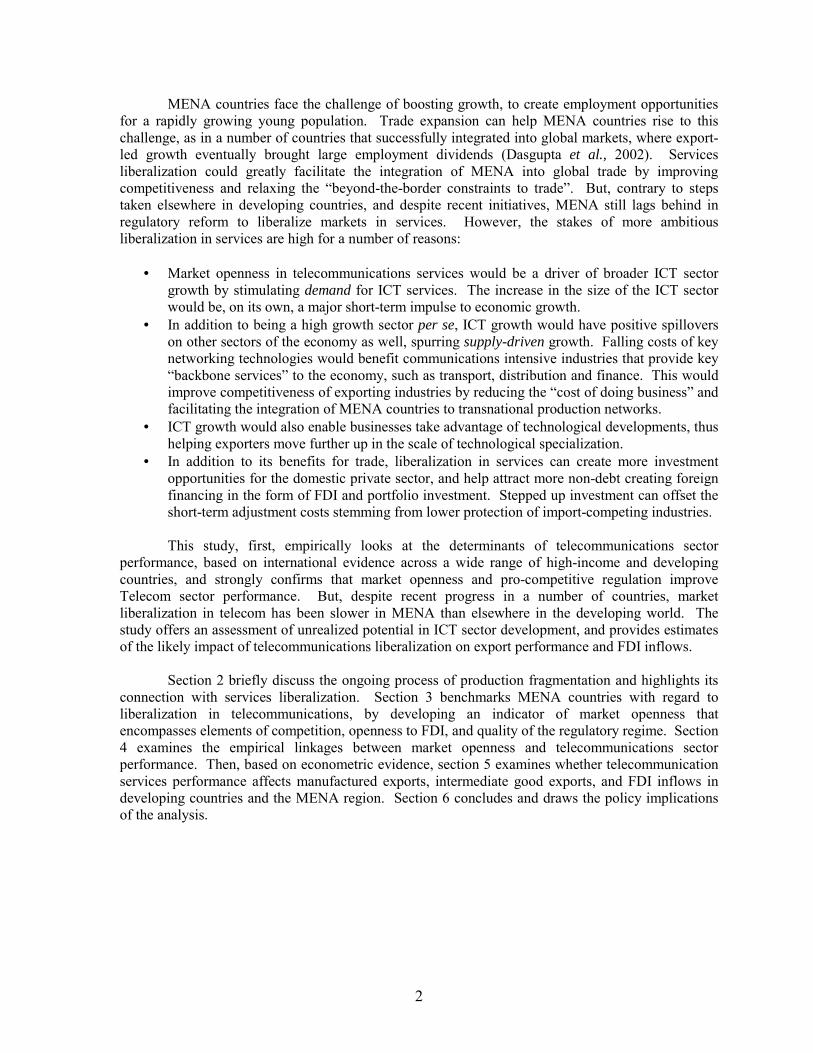
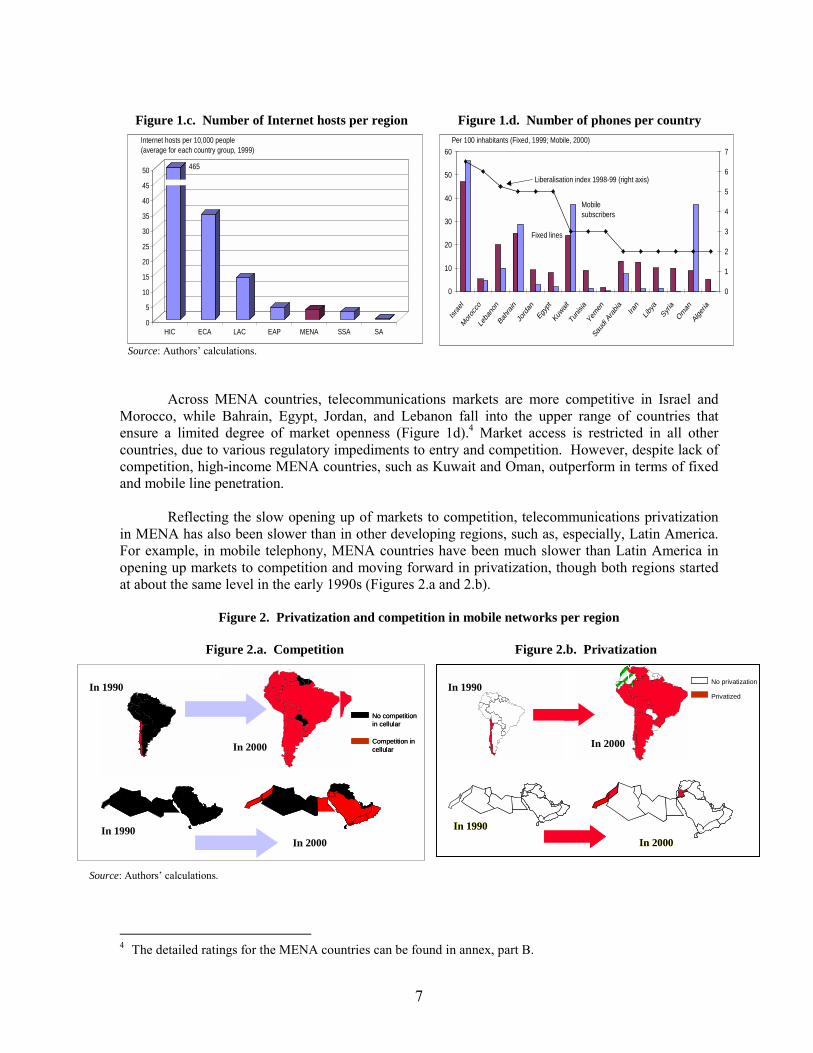
Reflecting the slow opening up of markets to competition, telecommunications privatization in MENA has also been slower than in other developing regions, such as, especially, Latin America. For example, in mobile telephony, MENA countries have been much slower than Latin America in opening up markets to competition and moving forward in privatization, though both regions started at about the same level in the early 1990s (Figures 2.a and 2.b).
Figure 2. Privatization and competition in mobile networks per region
Figure 2.a. Competition Figure 2.b. Privatization
Source: Authors� calculations.
4 The detailed ratings for the MENA countries can be found in annex, part B.
Competition incellularIn 2000
No competition in cellular
In 2000
Competition incellularIn 2000
In 1990
No competition in cellular
In 1990
In 2000
In 1990 No privatization
In 1990In 2000
Privatized
In 2000 In 2000
In 1990 No privatization
In 1990 In 2000
0
5
10
15
20
25
30
35
40
45
50
HIC ECA LAC EAP MENA SSA SA
Internet hosts per 10,000 people(average for each country group, 1999)
465
0
10
20
30
40
50
60
Israe
l
Moroc
co
Leba
non
Bahrain
Jord
anEg
ypt
Kuwait
Tunis
ia
Yemen
Saud
i Ara
bia Iran
Libya
Syria
Oman
Alge
ria
0
1
2
3
4
5
6
7
Liberalisation index 1998-99 (right axis)
Mobile subscribers
Fixed lines
Per 100 inhabitants (Fixed, 1999; Mobile, 2000)
8
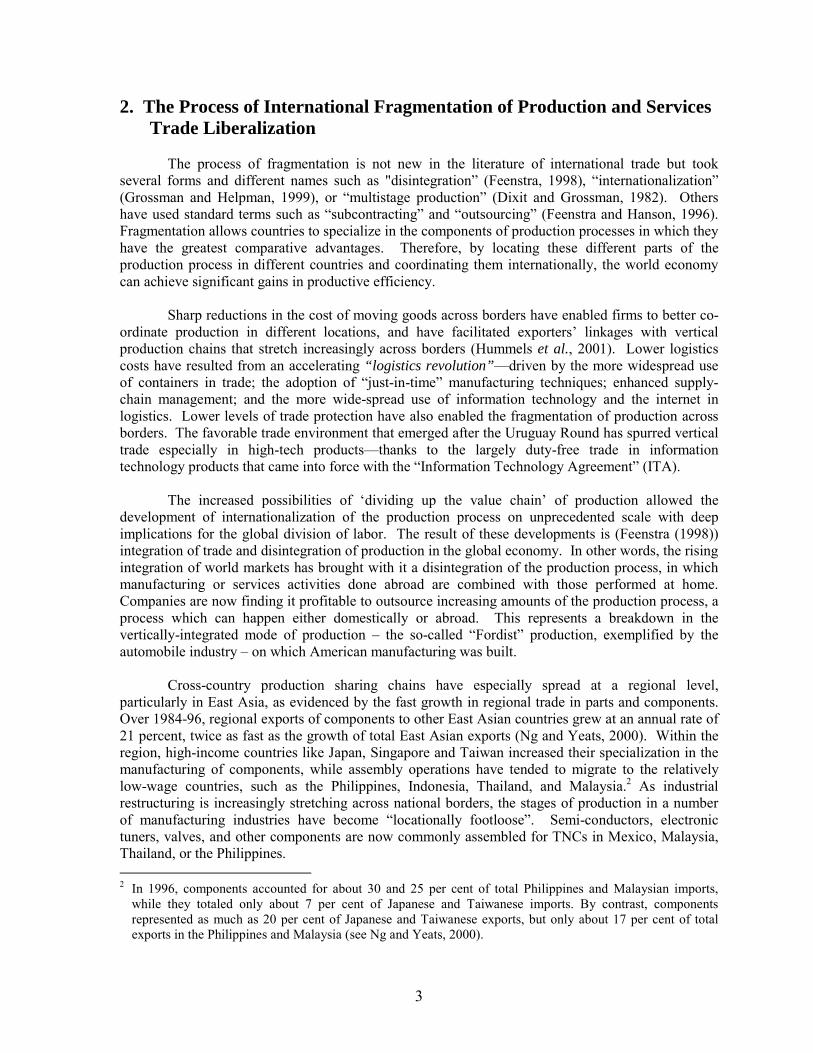
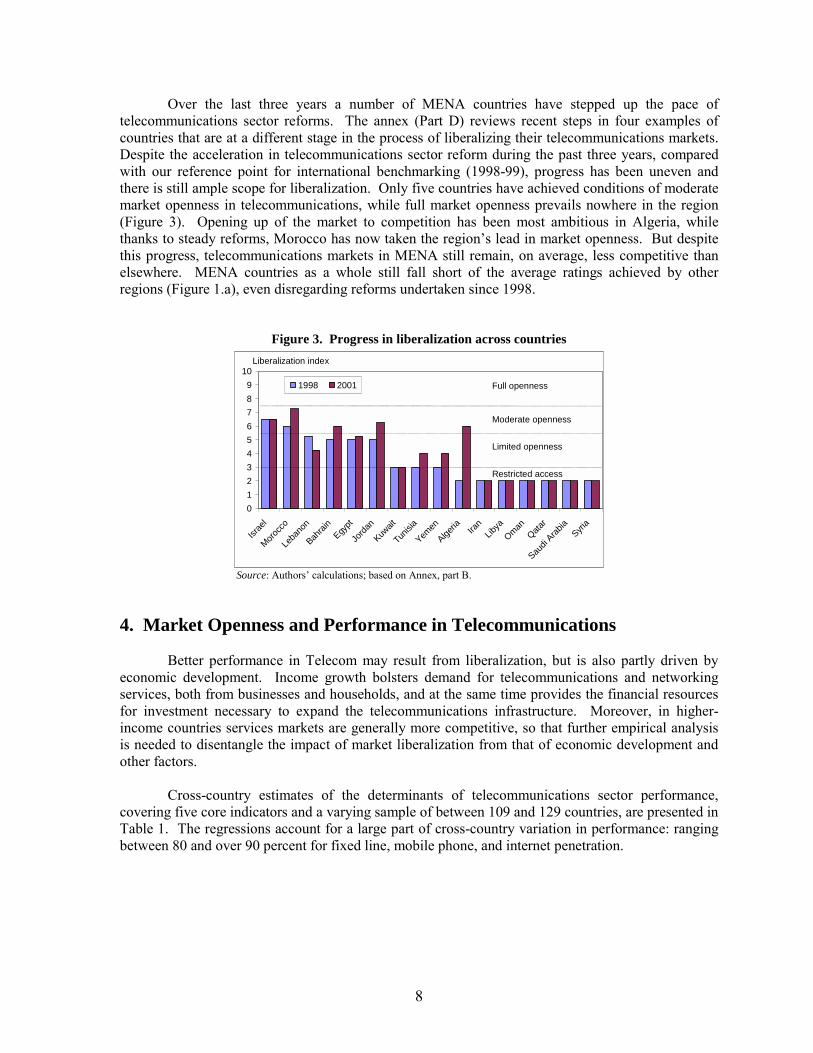
Over the last three years a number of MENA countries have stepped up the pace of telecommunications sector reforms. The annex (Part D) reviews recent steps in four examples of countries that are at a different stage in the process of liberalizing their telecommunications markets. Despite the acceleration in telecommunications sector reform during the past three years, compared with our reference point for international benchmarking (1998-99), progress has been uneven and there is still ample scope for liberalization. Only five countries have achieved conditions of moderate market openness in telecommunications, while full market openness prevails nowhere in the region (Figure 3). Opening up of the market to competition has been most ambitious in Algeria, while thanks to steady reforms, Morocco has now taken the region�s lead in market openness. But despite this progress, telecommunications markets in MENA still remain, on average, less competitive than elsewhere. MENA countries as a whole still fall short of the average ratings achieved by other regions (Figure 1.a), even disregarding reforms undertaken since 1998.
Figure 3. Progress in liberalization across countries
Source: Authors� calculations; based on Annex, part B.
4. Market Openness and Performance in Telecommunications
Better performance in Telecom may result from liberalization, but is also partly driven by economic development. Income growth bolsters demand for telecommunications and networking services, both from businesses and households, and at the same time provides the financial resources for investment necessary to expand the telecommunications infrastructure. Moreover, in higher-income countries services markets are generally more competitive, so that further empirical analysis is needed to disentangle the impact of market liberalization from that of economic development and other factors.
Cross-country estimates of the determinants of telecommunications sector performance, covering five core indicators and a varying sample of between 109 and 129 countries, are presented in Table 1. The regressions account for a large part of cross-country variation in performance: ranging between 80 and over 90 percent for fixed line, mobile phone, and internet penetration.
0123456789
10
Israe
l
Morocc
o
Leba
non
Bahrai
nEgy
pt
Jorda
n
Kuwait
Tunisia
Yemen
Algeria Ira
nLib
yaOman
Qatar
Saudi
Arabia
Syria
1998 2001
Liberalization index
Restricted access
Limited openness
Moderate openness
Full openness
9
Table 1. Cross-country differences in telecommunications performance: empirical estimates (Estimation period: 1999)
Fixed
phone
(1)
Mobile phone
(2)
Internet hosts
(3)
Share of telecom
revenues in GDP (4)
Productivity: telecom
revenue per employee
(5)
Productivity: fixed lines
per employee
(6) Independent variable Intercept -4.78
(5.7) -10.8 (9.3)
-15.8 (8.1)
0.66 (1.0)
5.03 (10.7)
-0.69 (2.1)
Per capita GDPPC 0.80 (7.5)
1.58 (19.6)
2.42 (17.8)
0.09 (1.7)
0.66 (11.1)
0.55 (13.7)
Population -0.07 (2.1)
-0.17 (2.8)
-0.32 (3.5)
-0.07 (2.4)
Population density 0.12 (2.0)
0.05 (1.7)
0.05 (1.6)
Enrolment in higher education
0.41 (4.7)
Openness indicator 0.35 (3.4)
0.70 (3.4)
0.12 (2.1)
0.15 (2.5)
0.12 (2.8)
Mobile Phone 0.14 (2.9)
Dummies:
Transition economies 0.75 (4.8)
0.68 (1.7)
-1.64 (7.8)
OPEC -1.64 (3.0)
0.47 (3.0)
0.62 (4.3)
Small economies 0.77 (2.3)
-0.30 (2.1)
Adjusted R2 0.914 0.824 0.859 0.243 0.702 0.689 Observations 129 123 109 120 129 133
Note: Method of estimation: Ordinary Least Squares, with White Heteroskedasticity-Consistent Standard Errors and Covariances; Student�s statistics in parentheses; Fixed phone, mobile phone and internet hosts are per 10,000 people. Dependent and explanatory variables are in log. except dummies and the openness indicator. Source: Authors� calculations.
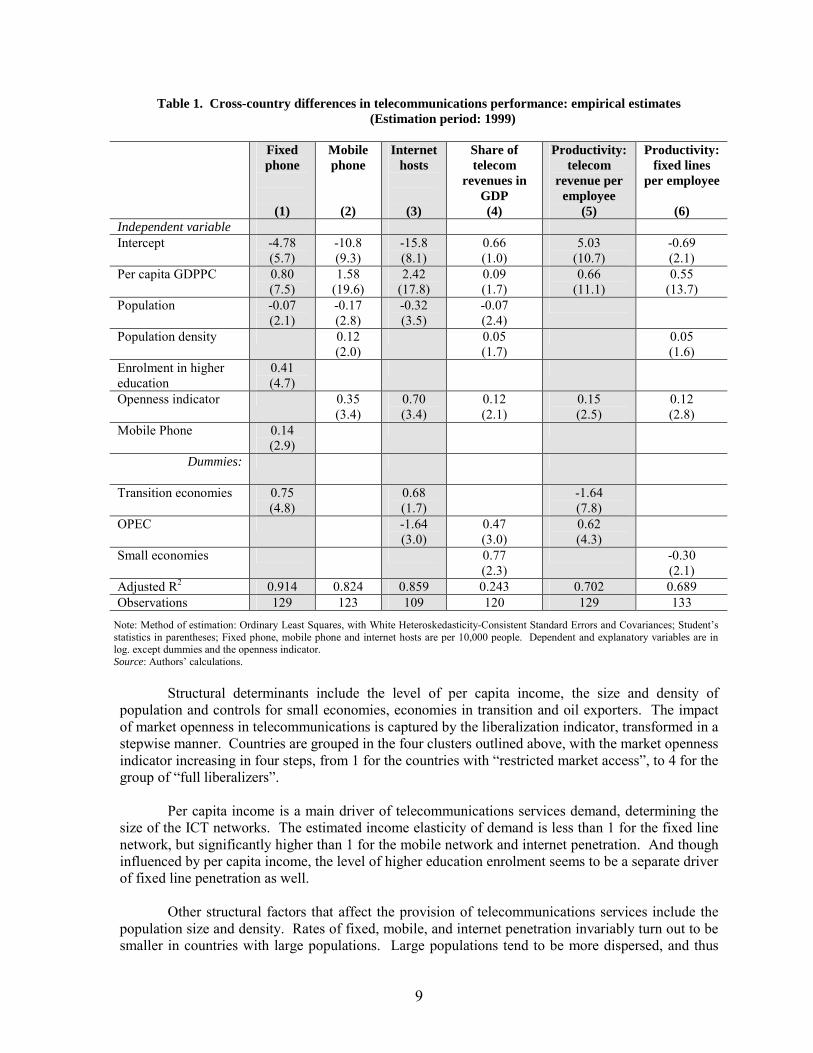
Structural determinants include the level of per capita income, the size and density of population and controls for small economies, economies in transition and oil exporters. The impact of market openness in telecommunications is captured by the liberalization indicator, transformed in a stepwise manner. Countries are grouped in the four clusters outlined above, with the market openness indicator increasing in four steps, from 1 for the countries with �restricted market access�, to 4 for the group of �full liberalizers�.
Per capita income is a main driver of telecommunications services demand, determining the size of the ICT networks. The estimated income elasticity of demand is less than 1 for the fixed line network, but significantly higher than 1 for the mobile network and internet penetration. And though influenced by per capita income, the level of higher education enrolment seems to be a separate driver of fixed line penetration as well.
Other structural factors that affect the provision of telecommunications services include the population size and density. Rates of fixed, mobile, and internet penetration invariably turn out to be smaller in countries with large populations. Large populations tend to be more dispersed, and thus
10
harder to cover by ICT networks. By contrast, a high population density seems to be a factor of better mobile phone penetration, as density is higher in urban areas where mobile networks are easier to build.5
Increased market competition boosts demand for fixed and mobile telephone services by lowering prices to users. This is more evident in the case of the mobile network, the size of which increases in step with market openness after accounting for other country-specific structural characteristics. And though there is no evidence of a direct impact of liberalization on fixed line penetration, the increase in the size of the mobile network is indirectly associated with a greater size of the fixed network (eq.1; Table 1). This could reflect positive network externalities, as cheaper mobile communications and broader network coverage are also likely to create incentives for incumbent fixed-line operators to lower prices, introduce new services, and improve efficiency (Rossotto et al., 1999).
Policies that inject more competition in areas such as leased lines and backbone networks, along with appropriate pricing policies designed to stimulate demand, are key in supporting internet penetration and broader ICT sector development (OECD, 2000a). After accounting for other structural factors, the spread of the internet�as measured by the relative number of internet hosts�turns out to be greater in countries with greater market openness in telecommunications (eq. 3; Table 1).
Greater market openness also props up expenditure on telecommunications, by lowering prices to consumers and thus bolstering demand, and also by expanding the size of the networks and the array of services offered to users. The evidence seems to confirm that increased market openness is indeed associated with a greater size of the telecommunications sector as measured by the share of Telecommunications revenues in GDP (eq.4; Table 1).
Injecting greater competition in telecommunication services can also increase the efficiency by which labor and capital are employed in telecommunications. The estimates suggest that greater competition is associated with increased productivity of labor in telecommunications as measured by revenues per employee (eq.5; Table 1). Market openness turns out to significantly affect productivity in telecommunications after controlling for other enabling factors that vary across countries, as captured by differences in per capita GDP. This positive impact is robust to alternative �physical measures� of productivity of labor in telecommunications as, for example, the number of main lines per employee. Physical productivity is also found to increase along with greater market openness, after controlling for other structural determinants captured by differences in per capita GDP (eq.6; Table 1).
Higher productivity in turn reduces costs and creates room for lowering the prices of telecommunication services, while competition forces declining margins, with operators passing much of the cost savings to the users. Potential gains could be sizeable: Moving from �restricted market access� to �full market openness� could boost labor productivity in the telecommunications sector (according to the measure in eq.5) by as much as 60 percent. Assuming a similar increase in capital productivity, and taking as benchmark calculations made for developed countries, the increase in efficiency could lower telecommunications costs by as much as 50 percent.6
5 Fixed telephone networks in transition economies in Eastern Europe and Central Asia also turn out to be
larger than would have been expected on the basis of their per capita income and population, as these countries had considerably invested in public utilities in the past (eq. 1; table 2).
6 Estimations of the potential impact of regulatory reform in telecommunications for eight industrial economies are reported in OECD, 1997, Chap. 1, and also in Blondal and Pilat, 1997. In the case, for example, of France,
11
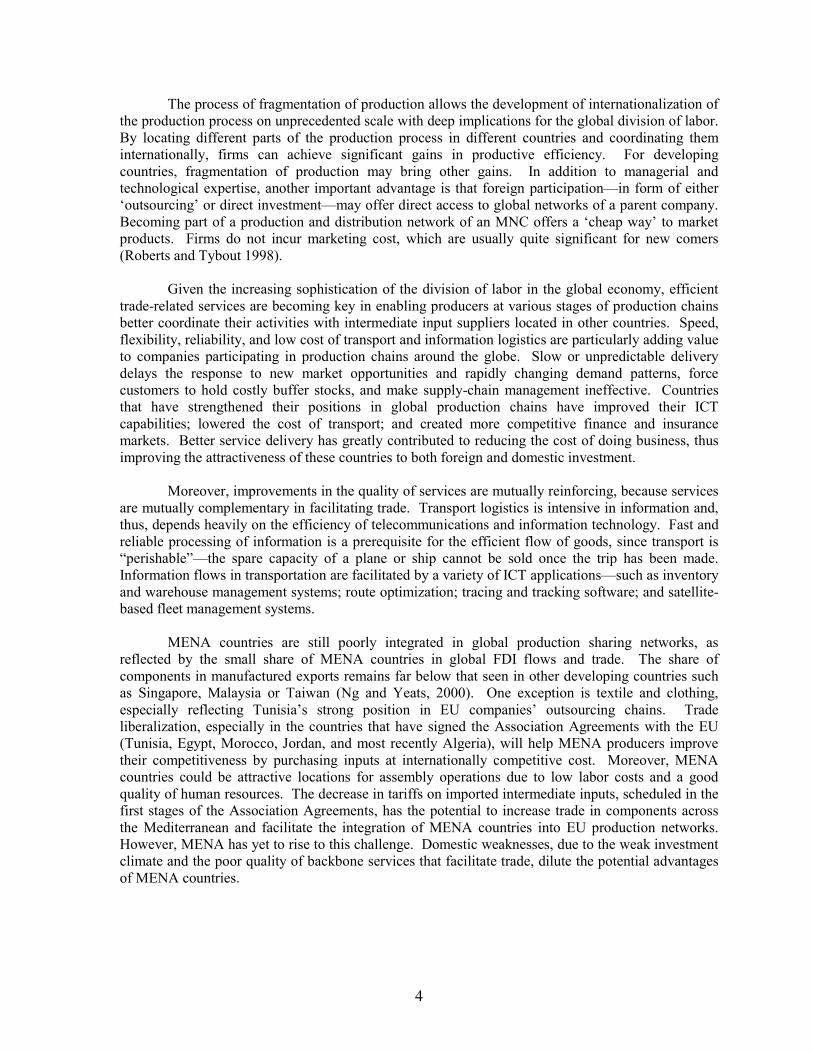
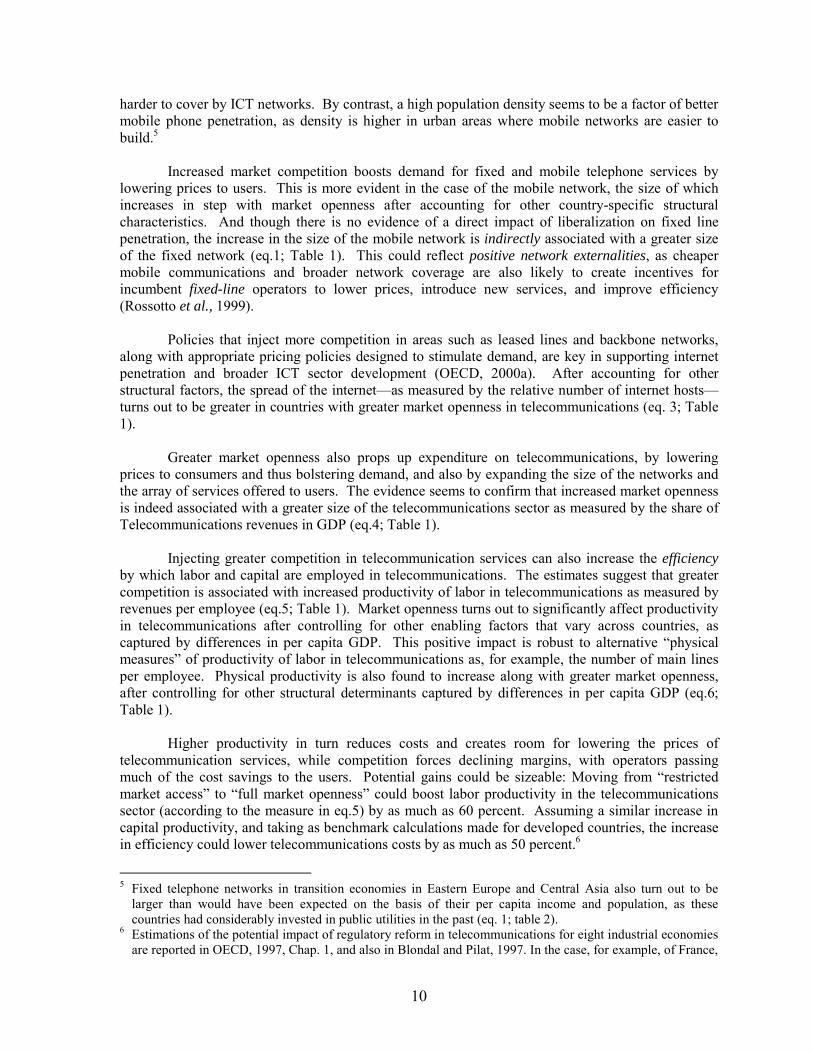
Using the above estimates, one can assess the potential for development of telecommunications in the region. Starting with mobiles, despite the already adequate rates of mobile penetration in MENA (Figure 1.b), there is still considerable scope for a more competitive environment to further boost the size of the mobile phone networks. Full market openness could�all else equal�boost mobile penetration by about 2 percentage points on average across MENA countries (Figure 4.a). Improvement of living standards would further foster mobile penetration. Because of the high income elasticity of demand (eq.2; Table 1), a baseline trend of 2 percent annual real per capita income growth over a 5-year period could boost mobile penetration by a further 2 percentage points. Thus in a relatively short period of time mobile penetration could increase on average by as much as 50 percent across MENA.
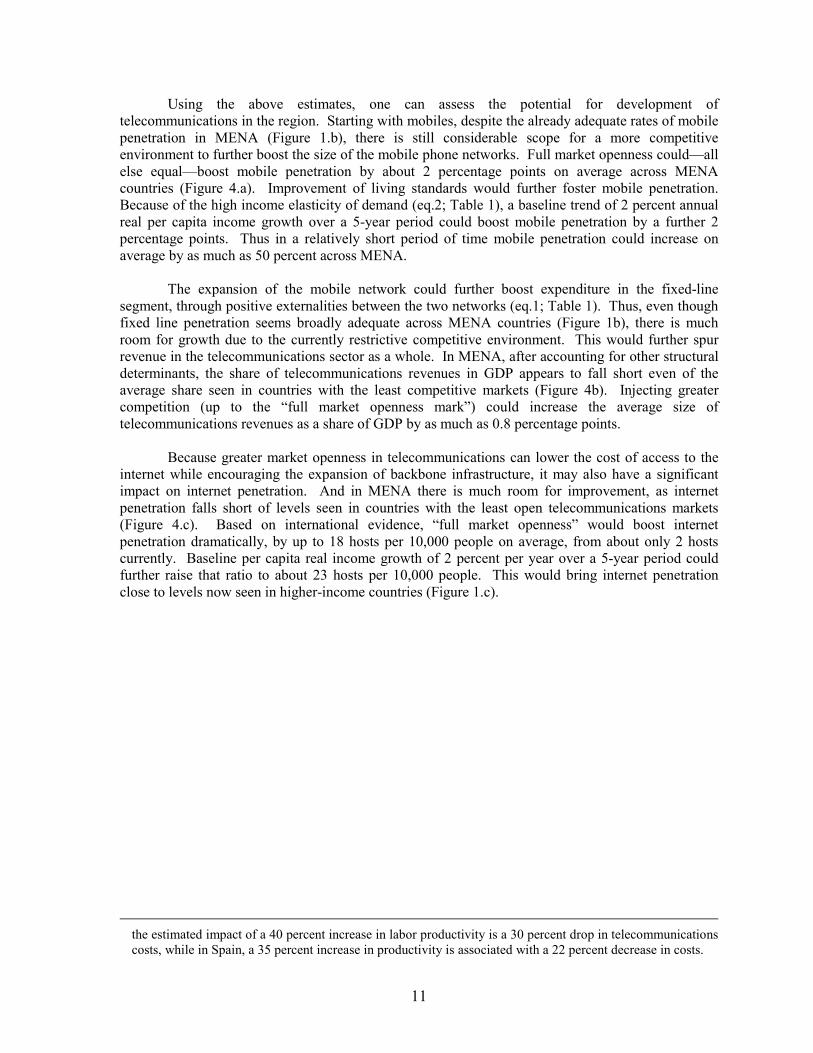
The expansion of the mobile network could further boost expenditure in the fixed-line segment, through positive externalities between the two networks (eq.1; Table 1). Thus, even though fixed line penetration seems broadly adequate across MENA countries (Figure 1b), there is much room for growth due to the currently restrictive competitive environment. This would further spur revenue in the telecommunications sector as a whole. In MENA, after accounting for other structural determinants, the share of telecommunications revenues in GDP appears to fall short even of the average share seen in countries with the least competitive markets (Figure 4b). Injecting greater competition (up to the �full market openness mark�) could increase the average size of telecommunications revenues as a share of GDP by as much as 0.8 percentage points.
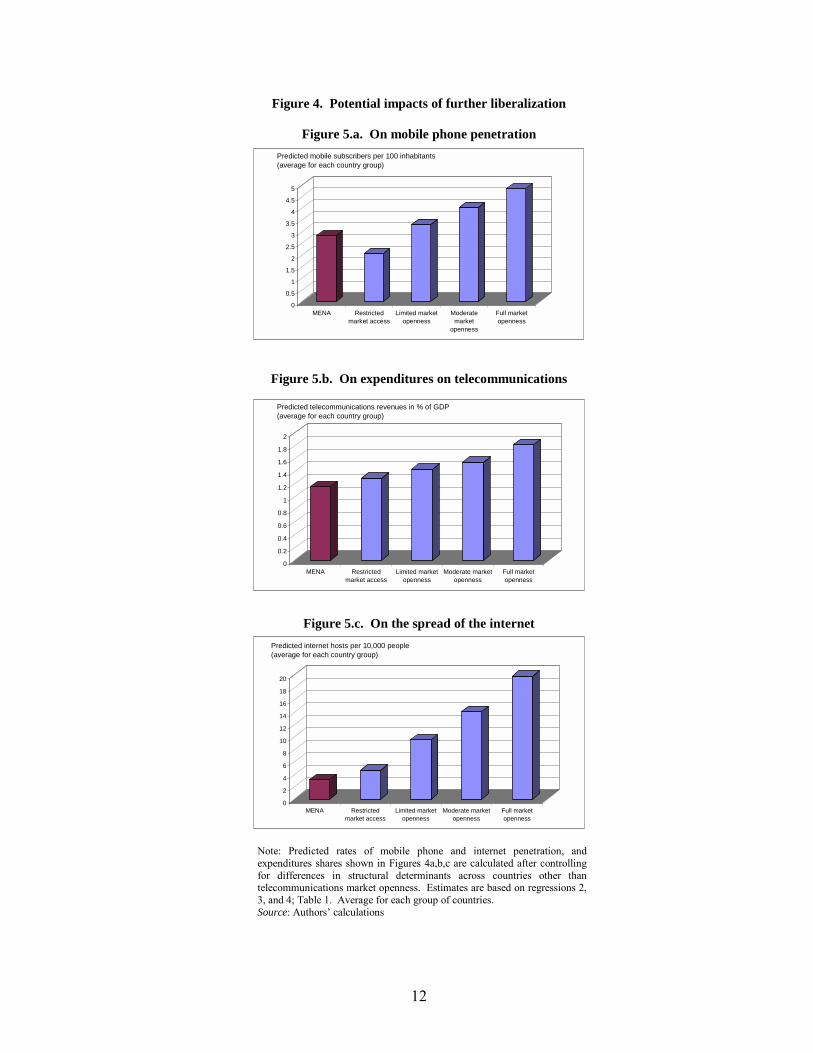
Because greater market openness in telecommunications can lower the cost of access to the internet while encouraging the expansion of backbone infrastructure, it may also have a significant impact on internet penetration. And in MENA there is much room for improvement, as internet penetration falls short of levels seen in countries with the least open telecommunications markets (Figure 4.c). Based on international evidence, �full market openness� would boost internet penetration dramatically, by up to 18 hosts per 10,000 people on average, from about only 2 hosts currently. Baseline per capita real income growth of 2 percent per year over a 5-year period could further raise that ratio to about 23 hosts per 10,000 people. This would bring internet penetration close to levels now seen in higher-income countries (Figure 1.c).
the estimated impact of a 40 percent increase in labor productivity is a 30 percent drop in telecommunications costs, while in Spain, a 35 percent increase in productivity is associated with a 22 percent decrease in costs.
12
Figure 4. Potential impacts of further liberalization
Figure 5.a. On mobile phone penetration
Figure 5.b. On expenditures on telecommunications
Figure 5.c. On the spread of the internet
Note: Predicted rates of mobile phone and internet penetration, and expenditures shares shown in Figures 4a,b,c are calculated after controlling for differences in structural determinants across countries other than telecommunications market openness. Estimates are based on regressions 2, 3, and 4; Table 1. Average for each group of countries. Source: Authors� calculations
0
0.5
1
1.5
2
2.5
3
3.5
4
4.5
5
MENA Restrictedmarket access
Limited marketopenness
Moderatemarket
openness
Full marketopenness
Predicted mobile subscribers per 100 inhabitants (average for each country group)
0
0.2
0.4
0.6
0.8
1
1.2
1.4
1.6
1.8
2
MENA Restrictedmarket access
Limited marketopenness
Moderate marketopenness
Full marketopenness
Predicted telecommunications revenues in % of GDP (average for each country group)
0
2
4
6
8
10
12
14
16
18
20
MENA Restrictedmarket access
Limited marketopenness
Moderate marketopenness
Full marketopenness
Predicted internet hosts per 10,000 people(average for each country group)
13
The demand-driven expansion in the size of the various segments of the ICT sector would be, on its own, a major stimulus to growth. But it would also generate multiplier effects on the economy, as the increase in ICT output would stimulate ICT sector investment, funneling demand for the output of other industries as well. For example, in the case of Tunisia, it has been estimated that broad-based ICT sector development, spurred by domestic demand and exports, could boost annual GDP growth by about 1.7 percent over a 5-year period, following opening up of the sector to competition (World Bank, 2001). Cross-country estimates also confirm that telecommunications liberalization is associated with higher growth rates in the long run (Mattoo et al, 2001). 5. Telecommunications Performance and Participation in the World Economy In this section we examine the potential impact of improved performance in telecommunications on MENA participation in the World economy. The later is assessed with respect to three indicators: manufactured exports, intermediate good exports and FDI inflows to the region.
Regarding exports, we rely on a specification suggested by Sekkat and Varoudakis (2000). It relates the ratio of manufactured exports to GDP (in log.) to the GDP growth rate of main trading partners and the (log. of) real effective exchange rate.7 Note that the real effective exchange rate is measured such as an increase implies an appreciation of the exporter�s currency. We add to the original specification a telecommunication performance indicator as an explanatory variable. This is the first principal components of four telecommunication indicators8: Cost of 3 minutes local call in $, number of fixed phone, waiting list and number of mobile phone. All these variables are in log. and the last three are per 1000 inhabitants. Using the ratio of exports to GDP as a dependent variable avoids the problems due to the difference in countries� sizes. As far as the determinants of export supply are concerned, the GDP growth rate of main trading partners captures the role of foreign demand. Its coefficient should, therefore, be positive: an increase in demand is beneficial to exports. As an appreciation of the exporter�s currency should harm exports the coefficient of the real effective exchange rate is expected to be negative. Finally, we expect the coefficient of telecommunication performance indicator to be positive because well-performing telecommunication services should strengthen links with global production networks and, thus, help improving export performance in manufacturing. The estimation is conducted on a panel of developing countries and combines cross-section and time series data. The series of GDP, manufactured exports, trading partner growth rate and real exchange rate are drawn from the World Development Indicators. Telecommunication series are drawn from World Telecommunication Indicators. The sample includes annual data for 37 developing countries. The period of observation is 1990 - 1999. We use panel data econometric methodology: tests of fixed and random effects are conducted to select the most adequate models. The estimates are heteroskedastic consistent.
7 This is a traditional specification in the literature. It may be derived from a formal model of export supply in
LDCs. 8 This component explains 54 percent of the total variance. The loading factors are 0.93, 0.83, -0.36 and 0.67
for the fix, wait, cost and mobile respectively.
14
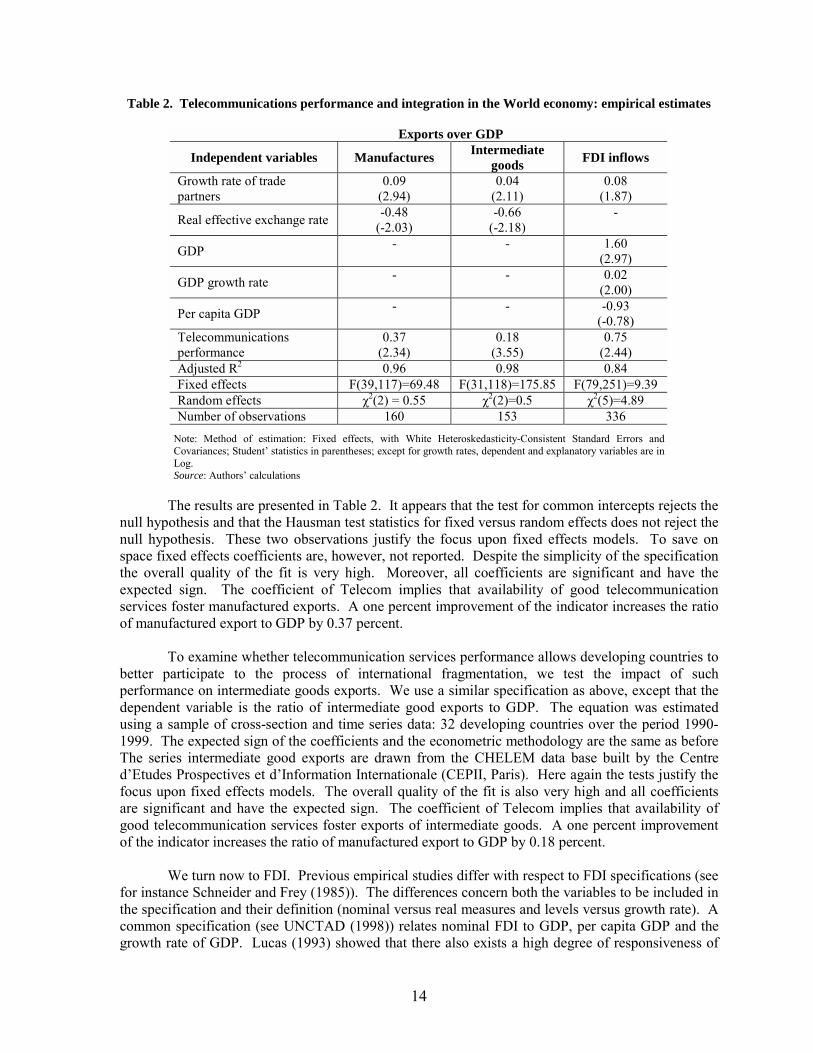
Table 2. Telecommunications performance and integration in the World economy: empirical estimates
Exports over GDP
Independent variables Manufactures Intermediate goods FDI inflows
Growth rate of trade partners
0.09 (2.94)
0.04 (2.11)
0.08 (1.87)
Real effective exchange rate -0.48 (-2.03)
-0.66 (-2.18)
-
GDP - - 1.60 (2.97)
GDP growth rate - - 0.02 (2.00)
Per capita GDP - - -0.93 (-0.78)
Telecommunications performance
0.37 (2.34)
0.18 (3.55)
0.75 (2.44)
Adjusted R2 0.96 0.98 0.84 Fixed effects F(39,117)=69.48 F(31,118)=175.85 F(79,251)=9.39 Random effects χ2(2) = 0.55 χ2(2)=0.5 χ2(5)=4.89 Number of observations 160 153 336
Note: Method of estimation: Fixed effects, with White Heteroskedasticity-Consistent Standard Errors and Covariances; Student� statistics in parentheses; except for growth rates, dependent and explanatory variables are in Log. Source: Authors� calculations
The results are presented in Table 2. It appears that the test for common intercepts rejects the null hypothesis and that the Hausman test statistics for fixed versus random effects does not reject the null hypothesis. These two observations justify the focus upon fixed effects models. To save on space fixed effects coefficients are, however, not reported. Despite the simplicity of the specification the overall quality of the fit is very high. Moreover, all coefficients are significant and have the expected sign. The coefficient of Telecom implies that availability of good telecommunication services foster manufactured exports. A one percent improvement of the indicator increases the ratio of manufactured export to GDP by 0.37 percent.
To examine whether telecommunication services performance allows developing countries to better participate to the process of international fragmentation, we test the impact of such performance on intermediate goods exports. We use a similar specification as above, except that the dependent variable is the ratio of intermediate good exports to GDP. The equation was estimated using a sample of cross-section and time series data: 32 developing countries over the period 1990-1999. The expected sign of the coefficients and the econometric methodology are the same as before The series intermediate good exports are drawn from the CHELEM data base built by the Centre d�Etudes Prospectives et d�Information Internationale (CEPII, Paris). Here again the tests justify the focus upon fixed effects models. The overall quality of the fit is also very high and all coefficients are significant and have the expected sign. The coefficient of Telecom implies that availability of good telecommunication services foster exports of intermediate goods. A one percent improvement of the indicator increases the ratio of manufactured export to GDP by 0.18 percent.
We turn now to FDI. Previous empirical studies differ with respect to FDI specifications (see
for instance Schneider and Frey (1985)). The differences concern both the variables to be included in the specification and their definition (nominal versus real measures and levels versus growth rate). A common specification (see UNCTAD (1998)) relates nominal FDI to GDP, per capita GDP and the growth rate of GDP. Lucas (1993) showed that there also exists a high degree of responsiveness of
15
FDI to incomes in major export markets. We, therefore, use these variables together with the telecommunication performance indicator to explain FDI inflows. Except for growth rates all variables are in log.
The GDP captures the size of the host country�s internal market. A higher GDP is assumed to imply better market opportunity of the host country and then more attractiveness for FDI. The per capita GDP is related to the wealth of the resident of the host country and then to demand effectiveness. A higher real GDP per capita is assumed to imply better market opportunity of the host country and then more attractiveness for FDI. The GDP growth rate reflects the dynamism of the host country and its future market size. An increase in the growth rate of real GDP characterizes a dynamic economy which may be more attractive for investors. An increase of the real GDP of trading partners implies good export opportunity of the host country and similarly may improve attractiveness for FDI. Finally, good telecommunication services are assumed to facilitate integration into cross-border production networks, thus creating a supporting environment for investment. In sum all coefficients are expected to be positive. The FDI equation was estimated using a sample of cross-section and time series data. The data sources are the same as before. The sample includes annual data for 71 developing countries. The period of observation is 1990-99. We use the same econometric methodology as before. The fixed effects and the Hausman tests suggest focusing on fixed effects models. Although lower than for the exports equation, the overall quality of the fit remains high. All coefficients have the expected sign. However, per capita GDP is not significant. The coefficient of Telecom implies that availability of good telecommunication services increases the host country attractiveness with respect to FDI. A one percent improvement of the indicator increases FDI by 0.75 percent.
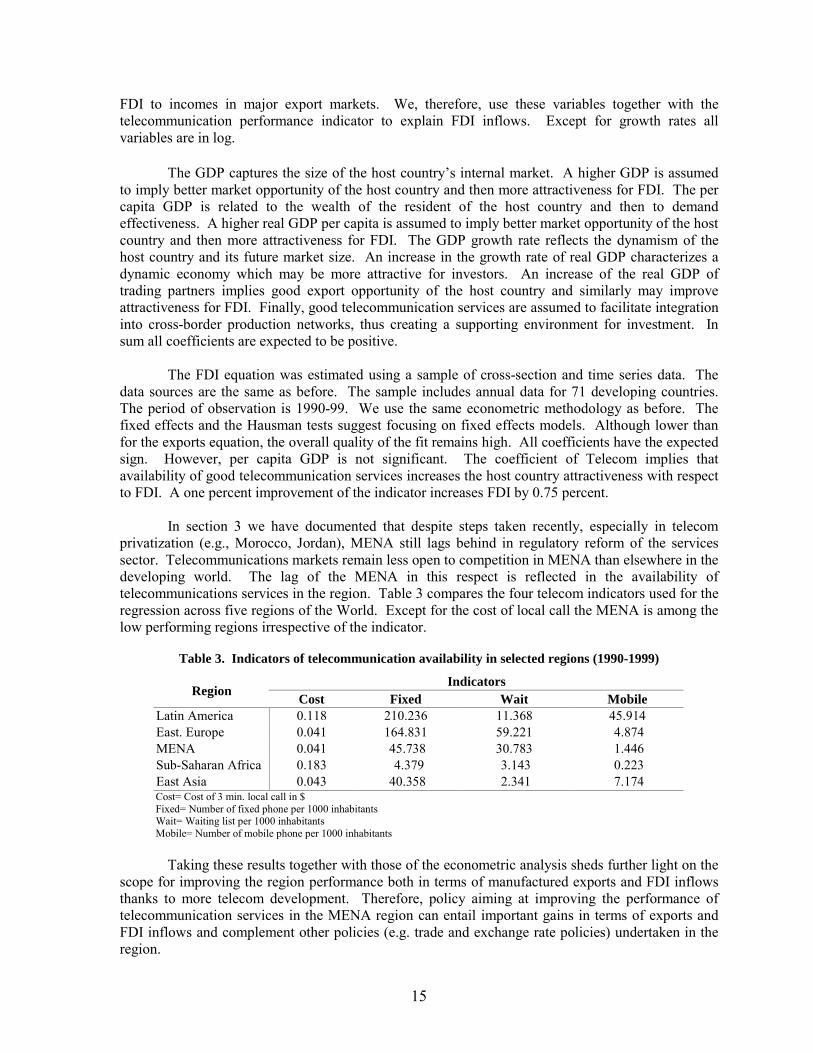
In section 3 we have documented that despite steps taken recently, especially in telecom privatization (e.g., Morocco, Jordan), MENA still lags behind in regulatory reform of the services sector. Telecommunications markets remain less open to competition in MENA than elsewhere in the developing world. The lag of the MENA in this respect is reflected in the availability of telecommunications services in the region. Table 3 compares the four telecom indicators used for the regression across five regions of the World. Except for the cost of local call the MENA is among the low performing regions irrespective of the indicator.
Table 3. Indicators of telecommunication availability in selected regions (1990-1999)
Indicators Region Cost Fixed Wait Mobile
Latin America 0.118 210.236 11.368 45.914 East. Europe 0.041 164.831 59.221 4.874 MENA 0.041 45.738 30.783 1.446 Sub-Saharan Africa 0.183 4.379 3.143 0.223 East Asia 0.043 40.358 2.341 7.174 Cost= Cost of 3 min. local call in $ Fixed= Number of fixed phone per 1000 inhabitants Wait= Waiting list per 1000 inhabitants Mobile= Number of mobile phone per 1000 inhabitants
Taking these results together with those of the econometric analysis sheds further light on the scope for improving the region performance both in terms of manufactured exports and FDI inflows thanks to more telecom development. Therefore, policy aiming at improving the performance of telecommunication services in the MENA region can entail important gains in terms of exports and FDI inflows and complement other policies (e.g. trade and exchange rate policies) undertaken in the region.
16
6. Conclusion and Policy Implications
Evidence examined in this paper suggests strong linkages between export performance in manufacturing, participation in global production networks, attractiveness to FDI, and the performance of the telecommunications sector. The performance of the sector also appears to be critically driven by openness to competition and the quality of the regulatory framework. But in MENA countries telecommunications markets remain less open to competition than elsewhere in the developing world, thus denying the region the benefit of increased participation into global trade and stronger export and growth performance.
The planed free-trade zone with the EU provides a unique opportunity to MENA to find a right place into EU production networks, and thus attract more FDI, increase exports, and benefit from knowledge and technology spillovers. But in order to encourage transnational companies to extend their supply chains to MENA through partnerships with domestic companies or new investment, further progress in lowering trade barriers should go in tandem with complementary policies in other areas. In particular, trade logistics, transport, and information systems would have to become more flexible, reliable and sophisticated. This would require ambitious opening up of service markets to competition�supported by continuous efforts at public enterprise reform in network industries; privatization; and pro-competitive regulation.
Owing to complementarities among trade-related services, such as transport and finance, competitive opening of telecommunications markets would play a catalytic role in easing �beyond-the-border� constraints to trade and exporting. Greater market openness, coupled with pro-competitive regulation, appears to be a strong driver of telecommunications sector growth. With the right regulatory and business environment in place, telecommunications liberalization in MENA holds considerable potential for improving overall economic performance.
Measures that secure the independence of regulatory bodies; guarantee a competitive
interconnection regime in a multi-operator environment; and improve the transparency of licensing procedures, would ensure efficient provision of telecommunications services and reduce the �regulatory risk� perceived by investors. Moreover, international experience on reform sequencing suggests that countries embarking on sector liberalization should have introduction of effective competition as the major objective. The presence of strong, well established competition to the core-business of the incumbent operator might be a key determinant that accelerates the needed to introduce privatization in the incumbent operator (as, for example, in the case of Morocco). In these cases where competition has been introduced �at-the-margin� of the core business of the incumbent operator (Lebanon, Egypt), the bottlenecks related to the inefficiency and resistance to change in the incumbent operator, remained.
17
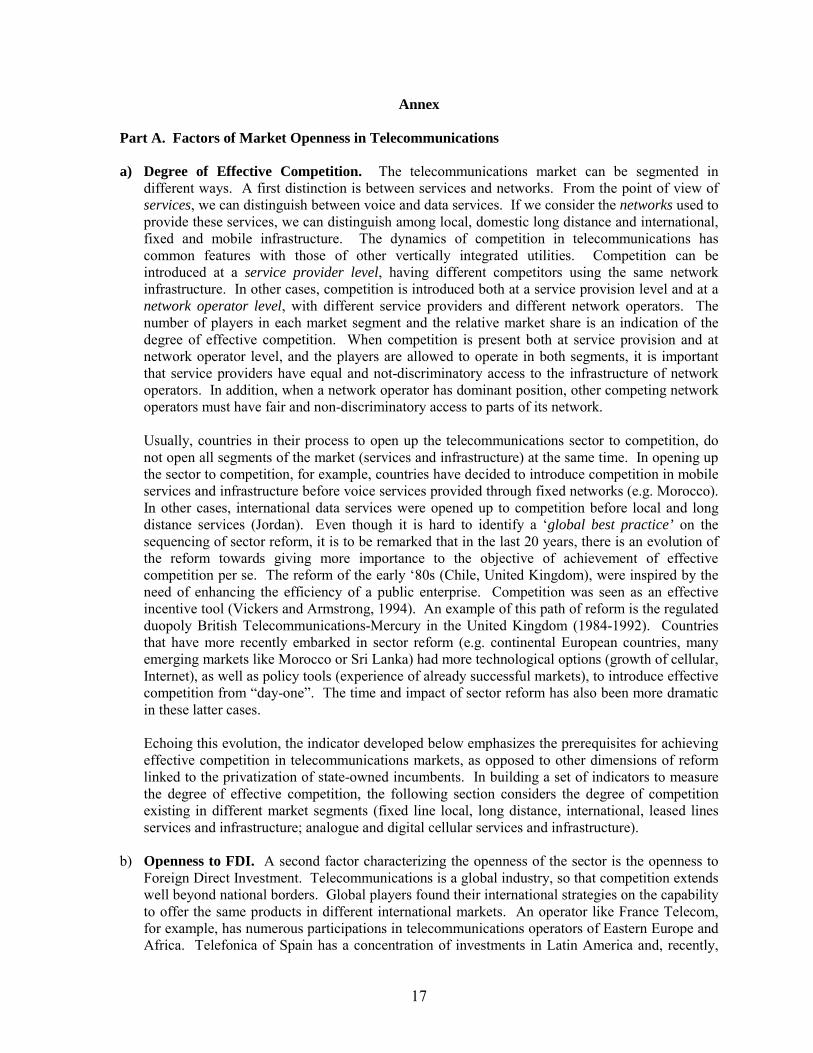
Annex Part A. Factors of Market Openness in Telecommunications a) Degree of Effective Competition. The telecommunications market can be segmented in
different ways. A first distinction is between services and networks. From the point of view of services, we can distinguish between voice and data services. If we consider the networks used to provide these services, we can distinguish among local, domestic long distance and international, fixed and mobile infrastructure. The dynamics of competition in telecommunications has common features with those of other vertically integrated utilities. Competition can be introduced at a service provider level, having different competitors using the same network infrastructure. In other cases, competition is introduced both at a service provision level and at a network operator level, with different service providers and different network operators. The number of players in each market segment and the relative market share is an indication of the degree of effective competition. When competition is present both at service provision and at network operator level, and the players are allowed to operate in both segments, it is important that service providers have equal and not-discriminatory access to the infrastructure of network operators. In addition, when a network operator has dominant position, other competing network operators must have fair and non-discriminatory access to parts of its network. Usually, countries in their process to open up the telecommunications sector to competition, do not open all segments of the market (services and infrastructure) at the same time. In opening up the sector to competition, for example, countries have decided to introduce competition in mobile services and infrastructure before voice services provided through fixed networks (e.g. Morocco). In other cases, international data services were opened up to competition before local and long distance services (Jordan). Even though it is hard to identify a �global best practice’ on the sequencing of sector reform, it is to be remarked that in the last 20 years, there is an evolution of the reform towards giving more importance to the objective of achievement of effective competition per se. The reform of the early �80s (Chile, United Kingdom), were inspired by the need of enhancing the efficiency of a public enterprise. Competition was seen as an effective incentive tool (Vickers and Armstrong, 1994). An example of this path of reform is the regulated duopoly British Telecommunications-Mercury in the United Kingdom (1984-1992). Countries that have more recently embarked in sector reform (e.g. continental European countries, many emerging markets like Morocco or Sri Lanka) had more technological options (growth of cellular, Internet), as well as policy tools (experience of already successful markets), to introduce effective competition from �day-one�. The time and impact of sector reform has also been more dramatic in these latter cases. Echoing this evolution, the indicator developed below emphasizes the prerequisites for achieving effective competition in telecommunications markets, as opposed to other dimensions of reform linked to the privatization of state-owned incumbents. In building a set of indicators to measure the degree of effective competition, the following section considers the degree of competition existing in different market segments (fixed line local, long distance, international, leased lines services and infrastructure; analogue and digital cellular services and infrastructure).
b) Openness to FDI. A second factor characterizing the openness of the sector is the openness to Foreign Direct Investment. Telecommunications is a global industry, so that competition extends well beyond national borders. Global players found their international strategies on the capability to offer the same products in different international markets. An operator like France Telecom, for example, has numerous participations in telecommunications operators of Eastern Europe and Africa. Telefonica of Spain has a concentration of investments in Latin America and, recently,
18
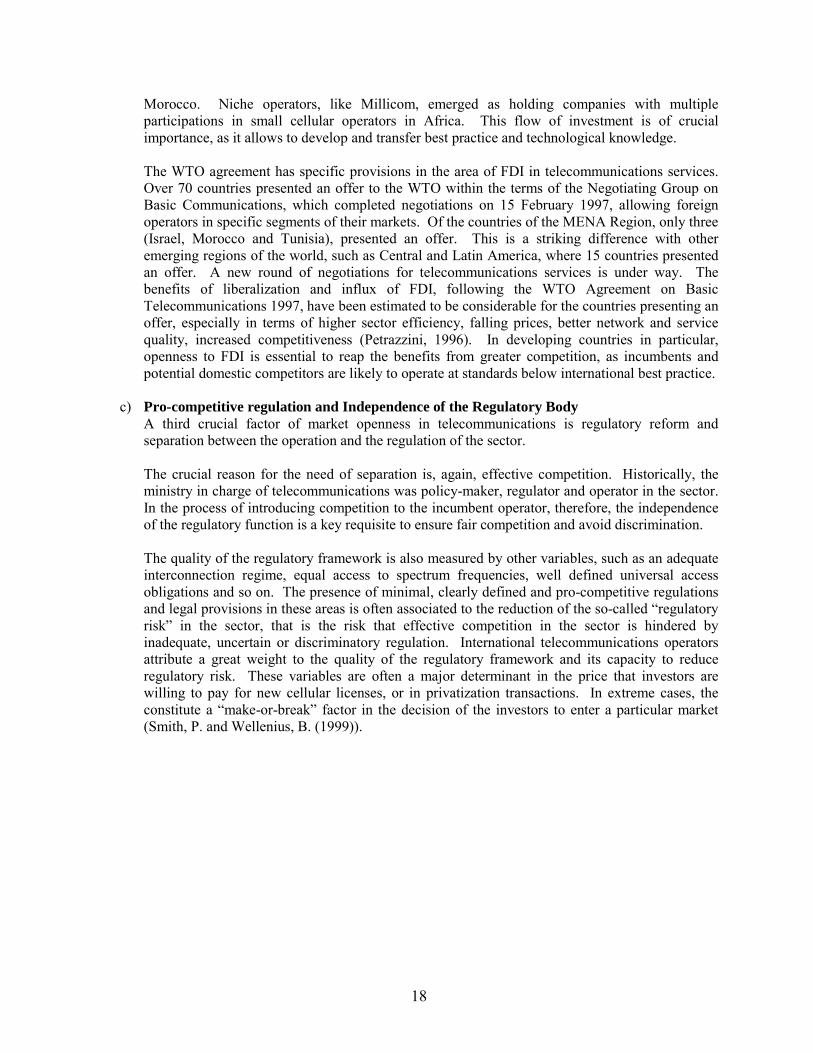
Morocco. Niche operators, like Millicom, emerged as holding companies with multiple participations in small cellular operators in Africa. This flow of investment is of crucial importance, as it allows to develop and transfer best practice and technological knowledge. The WTO agreement has specific provisions in the area of FDI in telecommunications services. Over 70 countries presented an offer to the WTO within the terms of the Negotiating Group on Basic Communications, which completed negotiations on 15 February 1997, allowing foreign operators in specific segments of their markets. Of the countries of the MENA Region, only three (Israel, Morocco and Tunisia), presented an offer. This is a striking difference with other emerging regions of the world, such as Central and Latin America, where 15 countries presented an offer. A new round of negotiations for telecommunications services is under way. The benefits of liberalization and influx of FDI, following the WTO Agreement on Basic Telecommunications 1997, have been estimated to be considerable for the countries presenting an offer, especially in terms of higher sector efficiency, falling prices, better network and service quality, increased competitiveness (Petrazzini, 1996). In developing countries in particular, openness to FDI is essential to reap the benefits from greater competition, as incumbents and potential domestic competitors are likely to operate at standards below international best practice.
c) Pro-competitive regulation and Independence of the Regulatory Body A third crucial factor of market openness in telecommunications is regulatory reform and
separation between the operation and the regulation of the sector.
The crucial reason for the need of separation is, again, effective competition. Historically, the ministry in charge of telecommunications was policy-maker, regulator and operator in the sector. In the process of introducing competition to the incumbent operator, therefore, the independence of the regulatory function is a key requisite to ensure fair competition and avoid discrimination. The quality of the regulatory framework is also measured by other variables, such as an adequate interconnection regime, equal access to spectrum frequencies, well defined universal access obligations and so on. The presence of minimal, clearly defined and pro-competitive regulations and legal provisions in these areas is often associated to the reduction of the so-called �regulatory risk� in the sector, that is the risk that effective competition in the sector is hindered by inadequate, uncertain or discriminatory regulation. International telecommunications operators attribute a great weight to the quality of the regulatory framework and its capacity to reduce regulatory risk. These variables are often a major determinant in the price that investors are willing to pay for new cellular licenses, or in privatization transactions. In extreme cases, the constitute a �make-or-break� factor in the decision of the investors to enter a particular market (Smith, P. and Wellenius, B. (1999)).
19
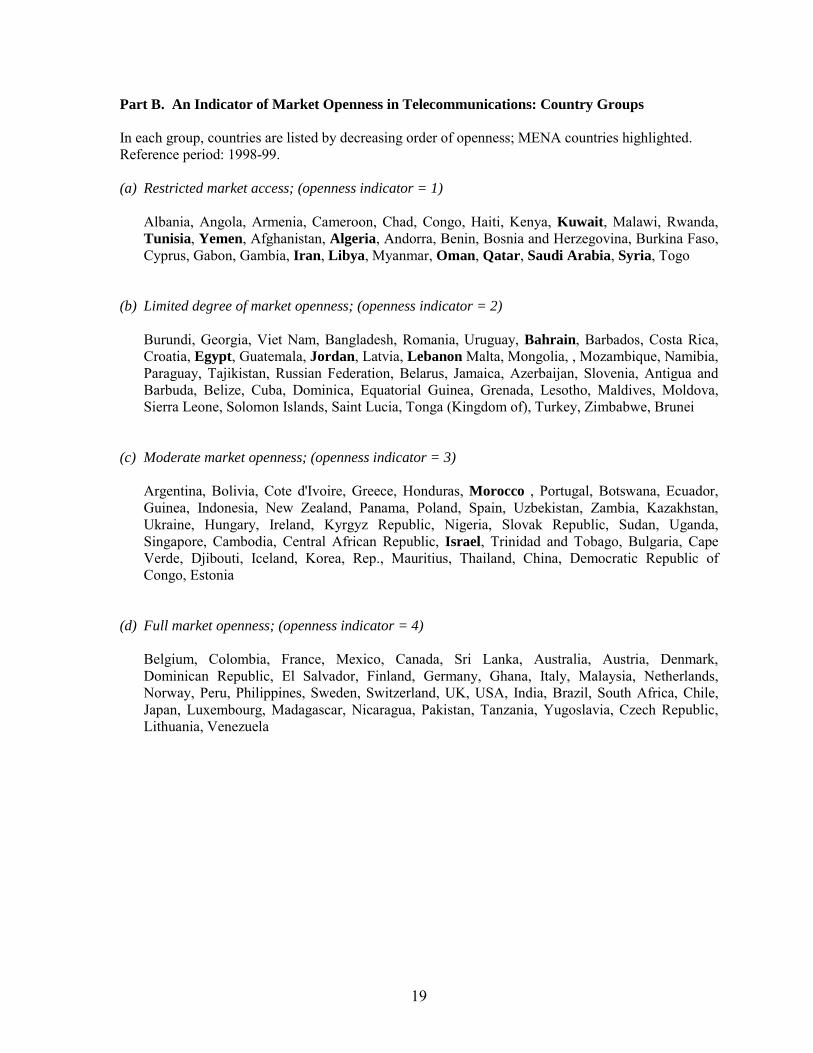
Part B. An Indicator of Market Openness in Telecommunications: Country Groups In each group, countries are listed by decreasing order of openness; MENA countries highlighted. Reference period: 1998-99. (a) Restricted market access; (openness indicator = 1)
Albania, Angola, Armenia, Cameroon, Chad, Congo, Haiti, Kenya, Kuwait, Malawi, Rwanda, Tunisia, Yemen, Afghanistan, Algeria, Andorra, Benin, Bosnia and Herzegovina, Burkina Faso, Cyprus, Gabon, Gambia, Iran, Libya, Myanmar, Oman, Qatar, Saudi Arabia, Syria, Togo
(b) Limited degree of market openness; (openness indicator = 2) Burundi, Georgia, Viet Nam, Bangladesh, Romania, Uruguay, Bahrain, Barbados, Costa Rica, Croatia, Egypt, Guatemala, Jordan, Latvia, Lebanon Malta, Mongolia, , Mozambique, Namibia, Paraguay, Tajikistan, Russian Federation, Belarus, Jamaica, Azerbaijan, Slovenia, Antigua and Barbuda, Belize, Cuba, Dominica, Equatorial Guinea, Grenada, Lesotho, Maldives, Moldova, Sierra Leone, Solomon Islands, Saint Lucia, Tonga (Kingdom of), Turkey, Zimbabwe, Brunei
(c) Moderate market openness; (openness indicator = 3) Argentina, Bolivia, Cote d'Ivoire, Greece, Honduras, Morocco , Portugal, Botswana, Ecuador, Guinea, Indonesia, New Zealand, Panama, Poland, Spain, Uzbekistan, Zambia, Kazakhstan, Ukraine, Hungary, Ireland, Kyrgyz Republic, Nigeria, Slovak Republic, Sudan, Uganda, Singapore, Cambodia, Central African Republic, Israel, Trinidad and Tobago, Bulgaria, Cape Verde, Djibouti, Iceland, Korea, Rep., Mauritius, Thailand, China, Democratic Republic of Congo, Estonia
(d) Full market openness; (openness indicator = 4) Belgium, Colombia, France, Mexico, Canada, Sri Lanka, Australia, Austria, Denmark, Dominican Republic, El Salvador, Finland, Germany, Ghana, Italy, Malaysia, Netherlands, Norway, Peru, Philippines, Sweden, Switzerland, UK, USA, India, Brazil, South Africa, Chile, Japan, Luxembourg, Madagascar, Nicaragua, Pakistan, Tanzania, Yugoslavia, Czech Republic, Lithuania, Venezuela
20
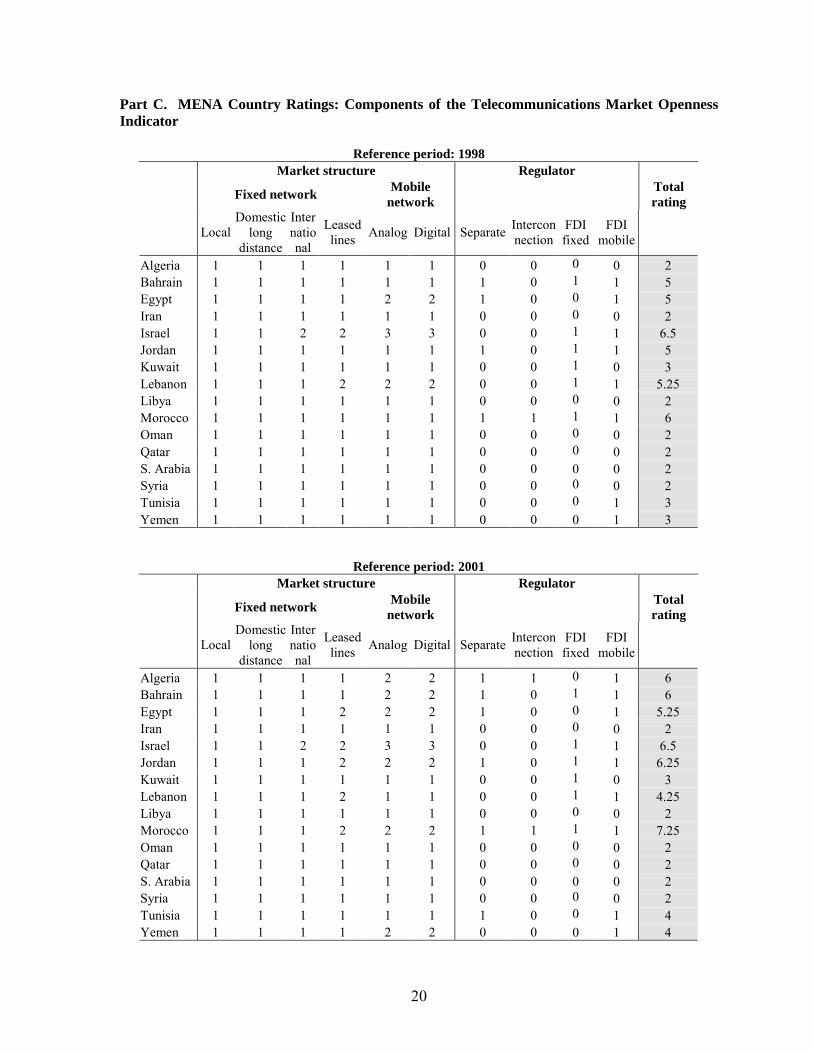
Part C. MENA Country Ratings: Components of the Telecommunications Market Openness Indicator
Reference period: 1998 Market structure Regulator
Fixed network Mobile network Total
rating
Local Domestic
long distance
Inter natio nal
Leased lines Analog Digital Separate Intercon
nectionFDI fixed
FDI mobile
Algeria 1 1 1 1 1 1 0 0 0 0 2 Bahrain 1 1 1 1 1 1 1 0 1 1 5 Egypt 1 1 1 1 2 2 1 0 0 1 5 Iran 1 1 1 1 1 1 0 0 0 0 2 Israel 1 1 2 2 3 3 0 0 1 1 6.5 Jordan 1 1 1 1 1 1 1 0 1 1 5 Kuwait 1 1 1 1 1 1 0 0 1 0 3 Lebanon 1 1 1 2 2 2 0 0 1 1 5.25 Libya 1 1 1 1 1 1 0 0 0 0 2 Morocco 1 1 1 1 1 1 1 1 1 1 6 Oman 1 1 1 1 1 1 0 0 0 0 2 Qatar 1 1 1 1 1 1 0 0 0 0 2 S. Arabia 1 1 1 1 1 1 0 0 0 0 2 Syria 1 1 1 1 1 1 0 0 0 0 2 Tunisia 1 1 1 1 1 1 0 0 0 1 3 Yemen 1 1 1 1 1 1 0 0 0 1 3
Reference period: 2001 Market structure Regulator
Fixed network Mobile network Total
rating
Local Domestic
long distance
International
Leased lines Analog Digital Separate Intercon
nectionFDI fixed
FDI mobile
Algeria 1 1 1 1 2 2 1 1 0 1 6 Bahrain 1 1 1 1 2 2 1 0 1 1 6 Egypt 1 1 1 2 2 2 1 0 0 1 5.25 Iran 1 1 1 1 1 1 0 0 0 0 2 Israel 1 1 2 2 3 3 0 0 1 1 6.5 Jordan 1 1 1 2 2 2 1 0 1 1 6.25 Kuwait 1 1 1 1 1 1 0 0 1 0 3 Lebanon 1 1 1 2 1 1 0 0 1 1 4.25 Libya 1 1 1 1 1 1 0 0 0 0 2 Morocco 1 1 1 2 2 2 1 1 1 1 7.25 Oman 1 1 1 1 1 1 0 0 0 0 2 Qatar 1 1 1 1 1 1 0 0 0 0 2 S. Arabia 1 1 1 1 1 1 0 0 0 0 2 Syria 1 1 1 1 1 1 0 0 0 0 2 Tunisia 1 1 1 1 1 1 1 0 0 1 4 Yemen 1 1 1 1 2 2 0 0 0 1 4
21
Part D. MENA Country Liberalization Profiles in Telecommunications: A snapshot
Morocco
Morocco can be considered, together with Israel, the country whose liberalization process is more advanced in the MNA Region. The reform process started with Law 24/96, which: 1) separated telecommunications operations from postal operations, creating two different public companies (Itissalat-al-Maghrib for telecommunications, and Barid-al-Maghrib, for postal services); 2) created an independent regulator (Agence Nationale des Réglementations des Télécommunications, ANRT); 3) allowed competition in all market segments; 4) established regulatory principles in key areas, such as licensing and interconnection.
The test bed for effective competition in Morocco was the award of the second GSM license. ANRT led the process with high independence and professionalism. The design of the license included rights for the operator to build and operate own long distance infrastructure, and to lease it to others. It conferred the right to the operator to offer international voice services to its own customers, after two years from the award of the license. It conferred the right to offer fixed wireless services to its own customers, under authorization from ANRT. The transparency of the license process and the features of the license text, attracted the interest of 7 groups of leading international investors. After an highly competitive bid process, the license was awarded to the Telefonica-led consortium, which paid over US$1bn. for the license, a record for the region and for developing countries. The threat of competition stimulated the incumbent operator, IAM, to lower tariffs four times in one year. This produced an unprecedented growth of the mobile market, which increased from 150,000 at the beginning of 1999 to 4,000,000 customers at the end of 2000. In two years, thanks to effective competition, Morocco was able to transform its mobile communications market from a niche market to a level of development similar to that of advanced markets.
Morocco capitalized on the success achieved on the mobile market to do considerable progress on the privatization front. Following Law 24/94, the incumbent operator, Itissalat-Al-Maghrib, has been corporatized, and its name changed to Maroc Telecom. Following a long tender process, 35 percent of Maroc Telecom was sold, in December 2000, to France�s Vivendi Universal, for US$2.2bn. The strategic investor was also given management control of the company, in order to be free in its day-to-day management of the company, as well as in strategic planning and corporate strategy. Through minority rights, the Government of Morocco, still has some residual decision power, especially on long-term decisions for the company. Considering an enterprise valuation in excess of US$6bn., Vivendi has paid price equal to US$76.5 per capita, one of the highest ever paid for a telecommunications privatization9.. A subsequent public flotation of an additional 10 percent of the shares of Maroc Telecom, is expected in 2002. Contrary to earlier WTO commitments, Morocco granted an exclusivity period on fixed line voice services for Maroc Telecom, till December 31, 2002. This decision, which did not contribute to raise the price paid for Maroc Telecom, had negative implications in terms of stability of the liberalization timetable.
To stick with its new liberalization timetable, and confirm the international credibility that it has recently gained, Morocco started the process to award fixed line licenses in 2002. Unfortunately no bidder presented final offers for this license. This has been attributed to the adverse international financial situation of the telecommunications sector, but can also be related to too restrictive obligations placed by the license on the fixed line operator. These obligations have discouraged
9 The particular time in which the privatization took place might also have contributed to this high valuation.
Looking forward, countries of the region are likely to see lower per-capita amounts of Telecom privatizations proceeds.
22
bidders, as they were contemplating the entry in a market highly saturated by the development of GSM services.
The lack of interest in the second fixed line license has caused the Government to start an analysis of its options to continue the liberalization process. The Government has expressed its commitment to telecommunications liberalization, and is exploring new ways to introduce competition in the fixed line, data and international markets.
Jordan
Jordan has also achieved considerable progress in telecommunications liberalization in the last years. Telecommunications Law 1995 has introduced the main regulatory principles of independent regulation, competition and sector reform. The Telecommunications Regulatory Commission (TRC), was established as an independent regulator of the sector, while the policy-making function was maintained by the Ministry of Post and Telecommunications. Corporatization of the incumbent fixed line operator, Jordan Telecom, followed.
Privatization of Jordan Telecom was completed in 1999, with the acquisition of a 40 percent share in the company by France Telecom. Through majority in the board of directors, France Telecom was also attributed management control. A follow�up flotation of shares is expected in 2002.
Parallel to the privatization of Jordan Telecom, the Government has achieved good progress in the liberalization of mobile communications services. In 1995, a private provider, Fastlink, owned by Orascom Telecom, was licensed to provide GSM services. A second license was attributed to Mobilcom, owned by Jordan Telecom. The competition between Fastlink and Mobilcom generated several reduction in the prices of mobile telecommunications services, and an expansion of services to reach 9 percent penetration at the end of 2000. Further competition in the mobile market, with the award of a third license, will be considered in 2003. Orascom Telecom has recently sold its 91.6 percent equity stake in its Jordanian subsidiary, Jordan Mobile Telephone Services Company Ltd. (Fastlink) to Kuwait's Mobile Telecommunications Company. Competition in other market segments is actually precluded till December 31, 2004, since Jordan Telecommunications enjoys exclusive rights on all fixed line services till that date.
Egypt
Telecom Egypt, formerly known as ARENTO, is the state-owned telecommunications operator. It has an installed base of over 5 million lines and its assets in 1999 were estimated at $6.5bn. The regulatory entity is the Ministry of Telecommunications and Information Technology. In 1999, while the Government has announced its intention to privatize Telecom Egypt in several occasions, little progress has been achieved towards this objective.
Competition, however, was introduced outside the core business of activities of Telecom Egypt. The mobile sector in Egypt has been competitive for quite some time, with the award of two licenses to Mobilnil and Vodafone Misr. The introduction of competition, however, did not produce the spectacular growth experienced by Morocco. At the end of 2000, it is estimated that the Egyptian GSM market would have [about 900,000 customers], or a penetration of 1.5 percent, against 15 percent penetration in Morocco. An explanation for this different growth is that both mobile operators need to rely heavily on the fixed line infrastructure of Egypt Telecom, which is of lower
23
quality with respect to the mobile infrastructure put in place by the two mobile operators. The cost of leased lines in Egypt is also reportedly higher than good international practice. As a consequence, due to the bottlenecks in the fixed network, the mobile customer experiences higher costs and lower quality with respect to the Moroccan equivalent.
The Government has recently announced its intention to introduce more competition in the sector, through the award of a third mobile license. This third competitor is unlikely to increase the level of effective competition in the sector, for two reasons. The first is that the license could be attributed to Egypt Telecom, that would then have the potential to abuse from its dominant position in the fixed line market. But even if the license is attributed to an independent operator, the same bottlenecks experienced by the two existing companies, in terms of fixed line network, would still persist.
While on privatization and fixed line market Egypt has not introduced reform, and on mobile the success of the reform is partial, on data services Egypt is one of the most open countries of the region, with several VSAT operators, and competing data service providers. Private companies, especially in the ICT sector, have strongly benefited from the opening up of the data segment. International resale of voice services is also open to competition and private participation from international investors, with Global One, American Express and MCI offering international calling card services. Full-fledged competition in the market will not come before 2005, when the Government has announced full liberalization of all communications markets. Telecom Egypt's monopoly over PSTN and International connectivity is expected to end by 2005.
Tunisia.
Tunisia, which has an higher GDP per capita with respect to the three countries considered above, is the least advanced in terms of market liberalization, notwithstanding several recent efforts. The Tunisian telecommunications market was long characterized by the monopoly of Tunisia Telecom and the extensive role of the State as policy-maker, regulator and operator in the sector. Although Tunisia has achieved good progress in the development of the telecommunications sector in the last 10 years (relatively high fixed line penetration, well balanced network between major cities and rest of the country, good quality of the basic network), it is clearly below its full potential in some areas, such as wireless communications and Internet. In addition, the fixed line network, an asset for the country does not generate as high revenues as in other comparable economies. In particular, in the area of mobile communications, at the end of 2000, the Tunisian mobile network was only counting on less than 100,000 customers, or 1 percent mobile penetration, which is very small, compared with Morocco�s 15 percent penetration. The result of this delay is that telecommunications services represent about 1.9 percent of GDP in the country, while in other dynamic and emerging economies, like Chile, Morocco and Malaysia, the weight of telecommunications services reaches 4 percent of GDP. In addition, ICT-related services, such as software, IT-enabled services, which accelerated the growth rate of countries like India, Costa Rica, Hungary in the second half of the 90s, did not grow at an accelerated pace in the country.
The Government recognized this delay, and started implementing a program of regulatory reform and introduction of competition. It enacted a new Communications Code in February 2001, which, similarly to the Moroccan Law, abolishes the monopoly of the State in the sector, states basic regulatory principles, and creates regulatory agencies (Instance Nationale des Télécommunications, an independent agency, and Agence Nationale des Fréquences, under the Ministry of Communications Technologies).
24
In terms of introduction of effective competition, Tunisia has awarded a second GSM license to an international consortium, led by Orascom Telecom (Orascom Tunisie Telecom, OTT). OTT paid US$454 million for the license, awarded on March 20, 2002. Orascom Telecom subsequently entered into a joint venture agreement with the Kuwaiti operator Watanya Telecom to jointly develop and operate OTT. OTT launched its services in December 2002 under the brand name of Tunisiana The entry of a second GSM operator on the market is expected to increase mobile penetration dramatically. For example, the consulting firm Arab Advisors projected the GSM market to increase almost nine fold by 2006, reaching a penetration rate of 43 percent, or 4.4 million subscribers.
Still in the area of introduction of effective competition, the Tunisian government has launched a license award process to install and operate a very small aperture terminal (VSAT) telecommunications network in Tunisia. This network will help meet the increasing demand for data services and provide additional telecommunications infrastructure.
While managing the award of the second GSM license and of a VSAT license, Tunisia has also put forward changes in its regulatory regime (implementing decrees in key areas, such as interconnection), and has started discussions to privatize 10 percent of the incumbent operator, Tunisie Telecom. The implementation of a program to introduce effective competition seems to be the main bottleneck to sector development in the current telecommunications market.
25
References
Arndt, Sven and Henryk Kierzkowski, forthcoming. �Introduction� in S. Arndt and H. Kierzkowski, ed., Fragmentation and International Trade, Oxford University Press, Oxford and New York. Blondal and Pilat, 1997. �The Economic Benefits of Regulatory Reform�, OECD Economic Studies, No. 28, 1997/I. Boylaud, Olivier and Giuseppe Nicoletti, 2000. �Regulation, Market Structure and Performance in Telecommunications,� Economics Department Working Paper No. 237, OECD, April. Cowhey, P. and M.M. Klimenko, 2000. �Telecommunications reform in developing countries after the WTO agreement on basic telecommunications services�, Journal of International Development, (12), 265-281. Dasgupta, D., M. Nabli, C. Pissarides and A. Varoudakis, 2002. � Making Trade Work for Jobs : International Evidence and Lessons for MENA�, World Bank mimeo Dixit, Avinash K and Gene M. Grossman, 1982. �Trade and Protection with Multistage Production,� Review of Economic Studies 59, 583-594. Feenstra, Robert C., 1998. �Integration of Trade and Disintegration of Production in the Global Economy.� Journal of Economic Perspectives, vol. 12, number 4 (31-50). Grossman, Gene M. and Elhanan Helpman, 1999. �The Internationalization of Economic Activity,� National Science Foundation grant, July. Hummels, D., J. Ishii and K.-M. Yi, 2001. �The nature and growth of vertical specialization in world trade�, Journal of International Economics, (54), 75-96. Lucas, Robert E. B., 1993. On the determinants of direct foreign investment: Evidence from East and Southeast Asia. World Development 21 (3), 391-406. Mattoo, A., R. Rathindran, and A. Subramanian, 2001. �Measuring Services Trade Liberalization and its Impact on Economic Growth: An Illustration�, Policy Research Working Paper, No. 2655, The World Bank, August. Ng, F. and A. Yeats, 2000. �Production Sharing in East Asia: Who Does What, for Whom and Why?�, mimeo, The World Bank, Washington D.C. OECD, 1997. �The OECD Report on Regulatory Reform�Thematic Studies�, Paris. OECD, 2000a. �A New Economy: The Changing Role of Innovation and Information Technology in Growth�, Paris, 2000. OECD 2000b. Information Technology Outlook 2000, Paris. Petrazzini, B., 1996, �Global Telecom Talks: a Trillion Dollar Deal�, Institute for International Economics, Washington, D.C.
26
Rossotto, C., M. Kerf, and J. Rohlfs, 1999. �Competition in Mobile Telecoms�, Public Policy for the Private Sector, Note No. 184, The World Bank, August. Sekkat, Kh. and Varoudakis, A., 2000. �Exchange Rate Management and Manufactured Exports in Sub-Saharan Africa�, Journal of Development Economics 61 (1): 237-54. Smith, P. and Wellenius, B., 1999. �Reducing Regulatory Risk in Telecommunications�, Public Policy for the Private Sector, Note No. 189, The World Bank, July. UNCTAD, 1998. World Investment Report. New York: United Nations. UNCTAD, 2001. World Investment Report. New York: United Nations. Vickers, J. and Armstrong, M. �Competition and Regulation in Telecommunications�, in M. Bishop, J. Kay and C. Mayer, eds., The Regulatory Challenge, OUP, Oxford, 1994, 283-335. Warren, T., 2000. 'The identification of impediments to trade and investment in telecommunications services', in Findlay, C. and Warren, T. (eds) 2000, Impediments to Trade in Services: Measurement and Policy Implications, Routledge, London and New York. (http://www.pc.gov.au/research/memoranda/servicesrestriction/traderestrictivenessindexes.xls) World Bank, 2000. Global economic Prospects and the Developing Countries 2001, Washington D.C. World Bank, 2001. Republic of Tunisia: Information and Communications Technology Strategy Report, Washington D.C.
27
MENA Working Paper Series
No. 1 Has Labor Migration Promoted Economic Integration in the Middle East? June 1992. Nemat Shafik, The World Bank and Georgetown University.
No. 2 The Welfare Effects of Oil Booms in a Prototypical Small Gulf State. September 1992. Ahmed Al-Mutuwa, United Arab Emirates University and
John T. Cuddington, Georgetown University. No. 3 Economic and Social Development in the Middle East and North Africa. October 1992. Ishac Diwan and Lyn Squire, The World Bank. No. 4 The Link Between Trade Liberalization and Multi-Factor Productivity: The Case of Morocco. February 1993. Mona Haddad, The World Bank. No. 5 Labor Markets in the Middle East and North Africa. February 1993. Christopher A. Pissarides, The London School of Economics and Political Science. No. 6 International Competitiveness of the Private Industry and the Constraints
to its Development: The Case of Morocco. June 1993. Hamid Alavi, The World Bank. No. 7 An Extended RMSM-X Model for Egypt: Quantifications of Market-Oriented Reforms.
September 1993. Karsten Nimb Pedersen, The World Bank.
No. 8 A Report on the Egyptian Tax System. October 1993. Mark Gersovitz, Roger H. Gordon and Joel Slemrod, The World Bank. No. 9 Economic Development and Cooperation in the Middle East and North
Africa. November 1993. Ishac Diwan and Lyn Squire, The World Bank. No. 10 External Finance in the Middle East: Trends and Prospects. December 1993.
Ishac Diwan, John Underwood and Lyn Squire, The World Bank. No. 11 Tax Incidence on Agriculture in Morocco (1985-1989). April 1994. Jean-Paul Azam, CERDI, University of Auvergne, Clermont-Ferrand (France)
et CSAE, Oxford (U.K.). No. 12 The Demographic Dimensions of Poverty in Jordan. August 1994. Chantal Worzala, The World Bank. No. 13 Fertility and Family Planning in Iran. November 1994. Rodolfo A. Bulatao and
Gail Richardson, The World Bank. No. 14 Investment Efficiency, Human Capital & Migration A Productivity Analysis
of the Jordanian Economy. May 1995. Gaston Gelos, Yale University, Department of Economics.
No. 15 Tax Effects on Investment in Morocco. August 1995. David Sewell, Thomas Tsiopoulos and Jack Mintz, The World Bank. No. 16 Reconstruction in Lebanon: Challenges for Macroeconomic Management.
April 1999. Daniela Gressani and John Page, The World Bank.
No. 17 Towards a Virtuous Circle: A Nutrition Review of the Middle East and North Africa. August 1999. Regional HNP Knowledge Management, The World Bank.
28
No. 18 Has Education Had a Growth Payoff in the MENA Region? December 1999. Lant Pritchett, The World Bank.
No. 19 Rationalizing Public Sector Employment in the MENA Region.
December 2000. Elizabeth Ruppert Bulmer, The World Bank.
No. 20 Achieving Faster Economic Growth in Tunisia. March 2001. Auguste T. Kouamé, The World Bank.
No. 21 Trade Options for the Palestinian Economy: Some Orders of Magnitude.
March 2001. Claus Astrup and Sébastien Dessus, The World Bank. No. 22 Human Capital and Growth: The Recovered Role of Educational Systems.
April 2001. Sébastien Dessus, The World Bank. No. 23 Governance And The Business Environment In West Bank/Gaza
May 2001. David Sewell, The World Bank.
No. 24 The Impact of Future Labor Policy Options on the Palestinian Labor Market June 2001. Elizabeth Ruppert Bulmer, The World Bank.
No. 25 Reform and Elusive Growth in the Middle-East – What Has Happened in the 1990s? July 2002. Dipak Dasgupta, Jennifer Keller, T.G. Srinivasan, The World Bank.
No. 26 Risks and Macro-Economic Impacts of HIV-AIDS in the Middle East and North Africa: Why waiting to intervene can be costly. July 2002. David A. Robalino, Carol Jenkins, Karim El Maroufi, The World Bank.
No. 27 Exchange Rate Regime and Competitiveness of Manufactured Exports: The Case of MENA Countries. August 2002. Mustapha Kamel Nabli,
Marie-Ange Véganzonès-Varoudakis, The World Bank. No. 28 Governance and the Investment Climate in Yemen
September 2002. Arup Banerji, Caralee McLiesh, The World Bank.
No. 29 Exporting Labor or Goods? Long-term Implications for the Palestinian Economy. October 2002. Claus Astrup, Sébastien Dessus, The World Bank.
No. 30 Poverty and Transfers in Yemen. December 2002. Dominique van de Walle, The World Bank.
No. 31 Yemen and the Millennium Development Goals. March 2003. Qaiser Khan, Susan Chase, The World Bank.
No. 32 Making Trade Work for Jobs : International Evidence and Lessons for MENA.
July 2003. Dipak Dasgupta, Mustapha Kamel Nabli, Christopher Pissarides (LSE), Aristomene Varoudakis, The World Bank.


![[PreMoney MENA 2015] Bahrain EDB >> Khalid Al Rumaihi, "Welcome & Opening Remarks"](https://img.pdfslide.net/doc/110x75/58d198d61a28ab6f6b8b4a5d/premoney-mena-2015-bahrain-edb-khalid-al-rumaihi-welcome-opening.jpg)


![[PreMoney MENA 2015] ArabNet >> Omar Christidis, "THE GLOBAL VC: MENA"](https://img.pdfslide.net/doc/110x75/58d198b51a28ab6f6b8b4a09/premoney-mena-2015-arabnet-omar-christidis-the-global-vc-mena.jpg)