Embed Size (px)
Citation preview
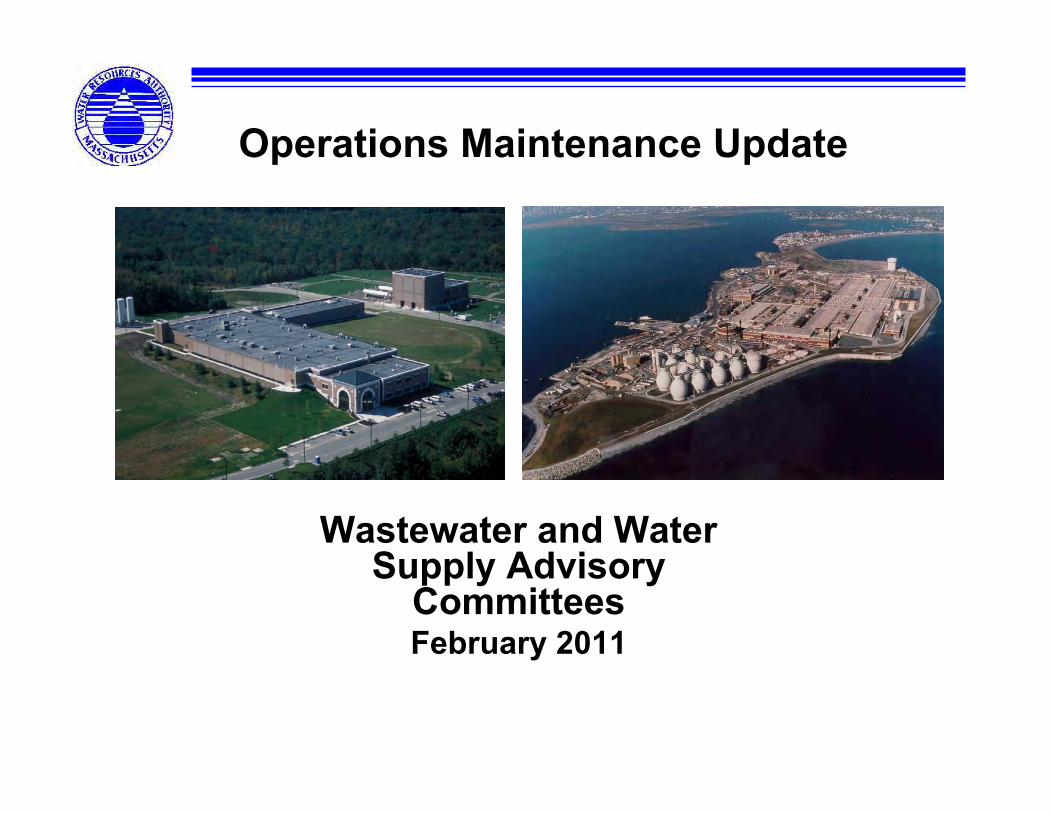
Operations Maintenance Update
Wastewater and WaterSupply Advisory
CommitteesFebruary 2011
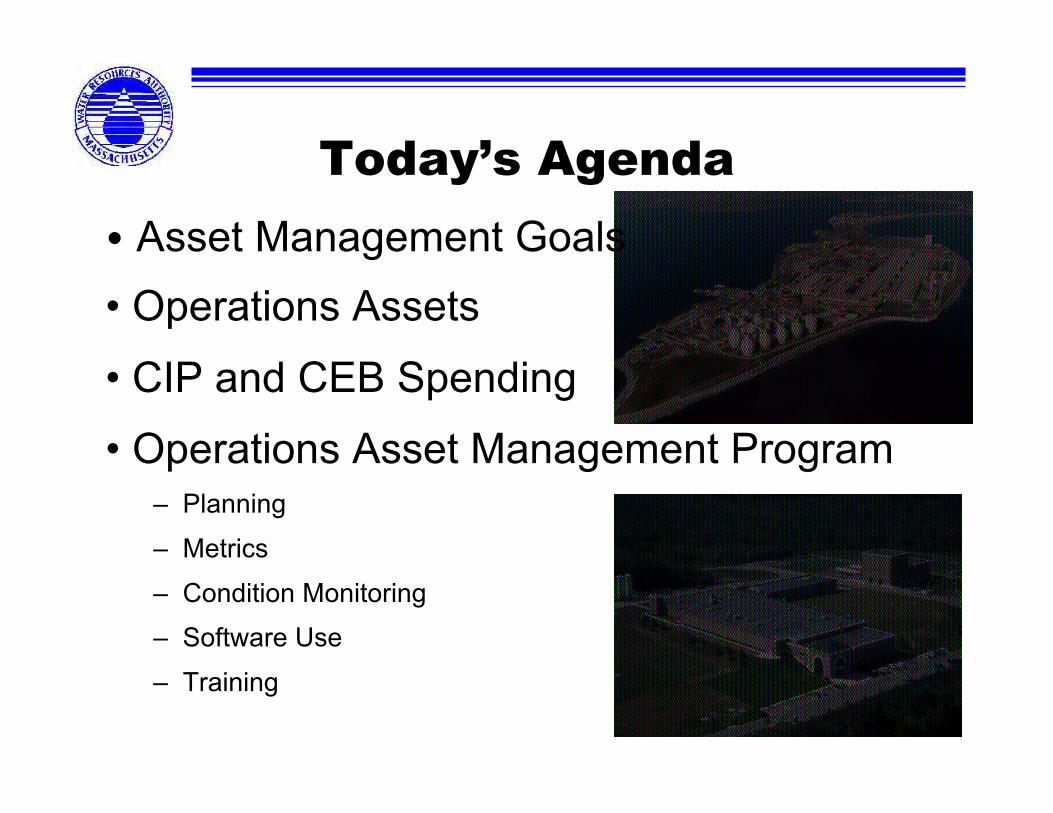
• Asset Management Goals• Operations Assets
• CIP and CEB Spending
• Operations Asset Management Program– Planning
– Metrics
– Condition Monitoring
– Software Use
– Training
Today’s Agenda

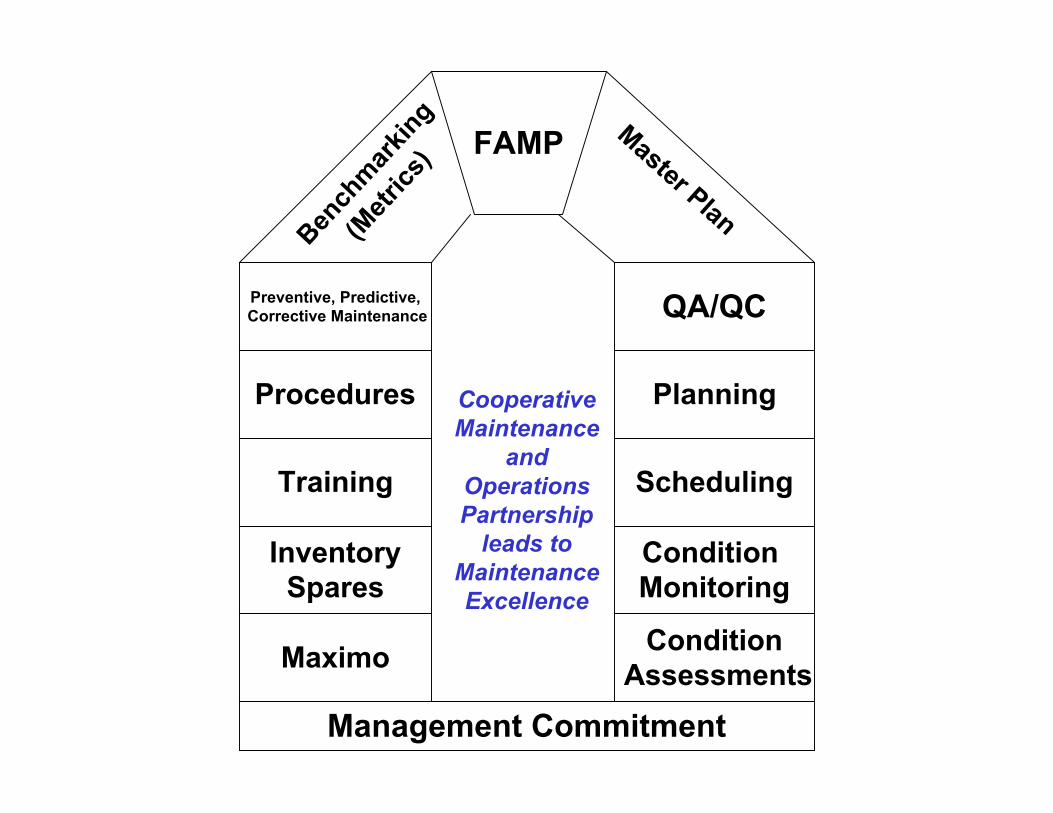
FAMP
Condition Monitoring
InventorySpares
Training
Procedures
QA/QC
Planning
Scheduling
Maximo Condition Assessments
Preventive, Predictive, Corrective Maintenance
Bench
markin
g
(Metr
ics)
Master Plan
Management Commitment
CooperativeMaintenance
andOperationsPartnership
leads toMaintenanceExcellence

Asset Management Goals
• Cost effectively replace components at theappropriate time to– ensure reliable plant operation– preserve value of ratepayer investment
• Prolong equipment life
• Control large spending spikes– avoid historical deferred maintenance approach– incorporate planned budget approach

Deer Island Wastewater Treatment Plant• Result of $3.8 Billion Dollar
Construction Project
• 2nd Largest WastewaterTreatment Plant in the UnitedStates
• Built on 120 Acres
• Treatment Capacity:– Maximum
• 1.27 Billion Gal/Day
– Average Daily Flow:• 365 Million Gal/Day

John J. Carroll Water Treatment Plant
• $350 Million Construction Cost
• Placed in service in July 2005
• Treatment Processes– Ozonation for primary
disinfection– Corrosion control (soda ash and
CO2)– Chloramination for
secondary disinfection– Fluoridation
• Plant capacity 405 MGD max;designed for 270 MGD average,operating at <200 MGD average
Metro Operations
Water System ($ 6.0B)• 100 miles of tunnels and aqueducts• 284 miles of water distribution piping• 11 pump stations• 11 storage facilities• 4904 valves
Transport System ($ 2.2B)• 228 miles of interceptor sewers• 12 pump stations• 4 combined sewer overflows facilities• 4 headworks• 1 screen house
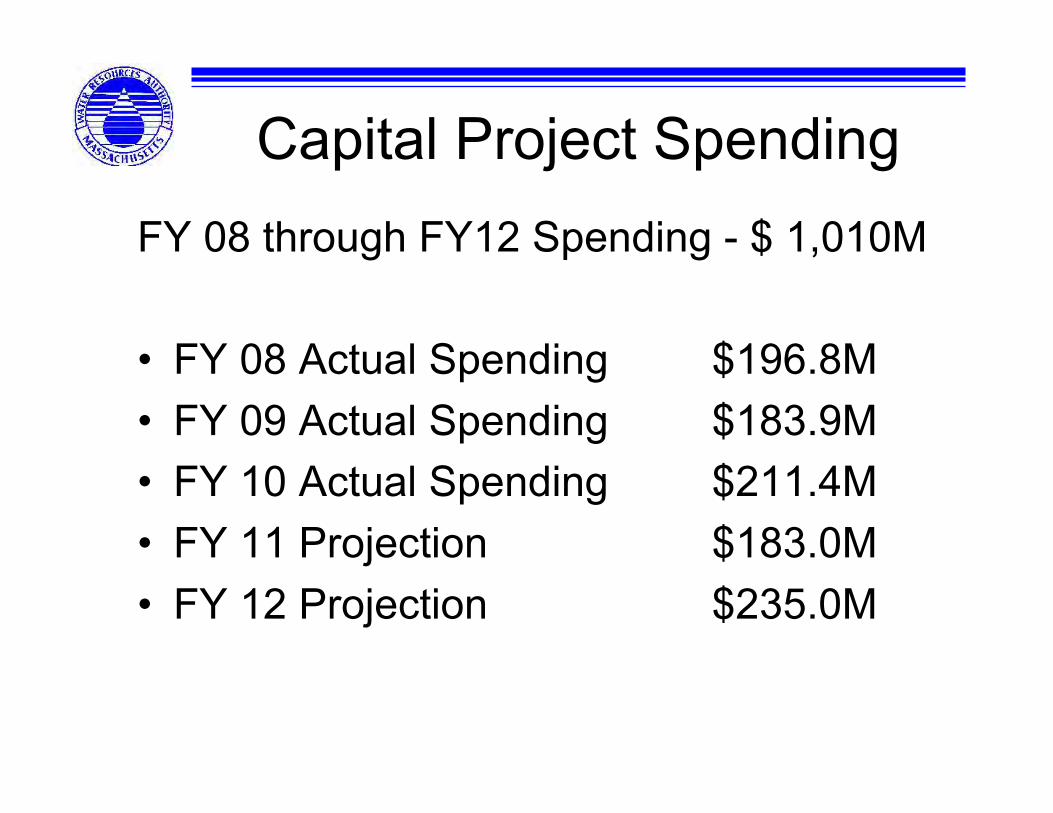
Capital Project SpendingFY 08 through FY12 Spending - $ 1,010M
• FY 08 Actual Spending $196.8M• FY 09 Actual Spending $183.9M• FY 10 Actual Spending $211.4M• FY 11 Projection $183.0M• FY 12 Projection $235.0M
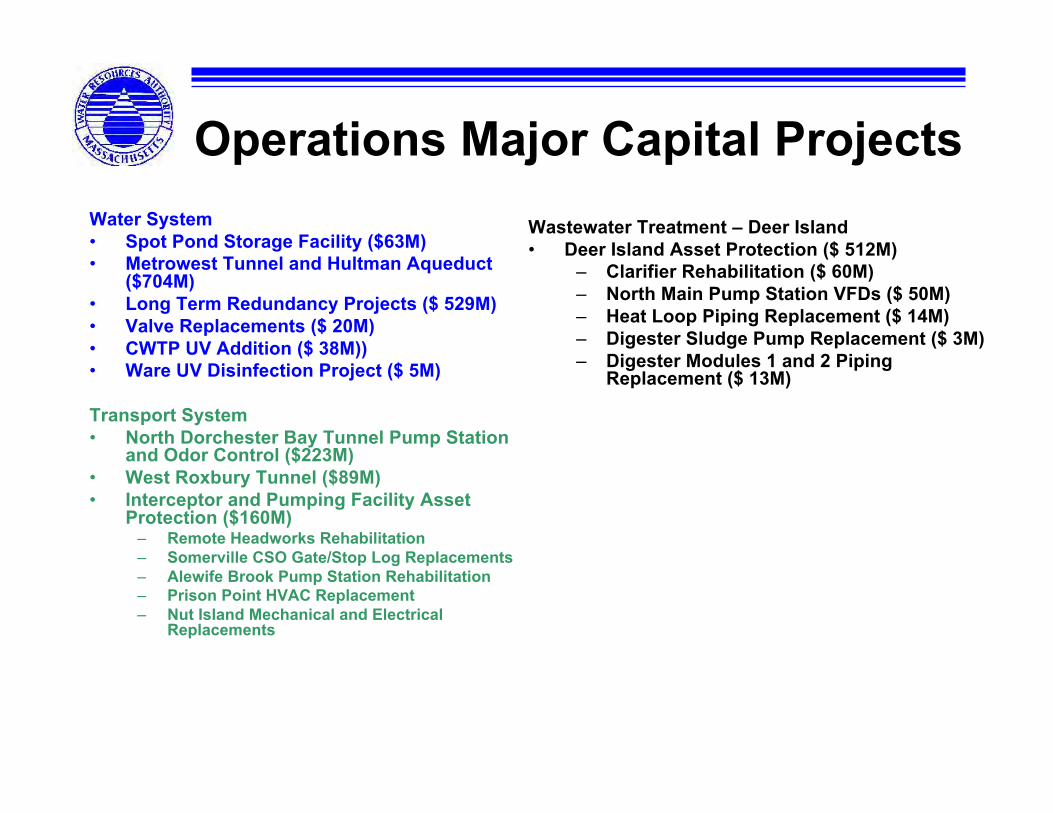
Operations Major Capital ProjectsWater System• Spot Pond Storage Facility ($63M)• Metrowest Tunnel and Hultman Aqueduct
($704M)• Long Term Redundancy Projects ($ 529M)• Valve Replacements ($ 20M)• CWTP UV Addition ($ 38M))• Ware UV Disinfection Project ($ 5M)
Transport System• North Dorchester Bay Tunnel Pump Station
and Odor Control ($223M)• West Roxbury Tunnel ($89M)• Interceptor and Pumping Facility Asset
Protection ($160M)– Remote Headworks Rehabilitation– Somerville CSO Gate/Stop Log Replacements– Alewife Brook Pump Station Rehabilitation– Prison Point HVAC Replacement– Nut Island Mechanical and Electrical
Replacements
Wastewater Treatment – Deer Island• Deer Island Asset Protection ($ 512M)
– Clarifier Rehabilitation ($ 60M)– North Main Pump Station VFDs ($ 50M)– Heat Loop Piping Replacement ($ 14M)– Digester Sludge Pump Replacement ($ 3M)– Digester Modules 1 and 2 Piping
Replacement ($ 13M)
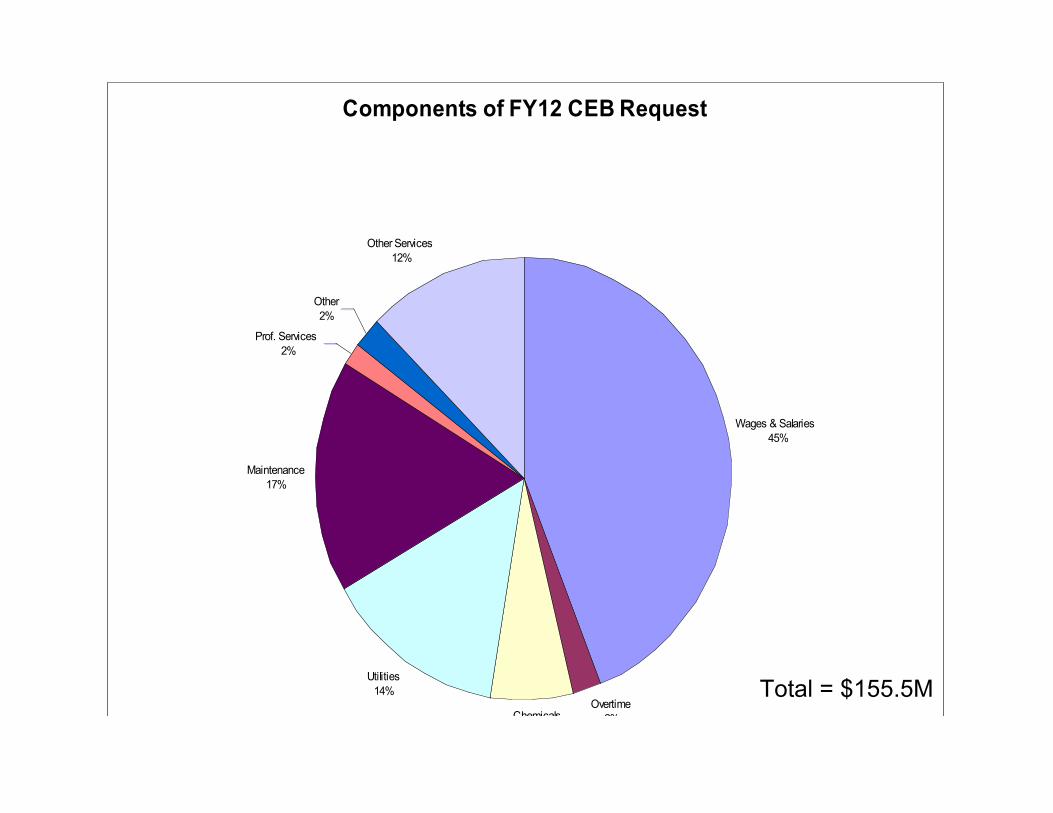
Components of FY12 CEB Request
Wages & Salaries
45%
Overtime
2%Chemicals
6%
Utilities
14%
Maintenance
17%
Prof. Services
2%
Other
2%
Other Services
12%
Total = $155.5M

Operations Division FY12 CEB Maintenance Request
Building & Grounds
Serv.
12%
Electrical Materials
5%
HVAC Materials
2%
Plant & Mach. Materials
25%Spec. Equip Materials
6%
Electrical Services
9%
Other Materials &
Services
41%
Total = $26.2 M
Total Services = 62% or $16.2M

Service contracts
• Maintenance contracts– Cryogenics - Janitorial – Centrifuge - Landscape– Combustion Turbine Gen - Paving– Steam Turbine Generator - Hydraulics– Boiler - Elevator– M/V Electrical Testing - Crane– Variable Frequency Drives - Air Compressor– Pest Control - Security

Maintenance Planning
• Maintenance Priority List– Meet weekly with
operations/Maintenance/Engineering– Discuss highest priority work– Maintenance uses meeting to create area Daily
Dispatch• Daily Dispatch record
– Plan for tomorrow and schedule for the day– Schedule eights hour of work for all technicians– Includes WO#, Description, Location, # of hours– Priority work/PM/Projects– Management tracks productivity
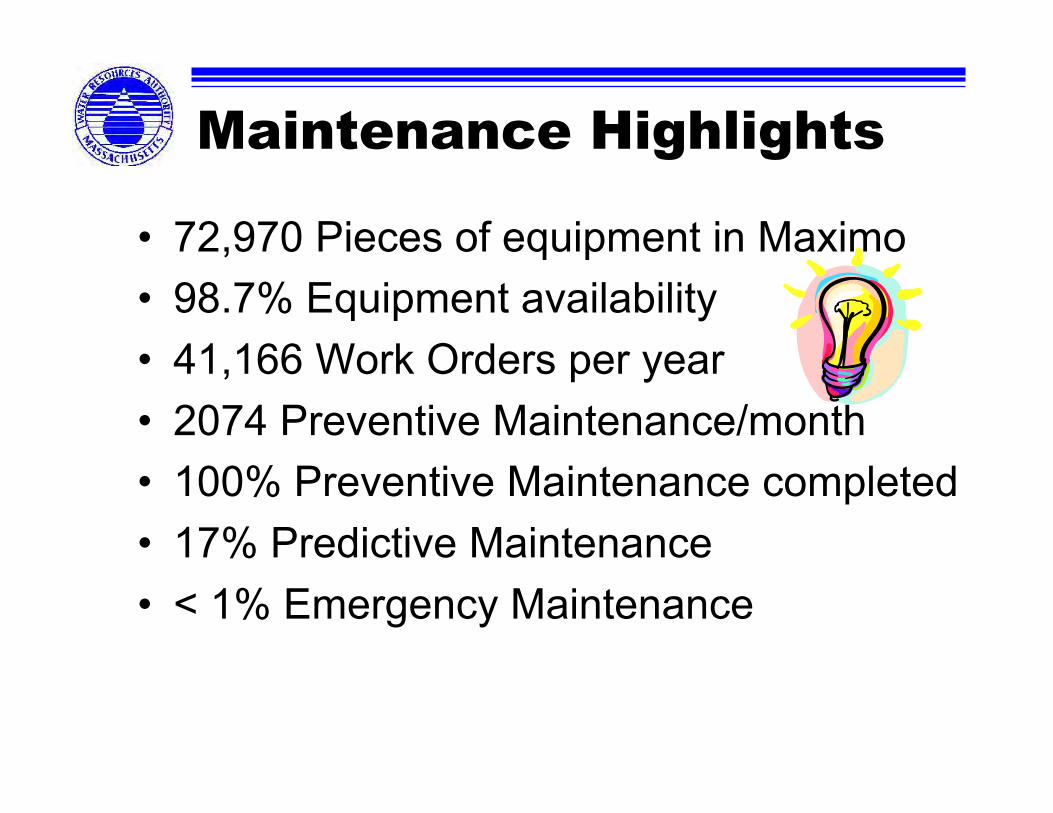
Maintenance Highlights
• 72,970 Pieces of equipment in Maximo• 98.7% Equipment availability• 41,166 Work Orders per year• 2074 Preventive Maintenance/month• 100% Preventive Maintenance completed• 17% Predictive Maintenance• < 1% Emergency Maintenance
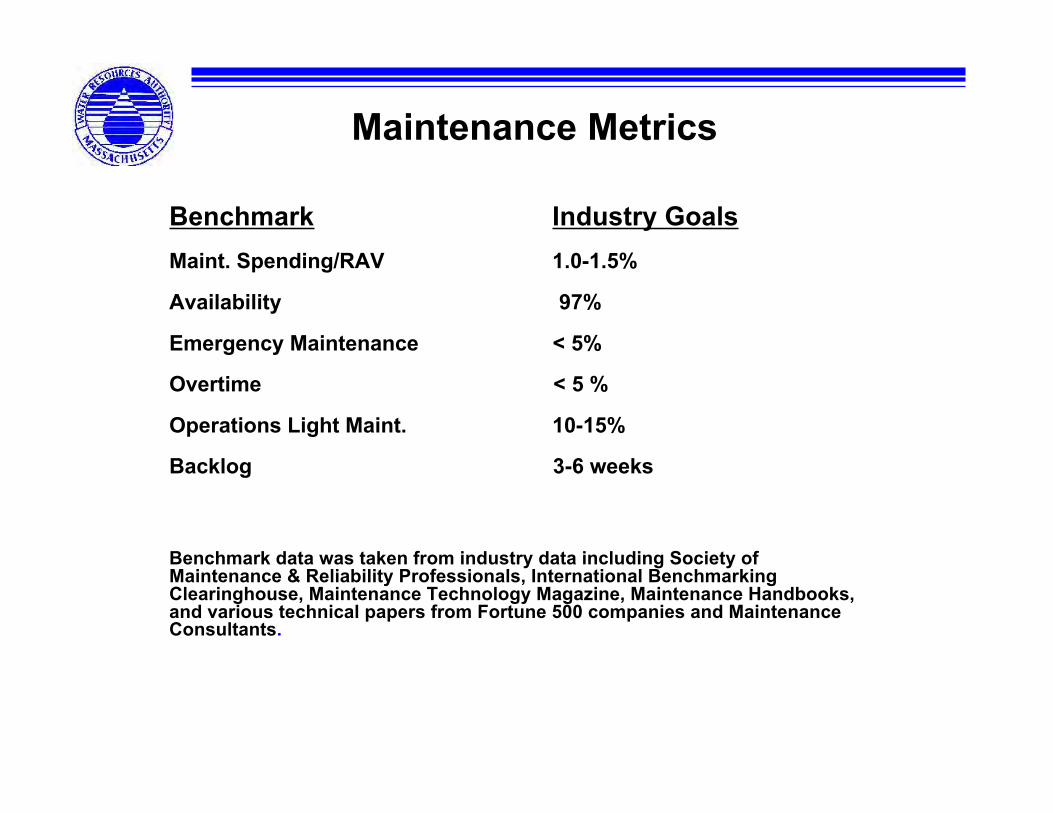
Maintenance Metrics
Benchmark Industry Goals Maint. Spending/RAV 1.0-1.5%
Availability 97%
Emergency Maintenance < 5%
Overtime < 5 %
Operations Light Maint. 10-15%
Backlog 3-6 weeks
Benchmark data was taken from industry data including Society ofMaintenance & Reliability Professionals, International BenchmarkingClearinghouse, Maintenance Technology Magazine, Maintenance Handbooks,and various technical papers from Fortune 500 companies and MaintenanceConsultants.
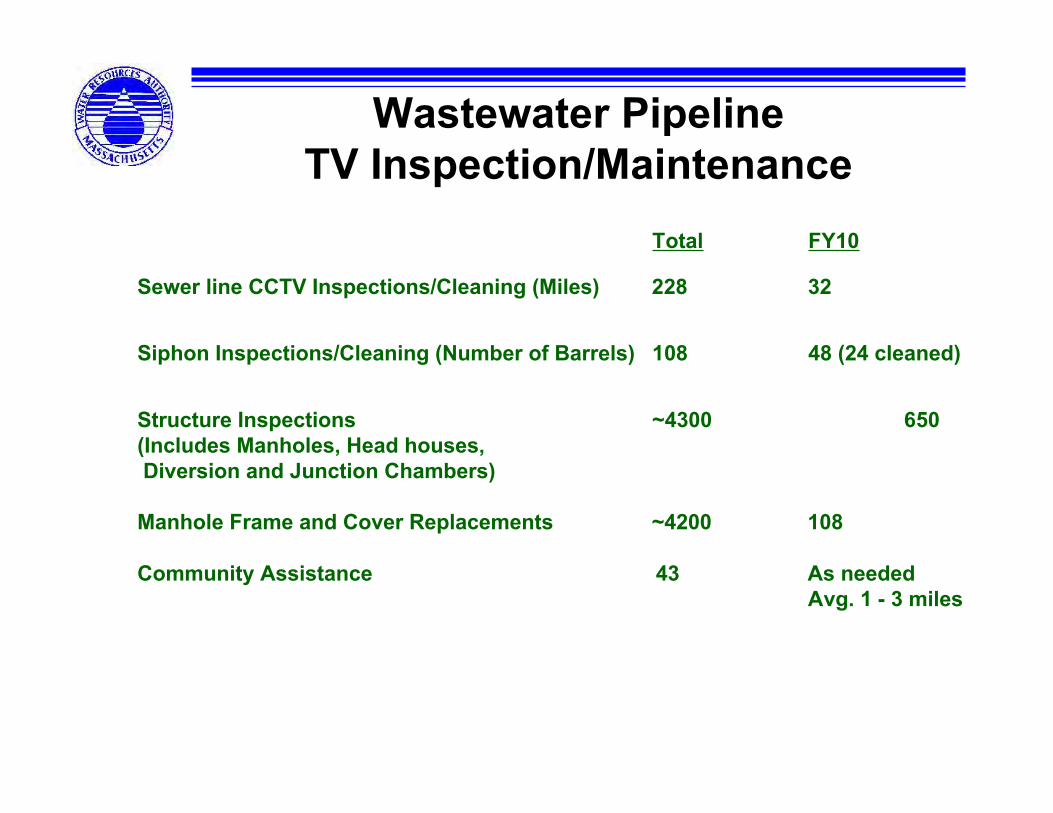
Wastewater PipelineTV Inspection/Maintenance
Total FY10
Sewer line CCTV Inspections/Cleaning (Miles) 228 32
Siphon Inspections/Cleaning (Number of Barrels) 108 48 (24 cleaned)
Structure Inspections ~4300 650(Includes Manholes, Head houses, Diversion and Junction Chambers)
Manhole Frame and Cover Replacements ~4200 108
Community Assistance 43 As neededAvg. 1 - 3 miles
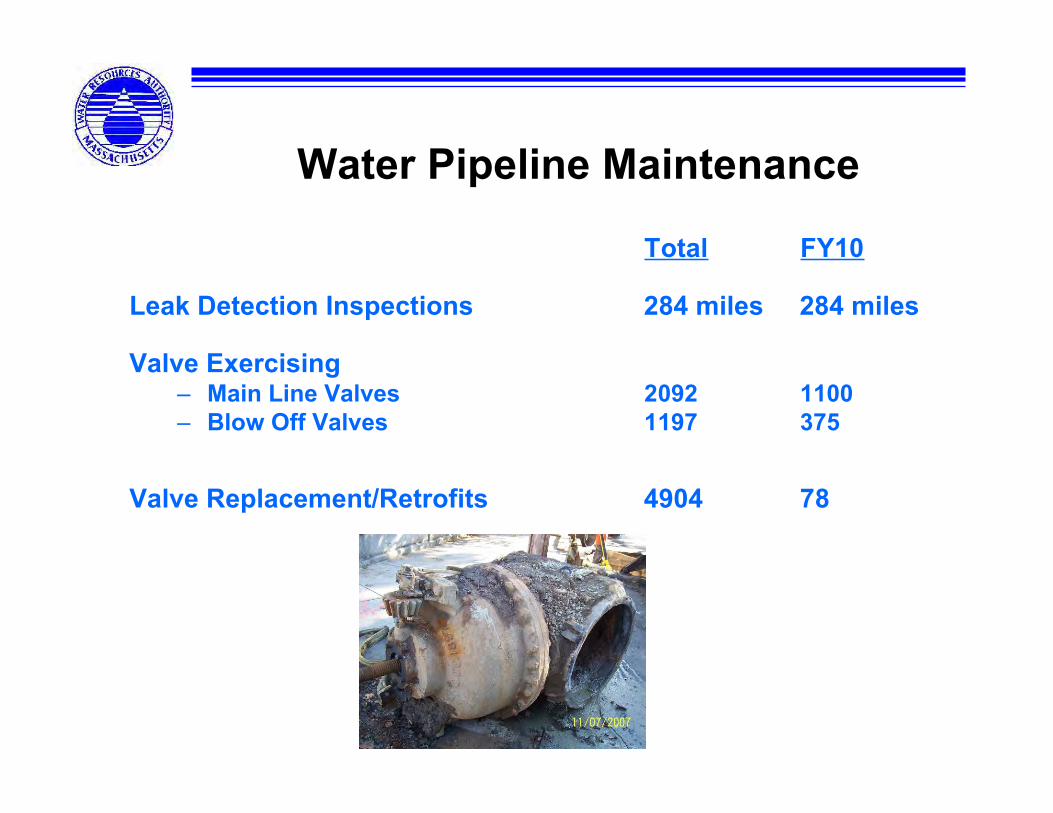
Water Pipeline Maintenance
Total FY10
Leak Detection Inspections 284 miles 284 miles
Valve Exercising– Main Line Valves 2092 1100– Blow Off Valves 1197 375
Valve Replacement/Retrofits 4904 78

Preventive Maintenance
0
10
20
30
40
50
60
70
80
90
100
FY00
FY02
FY04
FY06
FY08
FY10
% o
f W
ork
Ord
ers
Co
mp
lete
d Industry Benchmark
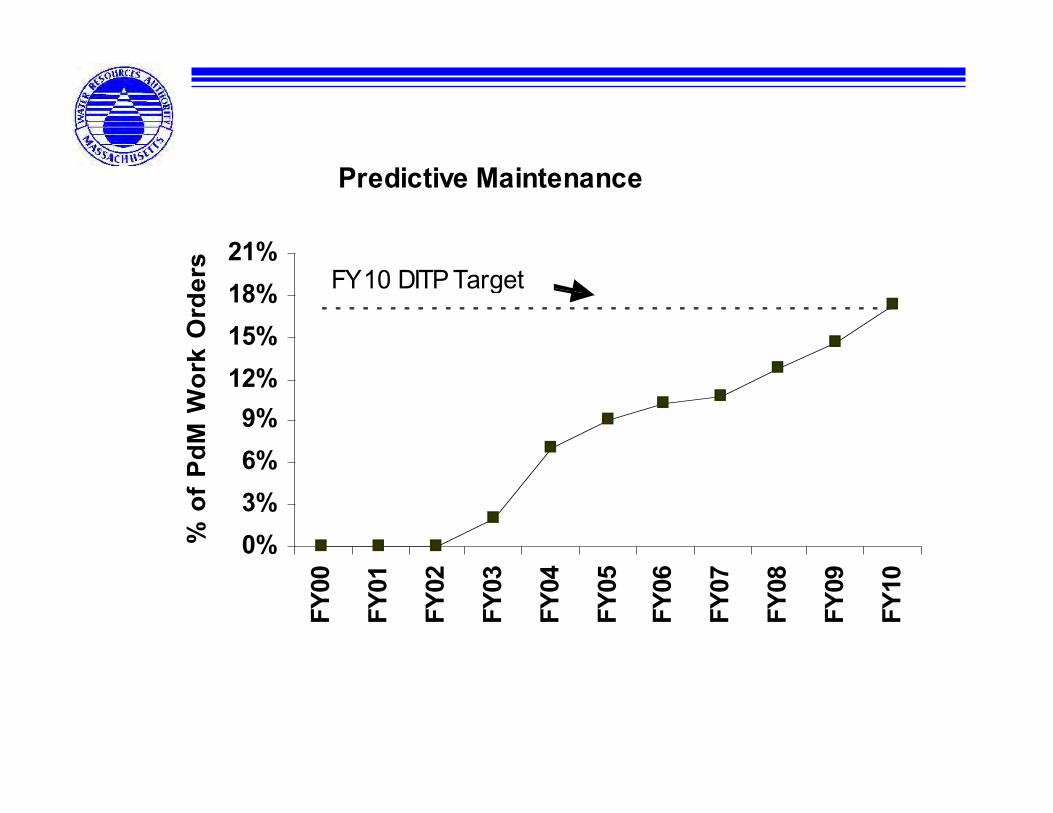
Predictive Maintenance
0%
3%
6%
9%
12%
15%
18%
21%
FY
00
FY
01
FY
02
FY
03
FY
04
FY
05
FY
06
FY
07
FY
08
FY
09
FY
10
% o
f P
dM
Wo
rk
Ord
ers
FY10 DITP Target

Operations Light Maintenance PMs
0%2%
4%6%
8%10%
12%14%
16%18%
20%F
Y00
FY
02
FY
04
FY
06
FY
08
FY
10
% o
f T
ota
l P
M H
ou
rs
Industry Benchmark
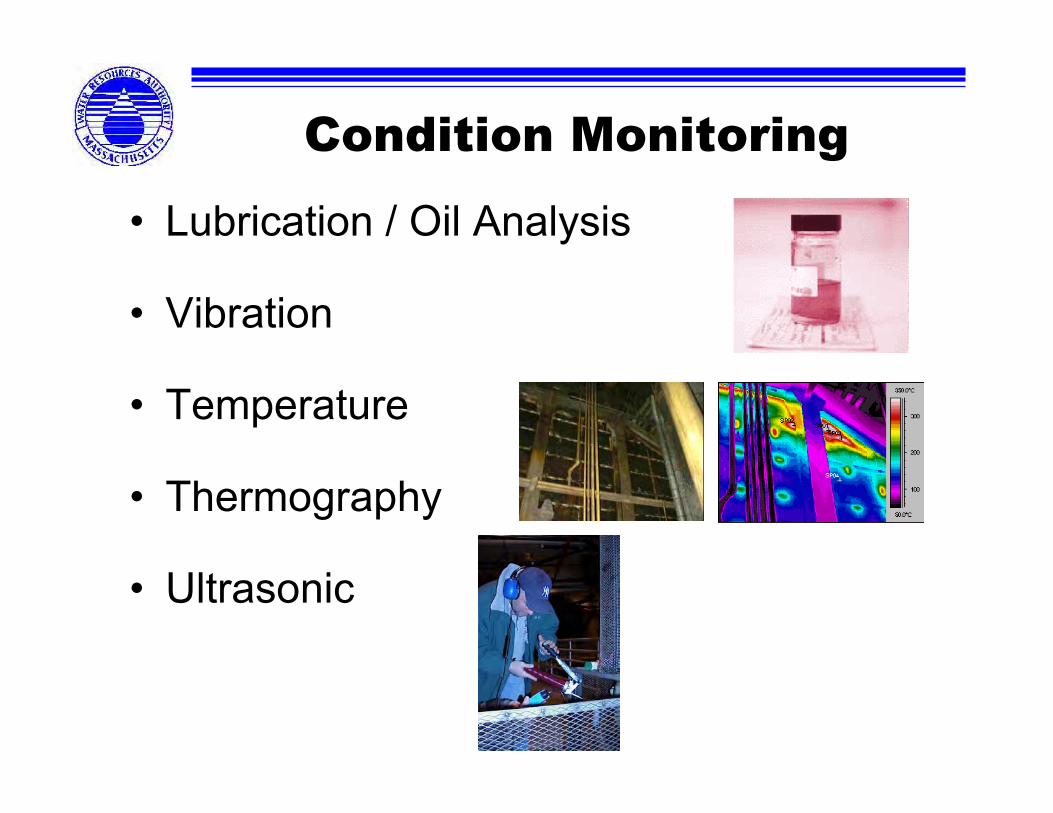
Condition Monitoring
• Lubrication / Oil Analysis
• Vibration
• Temperature
• Thermography
• Ultrasonic

Condition MonitoringWater Leak Detection Program


Software Utilization• Maximo 5.2 (upgrade to 7.0 on 12/1/11)• Lawson/Maximo interface• Increase Functionality
– Attached documents– Data-base roll-up– Performance reporting– Required fields– PICS Maximo Interface– Enhanced Queries
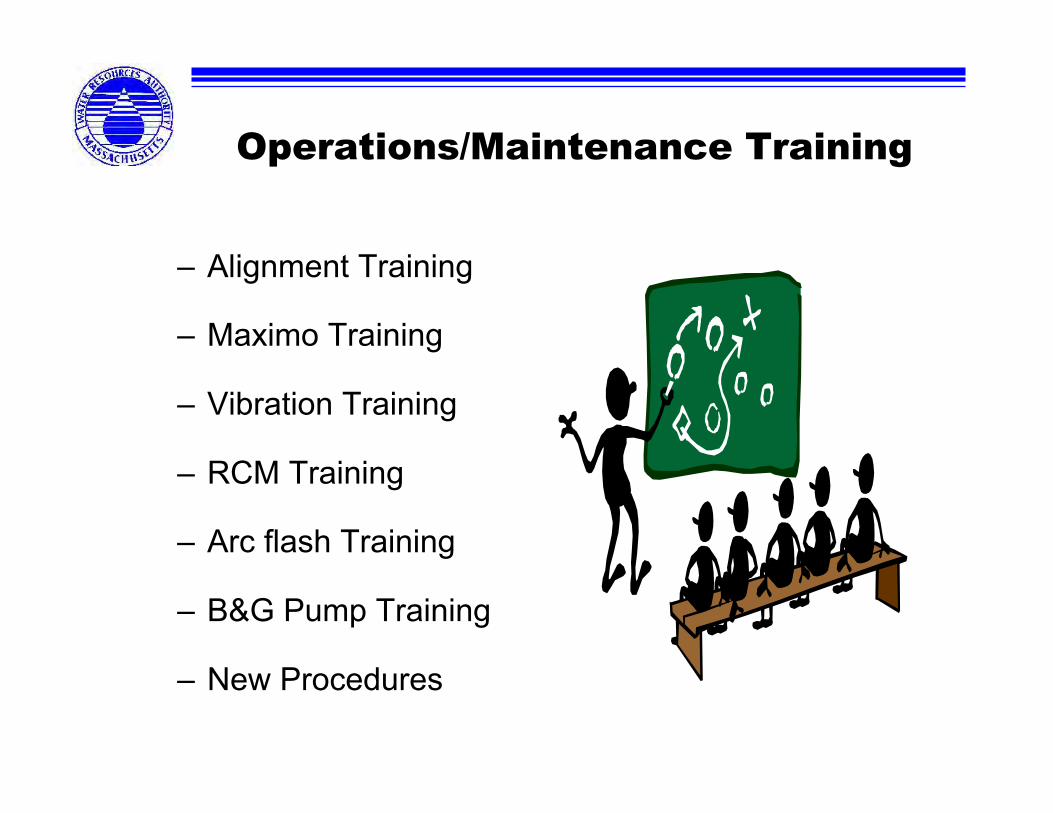
Operations/Maintenance Training
– Alignment Training
– Maximo Training
– Vibration Training
– RCM Training
– Arc flash Training
– B&G Pump Training
– New Procedures
FAMP
Condition Monitoring
InventorySpares
Training
Procedures
QA/QC
Planning
Scheduling
Maximo Condition Assessments
Preventive, Predictive, Corrective Maintenance
Bench
markin
g
(Metr
ics)
Master Plan
Management Commitment
CooperativeMaintenance
andOperationsPartnership
leads toMaintenanceExcellence
Questions