Embed Size (px)
Citation preview

Optical MetrologyLecture 1: Introduction

Contact detailsInstructor: Andrés G. Marrugo, Ph.D.
Schedule: Fridays 18:00 - 21:00
email: [email protected]
twitter: @DrMarrugo
Course web site:
agmarrugo.github.io/optical-metrology
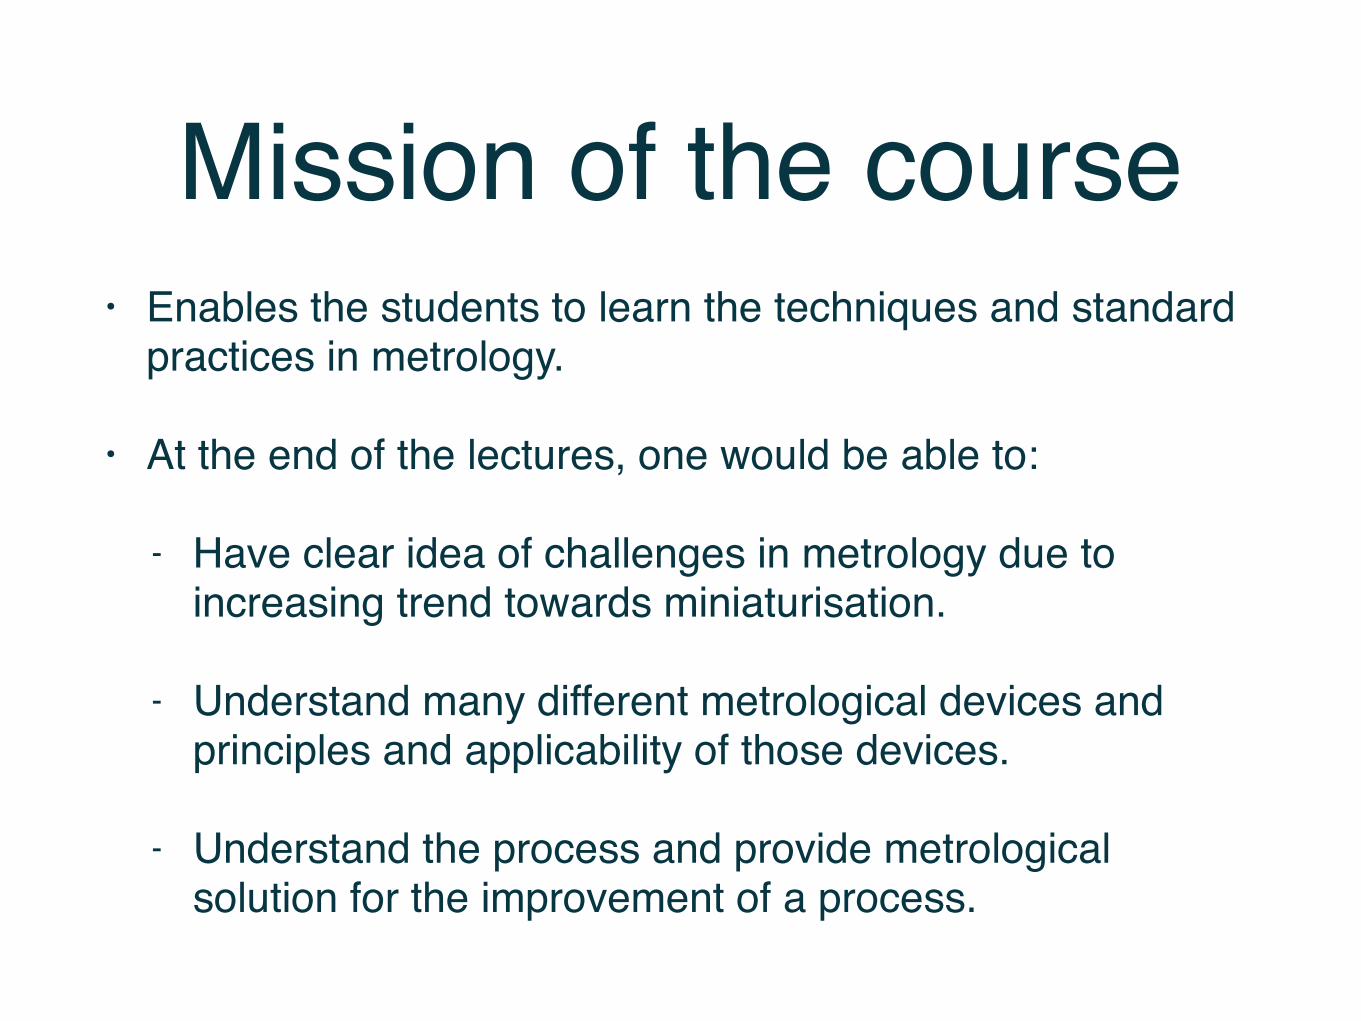
Mission of the course• Enables the students to learn the techniques and standard
practices in metrology.
• At the end of the lectures, one would be able to:
- Have clear idea of challenges in metrology due to increasing trend towards miniaturisation.
- Understand many different metrological devices and principles and applicability of those devices.
- Understand the process and provide metrological solution for the improvement of a process.
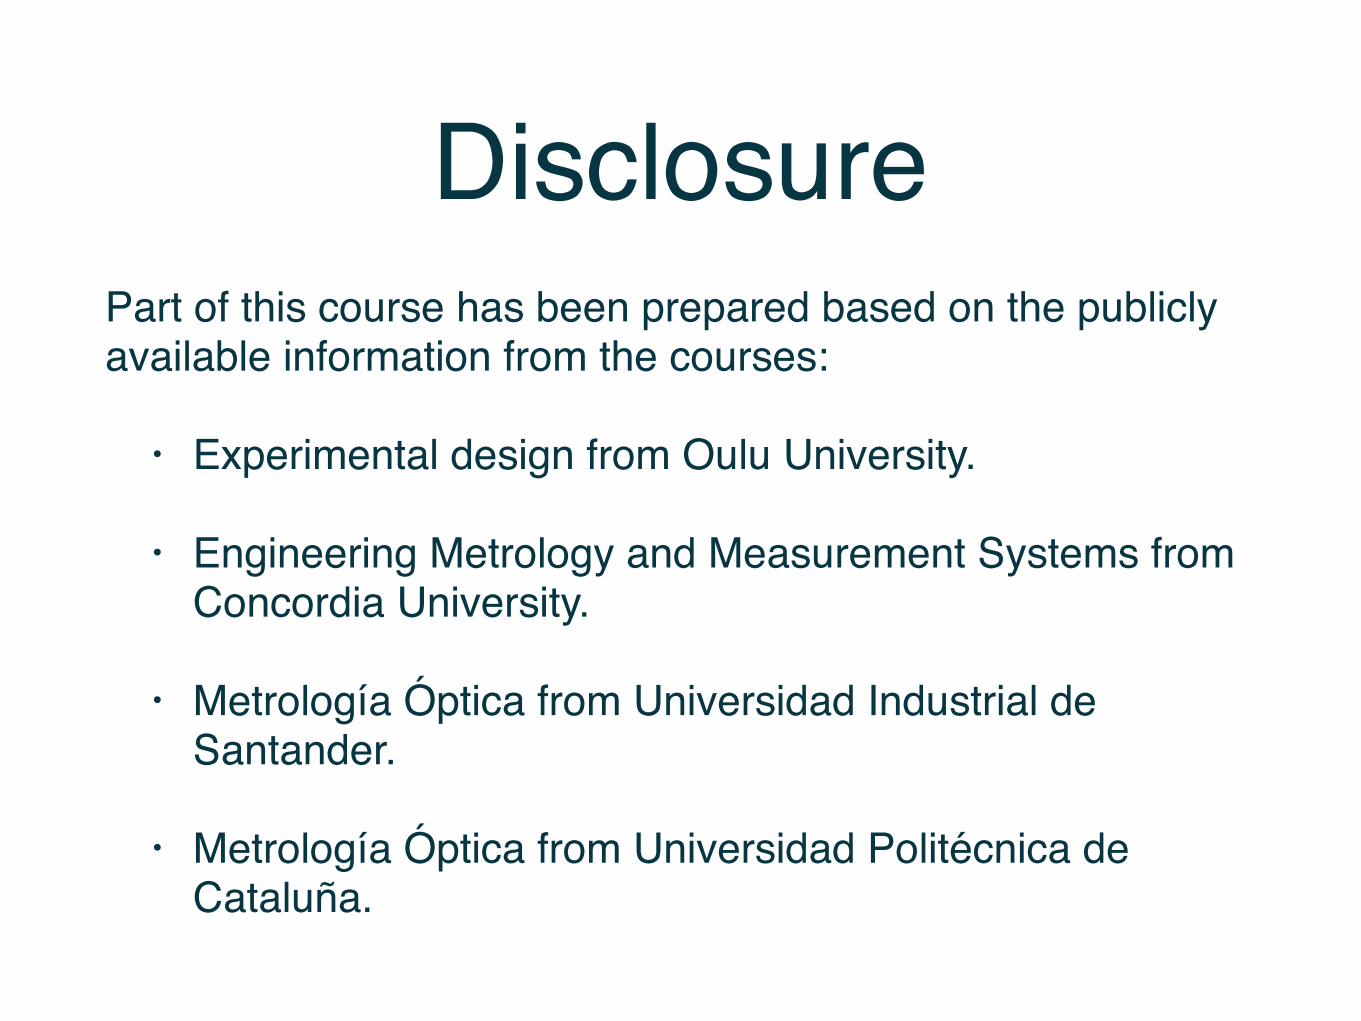
DisclosurePart of this course has been prepared based on the publicly available information from the courses:
• Experimental design from Oulu University.
• Engineering Metrology and Measurement Systems from Concordia University.
• Metrología Óptica from Universidad Industrial de Santander.
• Metrología Óptica from Universidad Politécnica de Cataluña.
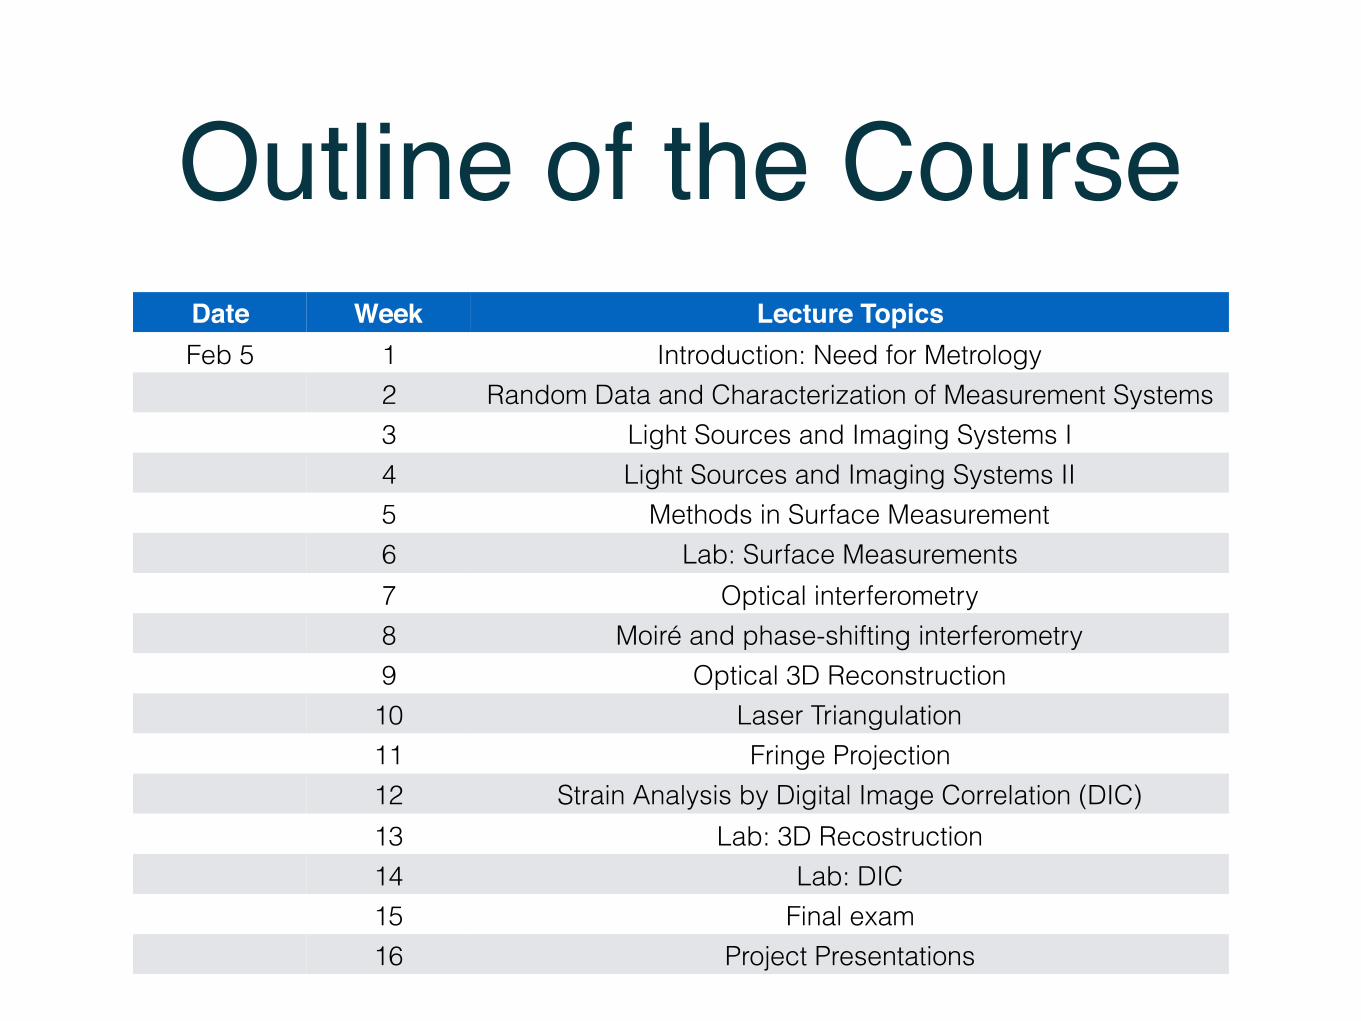
Outline of the CourseDate Week Lecture TopicsFeb 5 1 Introduction: Need for Metrology
2 Random Data and Characterization of Measurement Systems3 Light Sources and Imaging Systems I4 Light Sources and Imaging Systems II5 Methods in Surface Measurement6 Lab: Surface Measurements7 Optical interferometry8 Moiré and phase-shifting interferometry9 Optical 3D Reconstruction
10 Laser Triangulation11 Fringe Projection12 Strain Analysis by Digital Image Correlation (DIC)13 Lab: 3D Recostruction14 Lab: DIC15 Final exam16 Project Presentations
About the course• Metrology is the science of measurement that deals
with resolution, accuracy and repeatability.
- Lectures - 2.5 hours each
- 11 Lectures of all.
- 3 Laboratory practices.
- 1 Project - due last week of classes.
- Mid term and Final exam.
Text book and other referencesTextbook
There is no prescribed textbook for this course. Lecture notes available at the course webpage.
References (not exhaustive)
Gary Cloud: Optical Methods of Engineering Analysis, Prentice Hall; 1998.
K. J. Gasvik, Optical Metrology, Wiley, 2002.
Manuel Servin, J. Antonio Quiroga, Moises Padilla, Fringe Pattern Analysis for Optical.Metrology: Theory, Algorithms, and Applications, Wiley, 2014.
J. Bendat, A Piersol, Random Data: Analisys and Measurement Procedures, Wiley, 2000.
The Project
• A project related to Optical Metrology.
• Literature review and theoretical work will be needed to complete the work.
• There will be a presentation for the project.
• Project report with calculations.
Grading Scheme• Grade composition:
- Project: 30%
- Midterm: 20%
- Final exam: 30%
- Lab reports: 20%
Content of the Lecture• History and Philosophy of measurement.
• Economic benefits.
• International trade.
• Calibration and Traceability.
• Current manufacturing trend.
• Need for precision measurement.
What is Metrology?
Bureau international des poids et mesures
Metrology is the science of measurement,embracing both experimental and theoretical determinations at any level of uncertainty in any field of science and technology.
What is Metrology?Optical
Optical Metrologyis the science and technology concerning measurements with light. Such measurements can either target properties of light itself or other properties such as some distance.
RP Photonics Encyclopedia
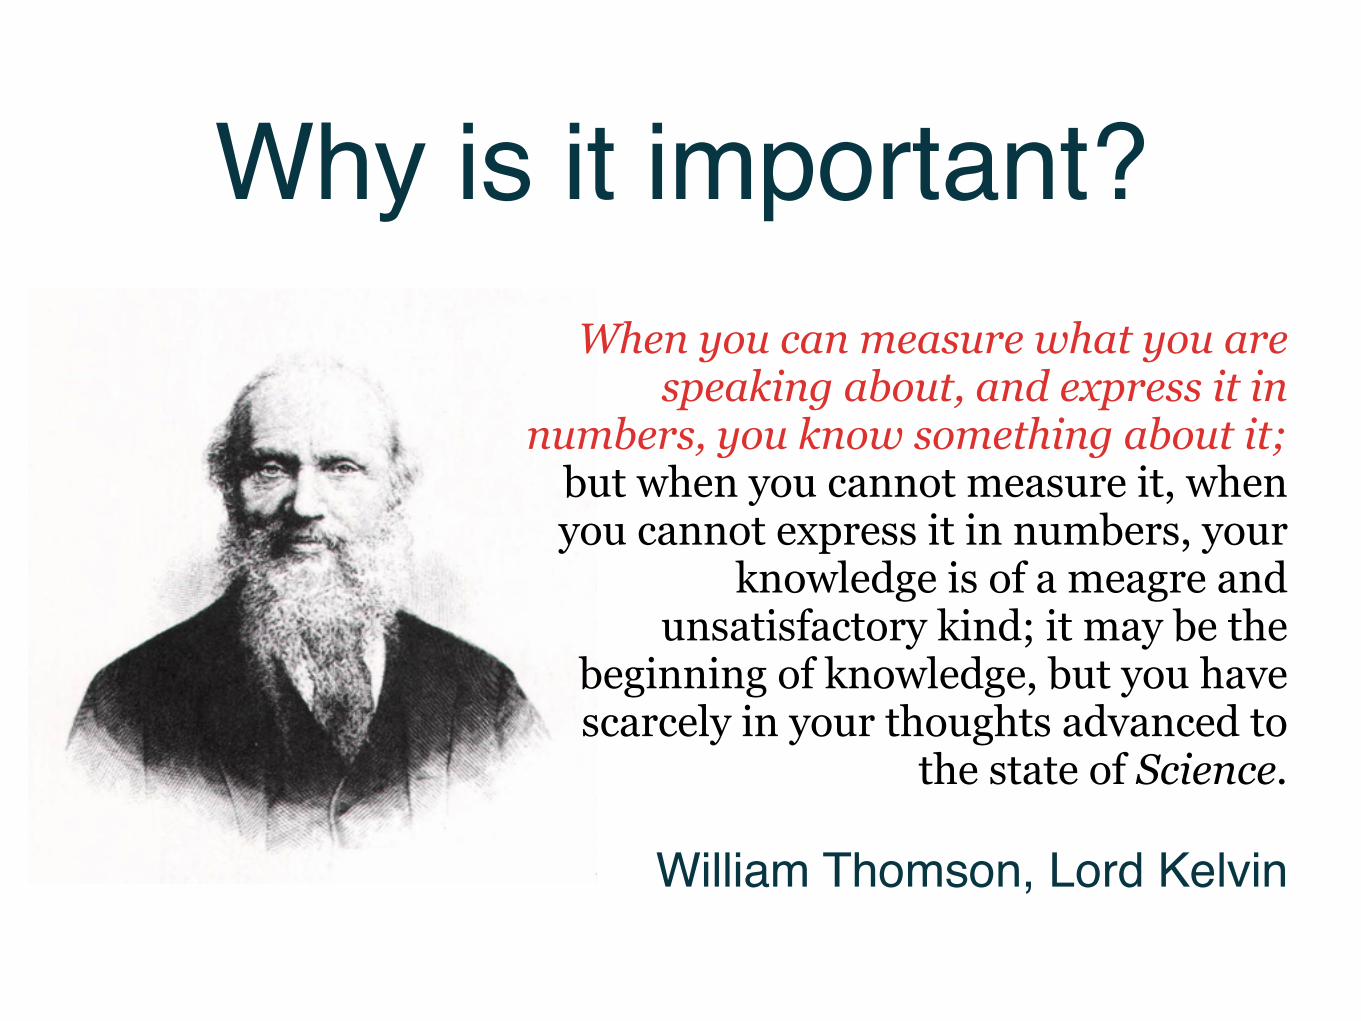
Why is it important?When you can measure what you are
speaking about, and express it in numbers, you know something about it;
but when you cannot measure it, when you cannot express it in numbers, your
knowledge is of a meagre and unsatisfactory kind; it may be the
beginning of knowledge, but you have scarcely in your thoughts advanced to
the state of Science.
William Thomson, Lord Kelvin
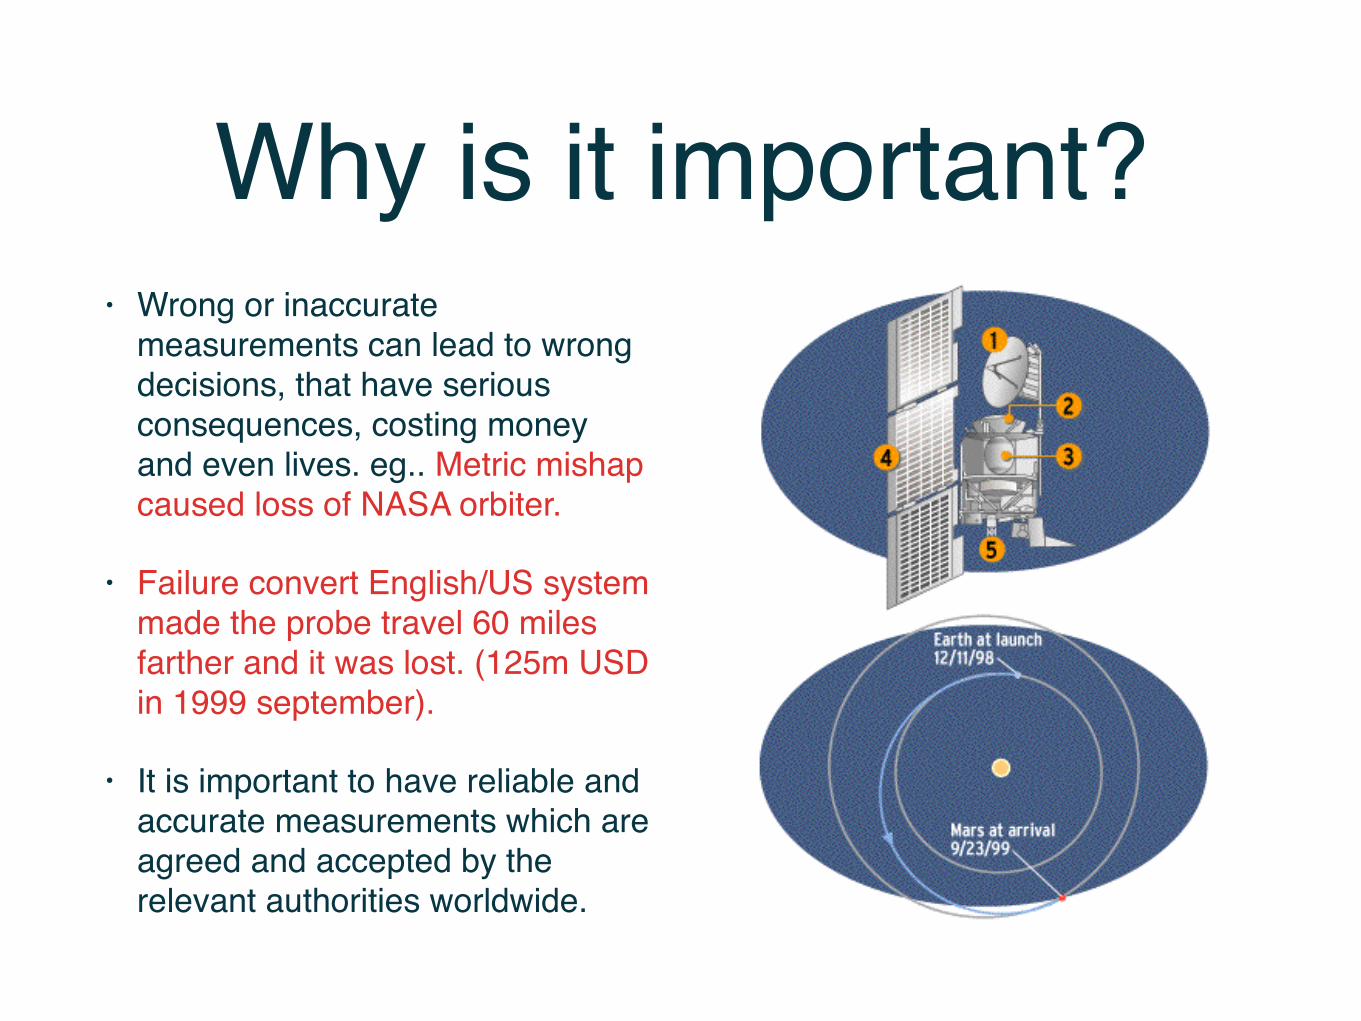
• Wrong or inaccurate measurements can lead to wrong decisions, that have serious consequences, costing money and even lives. Eg.. Metric mishap caused loss of NASA orbiter
• Failure convert English/US system made the probe travel 60 miles farther and it was lost. (125m USD in 1999 september)
• It is important to have reliable and accurate measurements which are agreed and accepted by the relevant authorities worldwide.
• Metrologists are therefore continuously involved in the development of new measurement techniques, instrumentation and procedures, to satisfy the ever-increasing demand for greater accuracy, and increased reliability.
Why is it important?Why is it important?• Wrong or inaccurate
measurements can lead to wrong decisions, that have serious consequences, costing money and even lives. eg.. Metric mishap caused loss of NASA orbiter.
• Failure convert English/US system made the probe travel 60 miles farther and it was lost. (125m USD in 1999 september).
• It is important to have reliable and accurate measurements which are agreed and accepted by the relevant authorities worldwide.
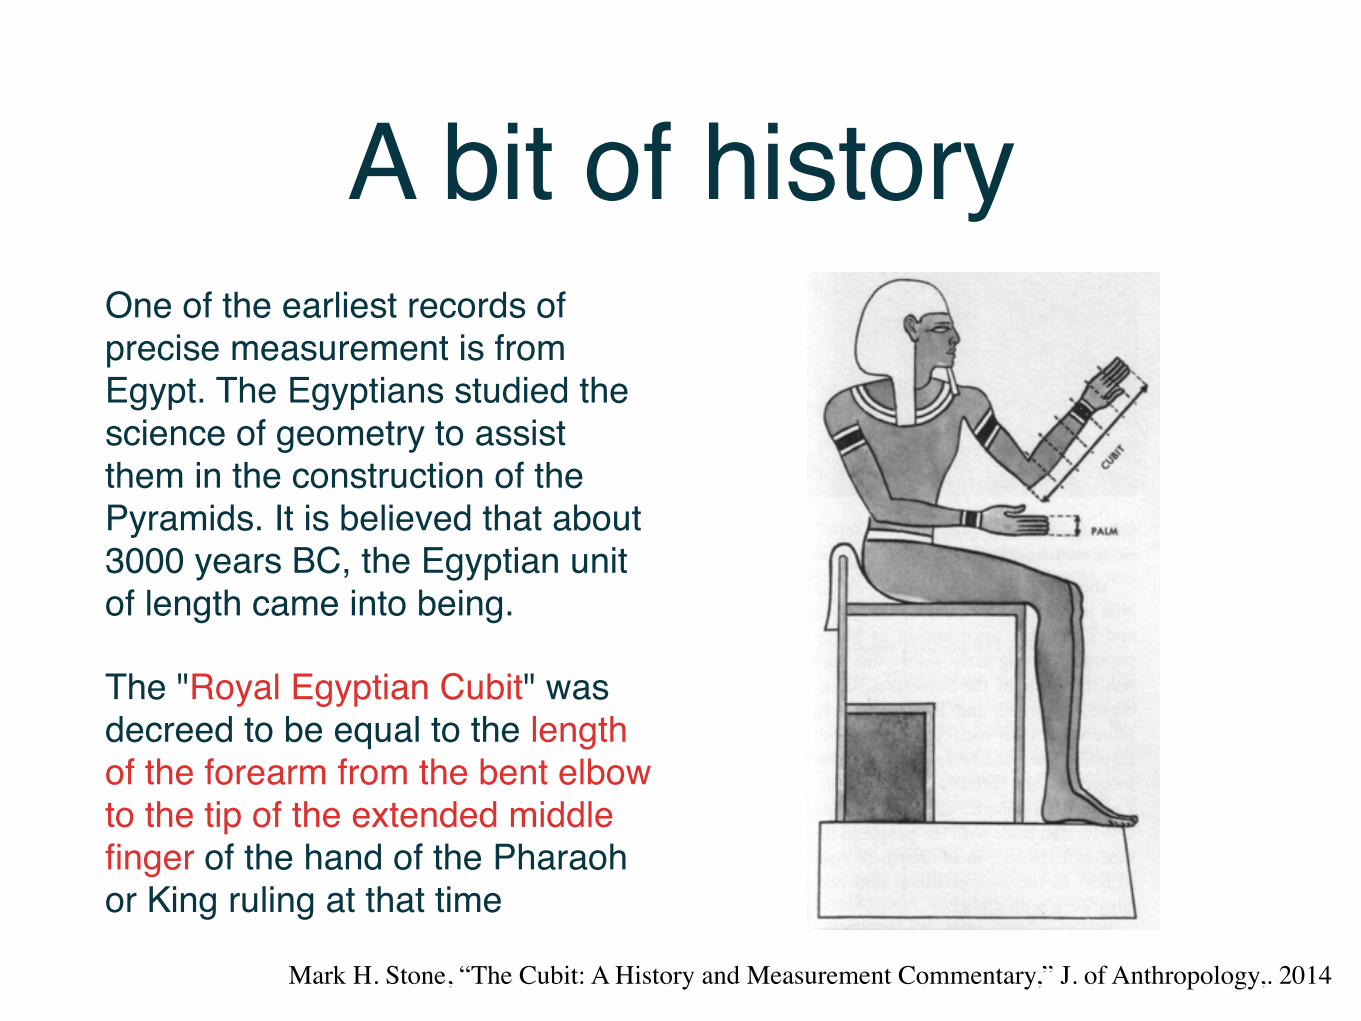
A bit of historyOne of the earliest records of precise measurement is from Egypt. The Egyptians studied the science of geometry to assist them in the construction of the Pyramids. It is believed that about 3000 years BC, the Egyptian unit of length came into being.
The "Royal Egyptian Cubit" was decreed to be equal to the length of the forearm from the bent elbow to the tip of the extended middle finger of the hand of the Pharaoh or King ruling at that time
Mark H. Stone, “The Cubit: A History and Measurement Commentary,” J. of Anthropology,. 2014

History in ImagesHistory in Images
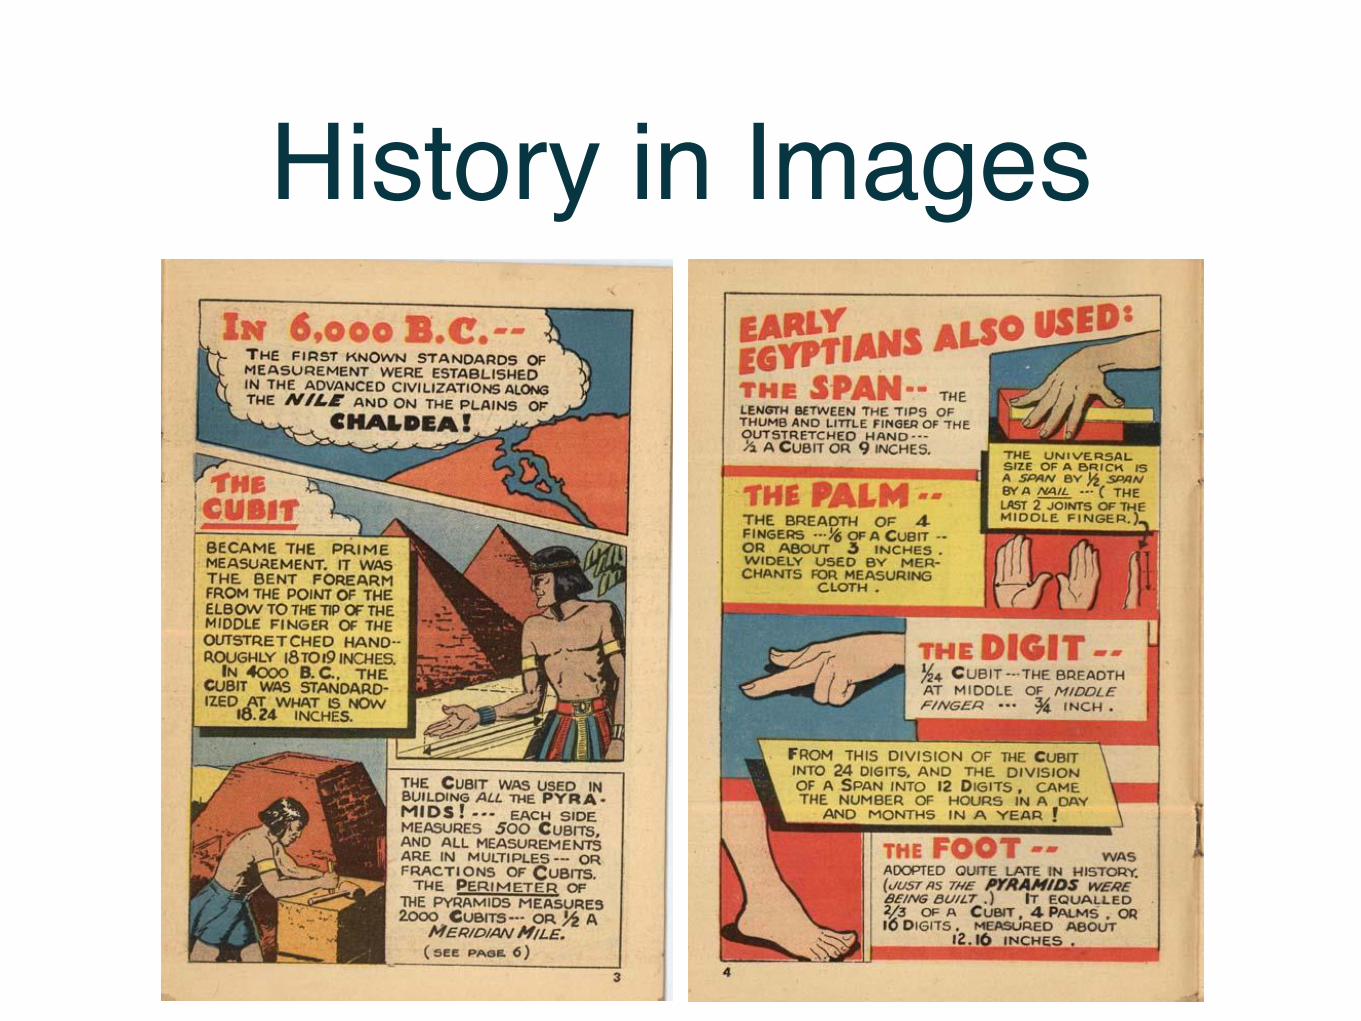
History in ImagesHistory in Images
History of Metrology• Standardization a goal of social and economic
advancement, but only in 18th century a unified measurement system.
• Earliest systems of weights and measures based on human morphology. Thus, units of measurement were not fixed. Varied from town to town, etc.
• Lack of a standardized system was a source of error and fraud in commercial transactions. Delayed international commerce and science.
Economic benefits of Metrology
Metrology is added value.
Today it is a key enabler in many areas.
Metrology is a check and balance in manufacturing.
Economic benefit is often difficult to assess.

Metrology is added value.
Example: Production of the iPhone 5.
Problem: The inlays have to match "perfectly" with the enclosure.

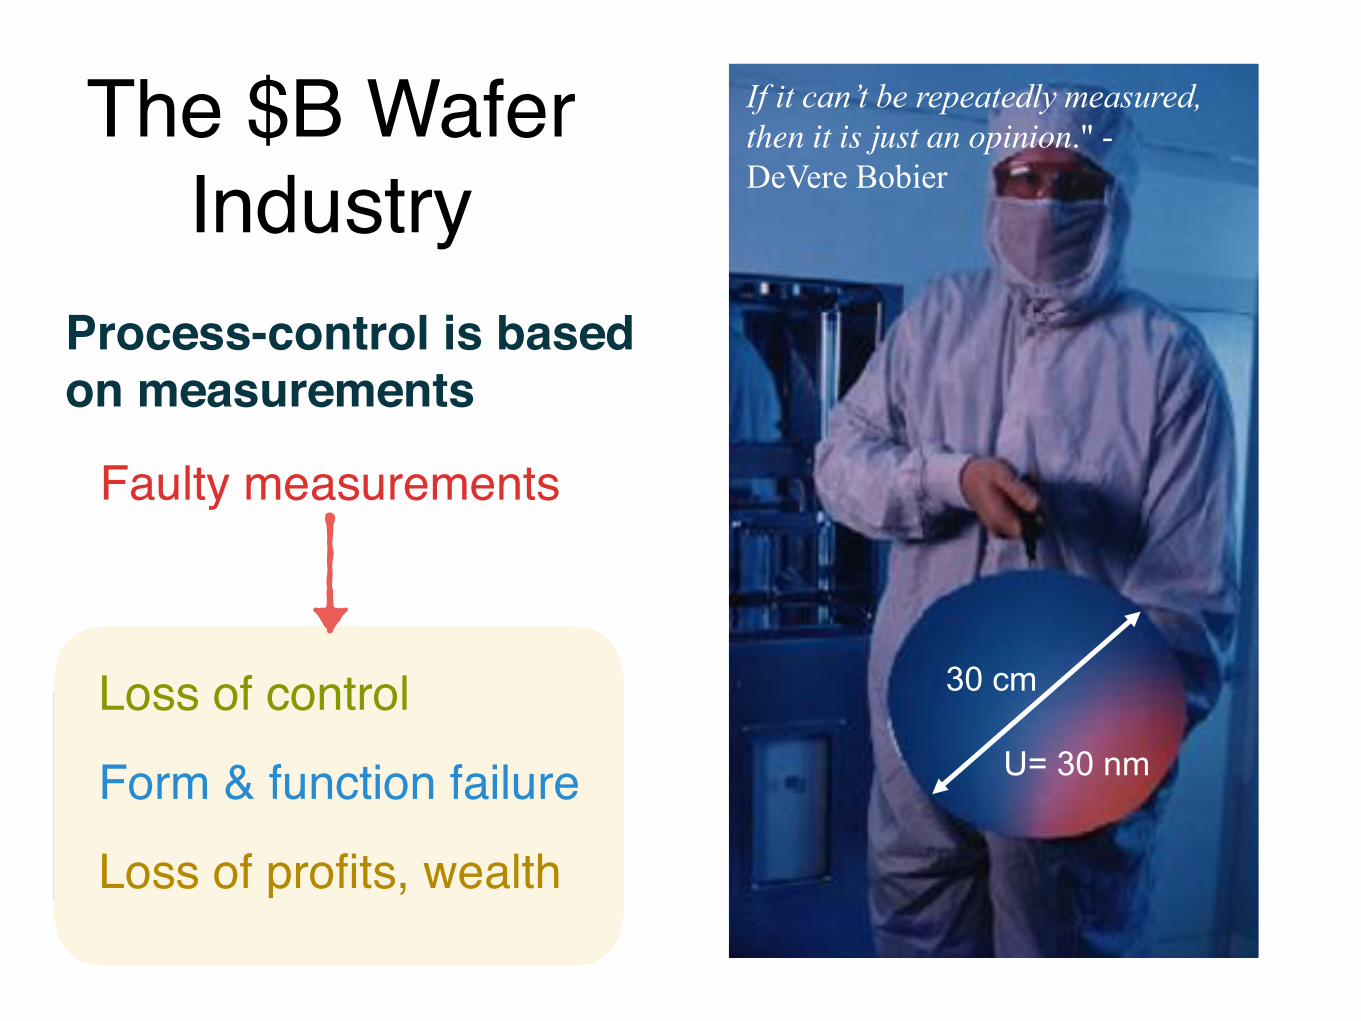
• process-control is based on measurements
• faulty measurements...• loss of control• form & function failure• loss of profits, wealth
30 cm
The $B Wafer Industry
U= 30 nm
If it can’t be repeatedly measured, then it is just an opinion." -DeVere Bobier
The $B Wafer Industry
Process-control is based on measurements
Loss of profits, wealth
Faulty measurements
Loss of control
Form & function failure
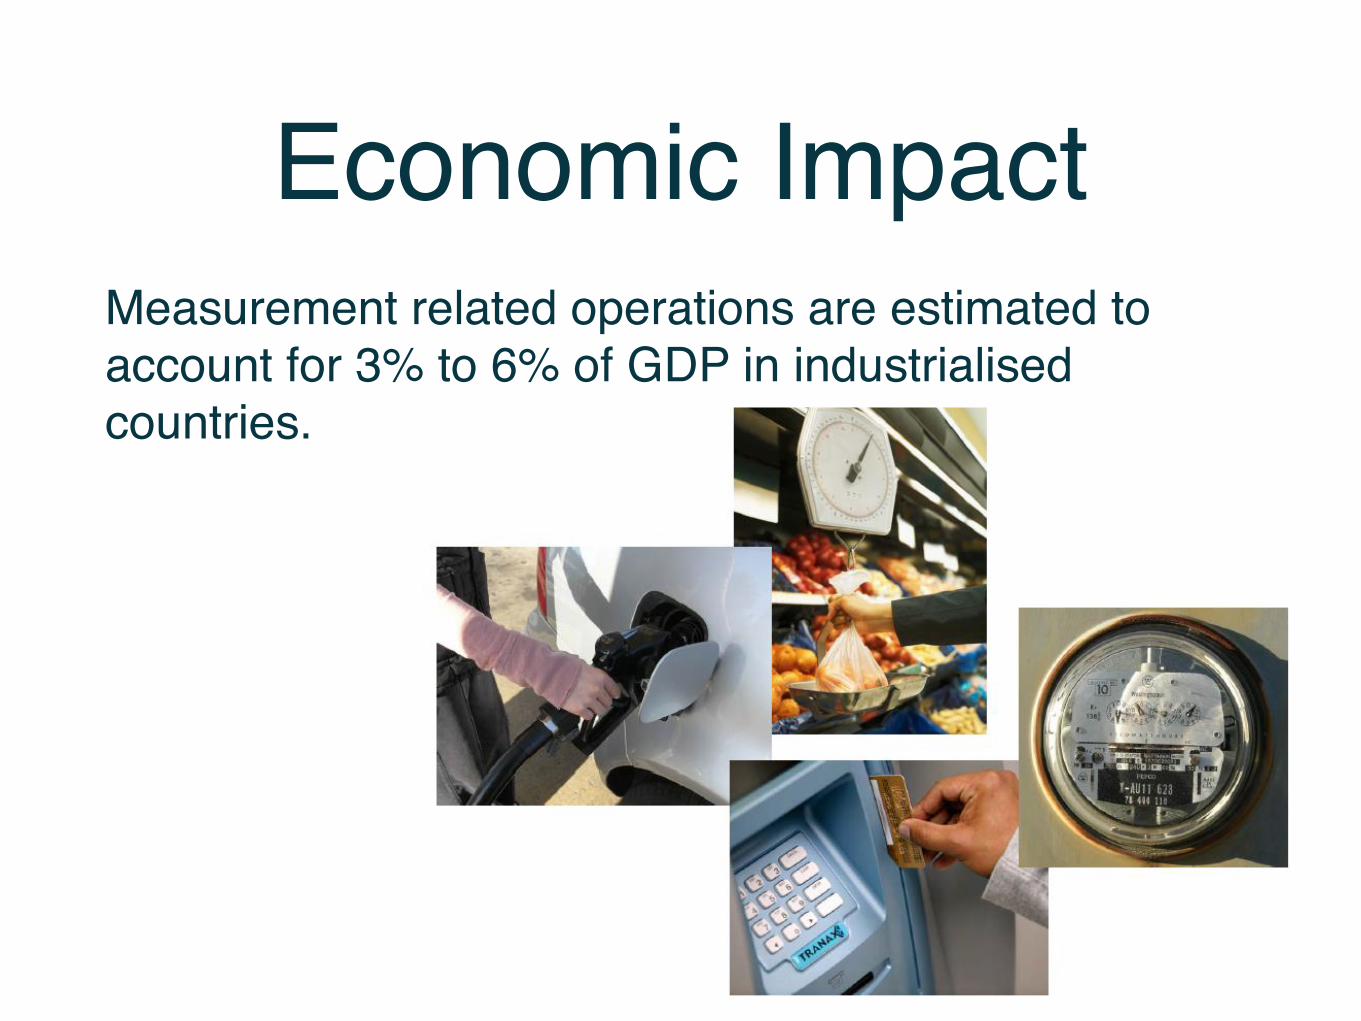
Economic ImpactMeasurement related operations are estimated to account for 3% to 6% of GDP in industrialised countries.
• UK study (on behalf of NPL and DTI) find:• Measurement in the UK delivers a significant impact on
the economy of 0.8% of GDP, which equates to 5 000 million GBP
• Government budget of NPL is about 38 million GBP per annum
Economic Impact
Economic benefits of MetrologyEconomic benefits of Metrology
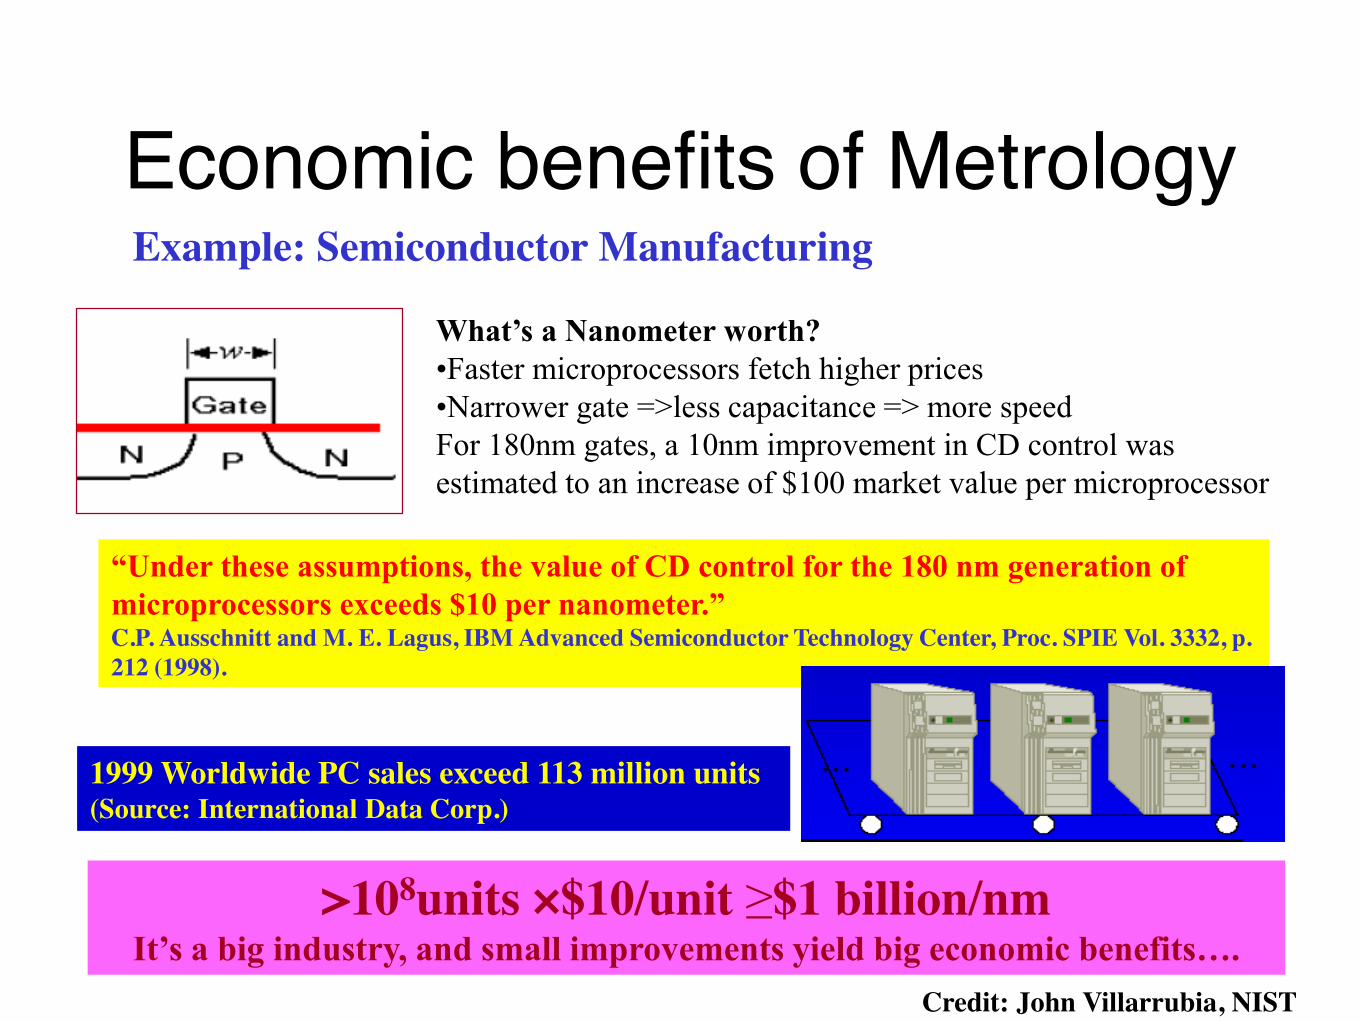
>108units ×$10/unit ≥$1 billion/nmIt’s a big industry, and small improvements yield big economic benefits….
What’s a Nanometer worth?•Faster microprocessors fetch higher prices•Narrower gate =>less capacitance => more speedFor 180nm gates, a 10nm improvement in CD control was estimated to an increase of $100 market value per microprocessor
“Under these assumptions, the value of CD control for the 180 nm generation of microprocessors exceeds $10 per nanometer.”C.P. Ausschnitt and M. E. Lagus, IBM Advanced Semiconductor Technology Center, Proc. SPIE Vol. 3332, p. 212 (1998).
1999 Worldwide PC sales exceed 113 million units (Source: International Data Corp.)
Credit: John Villarrubia, NIST
Example: Semiconductor Manufacturing
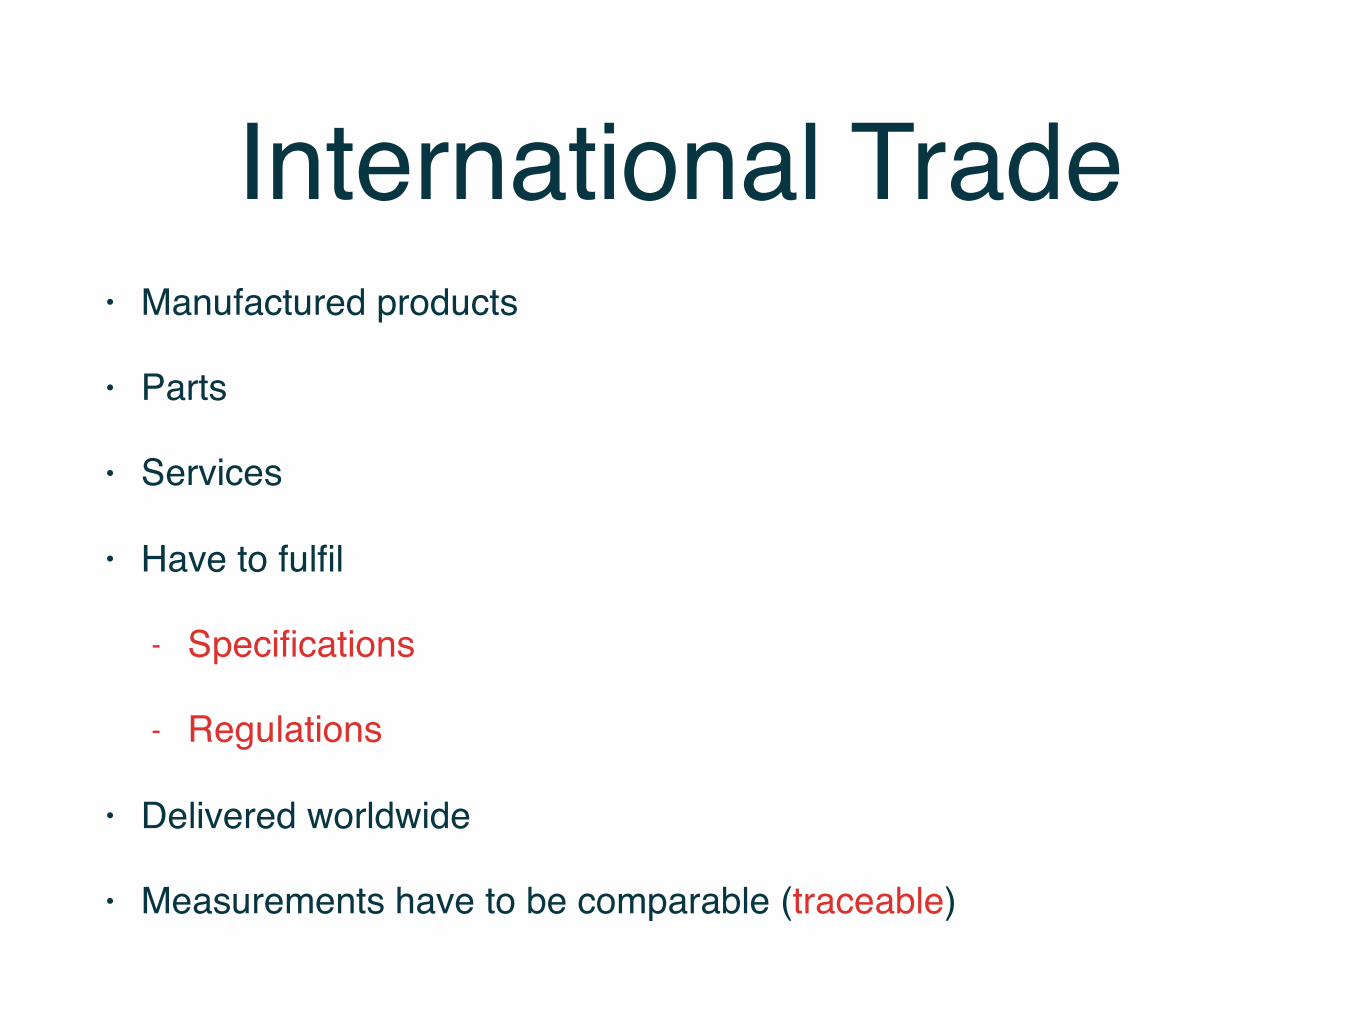
International Trade• Manufactured products
• Parts
• Services
• Have to fulfil
- Specifications
- Regulations
• Delivered worldwide
• Measurements have to be comparable (traceable)
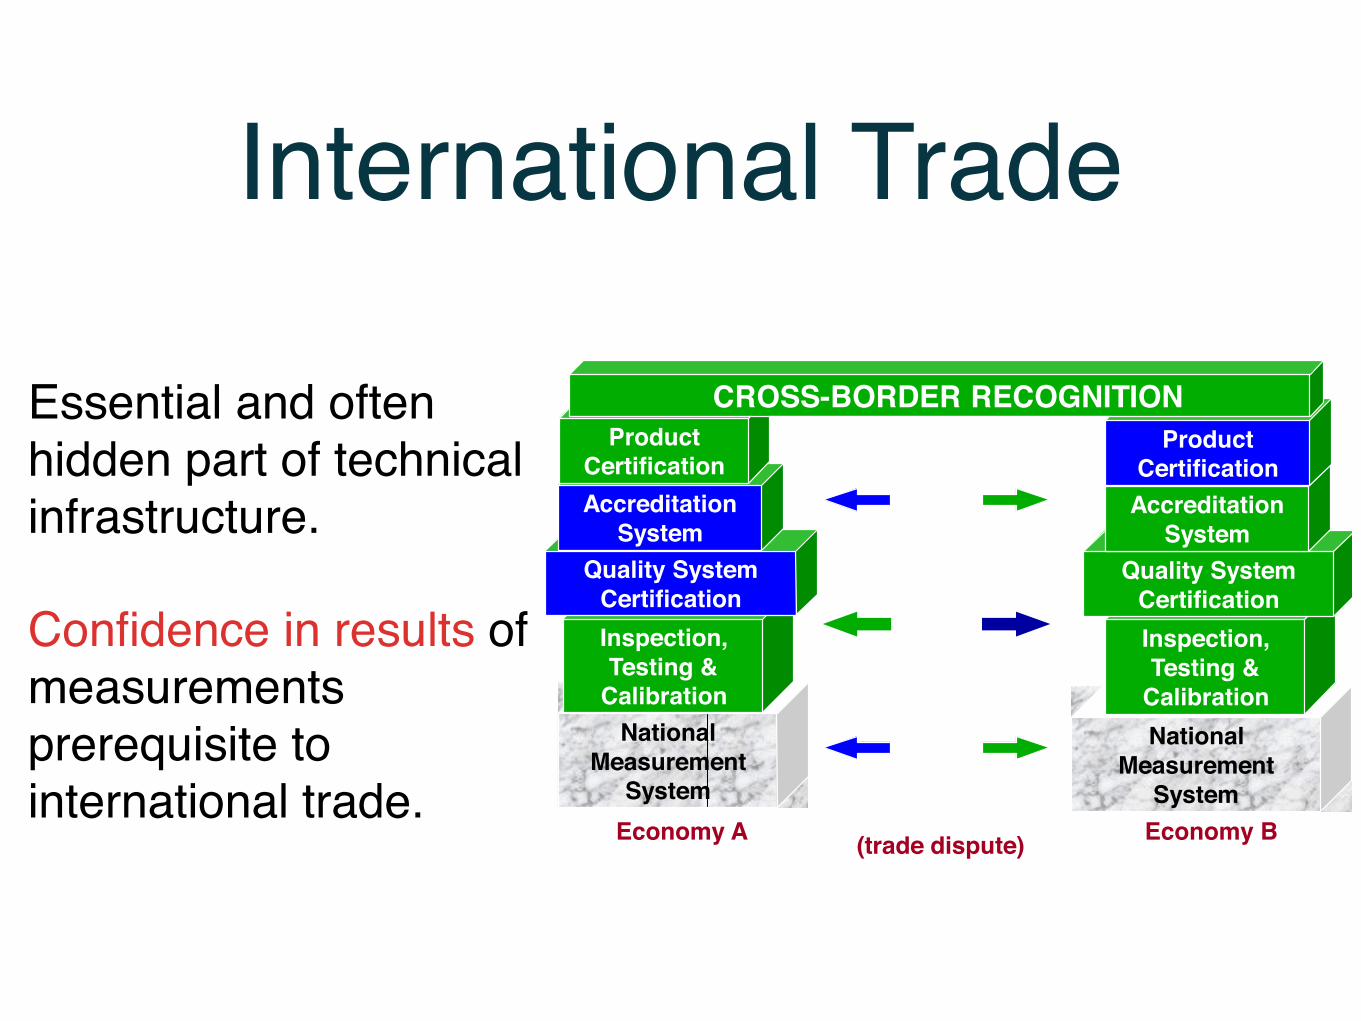
• Is an essential and often hidden part of the technical infrastructure
• Underpins any large scale industrial revolution in history
• Underpins the conformance structure of any modern economy
• Confidence in results of measurements is a prerequisite to international trade*
Economy BEconomy A
NationalMeasurement
System
NationalMeasurement
System
CONFIDENCE
Inspection,Testing &
Calibration
Quality SystemCertification
AccreditationSystem
ProductCertification
Inspection,Testing &
Calibration
Quality SystemCertification
AccreditationSystem
ProductCertification
CROSS-BORDER RECOGNITION
(trade dispute)
International Trade
* Intercomparison of scanning probe microscopes – Precision Engineering (26)
International Trade
Essential and often hidden part of technical infrastructure.
Confidence in results of measurements prerequisite to international trade.
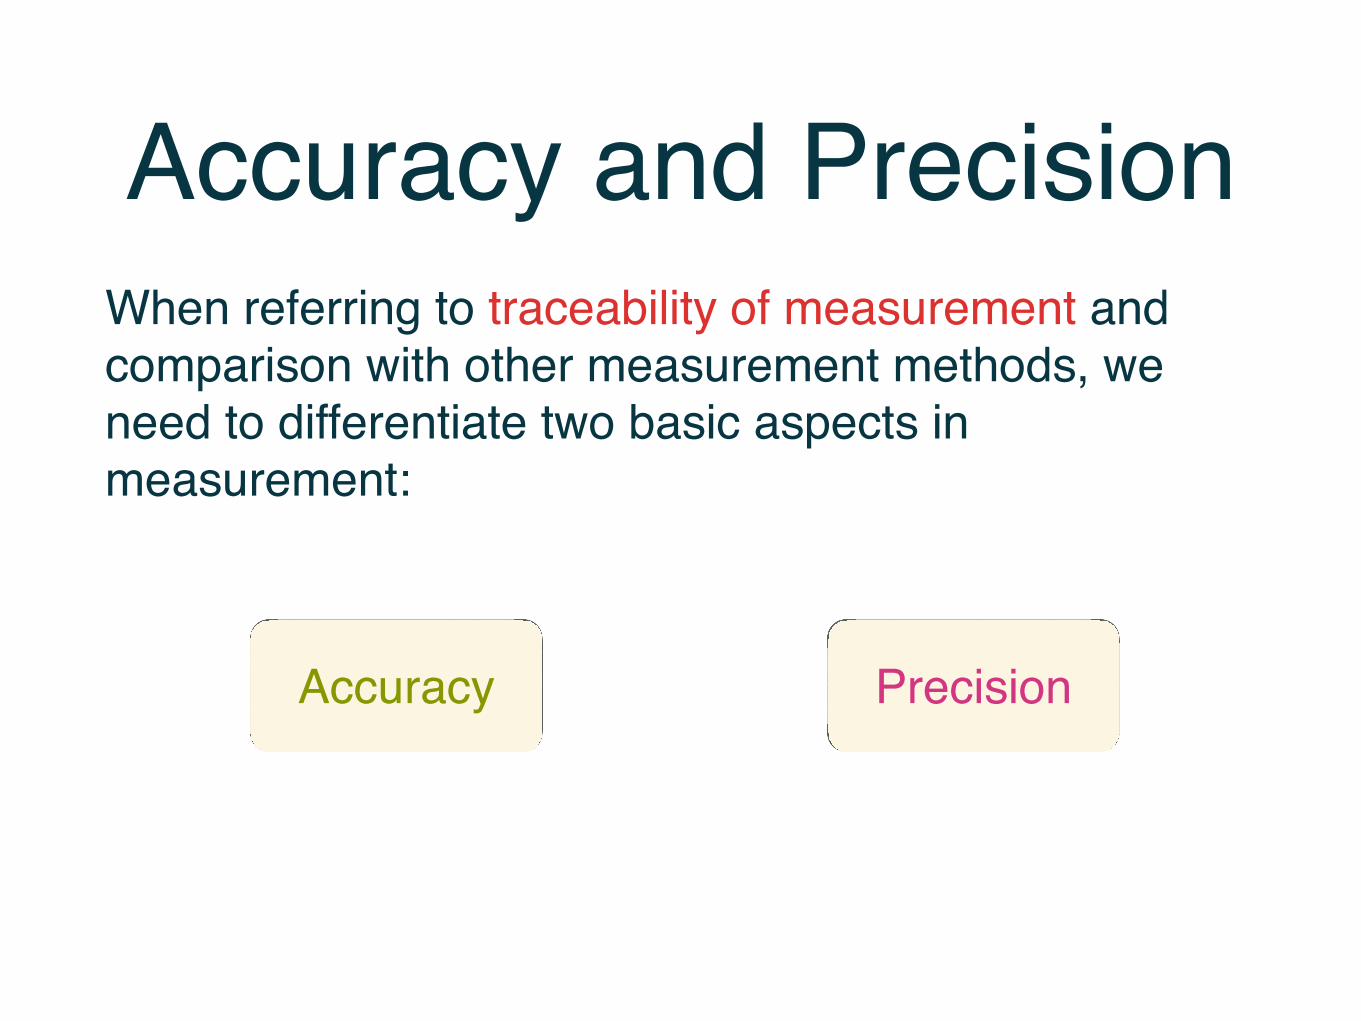
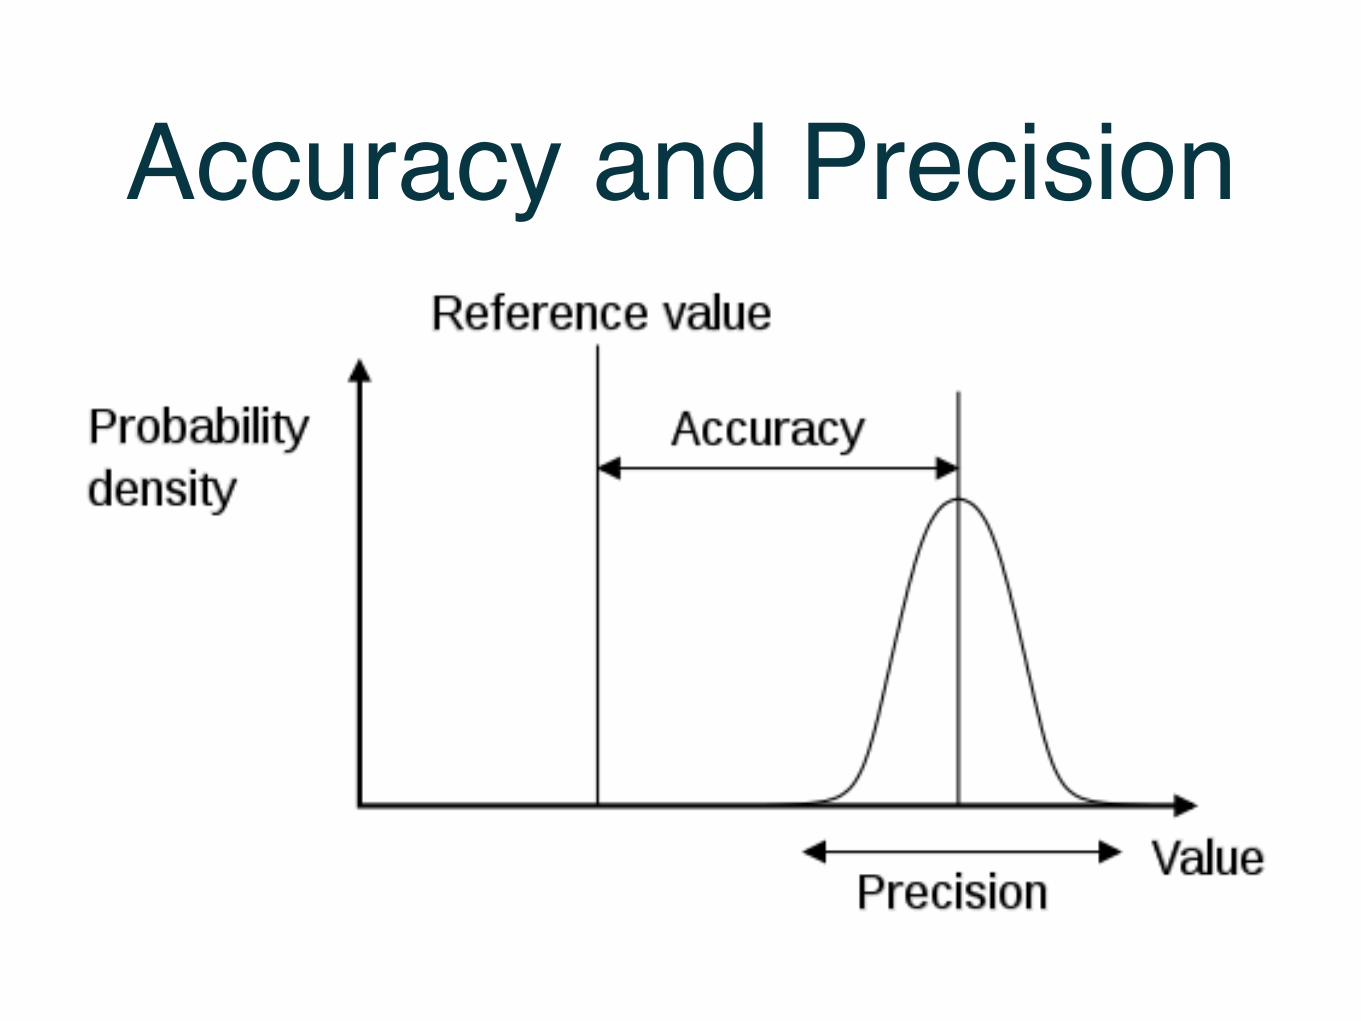
When referring to traceability of measurement and comparison with other measurement methods, we need to differentiate two basic aspects in measurement:
Accuracy and Precision
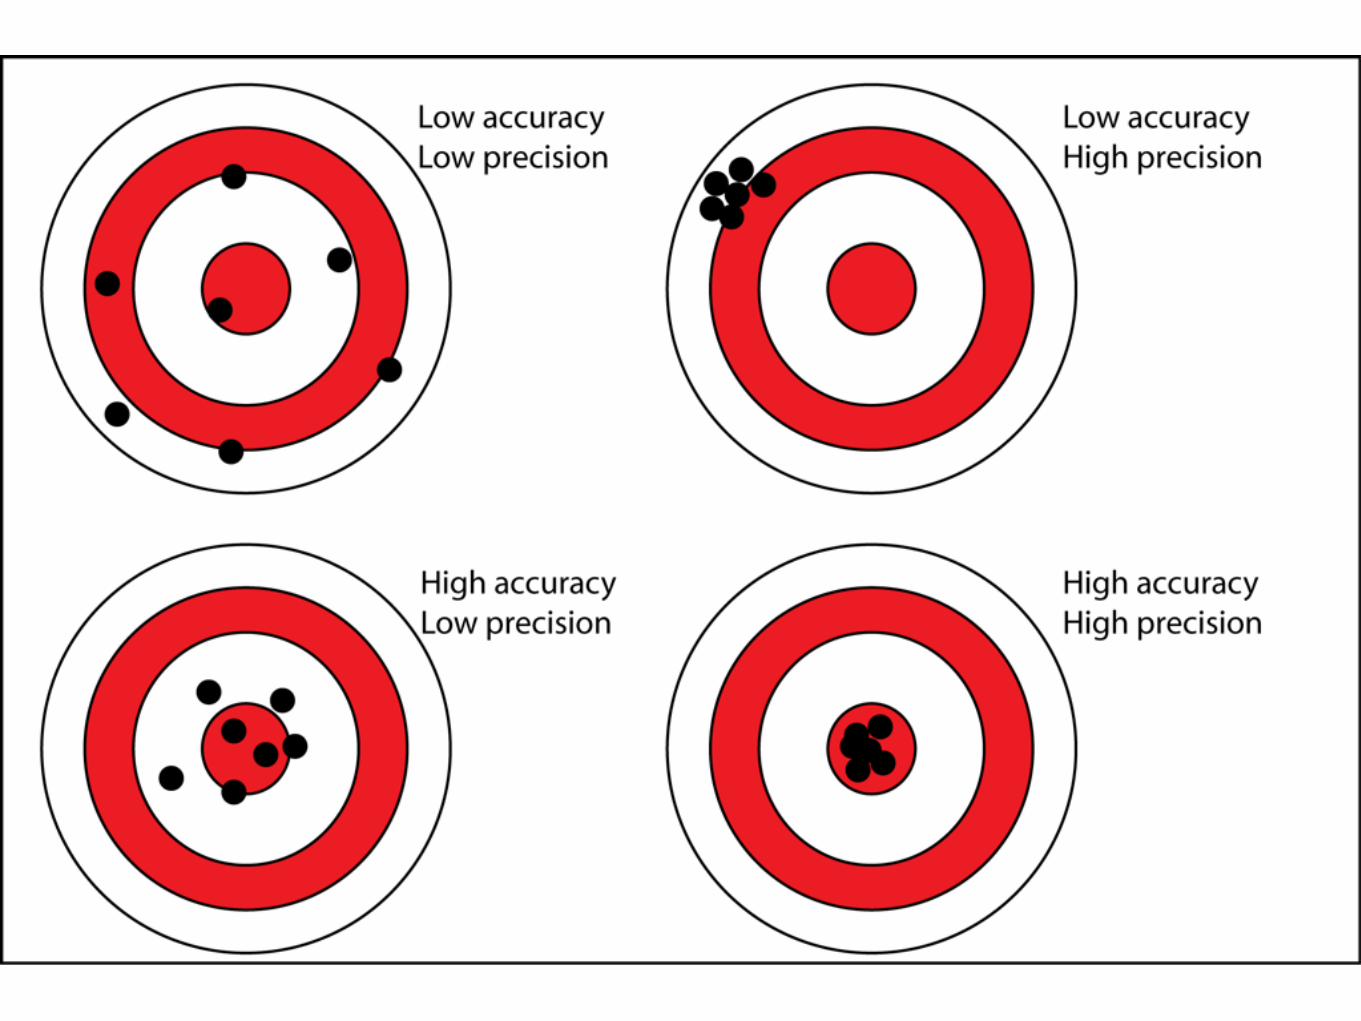
Accuracy Precision
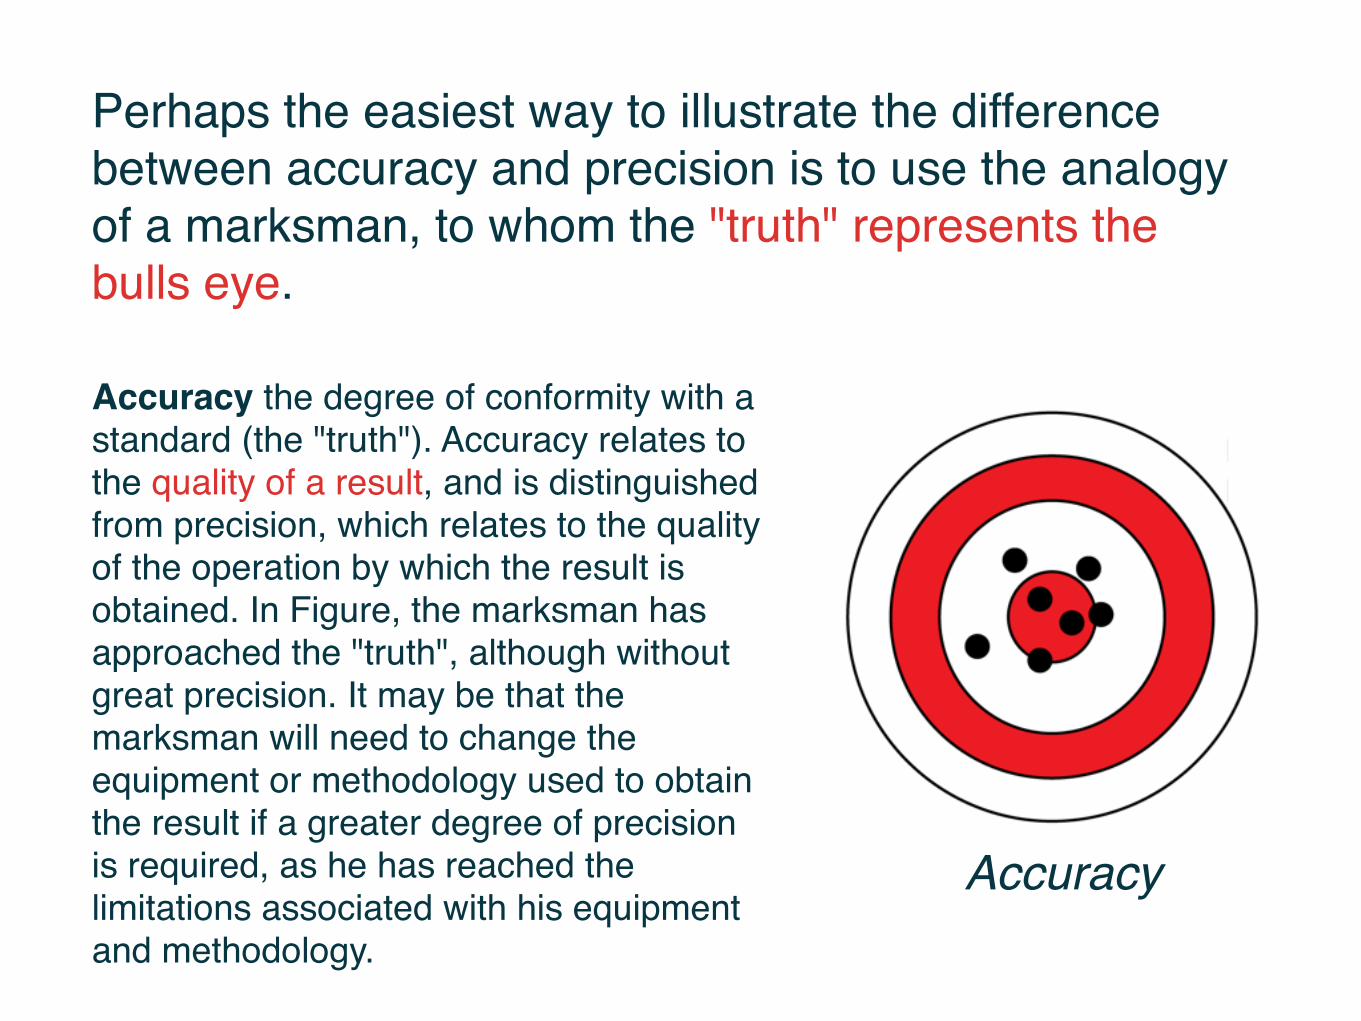
Perhaps the easiest way to illustrate the difference between accuracy and precision is to use the analogy of a marksman, to whom the "truth" represents the bulls eye.
Accuracy the degree of conformity with a standard (the "truth"). Accuracy relates to the quality of a result, and is distinguished from precision, which relates to the quality of the operation by which the result is obtained. In Figure, the marksman has approached the "truth", although without great precision. It may be that the marksman will need to change the equipment or methodology used to obtain the result if a greater degree of precision is required, as he has reached the limitations associated with his equipment and methodology.
Accuracy
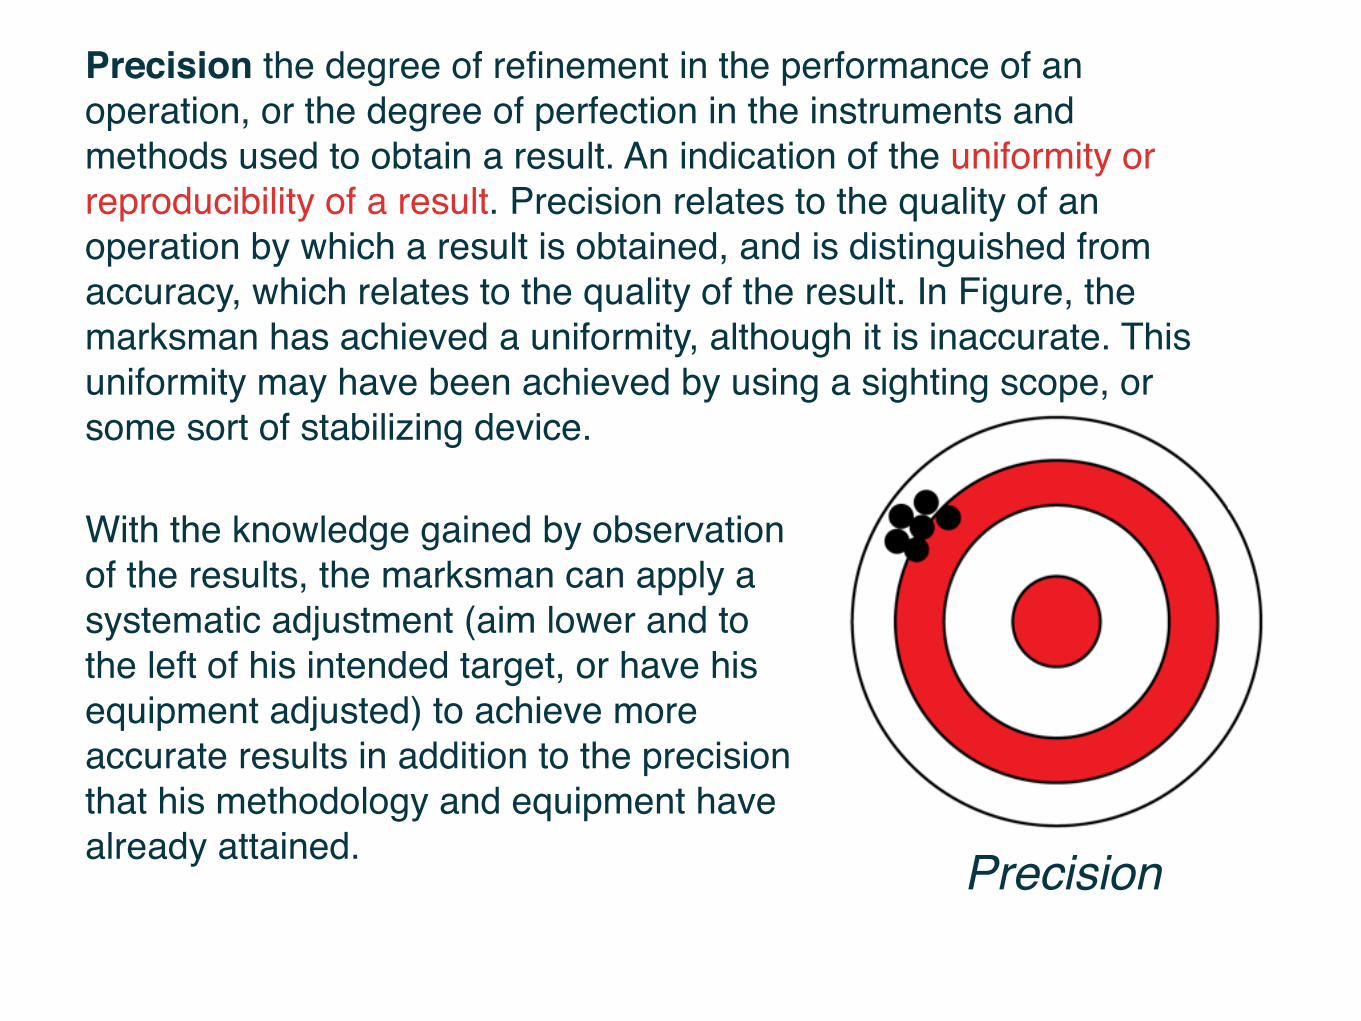
Precision the degree of refinement in the performance of an operation, or the degree of perfection in the instruments and methods used to obtain a result. An indication of the uniformity or reproducibility of a result. Precision relates to the quality of an operation by which a result is obtained, and is distinguished from accuracy, which relates to the quality of the result. In Figure, the marksman has achieved a uniformity, although it is inaccurate. This uniformity may have been achieved by using a sighting scope, or some sort of stabilizing device.
Precision
With the knowledge gained by observation of the results, the marksman can apply a systematic adjustment (aim lower and to the left of his intended target, or have his equipment adjusted) to achieve more accurate results in addition to the precision that his methodology and equipment have already attained.
Accuracy and Precision
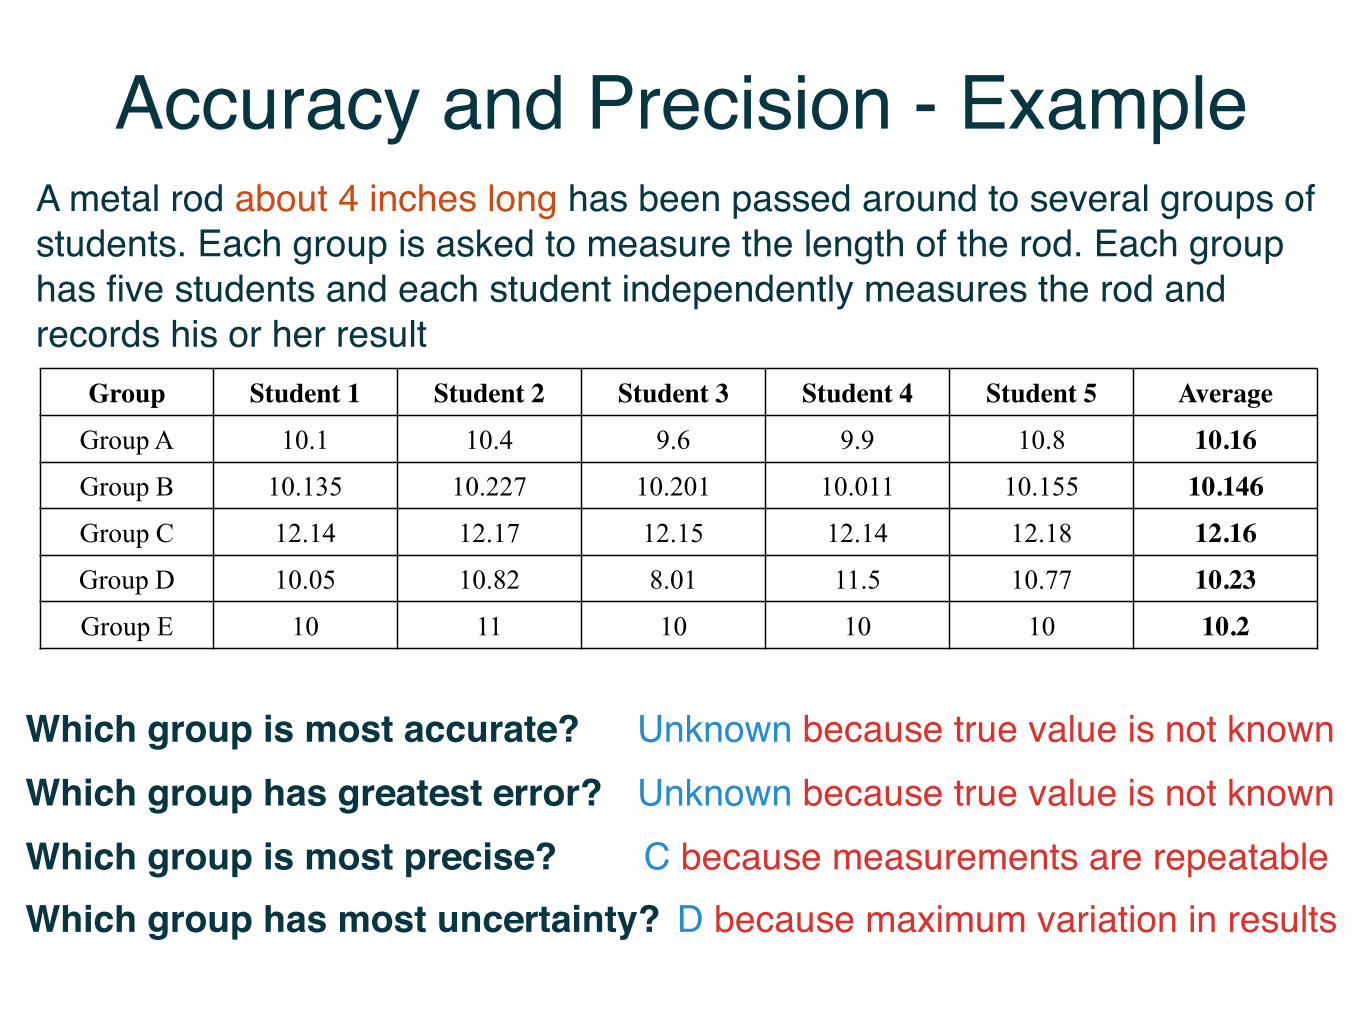
Accuracy and Precision - ExampleA metal rod about 4 inches long has been passed around to several groups of students. Each group is asked to measure the length of the rod. Each group has five students and each student independently measures the rod and records his or her result
Accuracy and Precision - Example
Group Student 1 Student 2 Student 3 Student 4 Student 5 Average
Group A 10.1 10.4 9.6 9.9 10.8 10.16
Group B 10.135 10.227 10.201 10.011 10.155 10.146
Group C 12.14 12.17 12.15 12.14 12.18 12.16
Group D 10.05 10.82 8.01 11.5 10.77 10.23
Group E 10 11 10 10 10 10.2
A metal rod about 4 inches long has been passed around to several groups of students. Each group is asked to measure the length of the rod. Each group has five students and each student independently measures the rod and records his or her result
Which group is most accurate?
Which group has greatest error?
Which group is most precise?
Which group has most uncertainty
Unknown because true value is not known
Unknown because true value is not known
C because measurements are repeatable
D because maximum variation in results
Which group is most accurate?Which group has greatest error?Which group is most precise?Which group has most uncertainty?
Unknown because true value is not knownUnknown because true value is not knownC because measurements are repeatable
D because maximum variation in results
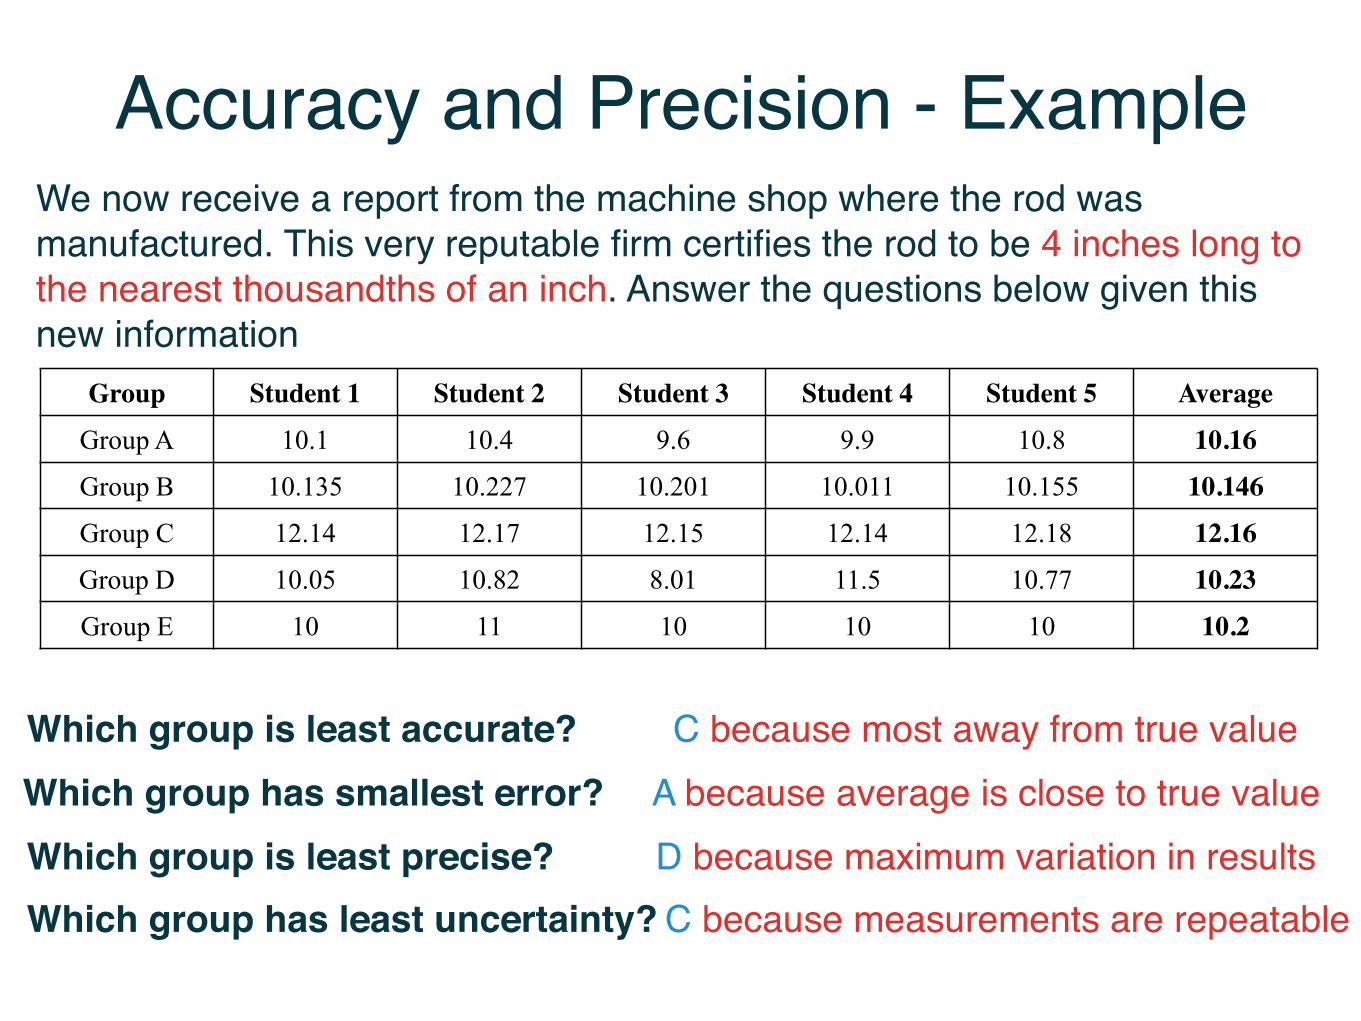
Accuracy and Precision - ExampleWe now receive a report from the machine shop where the rod was manufactured. This very reputable firm certifies the rod to be 4 inches long to the nearest thousandths of an inch. Answer the questions below given this new information
Accuracy and Precision - Example
Group Student 1 Student 2 Student 3 Student 4 Student 5 Average
Group A 10.1 10.4 9.6 9.9 10.8 10.16
Group B 10.135 10.227 10.201 10.011 10.155 10.146
Group C 12.14 12.17 12.15 12.14 12.18 12.16
Group D 10.05 10.82 8.01 11.5 10.77 10.23
Group E 10 11 10 10 10 10.2
A metal rod about 4 inches long has been passed around to several groups of students. Each group is asked to measure the length of the rod. Each group has five students and each student independently measures the rod and records his or her result
Which group is most accurate?
Which group has greatest error?
Which group is most precise?
Which group has most uncertainty
Unknown because true value is not known
Unknown because true value is not known
C because measurements are repeatable
D because maximum variation in results
Which group is least accurate?Which group has smallest error?Which group is least precise?Which group has least uncertainty?
C because most away from true valueA because average is close to true value D because maximum variation in resultsC because measurements are repeatable
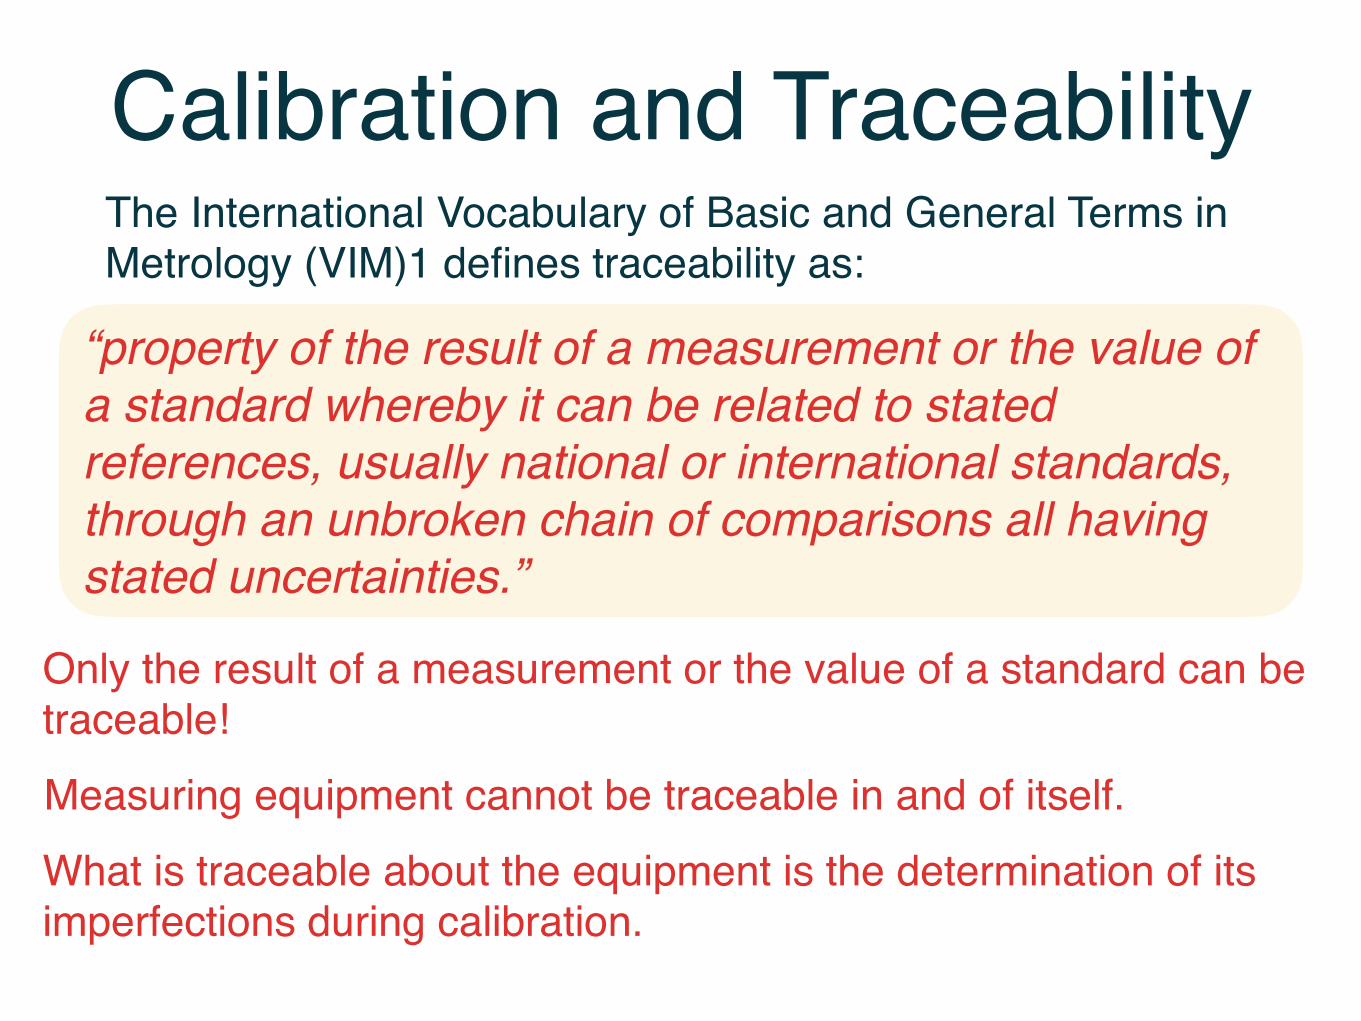
The International Vocabulary of Basic and General Terms in Metrology (VIM)1 defines traceability as:
“property of the result of a measurement or the value of a standard whereby it can be related to stated references, usually national or international standards, through an unbroken chain of comparisons all having stated uncertainties.”
Calibration and Traceability
Only the result of a measurement or the value of a standard can be traceable!Measuring equipment cannot be traceable in and of itself.What is traceable about the equipment is the determination of its imperfections during calibration.
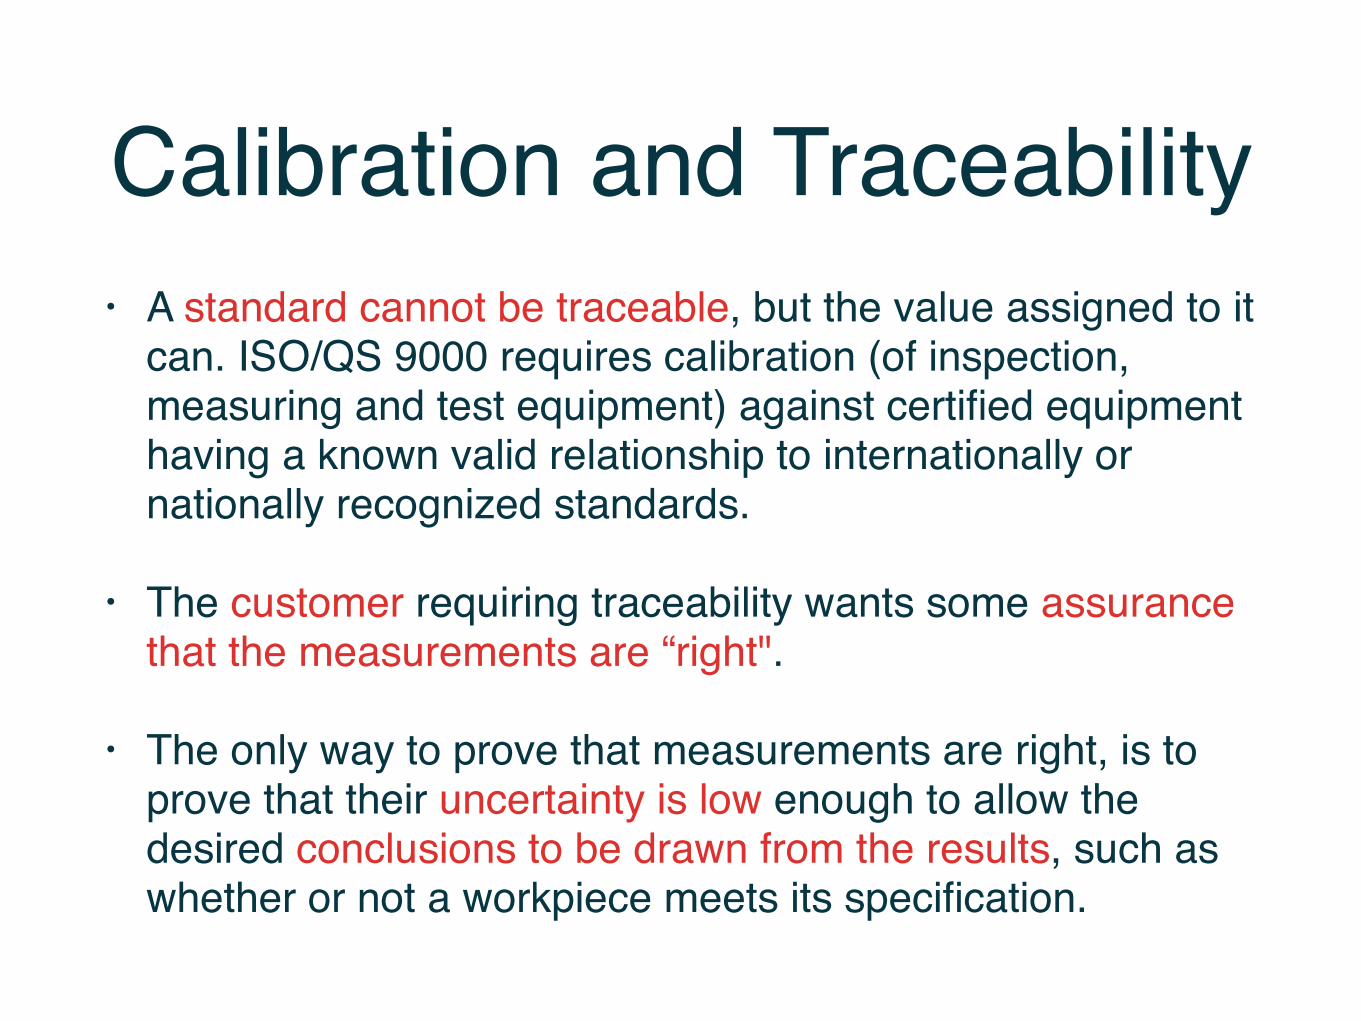
Calibration and Traceability• A standard cannot be traceable, but the value assigned to it
can. ISO/QS 9000 requires calibration (of inspection, measuring and test equipment) against certified equipment having a known valid relationship to internationally or nationally recognized standards.
• The customer requiring traceability wants some assurance that the measurements are “right".
• The only way to prove that measurements are right, is to prove that their uncertainty is low enough to allow the desired conclusions to be drawn from the results, such as whether or not a workpiece meets its specification.
Calibration and Traceability
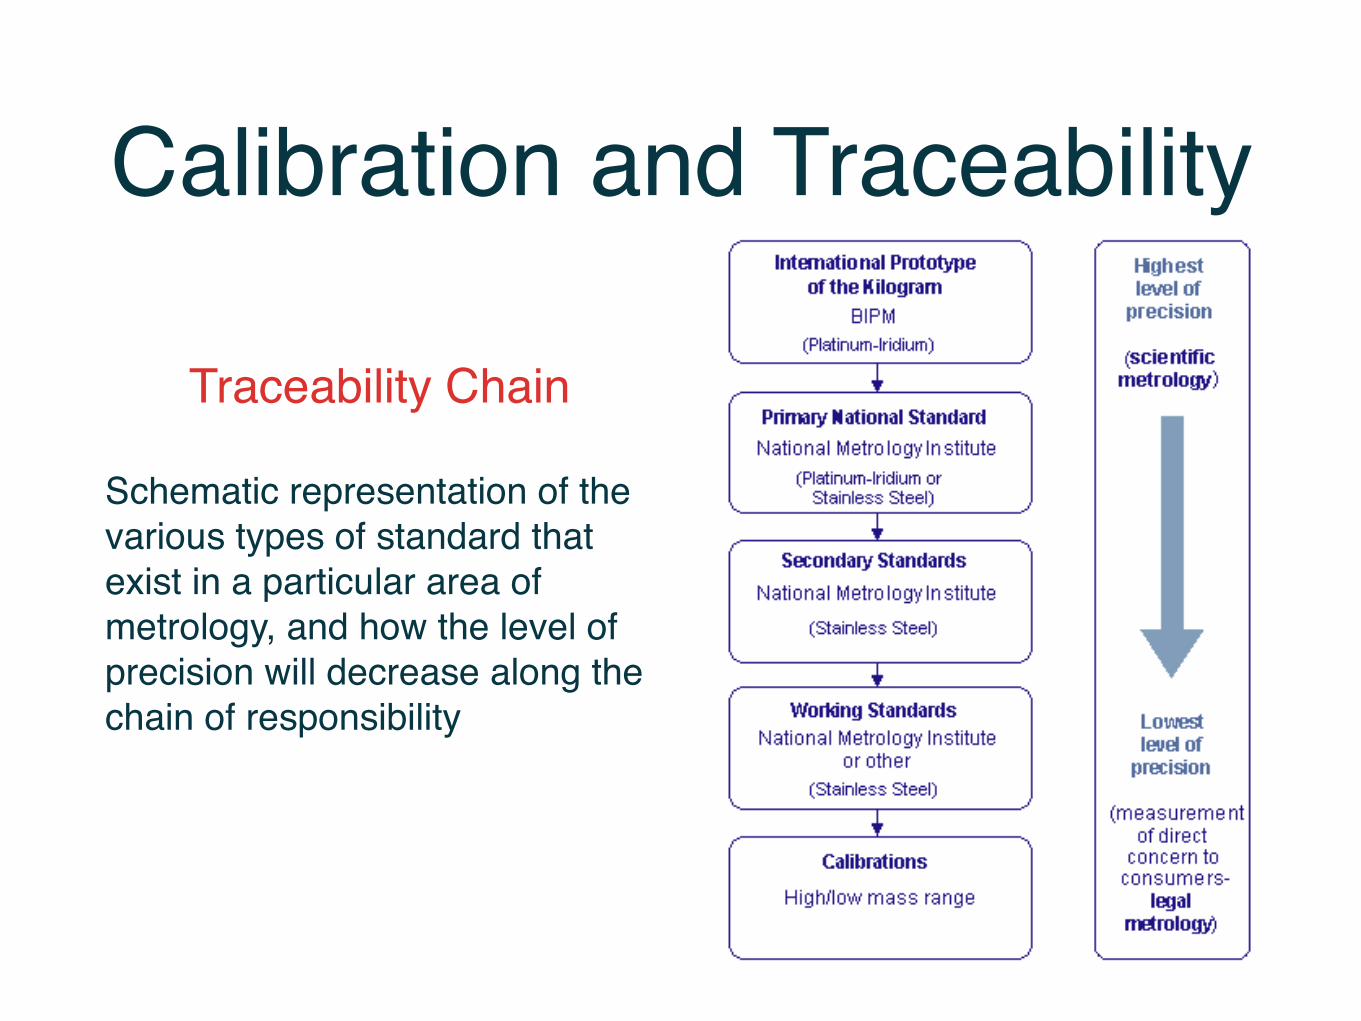
Schematic representation of the various types of standard that exist in a particular area of metrology, and how the level of precision will decrease along the chain of responsibility
Traceability Chain
Calibration and Traceability
Schematic representation of the various types of standard that exist in a particular area of metrology, and how the level of precision will decrease along the chain of responsibility
Traceability Chain
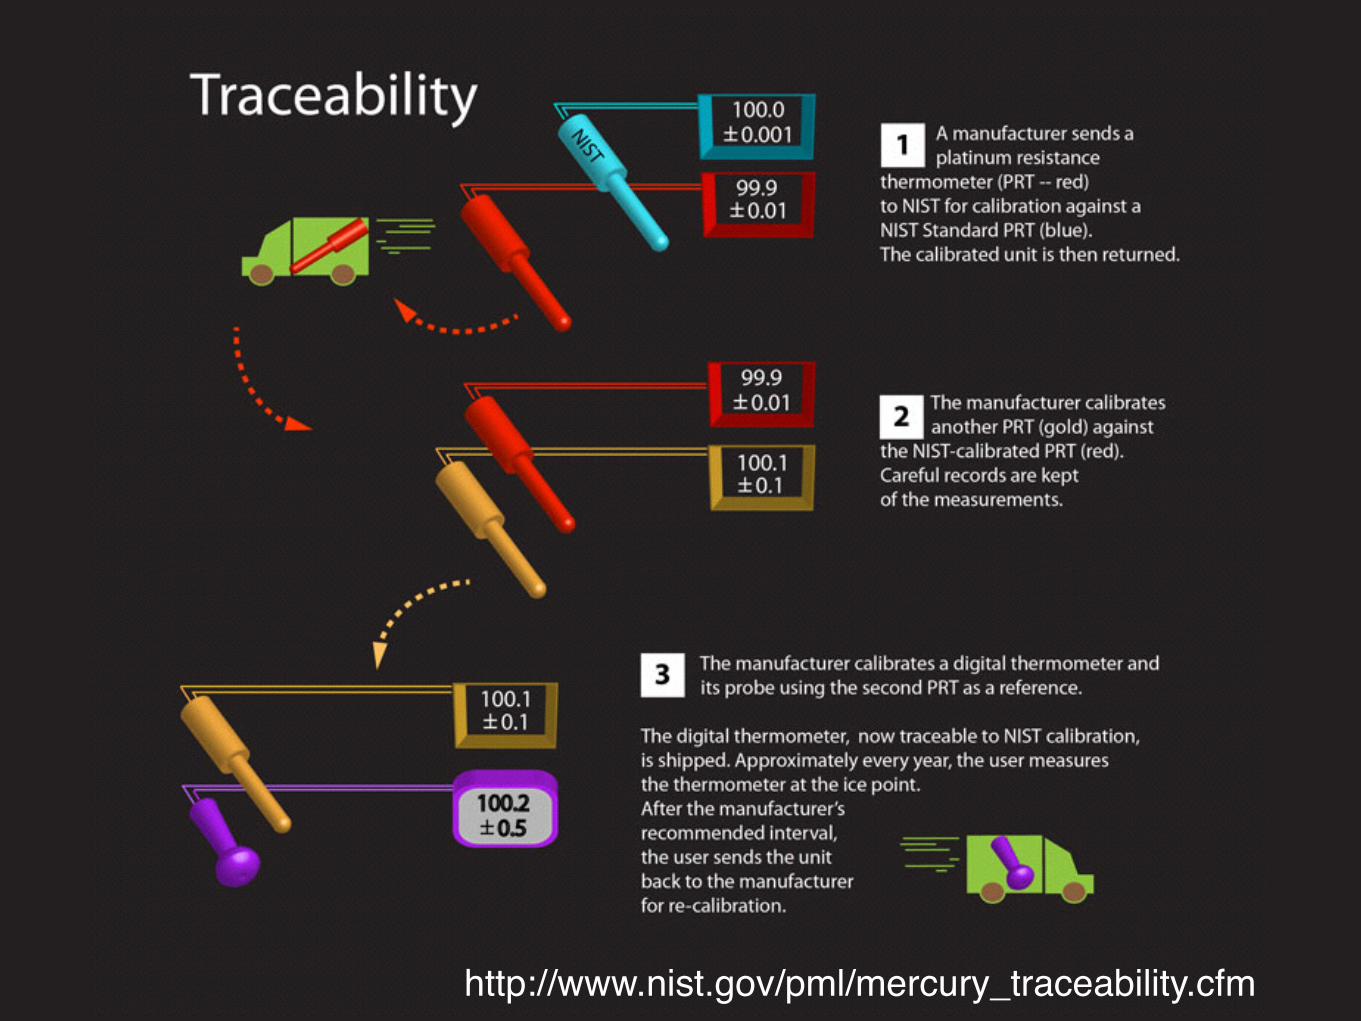
http://www.nist.gov/pml/mercury_traceability.cfm
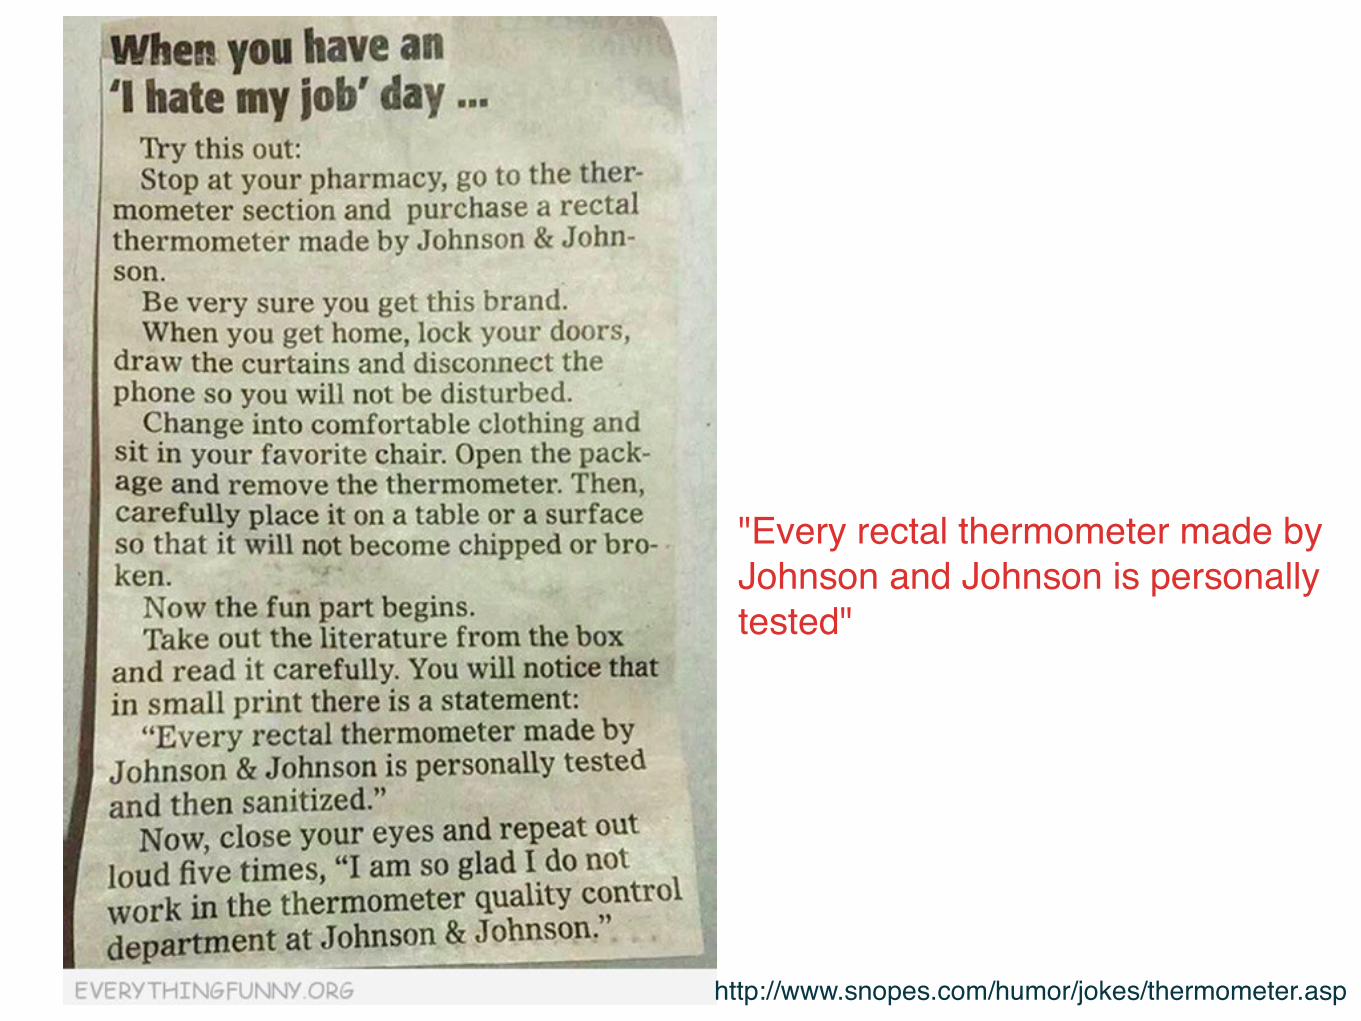
"Every rectal thermometer made by Johnson and Johnson is personally tested"
http://www.snopes.com/humor/jokes/thermometer.asp
18-2 Mechatronic Systems, Sensors, and Actuators
equals one million (106) events per second, and 1 GHz equals one billion (109) events per second.A device that produces frequency is called an oscillator. The process of setting multiple oscillators to thesame frequency is called syntonization.
Of course, the three types of time and frequency information are closely related. As mentioned, thestandard unit of time interval is the second. By counting seconds, we can determine the date and thetime-of-day. And by counting events or cycles per second, we can measure frequency.
Time interval and frequency can now be measured with less uncertainty and more resolution thanany other physical quantity. Today, the best time and frequency standards can realize the SI second withuncertainties of . Physical realizations of the other base SI units have much larger uncertainties,as shown in Table 18.1 [1–5].
18.1.1 Coordinated Universal Time (UTC)The world’s major metrology laboratories routinely measure their time and frequency standards andsend the measurement data to the Bureau International des Poids et Measures (BIPM) in Sevres, France.The BIPM averages data collected from more than 200 atomic time and frequency standards located atmore than 40 laboratories, including the National Institute of Standards and Technology (NIST). As aresult of this averaging, the BIPM generates two time scales, International Atomic Time (TAI), andCoordinated Universal Time (UTC). These time scales realize the SI second as closely as possible.
UTC runs at the same frequency as TAI. However, it differs from TAI by an integral number of seconds.This difference increases when leap seconds occur. When necessary, leap seconds are added to UTC oneither June 30 or December 31. The purpose of adding leap seconds is to keep atomic time (UTC) within±0.9 s of an older time scale called UT1, which is based on the rotational rate of the earth. Leap secondshave been added to UTC at a rate of slightly less than once per year, beginning in 1972 [3,5].
Keep in mind that the BIPM maintains TAI and UTC as ‘‘paper’’ time scales. The major metrologylaboratories use the published data from the BIPM to steer their clocks and oscillators and generate real-time versions of UTC. Many of these laboratories distribute their versions of UTC via radio signals, whichare discussed in section 18.4.
You can think of UTC as the ultimate standard for time-of-day, time interval, and frequency. Clockssynchronized to UTC display the same hour, minute, and second all over the world (and remain withinone second of UT1). Oscillators syntonized to UTC generate signals that serve as reference standards fortime interval and frequency.
18.2 Time and Frequency Measurement
Time and frequency measurements follow the conventions used in other areas of metrology. The fre-quency standard or clock being measured is called the device under test (DUT ). A measurement comparesthe DUT to a standard or reference. The standard should outperform the DUT by a specified ratio, calledthe test uncertainty ratio (TUR). Ideally, the TUR should be 10:1 or higher. The higher the ratio, the lessaveraging is required to get valid measurement results.
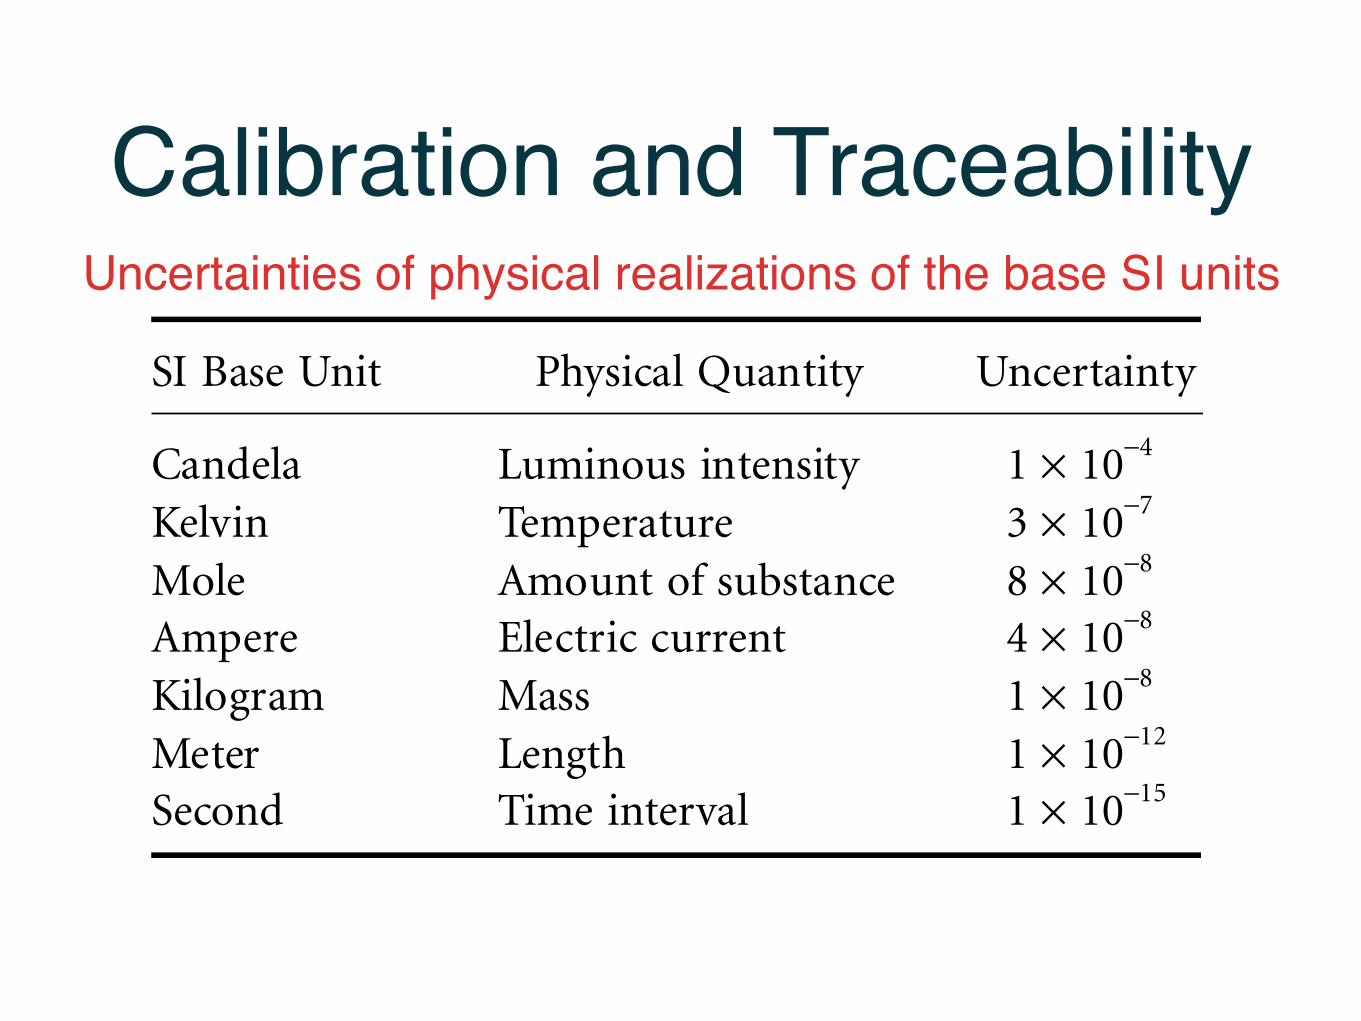
TABLE 18.1 Uncertainties of Physical Realizations of the Base SI Units
SI Base Unit Physical Quantity Uncertainty
Candela Luminous intensity 1 × 10⁻⁴
Kelvin Temperature 3 × 10⁻⁷
Mole Amount of substance 8 × 10⁻⁸
Ampere Electric current 4 × 10⁻⁸
Kilogram Mass 1 × 10⁻⁸
Meter Length 1 × 10⁻¹²
Second Time interval 1 × 10⁻¹⁵
1 10 15–×≅
9258_C018.fm Page 2 Tuesday, October 2, 2007 1:22 AM
Calibration and TraceabilityUncertainties of physical realizations of the base SI units
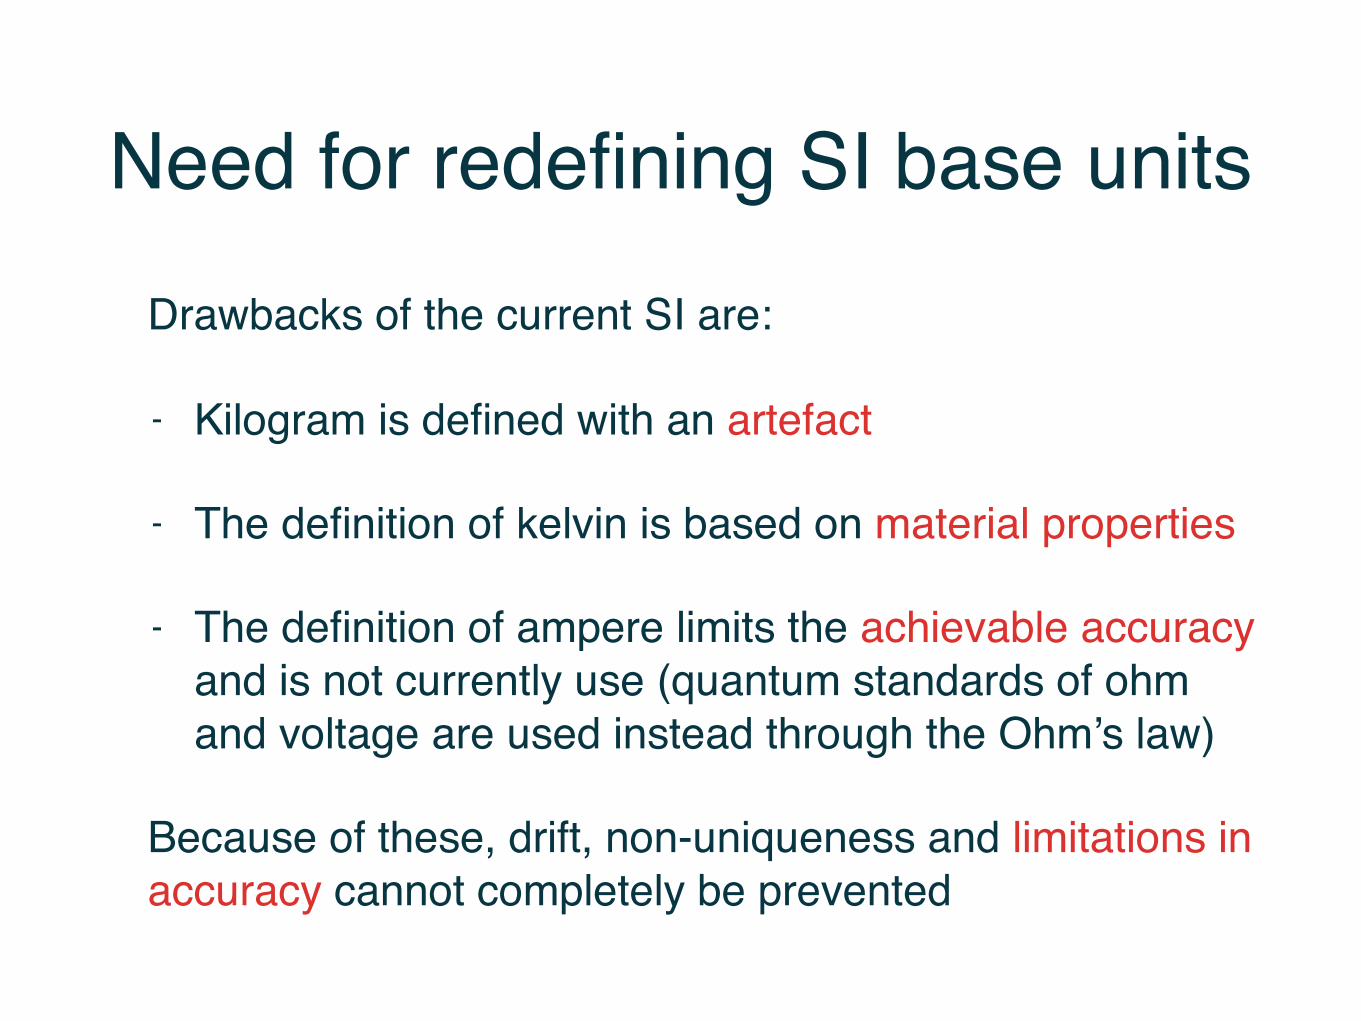
Need for redefining SI base units
Drawbacks of the current SI are:
- Kilogram is defined with an artefact
- The definition of kelvin is based on material properties
- The definition of ampere limits the achievable accuracy and is not currently use (quantum standards of ohm and voltage are used instead through the Ohm’s law)
Because of these, drift, non-uniqueness and limitations in accuracy cannot completely be prevented
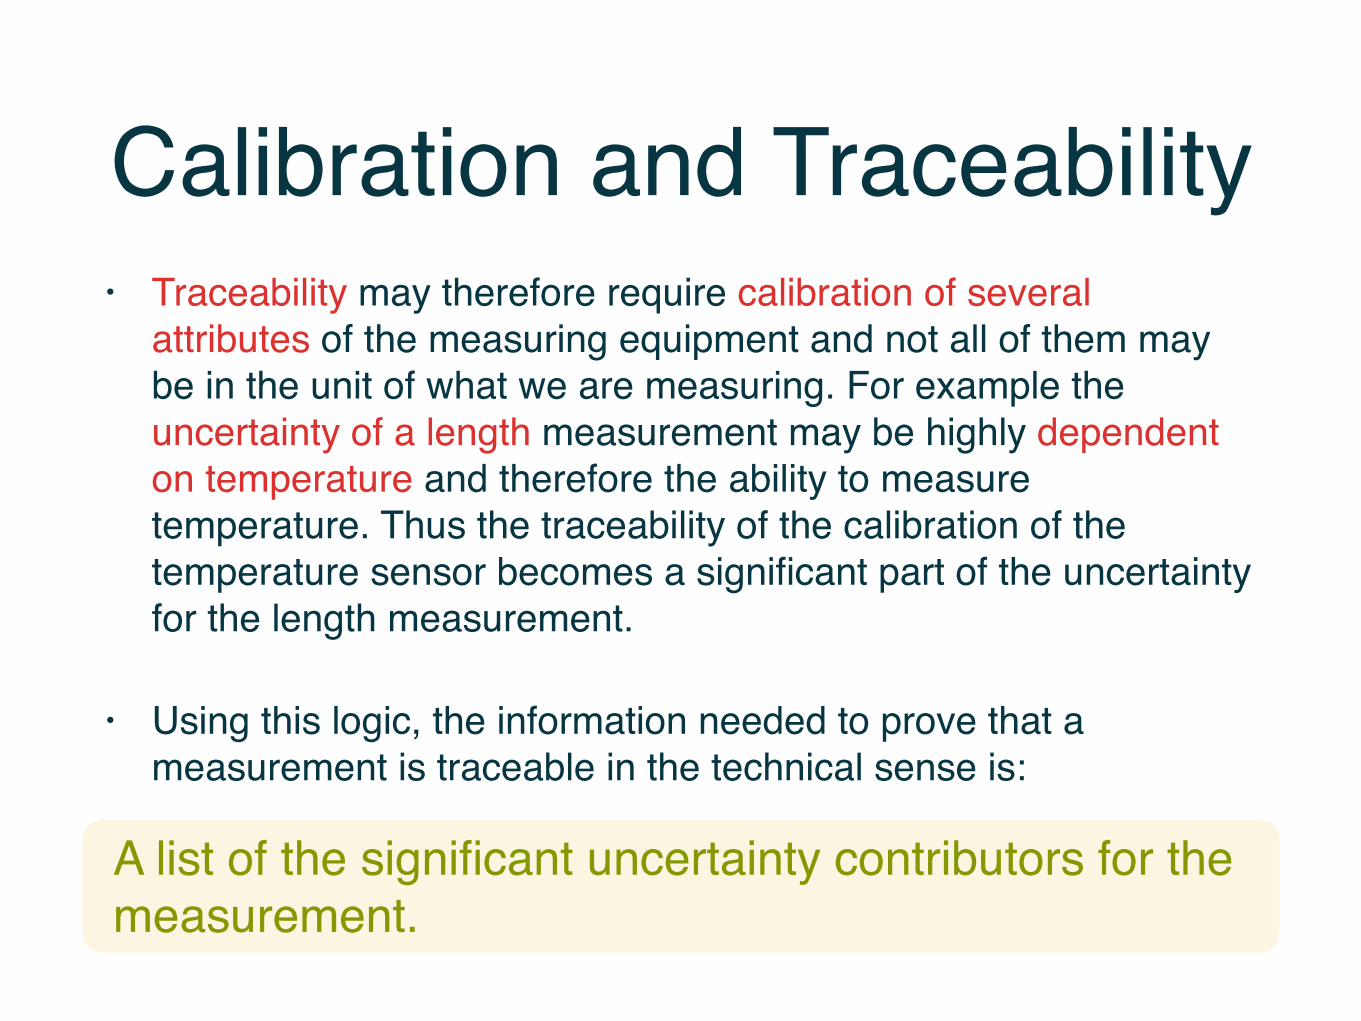
Calibration and Traceability• Traceability may therefore require calibration of several
attributes of the measuring equipment and not all of them may be in the unit of what we are measuring. For example the uncertainty of a length measurement may be highly dependent on temperature and therefore the ability to measure temperature. Thus the traceability of the calibration of the temperature sensor becomes a significant part of the uncertainty for the length measurement.
• Using this logic, the information needed to prove that a measurement is traceable in the technical sense is:
A list of the significant uncertainty contributors for the measurement.
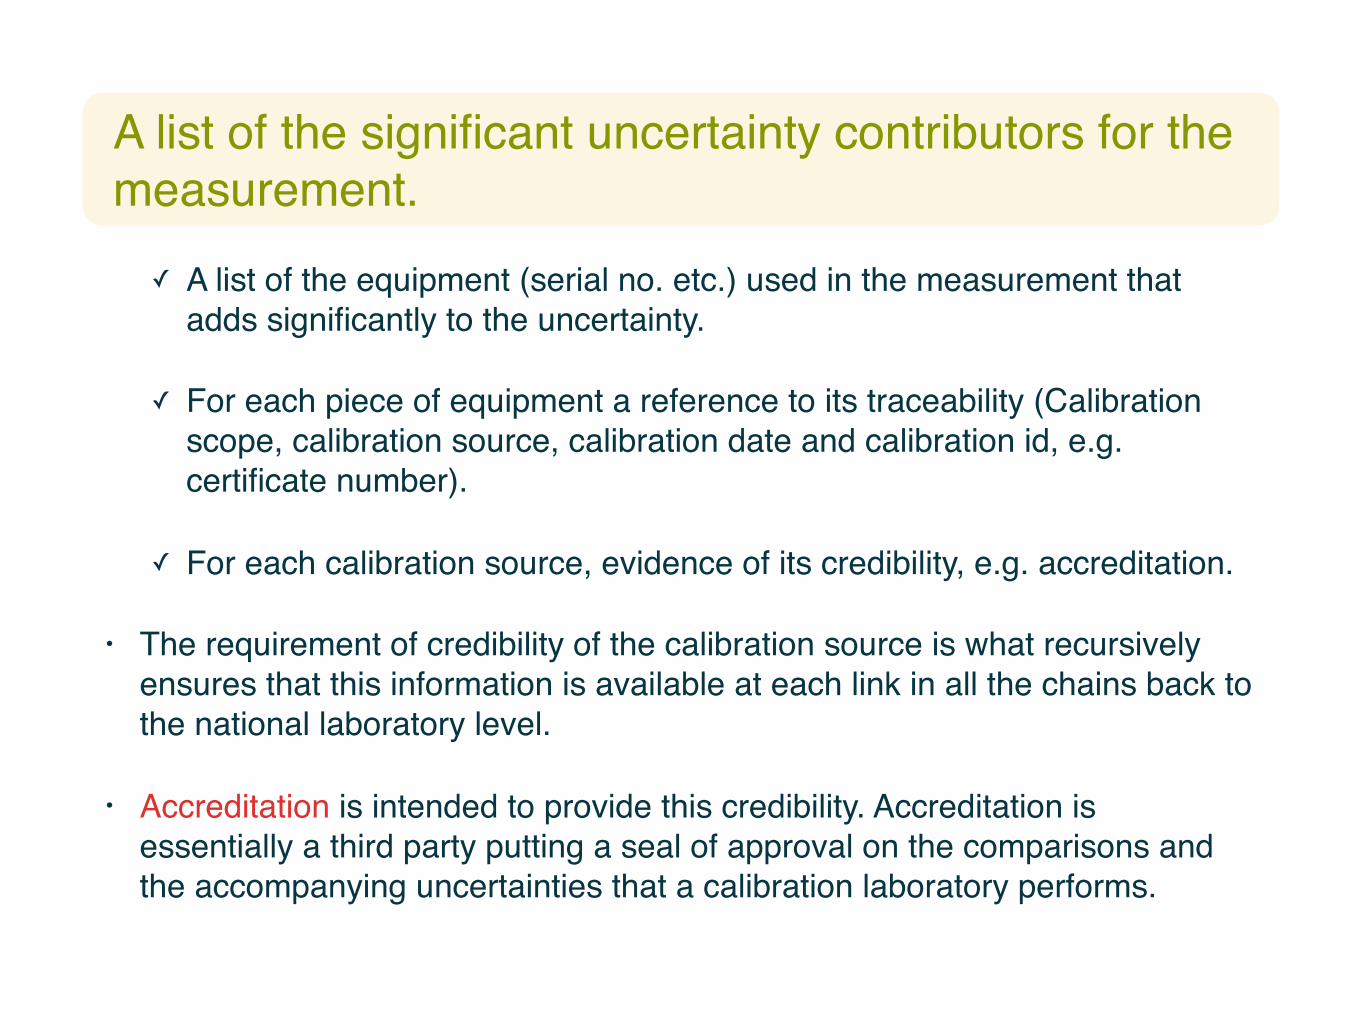
✓ A list of the equipment (serial no. etc.) used in the measurement that adds significantly to the uncertainty.
✓ For each piece of equipment a reference to its traceability (Calibration scope, calibration source, calibration date and calibration id, e.g. certificate number).
✓ For each calibration source, evidence of its credibility, e.g. accreditation.
• The requirement of credibility of the calibration source is what recursively ensures that this information is available at each link in all the chains back to the national laboratory level.
• Accreditation is intended to provide this credibility. Accreditation is essentially a third party putting a seal of approval on the comparisons and the accompanying uncertainties that a calibration laboratory performs.
A list of the significant uncertainty contributors for the measurement.

Manufacturing Trend
• Mass production of firearms, sewing machines, automobiles, etc.
• Process: machining, stamping, casting, forging, etc.
• Essential requirement: accurately dimensioned, interchangeable machine parts.
• Enabled by widespread dissemination of accurate length scale (~1 mil) embodied as gauge blocks.
• Accuracy transferred to work piece by vernier calipers.
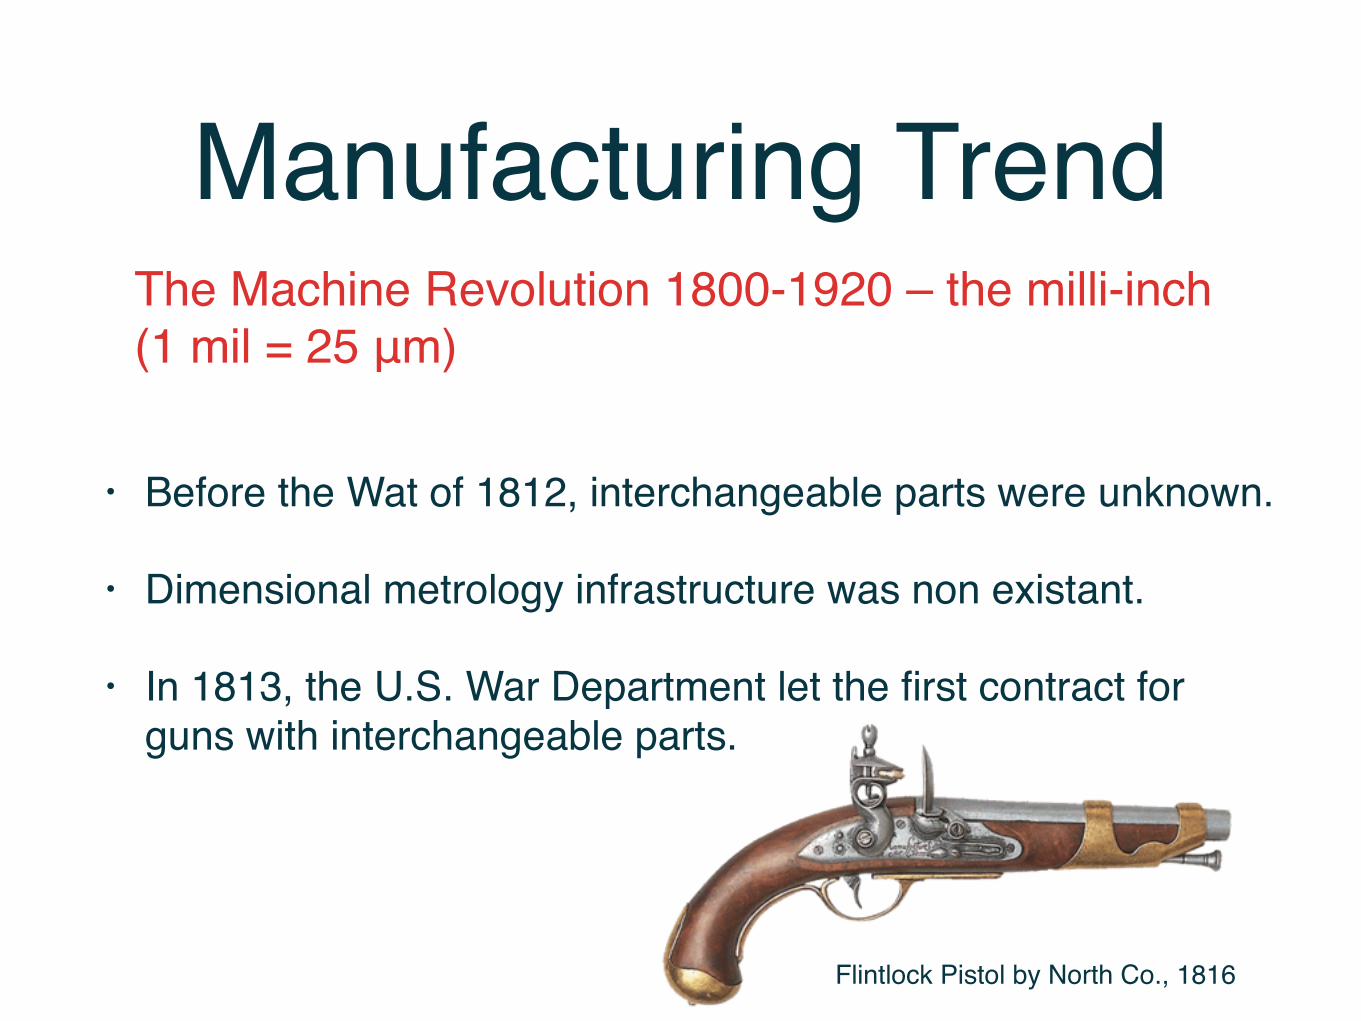
The Machine Revolution 1800-1920 – the milli-inch(1 mil = 25 μm)
Manufacturing Trend
• Before the Wat of 1812, interchangeable parts were unknown.
• Dimensional metrology infrastructure was non existant.
• In 1813, the U.S. War Department let the first contract for guns with interchangeable parts.
The Machine Revolution 1800-1920 – the milli-inch(1 mil = 25 μm)
Flintlock Pistol by North Co., 1816
Manufacturing Trend
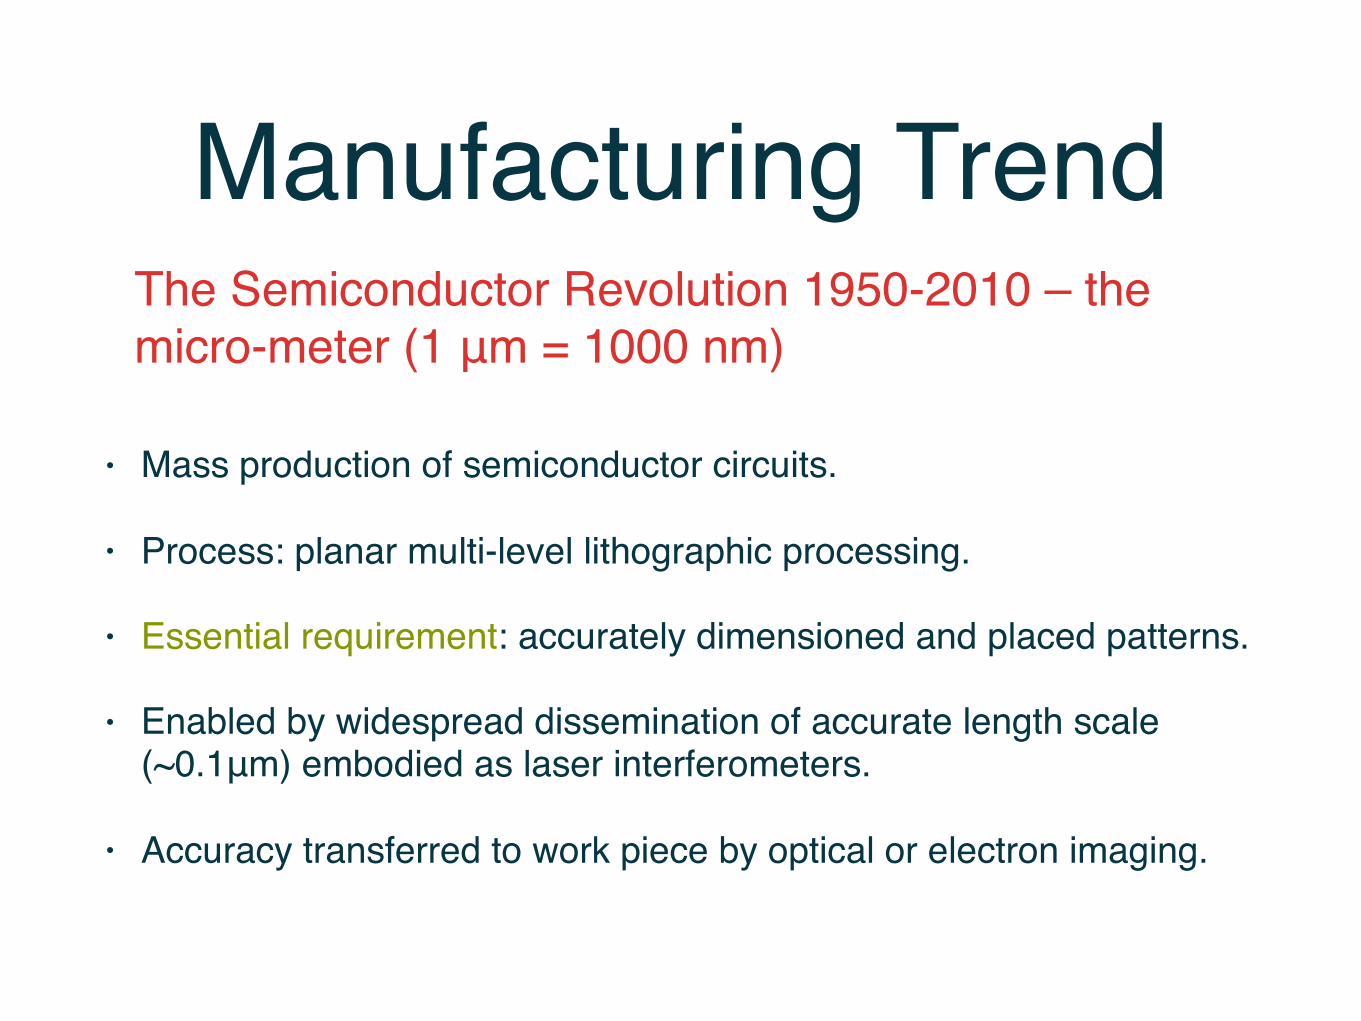
• Mass production of semiconductor circuits.
• Process: planar multi-level lithographic processing.
• Essential requirement: accurately dimensioned and placed patterns.
• Enabled by widespread dissemination of accurate length scale (~0.1μm) embodied as laser interferometers.
• Accuracy transferred to work piece by optical or electron imaging.
The Semiconductor Revolution 1950-2010 – the micro-meter (1 μm = 1000 nm)
Current Manufacturing Trend
• Mass production of nanosystems (electronic, mechanical, biological, etc.).
• Process: planar multi-level lithography; self assembly of nano- objects (e.g., nanowires, nanocrystals).
• Essential requirement: accurately dimensioned and placed patterns and nano-objects.
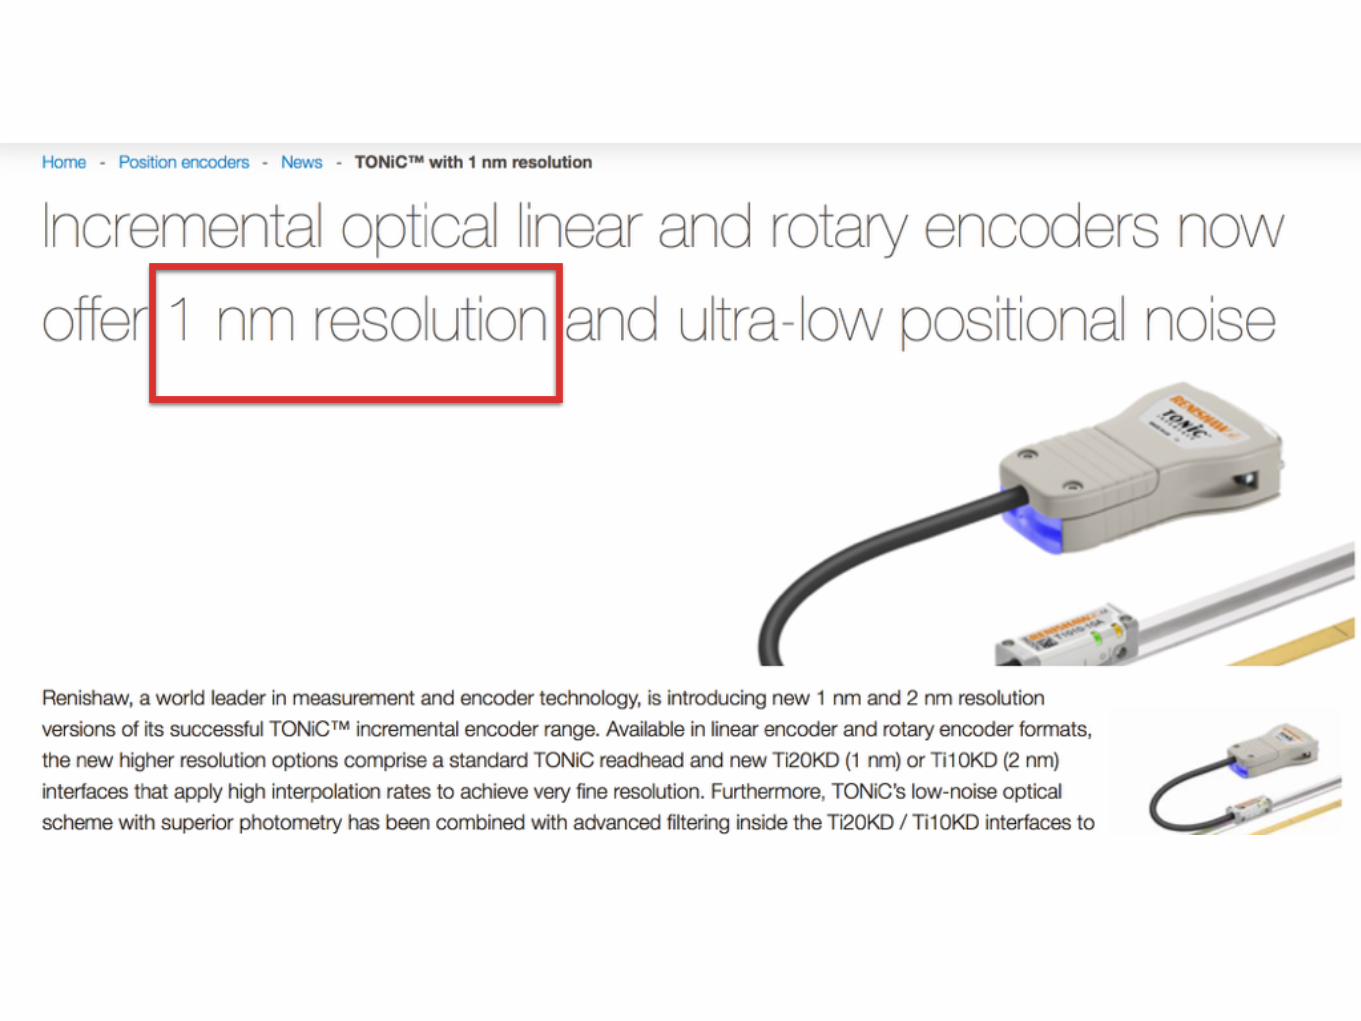
• Enabled by widespread dissemination of accurate length scale (~1 nm) embodied as optical encoders.
• Accuracy transferred to work piece by optical or electron imaging.
The Nanotechnology Revolution 2000-2050 – the nano-meter