Embed Size (px)
Citation preview
ISSN 1750-9653, England, UKInternational Journal of Management Science
and Engineering ManagementVol. 4 (2009) No. 4, pp. 260-269
Optimal strategic decision for disaster recovery
Montri Wiboonratr1 , Kitti Kosavisutte2∗
1 College of Graduate Study in Management, Khon Kaen University, Bangkok 10240, Thailand2 Department of Computer Science and Information Mathematics, The University of Electro-Communication, Chofu
182-8585, Japan
(Received December 26 2008, Revised March 10 2009, Accepted May 4 2009)
Abstract. Sustained data availability, accuracy, security, and updating of financial transactions are critical forbanking business services. The significance of 24 × 365 hour service availability with accurate and secureddata is the business comparative and competitive advantages. Choosing the right IT contingency planning(ITCP) for disaster recovery (DR) insures business continuity and optimizes banking investment. This re-search investigates the essential fundamental requirements of each banking business unit and concentratesthe mapping of business criticality to DR readiness by assessing recovery time objective (RTO) and recov-ery point objective (RPO) to guarantee business continuity under a maximum tolerable period of disruption(MTPD). The DR strategy model proposed the optimization strategy for choosing the right pattern of disasterrecovery solution for each business unit requirements with decision-making information supports.
Keywords: Information Technology Contingency Planning (ITCP), Disaster Recovery (DR), Business Im-pact Analysis (BIA), and Business Continuity Plans (BCP)
1 Introduction
As financial operations rely deeply on secured digital transactions and continuous on non-stop servicesavailability, expeditious recovery from service interruptions may signify differences between success andfailure of financial business services. Financial records and data are the most sensitive factor for financialservice operations. Service information for customers and regulators needs to be available whenever theyaccess information. This is the curtail incident for banking services. When banking business relies more andmore on online and real-time data, the unavailability of communication, networking, servers, storages, andintegrated systems to access to data becomes a major concern. To sustain data, accuracy, availability, recency,and security are major contributing to increase customer’s confidence. Data losses would follow by lawsuits,penalties, and decrease in reputation. Prevention of data losses needs to be considered as a top priority, whilerecovery data is a significant strategy to protect business losses. Zero downtime production is the goal oftoday’s banking business when facing with unplanned service disruptions. The business impacted analysis(BIA) of losing business information and IT business infrastructure may never be judged until an unavailableservice occurs. BIA influences the severity levels of prevention and the recovery data strategy. BIA concernson four basic factors of financial service industry: financial, operation, reputation, and regulation.
Availability of banking information 24 × 365 hour and fast recovery from system failure determinesuccess or failure of banking business. The conceptual ideas of a banking company surviving from disasterwhen it plans to react on incidents are as follows[14]:
• Worst case scenarios planning for a disaster.• Initiating strategies for recovering critical business functions.∗ Corresponding author. E-mail address: [email protected].
Published by World Academic Press, World Academic Union
International Journal of Management Science and Engineering Management, Vol. 4 (2009) No. 4, pp. 260-269 261
• Implementing technologies to support the recovery of automated functions and systems.• Training involved operators on operational and contingency processes handling with all unexpected inci-
dents.
IT contingency planning, business continuity plans, and disaster recovery plans are under the same basicconcept of a plan that is necessitated to be capable to resume/carry on business operations back to normalservices as before disaster incidents[8].
Pre-active strategic ideal of system availability becomes clearly that if repair times of systems are ne-glected, the systems is always on.
Proactive strategy to incidents is cost-effectiveness, e.g. business downtime losses, recovery costs, andbusiness reputation. Helms stated that “preventive measures are more important than recovery measures”[11].Reality stating proactive and pre-planning solution for IT recovery capability is a part of the contingencyplanning process for company which critical business functions rely on data communication. Right businessdecision on IT contingency solution for business requirements is the key to optimize operating and investment.
The research aims to develop a planning model for disaster recovery that integrates exploratory researchfor collecting information, key factors analysis, critical level analysis, recovery strategy, and mapping criticallevel to strategic solutions for decision making and recommendations.Definitions:Disaster: Natural, technological, and human-induced events that disrupt the normal functioning of the systemon a large scale[13].Disaster recovery: A set of activities executed once the disaster occurs, including the use of backup facilitiesto provide users of IT systems with access to data and functions required to sustain business processes.Recovery Point Objective (RPO): The point in time from which data must be restored in order to resume pro-cessing transactions.Recovery Time Objective (RTO): The period of time allowed for recovery, i.e. time that can elapse betweenthe disaster and the activation of the secondary site.Mean Time between Failures (MTBF): The average mean cycle time, one failure and one repair, of a main-tained system. The quality measurement is generally as a function of time.Mean Time to Failure: The average time that a system performs as functions before first failure.Mean Time to Repair (MTTR): The average time that is taken to repair a system, or the duration of systemdowntime before recovering to normal operations.Maximum Tolerable Period of Disruption (MTPD): A maximum acceptable downtime to guarantee businesscontinuity.Data Availability: A system process ensures minimum data loss (∆L). It requires that all active/ standby/parallel sites in a corporation have copies of critical data. This can be achieved by replicating data between theprimary and secondary sites. The original data must be reproduced within acceptable time required to meetbusiness MTPD[12].Business Impact Analysis (BIA): It defines which business units, operations, and processes are essential to thesurvival of the business[9].Business Continuity Management (BCM): It defines as incidents, disasters, and potential disasters have high-lighted the need for business continuity[5].
2 Background
All banking businesses rely on electronic commerce services. Since banking business services are involv-ing with security, reliability, availability, online-real time, and accuracy of information, electronic commerceservice needs rapid resumption to normal productions no matter what critical disaster levels are[2]. The busi-ness continuity plans propose for maintaining, resuming, and recovering the business, not only the recovery ofthe service systems and data but also the provision of guidance and examination procedures to assist, evaluatefinancial services and provide risk management processes. This will ensure the availability of critical financialservices[1].
MSEM email for subscription: [email protected]
262 M. Wiboonratr & K. Kosavisutte: Optimal strategic decision for disaster recovery
BS 25999-2, Business Continuity Management-Part 2: Specification for business continuity management(BCM), specifies requirements for setting up and managing an effective business continuity management sys-tem (BCMS). The aims of BCMS define the business continuity management programs.This emphasizes the importance of [3]:(a) Understanding business continuity needs and the necessity for establishing policy and objectives for busi-ness continuity.(b) Implementing and operating controls for managing an organization’s overall business continuity risks.(c) Monitoring and reviewing the performance and effectiveness of the BCMS.(d) Continuous improvement based on objective measurement.A management system consists of:(a) People with defined responsibilities.(b) Management processes relating to:
(1) Policy,(2) Planning;(3) Implementation and operation,(4) Performance assessment,(5) Improvement,(6) Management review
(c) A set of documentation providing auditable evidence.(d) Topic of the specific processes relating to the subject, in the case of business continuity, such as BIA,business continuity plan development and so on.
Business contingency plan is an insurance or investment for the future incidents which it may or may notbe happened. This is one kind of roadblock in IT contingency plans for approval budgets. The awareness ofcontingency planning is low because business never faces this kind of disaster before; e.g. September 11, 2001;blackouts of the power grid in North America on August 14, 2003; SARS communicable disease outbreak in2003; tsunami in Thailand on December 26, 2004; Hurricanes Katrina in USA, 2005, and siege 2 internationalairports in Thailand on 24-30 November till 2 December, 2008. This investment does not immediately returnas profits. Moreover, it is very difficult to justify the expenditure necessary to an effective contingency plan[14].
3 IT contingency planning methodology
3.1 Exploring the IT contingency concepts
To explore the concept of IT contingency planning (ITCP) model this research applied quantitative ap-proach to the first ranking leader of banking business services in Thailand. Researcher collected data from 2original sources.
First source of data collection: research conducted direct interview with 50 banking employees that clas-sified into 10-top managements, 10-IT team members, 10-application development members, 10-data entrees,and 10-end users. Second source of data collection: research developed a multiple-choice questionnaire, whichrefers to first source of direct interview for information input to form questionnaires. 100 questionnaires weredelivered by e-mail to specified person that is directly involved in IT contingency planning and businesscontinuity plan (BCP). This selected person must respond to the questionnaires and send them back to theresearcher; thus, 100% was responded ratio of questionnaires.
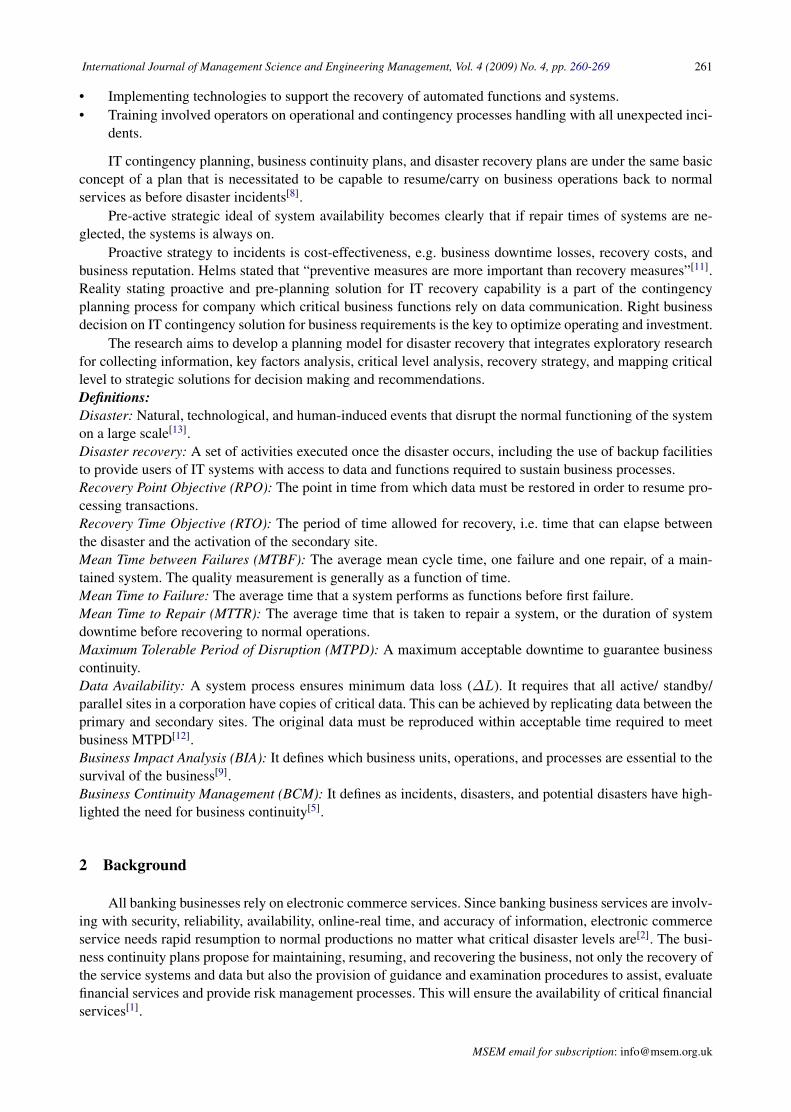
The questionnaires and interviews assessed on the key factors that impacted on selection of applicationsolution to meet business objectives and requirements in term of performance, capacity, capability, investment,and implementation times. Those 4 factors are evaluated under business impacted analysis (BIA). These areconcentrated on 4 areas: Finance, Operation, Reputation, and Regulation. The research identifies the rankingscores of 4 factors as 1, 2, 3, and 4 score. The result for direct interviews (50) and questionnaires (100) did notonly show the processes of mapping 4 factors to critical levels of each disaster recovery solution that reflexeseach business unit requirements, but also depicted the prioritization of each existing banking disaster recoverysolutions, as seen in Tab. 1.
MSEM email for contribution: [email protected]
International Journal of Management Science and Engineering Management, Vol. 4 (2009) No. 4, pp. 260-269 263
Table 1. Mapping four factors to critical levels
Critical Level 1Financail Impact 1
Reputations 1Opearations 1Regulations 1Critical Level 1Priority 1
Critical Level 2Financail Impact 2 2 2 2Reputations 1 2 2 2Opearations 1 1 2 2Regulations 1 1 1 2Critical Level 2 2 2 2Priority 1.25 1.5 1.75 2
Critical Level 3Financail Impact 3 3 3 3 3 3 3Reputations 1 2 2 2 3 3 3Opearations 1 1 2 2 2 3 3Regulations 1 1 1 2 2 2 3Critical Level 3 3 3 3 3 3 3Priority 1.5 1.75 2 2.25 2.5 2.75 3
Critical Lever 4Financail Impact 4 4 4 4 4 4 4 4Reputations 1 2 2 3 3 4 4 4Opearations 1 1 2 2 3 3 4 4Regulations 1 1 1 1 2 2 3 4Critical Level 4 4 4 4 4 4 4 4Priority 1.75 2 2.25 2.5 3 3.25 3.75 4
3.2 It contingency planning conceptual framework
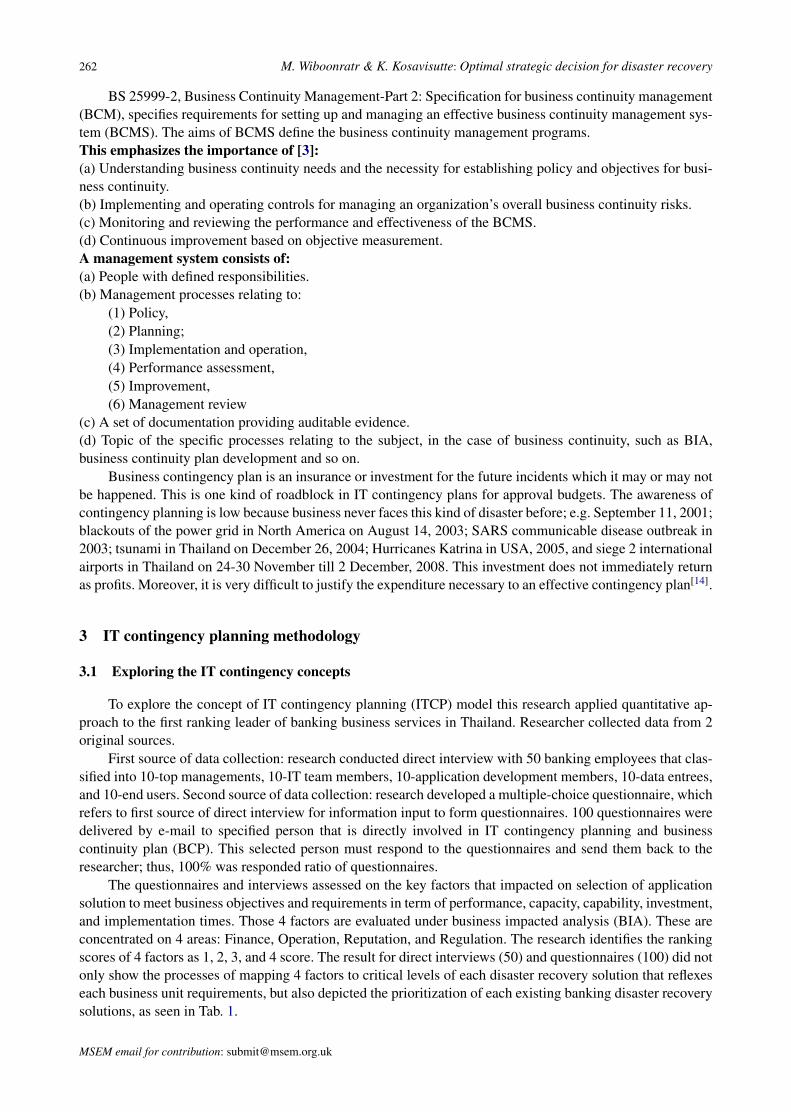
The IT contingency planning conceptual framework is a roadmap to create banking standard procedurefor ITCP team. ITCP classified into 4 stages, as shown in Fig. 1:Stage I. Gathering and Collecting information from 2 original sources after they are manipulated through 4
Fig. 1. Procedural standard for disaster recovery plans
factors.
MSEM email for subscription: [email protected]
264 M. Wiboonratr & K. Kosavisutte: Optimal strategic decision for disaster recovery
Stage II. Mapping 4 factors to critical levels by considering them together with internal and external informa-tion.Stage III. Mapping critical levels to disaster recovery strategy based on present available technologies.Stage IV. Giving recommendation with decision making information supports.
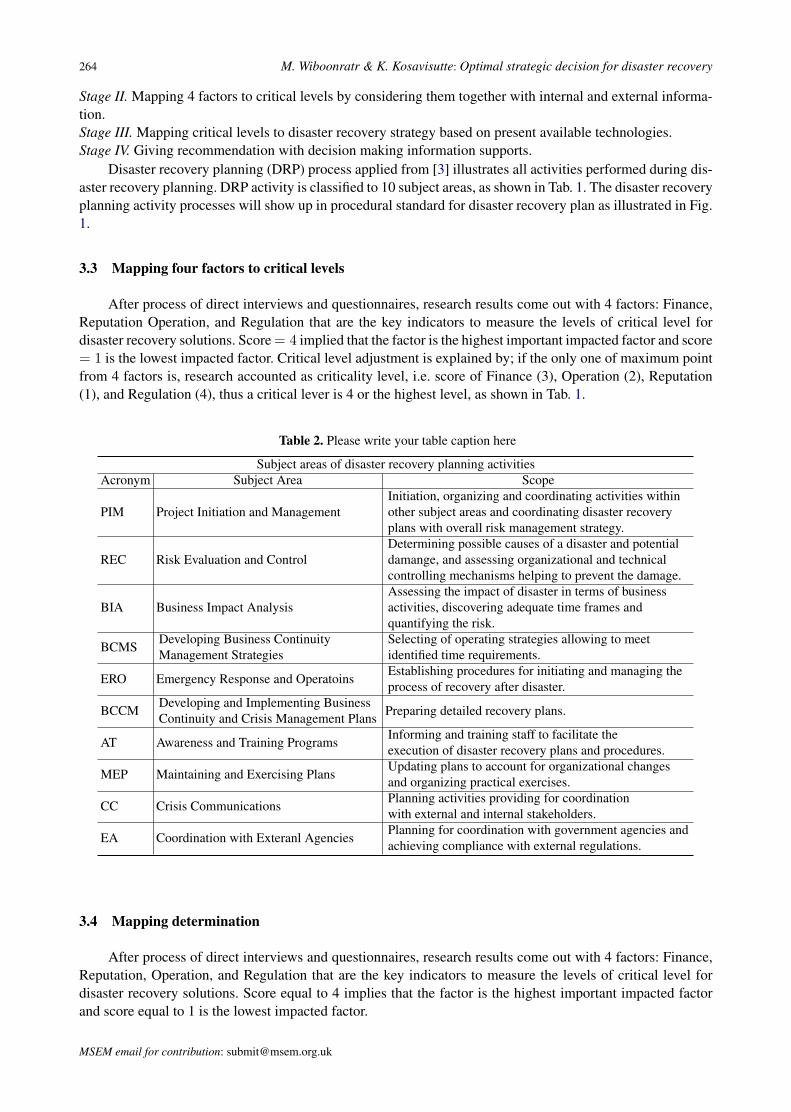
Disaster recovery planning (DRP) process applied from [3] illustrates all activities performed during dis-aster recovery planning. DRP activity is classified to 10 subject areas, as shown in Tab. 1. The disaster recoveryplanning activity processes will show up in procedural standard for disaster recovery plan as illustrated in Fig.1.
3.3 Mapping four factors to critical levels
After process of direct interviews and questionnaires, research results come out with 4 factors: Finance,Reputation Operation, and Regulation that are the key indicators to measure the levels of critical level fordisaster recovery solutions. Score = 4 implied that the factor is the highest important impacted factor and score= 1 is the lowest impacted factor. Critical level adjustment is explained by; if the only one of maximum pointfrom 4 factors is, research accounted as criticality level, i.e. score of Finance (3), Operation (2), Reputation(1), and Regulation (4), thus a critical lever is 4 or the highest level, as shown in Tab. 1.
Table 2. Please write your table caption here
Subject areas of disaster recovery planning activitiesAcronym Subject Area Scope
PIM Project Initiation and ManagementInitiation, organizing and coordinating activities withinother subject areas and coordinating disaster recoveryplans with overall risk management strategy.
REC Risk Evaluation and ControlDetermining possible causes of a disaster and potentialdamange, and assessing organizational and technicalcontrolling mechanisms helping to prevent the damage.
BIA Business Impact AnalysisAssessing the impact of disaster in terms of businessactivities, discovering adequate time frames andquantifying the risk.
BCMSDeveloping Business ContinuityManagement Strategies
Selecting of operating strategies allowing to meetidentified time requirements.
ERO Emergency Response and OperatoinsEstablishing procedures for initiating and managing theprocess of recovery after disaster.
BCCMDeveloping and Implementing BusinessContinuity and Crisis Management Plans Preparing detailed recovery plans.
AT Awareness and Training ProgramsInforming and training staff to facilitate theexecution of disaster recovery plans and procedures.
MEP Maintaining and Exercising PlansUpdating plans to account for organizational changesand organizing practical exercises.
CC Crisis CommunicationsPlanning activities providing for coordinationwith external and internal stakeholders.
EA Coordination with Exteranl AgenciesPlanning for coordination with government agencies andachieving compliance with external regulations.
3.4 Mapping determination
After process of direct interviews and questionnaires, research results come out with 4 factors: Finance,Reputation, Operation, and Regulation that are the key indicators to measure the levels of critical level fordisaster recovery solutions. Score equal to 4 implies that the factor is the highest important impacted factorand score equal to 1 is the lowest impacted factor.
MSEM email for contribution: [email protected]
International Journal of Management Science and Engineering Management, Vol. 4 (2009) No. 4, pp. 260-269 265
Critical Level (CL) = max{Fin,Ope, Rep,Reg} (1)
Priority Level (PL) = (Fin + Ope + Rep + Reg)/4 (2)
Critical level adjustment is explained by; if the only one of maximum point from 4 factors is, research ac-counted as critical level, i.e. score of Finance: 3, Operation: 2, Reputation: 1, and Regulation: 4, thus a criticallevel is 4 or the highest level, as shown in Tab. 1 and Eq. (1). Priority level is average of 4 factors score, bysubstitution in Eq. (2), as illustrated in Tab. 3. Tab. 4 is derived critical level and priority level from Tab. 1 to
Table 3. Mapping priority levels to disaster recovery solutions
Critical Range(CR) CR: D DR Solution CR: C DR Solution CR: B DR Solution CR: A DR Solution
0.25 D 1.25 C 1.50 B 1.75 BBB0.50 DD 1.50 CC 1.75 B 2.00 A0.75 DDD 1.75 CCC 2.00 BB 2.25 A1.00 D-DDD 2.00 B 2.25 BB 2.50 A
2.50 BBB 2.75 AA2.75 BBB 3.00 AA3.00 A 3.25 AA
3.50 AAA3.75 AAA4.00 AAA
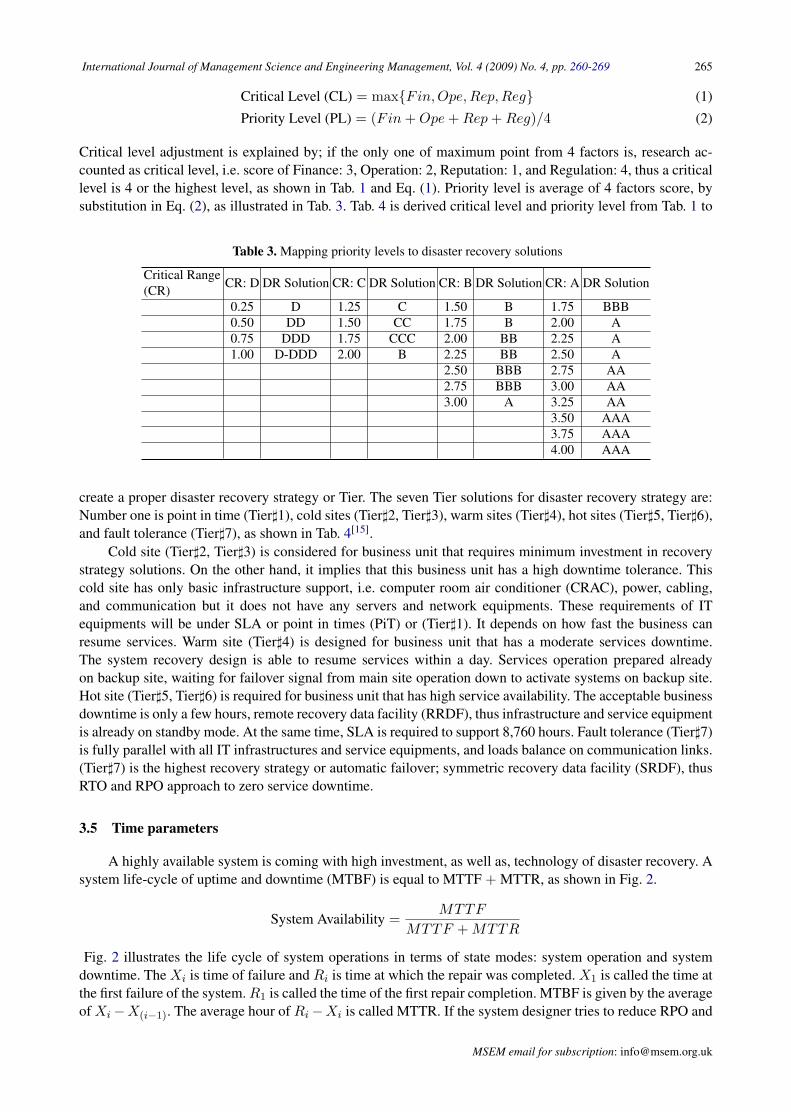
create a proper disaster recovery strategy or Tier. The seven Tier solutions for disaster recovery strategy are:Number one is point in time (Tier]1), cold sites (Tier]2, Tier]3), warm sites (Tier]4), hot sites (Tier]5, Tier]6),and fault tolerance (Tier]7), as shown in Tab. 4[15].
Cold site (Tier]2, Tier]3) is considered for business unit that requires minimum investment in recoverystrategy solutions. On the other hand, it implies that this business unit has a high downtime tolerance. Thiscold site has only basic infrastructure support, i.e. computer room air conditioner (CRAC), power, cabling,and communication but it does not have any servers and network equipments. These requirements of ITequipments will be under SLA or point in times (PiT) or (Tier]1). It depends on how fast the business canresume services. Warm site (Tier]4) is designed for business unit that has a moderate services downtime.The system recovery design is able to resume services within a day. Services operation prepared alreadyon backup site, waiting for failover signal from main site operation down to activate systems on backup site.Hot site (Tier]5, Tier]6) is required for business unit that has high service availability. The acceptable businessdowntime is only a few hours, remote recovery data facility (RRDF), thus infrastructure and service equipmentis already on standby mode. At the same time, SLA is required to support 8,760 hours. Fault tolerance (Tier]7)is fully parallel with all IT infrastructures and service equipments, and loads balance on communication links.(Tier]7) is the highest recovery strategy or automatic failover; symmetric recovery data facility (SRDF), thusRTO and RPO approach to zero service downtime.
3.5 Time parameters
A highly available system is coming with high investment, as well as, technology of disaster recovery. Asystem life-cycle of uptime and downtime (MTBF) is equal to MTTF + MTTR, as shown in Fig. 2.
System Availability =MTTF
MTTF + MTTR
Fig. 2 illustrates the life cycle of system operations in terms of state modes: system operation and systemdowntime. The Xi is time of failure and Ri is time at which the repair was completed. X1 is called the time atthe first failure of the system. R1 is called the time of the first repair completion. MTBF is given by the averageof Xi−X(i−1). The average hour of Ri−Xi is called MTTR. If the system designer tries to reduce RPO and
MSEM email for subscription: [email protected]
266 M. Wiboonratr & K. Kosavisutte: Optimal strategic decision for disaster recovery
Table 4. Mapping critical levels to disaster recovery solutions
CriticalLevels
DRSolutions Tier ] Description of Tier Tape
BackupReal-timeDisk
RemoteLogging
AvaibleSystem
ActiveSystem RTO RPO
1 D 1 Point in Times X 2-7 days 2-24 hrs
1 DD-DDD 2Tape toProvisonalBackup Site
X X 1-3 days 2-24 hrs
2 C-CC 3Disk PiT Copy,Multi-Hop X X 2-24 hrs 2-24 hrs
2,3 CCC-B 4RomoteLogging X X X 12-24 hrs 5-30 mins
3 BB-BBB 5Concurrent ReEx(RRDF, E-Net, others) X X X 1-12 hrs 5-10 mins
4 A-AA 6 Remote Copy X X 1-4 hrs 0-5 mins
4 AAA 7Remote Copywith Failover X X 0-60 mins 0-5 mins
Fig. 2. Failure and repair cycle for a maintained system [17]
RTO to compensate with data losses (∆L), it becomes the highest cost technology. Symmetric recovery datafacility (SRDF) needs to be deliberated, as depicted in Fig. 3.
Elrod stated, “disaster recovery plans are concerned with the reconstruction and retrieving of informationif a primary production facility has been damaged or has been destroyed”[8].
Fig. 3. Chronological time domain
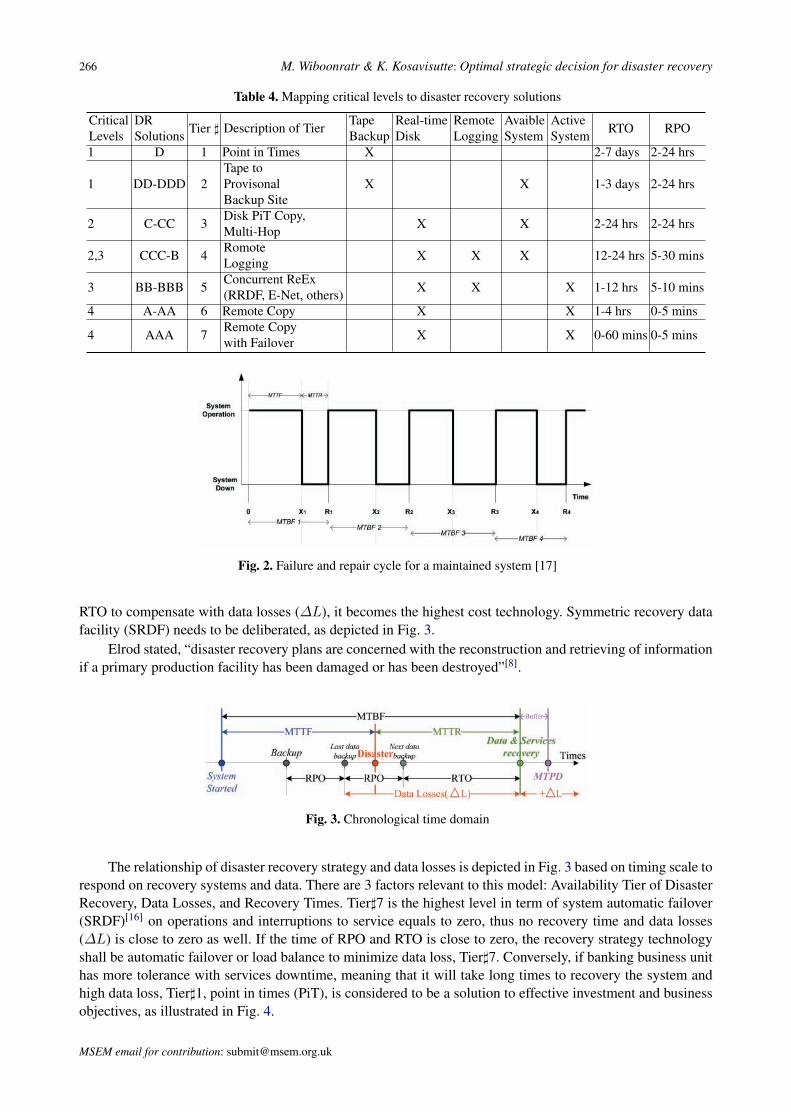
The relationship of disaster recovery strategy and data losses is depicted in Fig. 3 based on timing scale torespond on recovery systems and data. There are 3 factors relevant to this model: Availability Tier of DisasterRecovery, Data Losses, and Recovery Times. Tier]7 is the highest level in term of system automatic failover(SRDF)[16] on operations and interruptions to service equals to zero, thus no recovery time and data losses(∆L) is close to zero as well. If the time of RPO and RTO is close to zero, the recovery strategy technologyshall be automatic failover or load balance to minimize data loss, Tier]7. Conversely, if banking business unithas more tolerance with services downtime, meaning that it will take long times to recovery the system andhigh data loss, Tier]1, point in times (PiT), is considered to be a solution to effective investment and businessobjectives, as illustrated in Fig. 4.
MSEM email for contribution: [email protected]
International Journal of Management Science and Engineering Management, Vol. 4 (2009) No. 4, pp. 260-269 267
Fig. 4. Correlation on strategy levels and data losses (∆L)
3.6 Mapping critical levels to disaster recovery strategy
In Banking, different business unit has various levels of tolerance to service downtime. Recovery systemand restoration data of business depend on maximum tolerable period of disruption (MTPD), as predefined in[10, 19].
The relationship of critical level and recovery strategy needs to be indentified and forms a standard pat-tern. The research result comes out with critical levels: AAA, AA, A, BBB, BB, B, CCC, CC, C, DDD, DD,and D mapping to availability tiers of disaster recovery strategy: S1, S2, S3, S4, and S5, as illustrated in Tab. 5.RTO and RPO are the key components to determine the level of business service that is required when a majordisruption occurs. RPO describes the latest backup data. RTO is the period of business service restoration.Thus, RTO and RPO requirements decide which pattern of disaster recovery strategy will be implemented.Fig. 5 depicts the chronological recovery of each disaster recovery strategy pattern. Each DR strategy is timedependent.
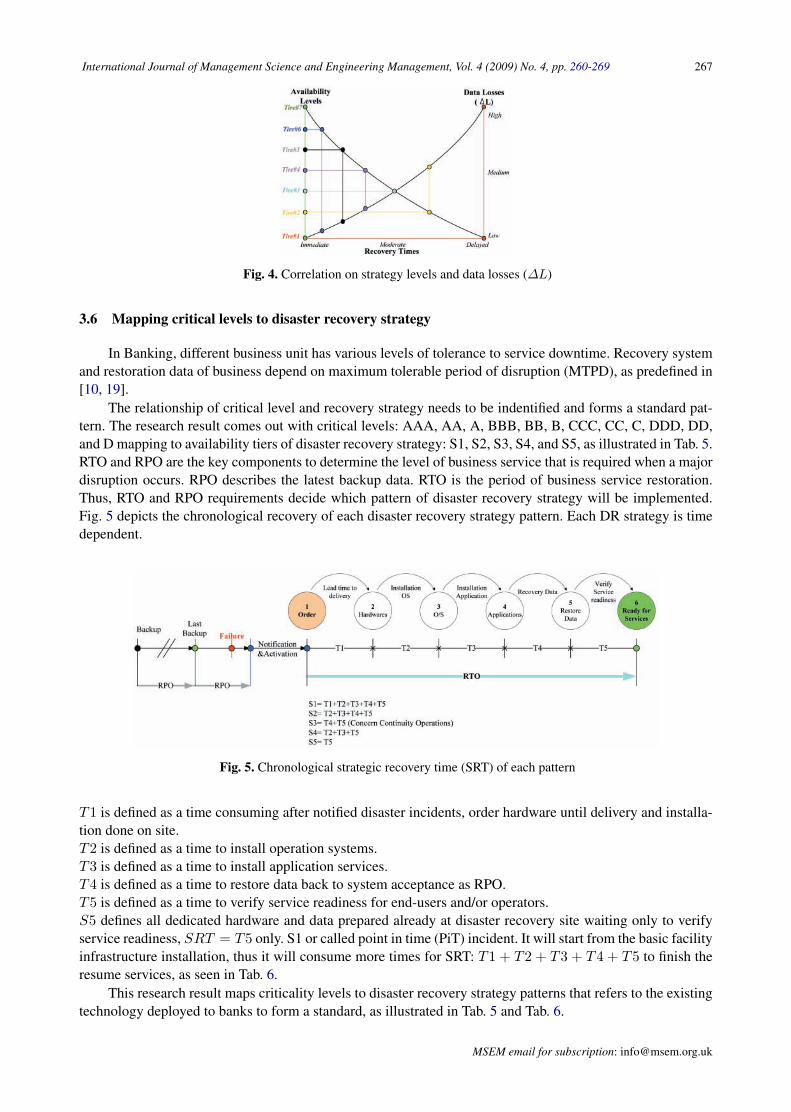
Fig. 5. Chronological strategic recovery time (SRT) of each pattern
T1 is defined as a time consuming after notified disaster incidents, order hardware until delivery and installa-tion done on site.T2 is defined as a time to install operation systems.T3 is defined as a time to install application services.T4 is defined as a time to restore data back to system acceptance as RPO.T5 is defined as a time to verify service readiness for end-users and/or operators.S5 defines all dedicated hardware and data prepared already at disaster recovery site waiting only to verifyservice readiness, SRT = T5 only. S1 or called point in time (PiT) incident. It will start from the basic facilityinfrastructure installation, thus it will consume more times for SRT: T1 + T2 + T3 + T4 + T5 to finish theresume services, as seen in Tab. 6.
This research result maps criticality levels to disaster recovery strategy patterns that refers to the existingtechnology deployed to banks to form a standard, as illustrated in Tab. 5 and Tab. 6.
MSEM email for subscription: [email protected]
268 M. Wiboonratr & K. Kosavisutte: Optimal strategic decision for disaster recovery
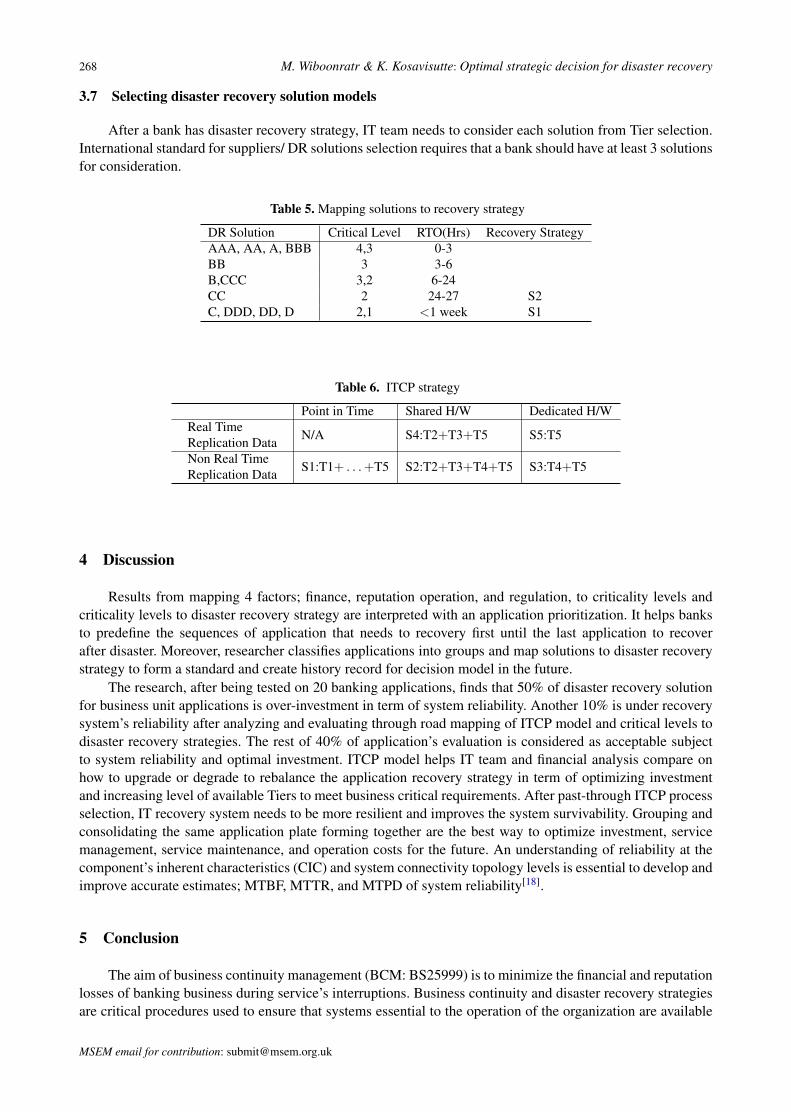
3.7 Selecting disaster recovery solution models
After a bank has disaster recovery strategy, IT team needs to consider each solution from Tier selection.International standard for suppliers/ DR solutions selection requires that a bank should have at least 3 solutionsfor consideration.
Table 5. Mapping solutions to recovery strategy
DR Solution Critical Level RTO(Hrs) Recovery StrategyAAA, AA, A, BBB 4,3 0-3BB 3 3-6B,CCC 3,2 6-24CC 2 24-27 S2C, DDD, DD, D 2,1 <1 week S1
Table 6. ITCP strategy
Point in Time Shared H/W Dedicated H/WReal TimeReplication Data N/A S4:T2+T3+T5 S5:T5
Non Real TimeReplication Data S1:T1+ . . .+T5 S2:T2+T3+T4+T5 S3:T4+T5
4 Discussion
Results from mapping 4 factors; finance, reputation operation, and regulation, to criticality levels andcriticality levels to disaster recovery strategy are interpreted with an application prioritization. It helps banksto predefine the sequences of application that needs to recovery first until the last application to recoverafter disaster. Moreover, researcher classifies applications into groups and map solutions to disaster recoverystrategy to form a standard and create history record for decision model in the future.
The research, after being tested on 20 banking applications, finds that 50% of disaster recovery solutionfor business unit applications is over-investment in term of system reliability. Another 10% is under recoverysystem’s reliability after analyzing and evaluating through road mapping of ITCP model and critical levels todisaster recovery strategies. The rest of 40% of application’s evaluation is considered as acceptable subjectto system reliability and optimal investment. ITCP model helps IT team and financial analysis compare onhow to upgrade or degrade to rebalance the application recovery strategy in term of optimizing investmentand increasing level of available Tiers to meet business critical requirements. After past-through ITCP processselection, IT recovery system needs to be more resilient and improves the system survivability. Grouping andconsolidating the same application plate forming together are the best way to optimize investment, servicemanagement, service maintenance, and operation costs for the future. An understanding of reliability at thecomponent’s inherent characteristics (CIC) and system connectivity topology levels is essential to develop andimprove accurate estimates; MTBF, MTTR, and MTPD of system reliability[18].
5 Conclusion
The aim of business continuity management (BCM: BS25999) is to minimize the financial and reputationlosses of banking business during service’s interruptions. Business continuity and disaster recovery strategiesare critical procedures used to ensure that systems essential to the operation of the organization are available
MSEM email for contribution: [email protected]
International Journal of Management Science and Engineering Management, Vol. 4 (2009) No. 4, pp. 260-269 269
when needed. The importance of disaster recovery for financial services is to protect their e-infrastructure andcritical business of IT applications.
The solutions are integrated between approach of strategies and multiple technologies combined toachieve the specific requirements of banking business unit. The critical level is identified and the disasterrecovery solutions are implemented to optimize the system performance comparing to cost-effective. Thisdisaster recovery strategy will be applied to deal with multi-factor layers on how to select the proper solutionto satisfy business objectives based on the optimal investment to balance the business losses.
References
[1] Business Continuity Planning Booklet-March 2003 - IT Examination Handbook, Federal Financial InstitutionsExamination Council, 2003.
[2] Good Practice Guidelines 2007, A Management Guide to Implementing Global Good Practice in Business Conti-nuity Management, Business Continuity Institute, 2007.
[3] Bs 25999-2 business continuity management-part2: Specification business continuity management. 3BS25999,2007.
[4] N. Academies. in: Improving Disaster Management: The Role of IT in Mitigation, Preparedness, Response, andRecovery. Http://www.nap.edu/catalog/1184.html.
[5] H. Andrew. The Definitive Handbook of Business Continuity Management, 2nd edn. John Wiley & Son, England,2007.
[6] C. Bahan. The disaster recovery plan. GSEC Practical Assignment version 1.4b, Option AAAA1, 2003. SANSInstitute.
[7] R. Cegiela. Selecting technology for disaster recovery. in: Proceeding of the International Conference on Depend-ability of Computer System, 2006.
[8] R. Elrod. So you think you have a good business recovery plan?- steps an asset management company can take torecovery from a major disaster. Http://www.infosecwriters.com/text resources/pdf/Good Business Recovery Plan.pdf.
[9] Gartner. A Report for Sample Company: Business Impact Analysis (BIA). 2002.[10] M. Harper, C. Lawler, M. Thornton. It application downtime, executive visibility and disaster tolerant computing.
2005. Http://engr.smu.edu/mitch/ftp dir/pubs/citsa05b.pdf.[11] R. Helms, S. Oorschot, et al. An integral it continuity framework for undisrupted business operations. in: Proceed-
ings for the First International Conference on Availability, Reliability and Security, 2006.[12] A. Jrad, C. Chan, T. Morawski. Incorporating the downtime due to disaster events in the network reliability model.
in: Telecommunication Network Strategy and Planning Symposium, 2004.[13] S. Mckinty. Combining clusters for business continuity. in: Cluster Computing, 2006. IEEE International Confer-
ence on, 2006, 1–6.[14] C. Rudolph. Business continuation planning/ disaster recovery: A marking perspective. IEEE Communication
Magazine, 1990, 25–28.[15] R. Schulman. Disaster recovery issues and solutions. in: A White Paper, Enterprise Storage, HITACHI Data
System, 2003.[16] R. Weaver. Remote recovery-advanced technology solutions for z/os recovery. in: Technical White Paper, BMC-
software, 2007.[17] M. Wiboonrat. Dependability analysis of data center tier iii. in: IEEE, NETWORKS 2008, The 13th International
Telecommunications Network Strategy and Planning Symposium, Hungary, 2008.[18] M. Wiboonrat. An empirical it contingency planning model for disaster recovery strategy selection. in: IEEE,
IEMC-Europe 2008, Management Engineering, Technology and Innovation for Growth, Portugal, 2008.[19] E. Zambon, D. Bolzoni, et al. A model supporting business continuity auditing & planning in information systems.
in: Second International Conference on Internet Monitoring and Protection.
MSEM email for subscription: [email protected]

320 E. Mehdizadeh: A fuzzy clustering PSO algorithm
[11] J. Kennedy, R. Eberhart. Particle swarm optimization. Proc. of the IEEE Int. Joint Conference on Neural Networks,1995, 4: 1942–1948.
[12] F. Klawonn, A. Keller. Fuzzy clustering with evolutionary algorithms. International Journal of Intelligent Systems,1998, 13: 975–991.
[13] G. Klir, B. Yuan. Fuzzy sets and Fuzzy logic, theory and Applications. Prentice Hall, 2003.[14] D. Krause, R. Handfield. Developing a world-class supply base. Center for Advanced Purchasing Studies.
Http://www.capsresearch.org/publications/pdfspublic/krause1999es.pdf.[15] D. Krause, R. Handfield, T. Scannel. An empirical investigation of supplier development: reactive and strategic
processes. Journal of Operations Management, 1998, 17: 39–58.[16] E. Mehdizadeh, S. Sadi-Nezhad, R. Tavakkoli-Moghaddam. Optimization of fuzzy clustering criteria by a hybrid
pso and fuzzy c-means clustering algorithm. Iranian Journal of Fuzzy Systems, 2008, 5(3): 1–14.[17] E. Mehdizadeh, R. Tavakkoli-Moghaddam. A hybrid fuzzy clustering pso algorithm for a clustering supplier
problem. Singapore, 2007, 1466–1470.[18] D. Merwe, A. Engelbrecht. Data clustering using particle swarm optimization. in: Proc. of the IEEE Congress on
Evolutionary Computation, Australia, 2003, 215–220.[19] D. Newman, S. Hettich, et al. Uci repository of machine learning databases. Department of Information and
Computer Science, University of California, Irvine, CA, 1998. Http://www.ics.uci.edu/mlearn/MLRepository.html.[20] M. Omran, A. Salman, A. Engelbrecht. Image classification using particle swarm optimization. in: Proc. of the
4th Asia-Pacific Conference on Simulated Evolution and Learning, Singapore, 2002, 370–374.[21] D. Parmar, T. Wu, et al. A clustering algorithm for supplier base management. Http://ie.fulton.asu.edu/research
/workingpaper/pdf/MMRSupplier IEEEonEM.pdf.[22] M. Roubens. Fuzzy clustering algorithms and their cluster validity. European Journal of Operational Research,
1982, 10: 294–301.[23] T. Runkler. Ant colony optimization of clustering models. International Journal of Intelligent Systems, 2005, 20:
1233–1261.[24] T. Runkler, C. Katz. Fuzzy clustering by particle swarm optimization. IEEE Int. Conf. on Fuzzy Systems, 2006,
601–608.[25] E. Ruspini. Numerical methods for fuzzy clustering. Information Sciences, 1970, 2: 319–350.[26] T. Satty. The Analytical Hierarchical Process. McGraw Hill, 1980.[27] L. Seiford, R.Thrall. Recent developments in dea: the mathematical programming approach to frontier analysis.
Journal of Econometrics, 1990, 46: 7–38.[28] S. Talluri, R. Narasimhan. A methodology for strategic sourcing. European Journal of Operational Research,
2004, 154: 236–250.[29] J. Tillett, R. Rao, et al. Particle swarms optimization for the clustering of wireless sensors. in: Proc. of SPIE:
Digital Wireless Communications V, vol. 51, 2003, 73–83.[30] R. Vokurka, J. Choobineh, L. Vadi. A prototype expert system for the evaluation and selection of potential suppliers.
International Journal of Operations and Production Management, 1996, 12: 106–127.[31] R. Yen, S. Bang. Fuzzy relations, fuzzy graphs and their applications to clustering analysis. Fuzzy Sets and Their
Applications to Cognitive and Decision Processes, 1975, 125–150. New York: Academic Press, Inc.[32] N. Zahid, M. Limoun, A. Essaid. A new cluster-validity for fuzzy clustering. Pattern Recognition, 1999, 32:
1089–1097.[33] C. Zhang, Y. Gao, et al. Particle swarm optimization for mobile and hoc networks clustering. in: Proc. of the Int.
Conf. on Networking, Sensing and Control, Taiwan, 2004, 372–375.[34] H. Zimmermann. Fuzzy set theory and its applications. Lower Academic Publishers, 1996.
MSEM email for contribution: [email protected]