Embed Size (px)
Citation preview
Paste 2019 – AJC Paterson, AB Fourie and D Reid (eds) © 2019 Australian Centre for Geomechanics, Perth, ISBN 978-0-9876389-2-2
Paste 2019, Cape Town, South Africa 437
Optimisation of cemented aggregate backfill at New Luika
Gold Mine
BG Salvoldi Paterson & Cooke, South Africa
B van der Spuy Paterson & Cooke, South Africa
S Wilson Paterson & Cooke, UK
Abstract
Cemented aggregate fill (CAF) and cemented rockfill (CRF) have successfully been used as a low-cost, high-strength backfill material in underground mines. The placement of the material and flowability generally limits the technology to low throughput application and smaller stope sizes if tight filling is required.
Optimisation of CAF/CRF flowability and strengths is most readily achieved by optimising the Fuller–Thompson gradation curve. CAF/CRF relies on the materials available on the mine site and the additional costs of borrow pits or additional crushing adds significant cost to a material that is usually chosen due to low cost.
This paper presents a case study of an optimisation of a CAF material by the addition of tailings in order to increase the paste fraction of the material. The main aim was to decrease the angle of repose to improve filling ability in addition to decreasing the required binder content.
Keywords: cemented aggregate fill, cemented rockfill, mine backfill, optimisation
1 Introduction
Cemented aggregate fill (CAF) and cemented rockfill (CRF) as a backfill material for underground mine support is typically utilised in low throughput applications. Generally, CAF develops higher strengths compared to hydraulic fill and paste fill as the internal angle of friction is higher and the particle-to-particle contact is the main cause of strength development.
CAF relies on a readily available supply of development waste from underground which is usually more fractured than open cast waste rock. However, significant crushing and screening is still required to make it suitable for CAF applications. The sizing and preparation of the material is a significant cost of the backfill and achieving an ideal grading curve presents the most challenges.
CAF is being utilised to support a long hole open stoping (LHOS) retreat mining operation at the New Luika Gold Mine in Tanzania. This case study presents a CAF implementation project where the CAF grading was not achieved by the repurposed crushing circuit. Addition of tailings was used to provide the paste fraction of the CAF to optimise the backfill material.
1.1 Project background
A detailed design was carried out which involved the testing of screened waste rock from which CAF mix designs and estimates of binder content were developed. The detailed design assumed the crushing and screening of waste rock to meet an optimised grading criterion.
However, during implementation of the project, it was found that the repurposed crushing plant could not deliver the desired grading specification at the required throughput, leading to excessive binder addition and poor flowability characteristics.
The aim of the optimisation was to evaluate the addition of tailings to compensate for the missing fines instead of the costly alternatives such as the addition of an additional crushing circuit.
https://papers.acg.uwa.edu.au/p/1910_32_Salvoldi/
Optimisation of cemented aggregate backfill at New Luika Gold Mine BG Salvoldi et al.
438 Paste 2019, Cape Town, South Africa
2 New Luika Gold Mine
The New Luika Gold Mine, operated by Shanta Gold, is located in the Songwe District of southwest Tanzania approximately 700 km southwest of Dar es Salaam.
Shanta Gold is currently producing gold from two underground deposits at New Luika; the Bauhinia Creek (BC) and Luika deposits. CAF is being used at Shanta in the BC underground workings to fill voids in order to provide support for mining activities. The deposit is mined by LHOS with continuous retreat pillarless mining with mostly longitudinal access.
The orebody, a mineralised quartz vein, varies greatly in dip and width (8 to 30 m). Stope geometries are generally 8 to 20 m wide, 20 m long and 25 m high. If the orebody width is greater than 20 m, then the stopes are accessed transversally to maintain a 20 m wide stope geometry.
No pillars are left behind and backfill is exposed vertically during retreat mining. Some backfill is undermined (exposed horizontally) during the next lift.
2.1 CAF system description
A crushing circuit is fed by waste rock from the mine to produce a graded rock product. A grizzly is used to remove all rocks larger than 400 mm to feed a jaw crusher. A vibrating screen is used to screen off any oversize rock (+50 mm), which is sent to a cone crusher for secondary crushing. The product is stockpiled for loading into the batch plant aggregate hopper.
The batch plant weighs out the aggregate, water and binder in the proportions determined by the mix recipe and serves as the primary quality control (QC) and quality assurance (QA). The batch plant is operated as an on/off operation with the weighing and mixing completely automated. For each batch, the operator must start the process manually once the truck is located under the mixer discharge. The required volume is selected and the batch plant prepares the batch according to the selected mix design.
In this process, the aggregate size distribution and moisture content are the only variables that cannot be controlled on a batch-to-batch basis. Moisture content for the aggregate is checked periodically depending on weather conditions.
Variability in the aggregate size distribution and moisture content are accounted for in the Factor of Safety on the backfill strength required and the backfill strength target. Backfill strengths are determined for each stope based on the stope dimensions and future exposure conditions.
2.2 Backfill process
The backfill is transported to the stopes by ejector trucks with a capacity of 12 m³ (24 t per batch). The plant output is limited by the trucking cycle. A backfill production of about 24 m³ (50 t) per hour is readily achievable and could be increased with utilisation of more trucks.
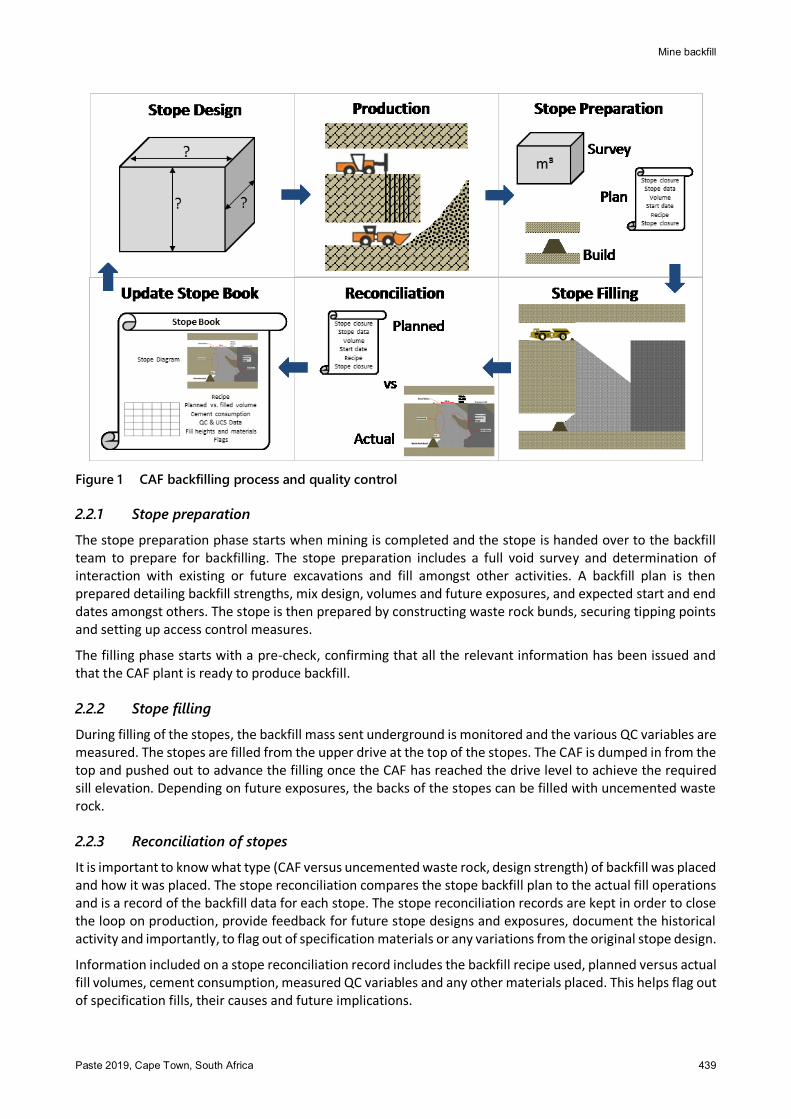
Figure 1 shows how the backfilling process fits in with the mining process. The backfill process consist of stope preparation, stope filling and stope reconciliation.
Mine backfill
Paste 2019, Cape Town, South Africa 439
Figure 1 CAF backfilling process and quality control
2.2.1 Stope preparation
The stope preparation phase starts when mining is completed and the stope is handed over to the backfill team to prepare for backfilling. The stope preparation includes a full void survey and determination of interaction with existing or future excavations and fill amongst other activities. A backfill plan is then prepared detailing backfill strengths, mix design, volumes and future exposures, and expected start and end dates amongst others. The stope is then prepared by constructing waste rock bunds, securing tipping points and setting up access control measures.
The filling phase starts with a pre-check, confirming that all the relevant information has been issued and that the CAF plant is ready to produce backfill.
2.2.2 Stope filling
During filling of the stopes, the backfill mass sent underground is monitored and the various QC variables are measured. The stopes are filled from the upper drive at the top of the stopes. The CAF is dumped in from the top and pushed out to advance the filling once the CAF has reached the drive level to achieve the required sill elevation. Depending on future exposures, the backs of the stopes can be filled with uncemented waste rock.
2.2.3 Reconciliation of stopes
It is important to know what type (CAF versus uncemented waste rock, design strength) of backfill was placed and how it was placed. The stope reconciliation compares the stope backfill plan to the actual fill operations and is a record of the backfill data for each stope. The stope reconciliation records are kept in order to close the loop on production, provide feedback for future stope designs and exposures, document the historical activity and importantly, to flag out of specification materials or any variations from the original stope design.
Information included on a stope reconciliation record includes the backfill recipe used, planned versus actual fill volumes, cement consumption, measured QC variables and any other materials placed. This helps flag out of specification fills, their causes and future implications.
Optimisation of cemented aggregate backfill at New Luika Gold Mine BG Salvoldi et al.
440 Paste 2019, Cape Town, South Africa
3 Cemented aggregate fill design
The particle size distribution of a backfill material is an important parameter in the strength gain of the material as well as the placement characteristics of the backfill. The main goal is to produce a fill that will develop dense packing during placement while ensuring the required strength gain.
The following section discusses the various aspects that were considered for the design of the backfill product at New Luika.
3.1 Cemented rockfill versus cemented aggregate fill
Waste rock used for backfilling purposes which has not undergone modification of particle grading can be classified as unmodified rockfill (Potvin et al. 2005). Unmodified rockfills are loosely packed by nature and are unable to stand in vertical exposures and only serve to support the stope hanging wall. It is therefore not possible to mine next to unmodified rockfill.
Unmodified rockfills can be modified to be self-supporting during vertical exposures and allow mining next to the fill, by reducing the placed porosity with the addition of binders and/or the optimisation of the particle size distribution (PSD) of the final backfill mixture (Potvin et al. 2005).
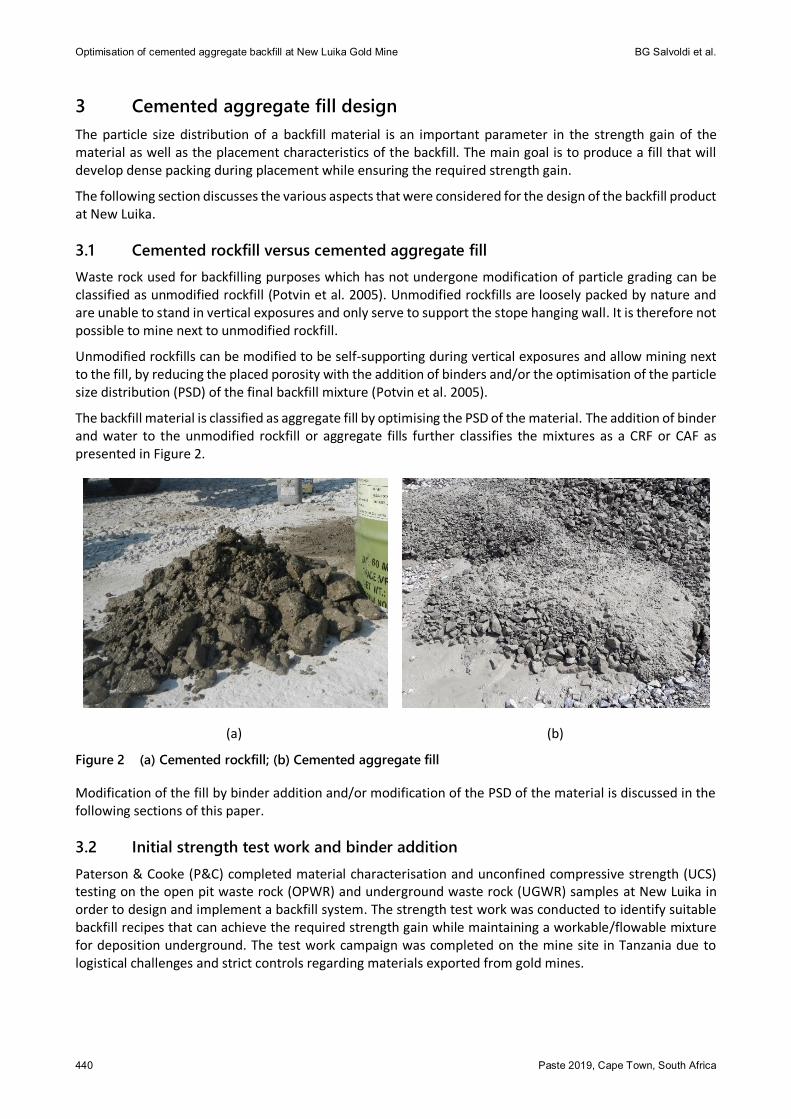
The backfill material is classified as aggregate fill by optimising the PSD of the material. The addition of binder and water to the unmodified rockfill or aggregate fills further classifies the mixtures as a CRF or CAF as presented in Figure 2.
(a) (b)
Figure 2 (a) Cemented rockfill; (b) Cemented aggregate fill
Modification of the fill by binder addition and/or modification of the PSD of the material is discussed in the following sections of this paper.
3.2 Initial strength test work and binder addition
Paterson & Cooke (P&C) completed material characterisation and unconfined compressive strength (UCS) testing on the open pit waste rock (OPWR) and underground waste rock (UGWR) samples at New Luika in order to design and implement a backfill system. The strength test work was conducted to identify suitable backfill recipes that can achieve the required strength gain while maintaining a workable/flowable mixture for deposition underground. The test work campaign was completed on the mine site in Tanzania due to logistical challenges and strict controls regarding materials exported from gold mines.
Mine backfill
Paste 2019, Cape Town, South Africa 441
The OPWR and UGWR materials were screened to top sizes ranging between 50 and 150 mm. To minimise wall effects and to ensure representative results, the mould diameter used for sample curing was least 3 to 6 times larger than the largest particle size.
As a first step, trial mixes were prepared to determine the required water content (or backfill mass concentration) that will provide a workable mixture for casting of samples. If too much water is added, the fines wash out of the mix and if too little water is added, the aggregate is not fully covered with cement resulting in uncemented pockets in the backfill.
The mass concentration range that produces an adequate CAF flowability is very small. Generally, the mass concentration is fixed once a workable mixture is achieved with trial mixes. For test purposes the water content of the trial mixture is fixed and the water to cement (w:c) ratio is varied by adjusting the cement content.
The trial mixes showed that a mass solids concentration of 93.5%m yielded the best results, with the mixture being workable as well as being dry enough to prevent water and cement from seeping out. Samples were therefore prepared at the workable mass concentration at varying cement contents of between 5 and 10%b.
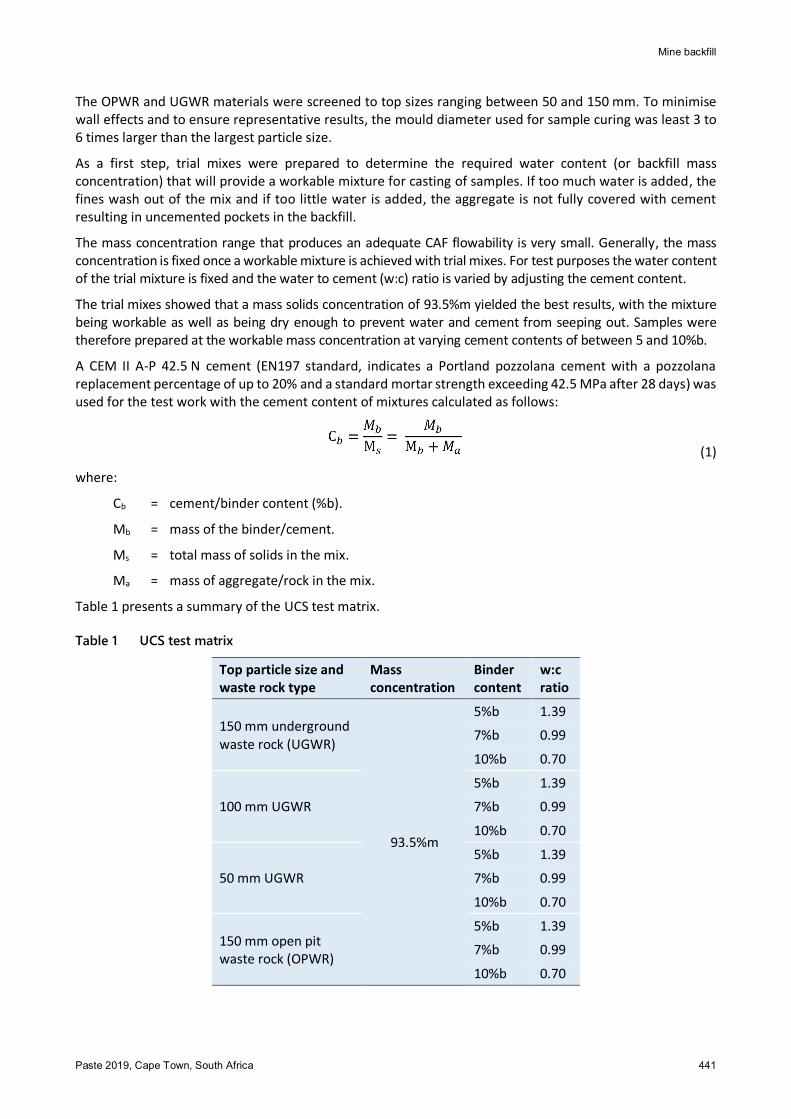
A CEM II A-P 42.5 N cement (EN197 standard, indicates a Portland pozzolana cement with a pozzolana replacement percentage of up to 20% and a standard mortar strength exceeding 42.5 MPa after 28 days) was used for the test work with the cement content of mixtures calculated as follows:
(1)
where:
Cb = cement/binder content (%b).
Mb = mass of the binder/cement.
Ms = total mass of solids in the mix.
Ma = mass of aggregate/rock in the mix.
Table 1 presents a summary of the UCS test matrix.
Table 1 UCS test matrix
Top particle size and waste rock type
Mass concentration
Binder content
w:c ratio
150 mm underground waste rock (UGWR)
93.5%m
5%b 1.39
7%b 0.99
10%b 0.70
100 mm UGWR
5%b 1.39
7%b 0.99
10%b 0.70
50 mm UGWR
5%b 1.39
7%b 0.99
10%b 0.70
150 mm open pit waste rock (OPWR)
5%b 1.39
7%b 0.99
10%b 0.70

Optimisation of cemented aggregate backfill at New Luika Gold Mine BG Salvoldi et al.
442 Paste 2019, Cape Town, South Africa
The results of the 28-day UCS test work is presented in Figure 3. A common power correlation of y = Ax-0.7 was plotted through the results of each material. The mix design of the CAF system was based on these results until a crushing circuit could be commissioned and updated results would be produced from the QA/QC procedure.
Figure 3 UCS test work results
3.3 Particle size distribution optimisation: Fuller–Thompson gradation curve
Fuller and Thompson (1907) developed the first widely used, continuous, ideal grading curve for concrete aggregates. Other continuous and discrete grading curves have since been developed to maximise particle packing. For CAF applications however, considering that the materials have to be produced onsite, the Fuller curves are still the most appropriate and simplest model.
The Fuller–Thompson gradation curve is defined as follows:
(2)
where:
u = sieve size.
umax = maximum particle size.
n = distribution constant (also referred to as the Fuller number).
Modification of the PSD can be achieved by the following methods:
1. Introducing a crushing circuit before the waste rock material is introduced to the backfill mixing system.
2. Addition of locally available sand from borrow pits.
3. The addition of tailings into the backfill mixture.
4. A combination of the above three.
R² = 0.973
R² = 0.982
R² = 0.972
R² = 0.994
y = 340x-0.7
y = 290x-0.7
y = 280x-0.7
y = 250x-0.7
0
0.5
1
1.5
2
0 1000 2000 3000 4000 5000 6000 7000
W/C
Ra
tio
UCS Strength (kPa)
150 mm UGWR
100 mm UGWR
50 mm UGWR
150 mm OPWR
Mine backfill
Paste 2019, Cape Town, South Africa 443
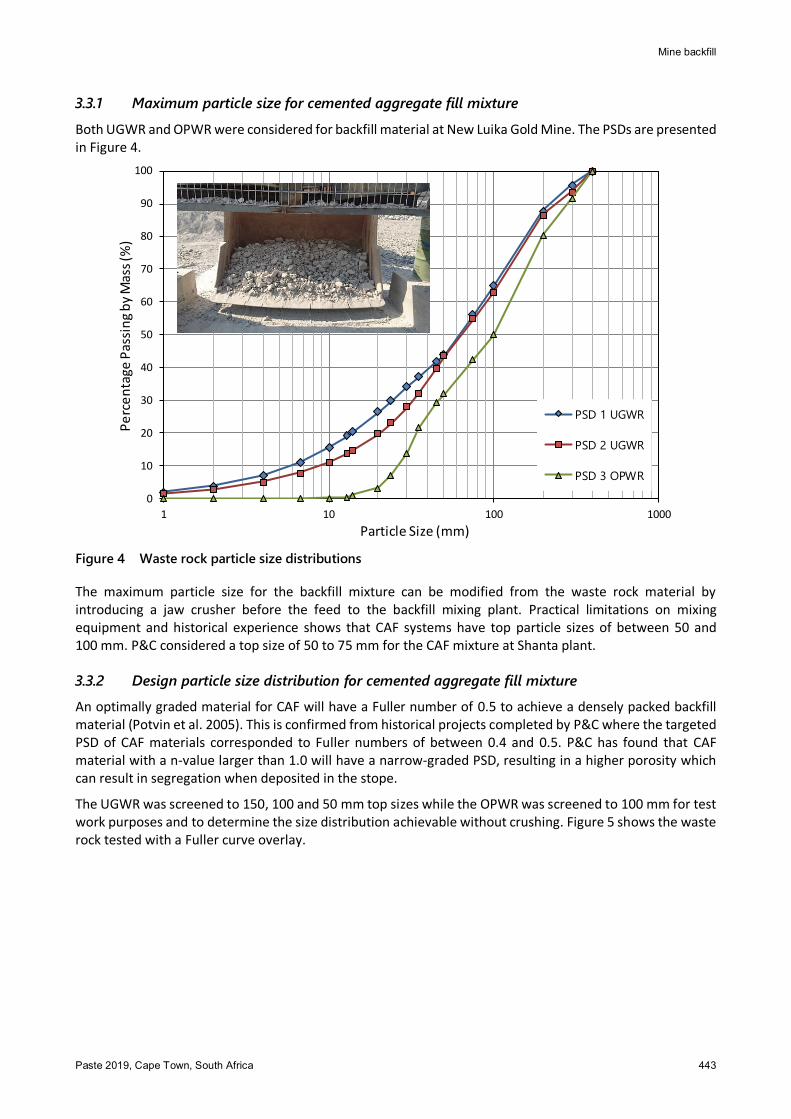
3.3.1 Maximum particle size for cemented aggregate fill mixture
Both UGWR and OPWR were considered for backfill material at New Luika Gold Mine. The PSDs are presented in Figure 4.
Figure 4 Waste rock particle size distributions
The maximum particle size for the backfill mixture can be modified from the waste rock material by introducing a jaw crusher before the feed to the backfill mixing plant. Practical limitations on mixing equipment and historical experience shows that CAF systems have top particle sizes of between 50 and 100 mm. P&C considered a top size of 50 to 75 mm for the CAF mixture at Shanta plant.
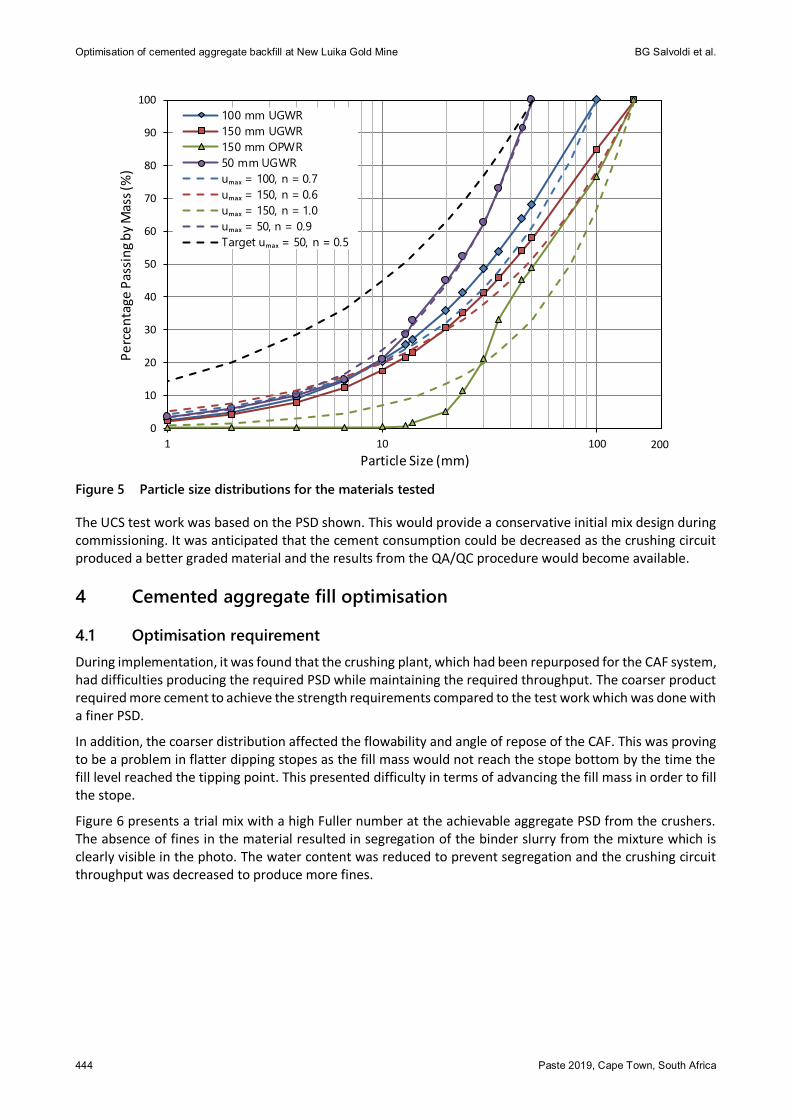
3.3.2 Design particle size distribution for cemented aggregate fill mixture
An optimally graded material for CAF will have a Fuller number of 0.5 to achieve a densely packed backfill material (Potvin et al. 2005). This is confirmed from historical projects completed by P&C where the targeted PSD of CAF materials corresponded to Fuller numbers of between 0.4 and 0.5. P&C has found that CAF material with a n-value larger than 1.0 will have a narrow-graded PSD, resulting in a higher porosity which can result in segregation when deposited in the stope.
The UGWR was screened to 150, 100 and 50 mm top sizes while the OPWR was screened to 100 mm for test work purposes and to determine the size distribution achievable without crushing. Figure 5 shows the waste rock tested with a Fuller curve overlay.
0
10
20
30
40
50
60
70
80
90
100
1 10 100 1000
Pe
rce
nta
ge P
assi
ng
by
Mas
s (%
)
Particle Size (mm)
PSD 1 UGWR
PSD 2 UGWR
PSD 3 OPWR
Optimisation of cemented aggregate backfill at New Luika Gold Mine BG Salvoldi et al.
444 Paste 2019, Cape Town, South Africa
Figure 5 Particle size distributions for the materials tested
The UCS test work was based on the PSD shown. This would provide a conservative initial mix design during commissioning. It was anticipated that the cement consumption could be decreased as the crushing circuit produced a better graded material and the results from the QA/QC procedure would become available.
4 Cemented aggregate fill optimisation
4.1 Optimisation requirement
During implementation, it was found that the crushing plant, which had been repurposed for the CAF system, had difficulties producing the required PSD while maintaining the required throughput. The coarser product required more cement to achieve the strength requirements compared to the test work which was done with a finer PSD.
In addition, the coarser distribution affected the flowability and angle of repose of the CAF. This was proving to be a problem in flatter dipping stopes as the fill mass would not reach the stope bottom by the time the fill level reached the tipping point. This presented difficulty in terms of advancing the fill mass in order to fill the stope.
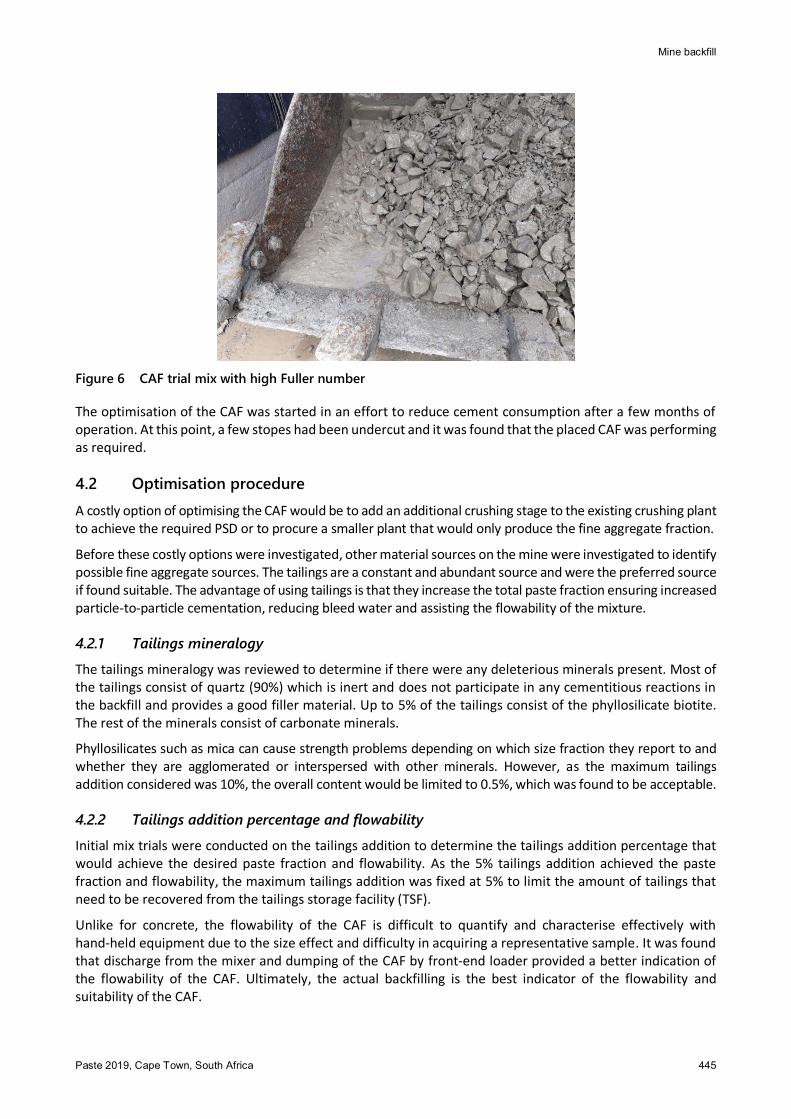
Figure 6 presents a trial mix with a high Fuller number at the achievable aggregate PSD from the crushers. The absence of fines in the material resulted in segregation of the binder slurry from the mixture which is clearly visible in the photo. The water content was reduced to prevent segregation and the crushing circuit throughput was decreased to produce more fines.
0
10
20
30
40
50
60
70
80
90
100
1 10 100
Pe
rce
nta
ge P
assi
ng
by
Mas
s (%
)
Particle Size (mm)
100 mm UGWR
150 mm UGWR
150 mm OPWR
50 mm UGWR
uₘₐₓ = 100, n = 0.7
uₘₐₓ = 150, n = 0.6
uₘₐₓ = 150, n = 1.0
uₘₐₓ = 50, n = 0.9
Target uₘₐₓ = 50, n = 0.5
200
Mine backfill
Paste 2019, Cape Town, South Africa 445
Figure 6 CAF trial mix with high Fuller number
The optimisation of the CAF was started in an effort to reduce cement consumption after a few months of operation. At this point, a few stopes had been undercut and it was found that the placed CAF was performing as required.
4.2 Optimisation procedure
A costly option of optimising the CAF would be to add an additional crushing stage to the existing crushing plant to achieve the required PSD or to procure a smaller plant that would only produce the fine aggregate fraction.
Before these costly options were investigated, other material sources on the mine were investigated to identify possible fine aggregate sources. The tailings are a constant and abundant source and were the preferred source if found suitable. The advantage of using tailings is that they increase the total paste fraction ensuring increased particle-to-particle cementation, reducing bleed water and assisting the flowability of the mixture.
4.2.1 Tailings mineralogy
The tailings mineralogy was reviewed to determine if there were any deleterious minerals present. Most of the tailings consist of quartz (90%) which is inert and does not participate in any cementitious reactions in the backfill and provides a good filler material. Up to 5% of the tailings consist of the phyllosilicate biotite. The rest of the minerals consist of carbonate minerals.
Phyllosilicates such as mica can cause strength problems depending on which size fraction they report to and whether they are agglomerated or interspersed with other minerals. However, as the maximum tailings addition considered was 10%, the overall content would be limited to 0.5%, which was found to be acceptable.
4.2.2 Tailings addition percentage and flowability
Initial mix trials were conducted on the tailings addition to determine the tailings addition percentage that would achieve the desired paste fraction and flowability. As the 5% tailings addition achieved the paste fraction and flowability, the maximum tailings addition was fixed at 5% to limit the amount of tailings that need to be recovered from the tailings storage facility (TSF).
Unlike for concrete, the flowability of the CAF is difficult to quantify and characterise effectively with hand-held equipment due to the size effect and difficulty in acquiring a representative sample. It was found that discharge from the mixer and dumping of the CAF by front-end loader provided a better indication of the flowability of the CAF. Ultimately, the actual backfilling is the best indicator of the flowability and suitability of the CAF.
Optimisation of cemented aggregate backfill at New Luika Gold Mine BG Salvoldi et al.
446 Paste 2019, Cape Town, South Africa
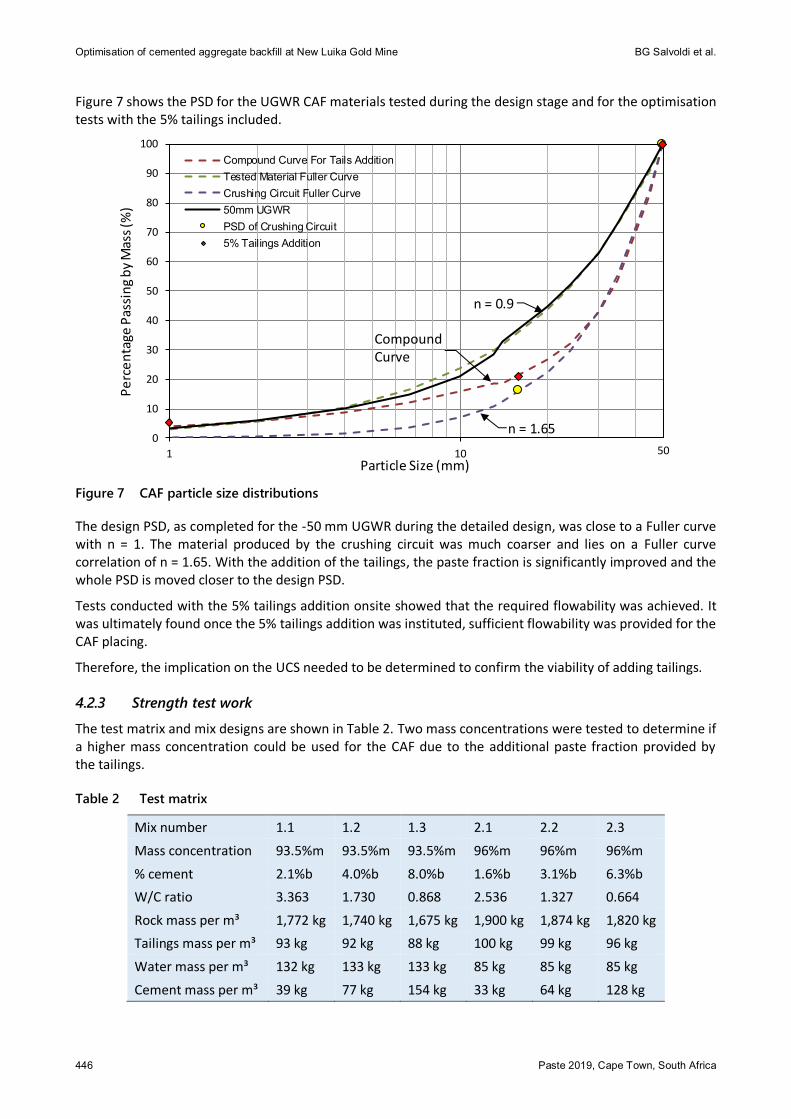
Figure 7 shows the PSD for the UGWR CAF materials tested during the design stage and for the optimisation tests with the 5% tailings included.
Figure 7 CAF particle size distributions
The design PSD, as completed for the -50 mm UGWR during the detailed design, was close to a Fuller curve with n = 1. The material produced by the crushing circuit was much coarser and lies on a Fuller curve correlation of n = 1.65. With the addition of the tailings, the paste fraction is significantly improved and the whole PSD is moved closer to the design PSD.
Tests conducted with the 5% tailings addition onsite showed that the required flowability was achieved. It was ultimately found once the 5% tailings addition was instituted, sufficient flowability was provided for the CAF placing.
Therefore, the implication on the UCS needed to be determined to confirm the viability of adding tailings.
4.2.3 Strength test work
The test matrix and mix designs are shown in Table 2. Two mass concentrations were tested to determine if a higher mass concentration could be used for the CAF due to the additional paste fraction provided by the tailings.
Table 2 Test matrix
Mix number 1.1 1.2 1.3 2.1 2.2 2.3
Mass concentration 93.5%m 93.5%m 93.5%m 96%m 96%m 96%m
% cement 2.1%b 4.0%b 8.0%b 1.6%b 3.1%b 6.3%b
W/C ratio 3.363 1.730 0.868 2.536 1.327 0.664
Rock mass per m³ 1,772 kg 1,740 kg 1,675 kg 1,900 kg 1,874 kg 1,820 kg
Tailings mass per m³ 93 kg 92 kg 88 kg 100 kg 99 kg 96 kg
Water mass per m³ 132 kg 133 kg 133 kg 85 kg 85 kg 85 kg
Cement mass per m³ 39 kg 77 kg 154 kg 33 kg 64 kg 128 kg
0
10
20
30
40
50
60
70
80
90
100
1 10
Pe
rce
nta
ge P
assi
ng
by
Mas
s (%
)
Particle Size (mm)
Compound Curve For Tails Addition
Tested Material Fuller Curve
Crushing Circuit Fuller Curve
50mm UGWR
PSD of Crushing Circuit
5% Tailings Addition
50
n = 0.9
n = 1.65
Compound Curve
Mine backfill
Paste 2019, Cape Town, South Africa 447
The masses were adjusted onsite depending on the measured moisture content of both the tailings and the rock.
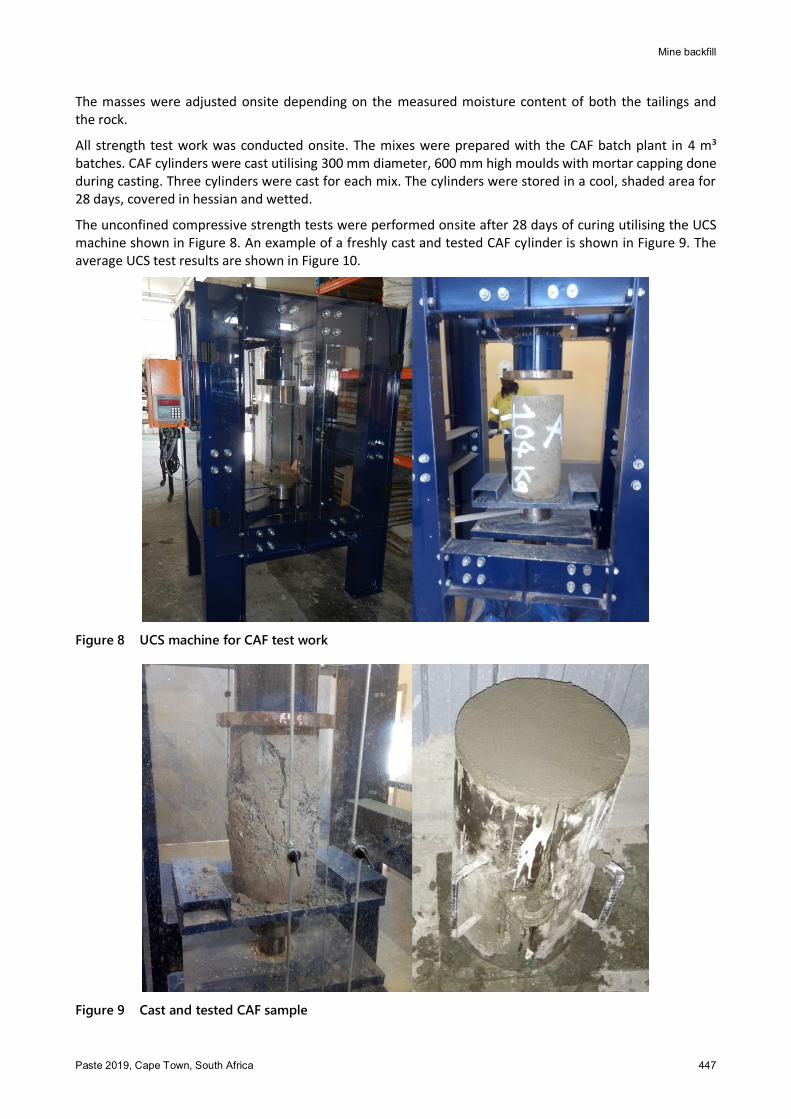
All strength test work was conducted onsite. The mixes were prepared with the CAF batch plant in 4 m³ batches. CAF cylinders were cast utilising 300 mm diameter, 600 mm high moulds with mortar capping done during casting. Three cylinders were cast for each mix. The cylinders were stored in a cool, shaded area for 28 days, covered in hessian and wetted.
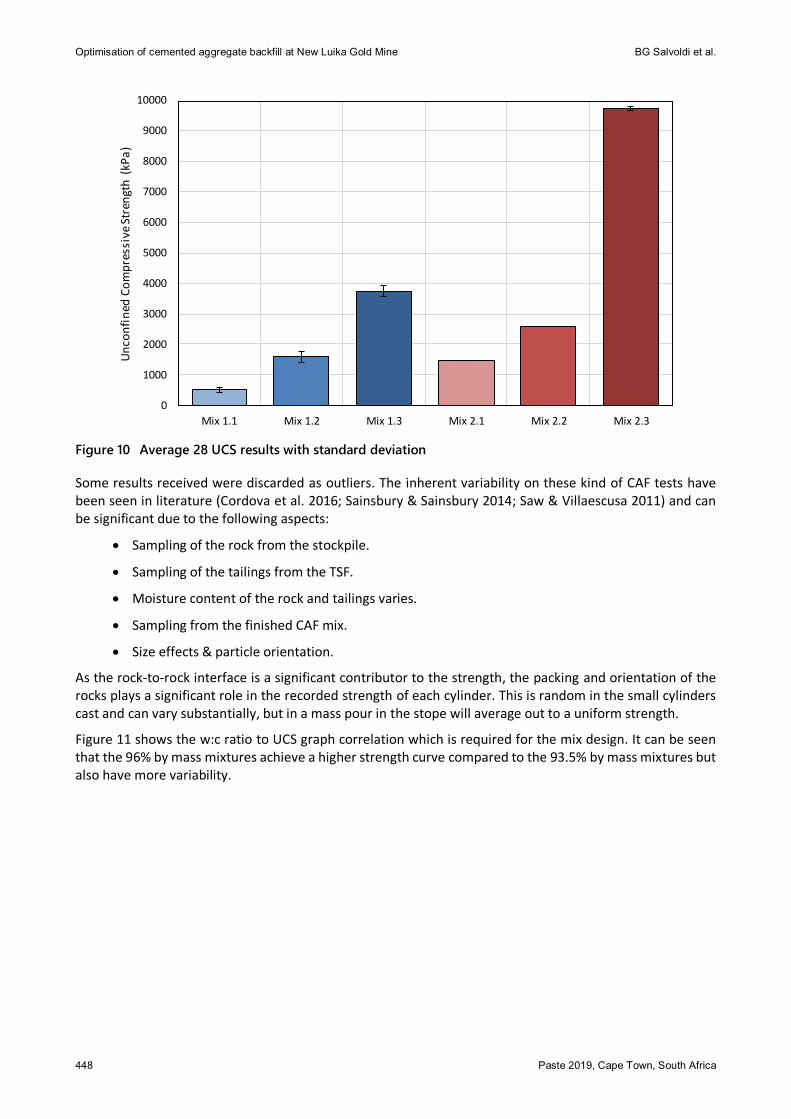
The unconfined compressive strength tests were performed onsite after 28 days of curing utilising the UCS machine shown in Figure 8. An example of a freshly cast and tested CAF cylinder is shown in Figure 9. The average UCS test results are shown in Figure 10.
Figure 8 UCS machine for CAF test work
Figure 9 Cast and tested CAF sample
Optimisation of cemented aggregate backfill at New Luika Gold Mine BG Salvoldi et al.
448 Paste 2019, Cape Town, South Africa
Figure 10 Average 28 UCS results with standard deviation
Some results received were discarded as outliers. The inherent variability on these kind of CAF tests have been seen in literature (Cordova et al. 2016; Sainsbury & Sainsbury 2014; Saw & Villaescusa 2011) and can be significant due to the following aspects:
Sampling of the rock from the stockpile.
Sampling of the tailings from the TSF.
Moisture content of the rock and tailings varies.
Sampling from the finished CAF mix.
Size effects & particle orientation.
As the rock-to-rock interface is a significant contributor to the strength, the packing and orientation of the rocks plays a significant role in the recorded strength of each cylinder. This is random in the small cylinders cast and can vary substantially, but in a mass pour in the stope will average out to a uniform strength.
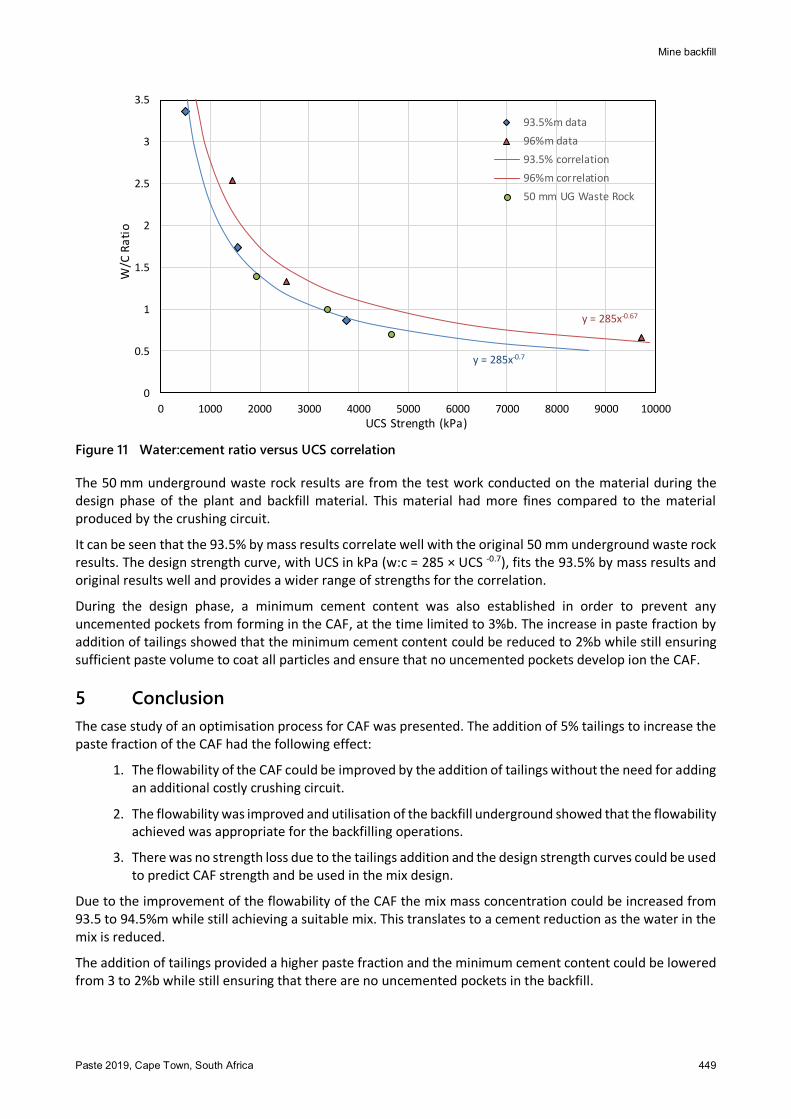
Figure 11 shows the w:c ratio to UCS graph correlation which is required for the mix design. It can be seen that the 96% by mass mixtures achieve a higher strength curve compared to the 93.5% by mass mixtures but also have more variability.
0
1000
2000
3000
4000
5000
6000
7000
8000
9000
10000
Mix 1.1 Mix 1.2 Mix 1.3 Mix 2.1 Mix 2.2 Mix 2.3
Un
con
fin
ed C
om
pre
ssiv
e St
ren
gth
(kP
a)
Mine backfill
Paste 2019, Cape Town, South Africa 449
Figure 11 Water:cement ratio versus UCS correlation
The 50 mm underground waste rock results are from the test work conducted on the material during the design phase of the plant and backfill material. This material had more fines compared to the material produced by the crushing circuit.
It can be seen that the 93.5% by mass results correlate well with the original 50 mm underground waste rock results. The design strength curve, with UCS in kPa (w:c = 285 × UCS -0.7), fits the 93.5% by mass results and original results well and provides a wider range of strengths for the correlation.
During the design phase, a minimum cement content was also established in order to prevent any uncemented pockets from forming in the CAF, at the time limited to 3%b. The increase in paste fraction by addition of tailings showed that the minimum cement content could be reduced to 2%b while still ensuring sufficient paste volume to coat all particles and ensure that no uncemented pockets develop ion the CAF.
5 Conclusion
The case study of an optimisation process for CAF was presented. The addition of 5% tailings to increase the paste fraction of the CAF had the following effect:
1. The flowability of the CAF could be improved by the addition of tailings without the need for adding an additional costly crushing circuit.
2. The flowability was improved and utilisation of the backfill underground showed that the flowability achieved was appropriate for the backfilling operations.
3. There was no strength loss due to the tailings addition and the design strength curves could be used to predict CAF strength and be used in the mix design.
Due to the improvement of the flowability of the CAF the mix mass concentration could be increased from 93.5 to 94.5%m while still achieving a suitable mix. This translates to a cement reduction as the water in the mix is reduced.
The addition of tailings provided a higher paste fraction and the minimum cement content could be lowered from 3 to 2%b while still ensuring that there are no uncemented pockets in the backfill.
y = 285x-0.7
y = 285x-0.67
0
0.5
1
1.5
2
2.5
3
3.5
0 1000 2000 3000 4000 5000 6000 7000 8000 9000 10000
W/C
Ra
tio
UCS Strength (kPa)
93.5%m data
96%m data
93.5% correlation
96%m correlation
50 mm UG Waste Rock
Optimisation of cemented aggregate backfill at New Luika Gold Mine BG Salvoldi et al.
450 Paste 2019, Cape Town, South Africa
Even though CAF grading curve for the coarse fraction (larger than 10 mm) is above the Fuller number of 1 (closer to 1.6), the strength and flowability could be restored by increasing the paste fraction to 5% passing 1 mm, which corresponds to a Fuller number of 0.9.
Acknowledgement
The authors thank Shanta Gold for their permission to publish this paper.
References
Cordova, M, Saw, H & Villaescusa, E 2016, ‘Laboratory testing of cemented rock fill for open stope support’, Proceedings of the Seventh International Conference & Exhibition on Mass Mining, The Australian Institute of Mining and Metallurgy, Melbourne, pp. 755–762.
Fuller, W & Thompson, S 1907, ‘The laws of proportioning concrete’, Transactions of the American Society of Civil Engineers, vol. 59, pp. 67–143.
Kuganathan K 2005, ‘Rock fill in mine fill’, in Y Potvin, E Thomas & A Fourie (eds.), Handbook on Mine Fill, Australian Centre for Geomechanics, Perth, pp. 101–115.
Sainsbury, DP & Sainsbury, BL 2014, ‘Design and implementation of cemented rockfill at the Ballarat Gold Project’, in Y Potvin and T Grice (eds), Proceedings of the 11th International Symposium on Mining with Backfill, Australian Centre for Geomechanics, Perth, pp. 205–216.
Saw, H & Villaescusa, E 2011, ‘Characterisation of cemented rock fill materials for the Cosmos nickel mine, Western Australia’, Proceedings International Conference on Advances in Construction Materials through Science and Engineering , pp. 907–914.