Embed Size (px)
Citation preview
Optimizing QSAR Models for Predicting LigandBinding to the Drug-Metabolizing CytochromeP450 Isoenzyme CYP2D6
Marilena Saraceno1,†, Ilaria Massarelli1,†,Marcello Imbriani2, Thomas L. James3
and Anna M. Bianucci4,5*
1Istituto Nazionale per la Scienza e Tecnologia dei Materiali, ViaGiusti 9, 50121 Firenze, Italy2Fondazione S. Maugeri, IRCCS, Via S. Maugeri 4, 27100 Pavia, Italy3Department of Pharmaceutical Chemistry, University of California,San Francisco, 600 16th Street, San Francisco, CA 94158-2517, USA4Dipartimento di Scienze Farmaceutiche, Universit� di Pisa, ViaBonanno 6, 56126 Pisa, Italy5International Centre for Studies and Research in Biomedicine (ICB),Luxembourg*Corresponding author: Anna M. Bianucci, [email protected]�M. Saraceno and I. Massarelli are equally contributed to this work
The cytochrome P450 isozyme CYP2D6 binds alarge variety of drugs, oxidizing many of them,and plays a crucial role in establishing in vivo druglevels, especially in multidrug regimens. The cur-rent study aimed to develop reliable predictivemodels for estimating the CYP2D6 inhibition prop-erties of drug candidates. Quantitative structure–activity relationship (QSAR) studies utilizing 51known CYP2D6 inhibitors were carried out.Performance achieved using models based on two-dimensional (2D) molecular descriptors was com-pared with performance using models entailingadditional molecular descriptors that depend uponthe three-dimensional (3D) structure of ligands. Toproperly compute the descriptors, all the 3D inhib-itor structures were optimized such that induced-fit binding of the ligand to the active site wasaccommodated. CODESSA software was used toobtain equations for correlating the structural fea-tures of the ligands to their pharmacologicaleffects on CYP2D6 (inhibition). The predictivepower of all the QSAR models obtained was esti-mated by applying rigorous statistical criteria. Toassess the robustness and predictability of themodels, predictions were carried out on an addi-tional set of known molecules (prediction set). Theresults showed that only models incorporating 3Ddescriptors in addition to 2D molecular descrip-tors possessed the requisite high predictive powerfor CYP2D6 inhibition.
Key words: AutoDock, CODESSA, CYP2D6, MOPAC, quantitativestructure–activity relationship
Received 7 July 2010, revised 15 February 2011 and accepted for publi-cation 1 April 2011
The various isozyme versions of cytochrome P450 (CYP450) carryout oxidative drug metabolism in vivo. One of them, CYP2D6, in par-ticular, metabolizes over 30% of the most common drugs such asantiarrhythmics, antidepressants, antipsychotics, beta-blockers, andanalgesics, although it constitutes only 2–4% of the total humanhepatic cytochrome P450 (1). In this incipient age of personal medi-cine, the polymorphic CYP2D6 is an important factor with approxi-mately 7% of the Caucasian population being poor metabolizersand a further 1% being ultrarapid metabolizers of CYP2D6 sub-strates (2). As the drugs that bind to CYP2D6 are variously sub-strates, inhibitors, or both, coadministration of drugs can lead tounanticipated levels, both high and low, for those drugs, leading tosome being ineffectual and others having an increased risk ofadverse drug reactions (3). Consequently, it is not surprising thatthose involved with pharmaceutical development have focused muchattention on cytochrome P450 – CYP2D6 especially. Failure toaccommodate CYP450 metabolism of drugs can be costly, so variousmodels have been developed to predict the metabolism of (putative)drugs (3).
A variety of approaches were used for developing predictive modelscapable of predicting the behavior of chemicals toward the inhibi-tion of the most important drug-metabolizing enzymes. Severaldescriptor-based statistical methods have been proposed as fast fil-ters in the initial steps of the discovery process to model inhibitiondata expressed categorically or quantitatively, in terms of IC50, orinhibition constants (Ki). Studies performed by other authors on pre-dictions of CYP2D6 inhibition are summarized below.
Strobl et al. used a CoMFA approach to evaluate the molecularcharacteristics associated with CYP2D6 inhibitory activity. Severalpharmacophore models were developed. The first model was builton the basis of 31 competitive inhibitors of bufuralol 1¢-hydroxyl-ation. The initial pharmacophore was constructed with 6 strong(Ki < 7 lM) inhibitors using ajmalicine as the template, and themodel was then refined with additional compounds (4). The sameset of compounds was used to generate the first quantitative struc-ture–activity relationship (QSAR) model by Catalyst. The model wasable to fit Ki values with R = 0.91 and predicted Ki for 9 of 15 testcompounds within the 1.0 log unit residual. A QSAR model wasgenerated using molecular surface-weighted holistic invariant molec-ular (MS-WHIM) descriptors, by PLS analysis. The cross-validated q2
236
Chem Biol Drug Des 2011; 78: 236–251
Research Article
ª 2011 John Wiley & Sons A/S
doi: 10.1111/j.1747-0285.2011.01137.x
was 0.51, thus indicating that the model was statistically valid, butpredictions for the test compounds were not reported (5).
Recursive partitioning (RP) has been proposed for identifying inhibi-tors of human CYP2D6 on the basis of the published Ki of a set of100 compounds with diverse structures. Different descriptor familieswere calculated for all compounds (Cerius2 topological, electrotopo-logical, and physicochemical parameters, fragment keys and 1D sim-ilarity scores), and a filtered pool was obtained using a MonteCarlo annealing algorithm designed to produce a 25-variable linearleast-squares fit of a categorical inhibition variable. The approachwas able to capture 48 ⁄ 59 (81%) of the inhibitors and 27 ⁄ 41 (66%)of the non-inhibitors, with an overall accuracy of 75% (6).
RP was also used for the generation of virtual filters to inhibitCYP2D6 and CYP3A4 (7). The percentage inhibition data for the twoenzymes (1759 and 1756 compounds, respectively) were used forgenerating 20 random tree models. These models were applied toan external data set of 98 molecules and were able to generate astatistically significant rank ordering of the inhibition data. O'Brienand de Groot used NN and Bayesian approaches to model CYP2D6inhibition data of 600 compounds (106 positive and 494 negative).NN approaches were applied using Cerius2, on E-state keys andBarnard 4096-bit fingerprints. A Bayesian-based model was devel-oped (8).
To model CYP2D6 competitive inhibition, a quantitative GRIND-based model was developed using the Ki values of 47 compoundsreported in the literature (9). The inhibition constants of 17 knowndrugs and 33 proprietary compounds, representing two independenttest sets, were used to validate the model: approximately 74% ofthe external set was predicted with a Ki error < 1 log unit. In termsof protein-based approaches, the combined use of homology model-ing and molecular docking was used to define the correct position-ing of substrates in the CYP2D6 active site.
A comparative molecular similarity indices analysis (CoMSiA), per-formed using a docking-based alignment, resulted in a good predic-tive model (q2 approximately 0.6) and provided strategies to reduceCYP2D6 inhibition for aryloxypropanolamine derivatives (10). Anotherstudy explored the use of different statistical learning methods forpredicting inhibitors. Two consensus support vector machine meth-ods were used, where the accuracies for classification of substratesand non-substrates of CYP2D6 were 90.9% (11). A series ofdescriptor sets directly calculable from the constitution of drugswas systematically investigated in terms of their power to classifya compound into the CYP isoform that metabolizes it. Variousmodel-building methods, such as a multinormal logistic regression,a decision tree, or support vector machine, were used. The bestmodel has a leave-one-out (LOO) cross-validated predictivity of 89%and gives 83% correct predictions for the external validation dataset (12).
Yamashita et al.(13) presented an innovative data mining methodfor the multiobjective optimization of chemical properties, whichconsists of the hierarchical classification and visualization of multi-dimensional data. In (14), a training set of 747 chemicals primarilybased on in vivo human data for the CYP isoenzyme 2D6 was col-
lected from the literature. QSAR models focusing on substrate ⁄ non-substrate activity were constructed using MultiCASE, Leadscope,and MDL quantitative structure–activity relationship (QSAR) model-ing systems. The authors cross-validated (leave-groups-out) withconcordances of 71%, 81%, and 82%, respectively (14).
We have previously demonstrated that accounting for induced-fitconformational changes in the protein is quite valuable in moleculardocking of ligands, yielding improved fits to experimental bindingfree energies (15). The current study continues our quest to developa good, reliable model – specifically, QSAR model – that willenable prediction of binding to CYP2D6 upon computational screen-ing of compounds in large databases with the express purpose ofdiscovering New Chemical Entities and their further development.Taking into account both ligand properties and the known structuresof enzyme isoforms, we compare the predictive power of QSARmodels obtained by only using two-dimensional (2D) descriptorswith models obtained using both 2D and three-dimensional (3D)molecular descriptors. For screening a huge database of compounds,there is clearly a trade-off in the accuracy of prediction versus com-putational time expended.
All 51 compounds included in the initial data set, comprised ofCYP2D6 inhibitors available in the open literature, were groupedinto seven subclasses on the basis of their structural similarity. Apreliminary optimization of the active site of the enzyme was per-formed in the presence of each of the seven compounds selectedas being the most representative (parent compound) of their sub-class. It enabled us to exploit seven optimized models of CYP2D6on the basis of the structural features of the chemically differentligands. To find plausible conformations of the ligands, they wereall docked to appropriate models of the active binding site suchthat the induced fit we previously exhibited for CYP2D6 bindingcould occur (15). This procedure was expected to provide conforma-tions quite close to the biologically active ones. The next step con-sisted of computing a large number of molecular descriptors,including descriptors requiring quantum-chemical calculations. Sev-eral QSAR experiments, based on the use of 2D and 3D moleculardescriptors, were then performed to optimize the search for rela-tionships between molecular structures and IC50 inhibition values.The resulting QSAR models based only on 2D molecular descriptorswere unsatisfactory, but the quality of the models involving 3Ddescriptors, obtained on the basis of optimized conformations ofthe ligands, was of a very high quality.
Methods
Database collectionThe data set used for the QSAR studies consisted of 51 structurallydiverse CYP2D6 inhibitors, belonging to several different pharma-ceutical classes, for which the IC50 inhibition values were availablein the literature (16–26).
To avoid large biases for the bioactivity because of differentexperimental methods and reagents, we selected only moleculestested using human liver microsomes with dextromethorphan as aspecific CYP2D6 probe. The use of such a specific set of biological
Optimizing QSAR Models for Predicting Ligand Binding
Chem Biol Drug Des 2011; 78: 236–251 237
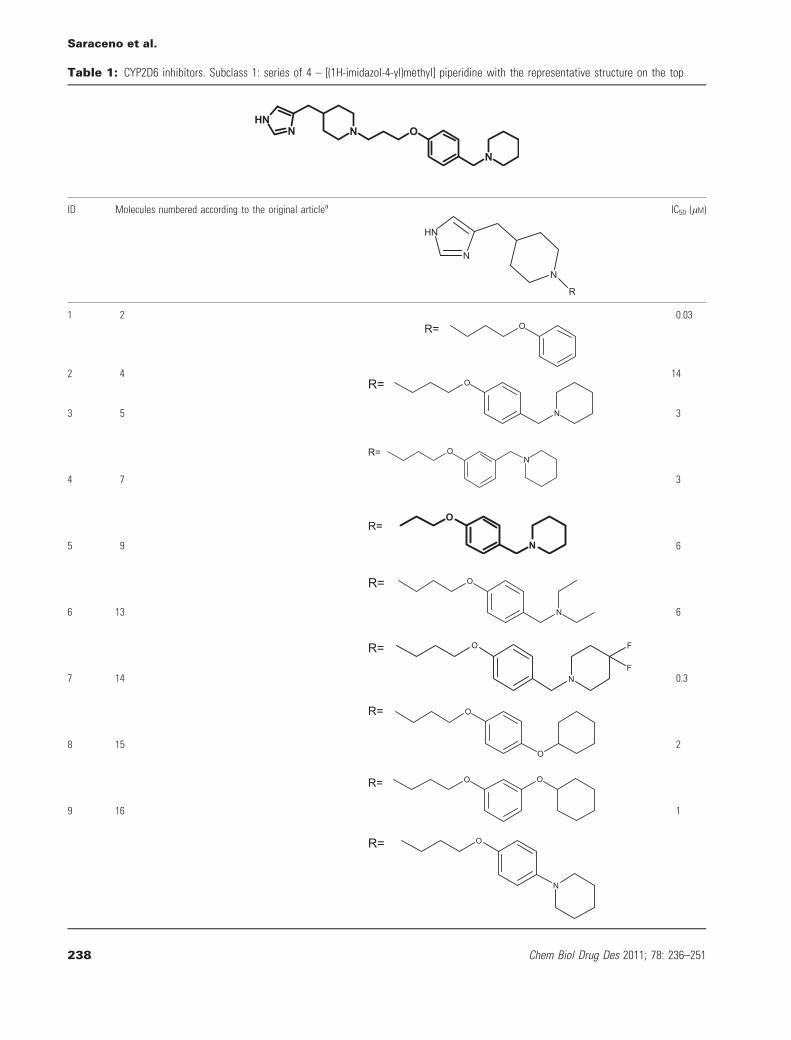
Table 1: CYP2D6 inhibitors. Subclass 1: series of 4 – [(1H-imidazol-4-yl)methyl] piperidine with the representative structure on the top
O
N
NNH
N
ID Molecules numbered according to the original articlea
N
HN
N
R
IC50 (lM)
1 2OR=
0.03
2 4O
N
R=14
3 5
ON
R=
3
4 7
O
N
R=
3
5 9
O
N
R=
6
6 13
O
N
F
F
R=
6
7 14
O
O
R=
0.3
8 15
O OR=
2
9 16
O
N
R=
1
Saraceno et al.
238 Chem Biol Drug Des 2011; 78: 236–251
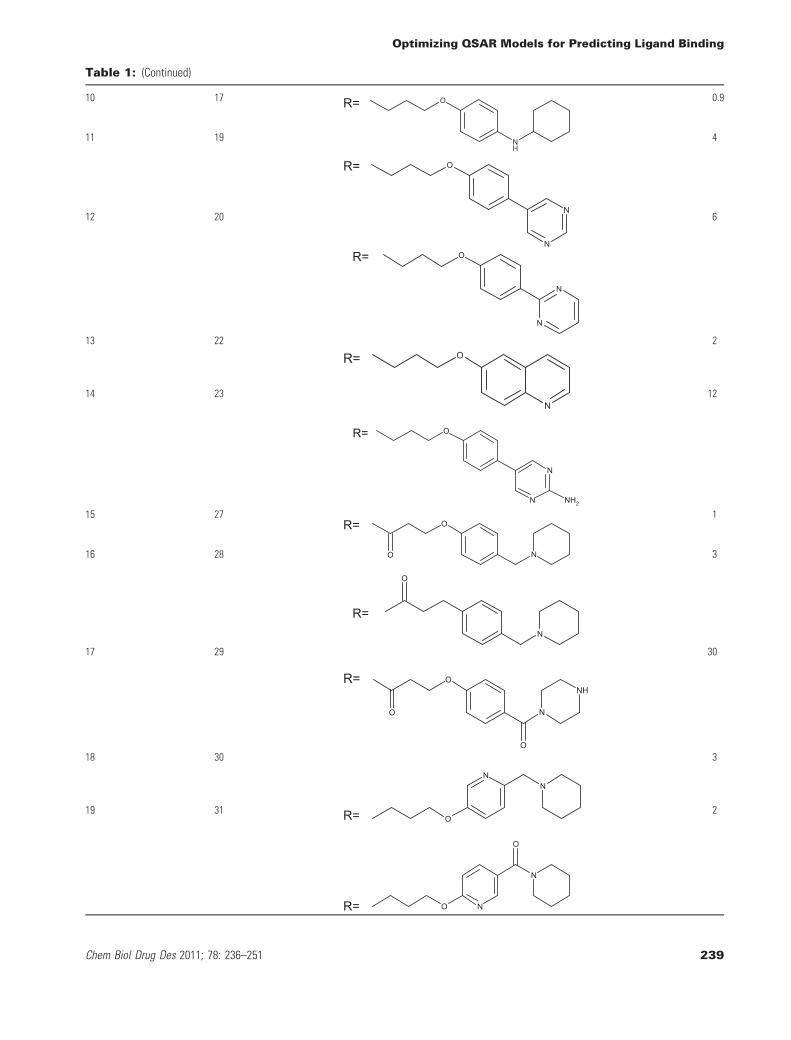
Table 1: (Continued)
10 17 O
NH
R= 0.9
11 19
O
N
N
R=
4
12 20
O
N
N
R=
6
13 22O
N
R=2
14 23
O
N
N
NH2
R=
12
15 27O
O N
R=1
16 28
N
O
R=
3
17 29
O
O
O
N
NHR=
30
18 30
O
NN
R=
3
19 31
O N
N
O
R=
2
Optimizing QSAR Models for Predicting Ligand Binding
Chem Biol Drug Des 2011; 78: 236–251 239
data was inspired by Principle 1 (a defined endpoint) of OECD(Organization for Economic Co-operation and Development) (27),i.e., a (Q)SAR study should be associated with a defined endpoint.We note that an endpoint refers to any physicochemical, biologi-cal, or environmental effect that can be measured and thereforemodeled. The aim is to ensure transparency in the endpoint beingpredicted by a given model, such that the defined endpoint can bedetermined using different experimental protocols and under differ-ent experimental conditions. Ideally, (Q)SARs should be developedfrom homogeneous data sets in which the experimental data havebeen generated using a single protocol. However, this is rarelyfeasible in practice, and data produced by different protocols areoften combined. For practical purposes, biological indicator valueswere transformed to the (minus) log function (pIC50). Molecular
structures of all 51 compounds are shown in Tables 1–7 togetherwith their IC50 values. Compounds were grouped into seven sub-classes, as reported in Tables 1–7, on the basis of their structuralsimilarity, with structurally representative molecules of each sub-class (parent compound shown at the top of each Table) identifiedfor use in seven different optimization processes of the enzyme-binding site.
Molecular dockingThe same docking protocol was employed as described in a previ-ous study (15) used to obtain CYP2D6 structural models incorporat-ing induced-fit conformational adjustments of the apoenzyme crystalstructure of CYP2D6 for ajmalicine- and quinidine-like inhibitors,
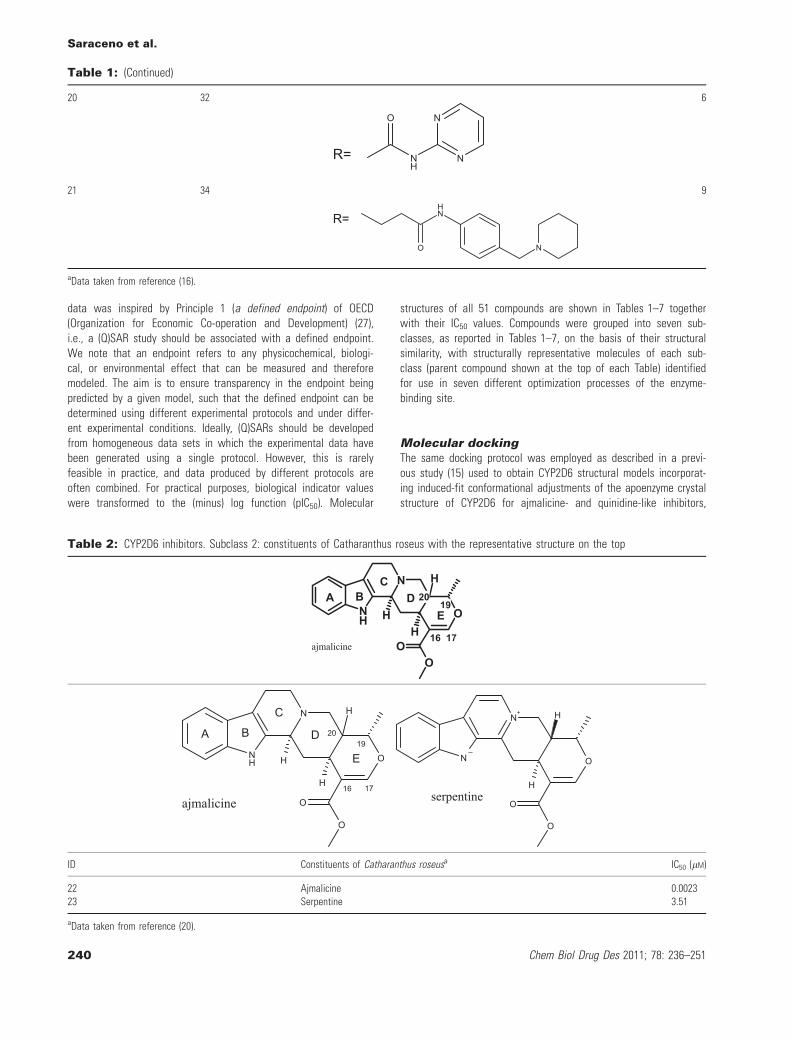
Table 1: (Continued)
20 32
NH
O
N
N
R=
6
21 34
O
NH
N
R=
9
aData taken from reference (16).
Table 2: CYP2D6 inhibitors. Subclass 2: constituents of Catharanthus roseus with the representative structure on the top
O
N
NH H
H
H
OO
2019
ajmalicine16 17
A BC
DE
O
N
NH H
H
H
O
O
2019
ajmalicine16 17
A B
C
D
E O
N+
N
H
H
O
O
serpentine
ID Constituents of Catharanthus roseusa IC50 (lM)
22 Ajmalicine 0.002323 Serpentine 3.51
aData taken from reference (20).
Saraceno et al.
240 Chem Biol Drug Des 2011; 78: 236–251
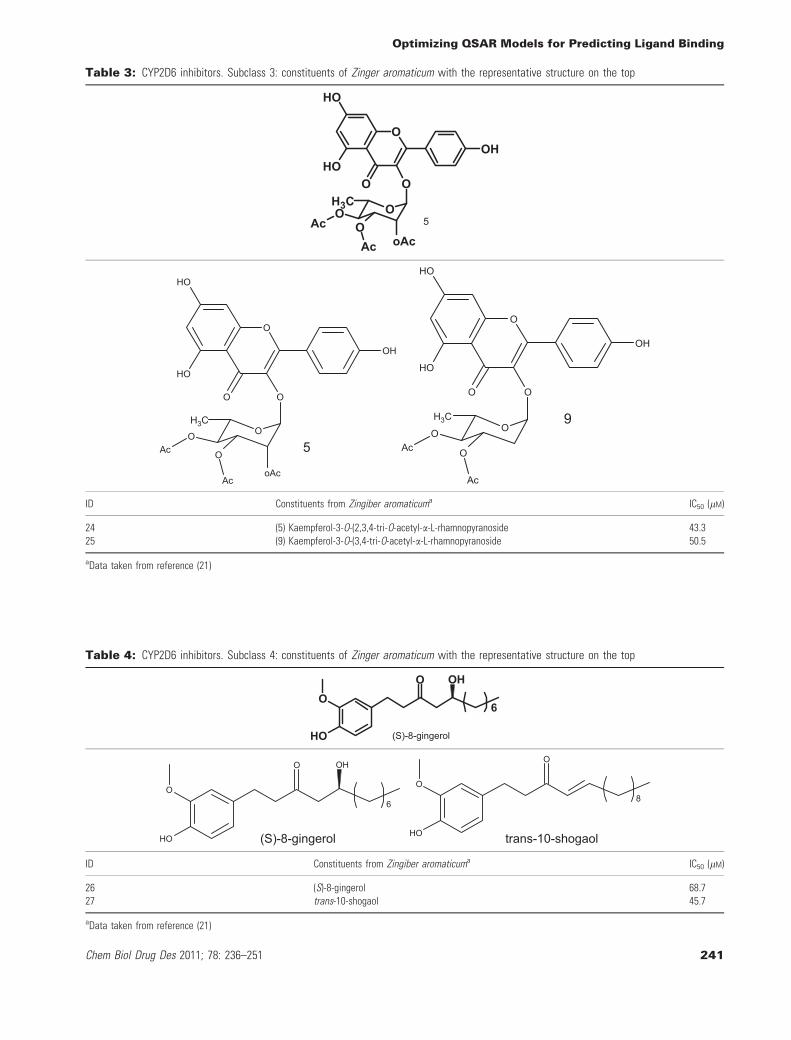
Table 3: CYP2D6 inhibitors. Subclass 3: constituents of Zinger aromaticum with the representative structure on the top
O
oAc
H3CO
O
OHO
HO
OH
OOAc
Ac 5
O
oAc
O
O
O
HO
HO
OH
O
O
Ac
Ac 5O
H3C
O
O
O
HO
HO
OH
O
O
Ac
Ac
9H3C
ID Constituents from Zingiber aromaticuma IC50 (lM)
24 (5) Kaempferol-3-O-(2,3,4-tri-O-acetyl-a-L-rhamnopyranoside 43.325 (9) Kaempferol-3-O-(3,4-tri-O-acetyl-a-L-rhamnopyranoside 50.5
aData taken from reference (21)
Table 4: CYP2D6 inhibitors. Subclass 4: constituents of Zinger aromaticum with the representative structure on the top
HO
O OH
6O
(S)-8-gingerol
HO
O OH
6O
(S)-8-gingerol HO
O
8O
trans-10-shogaol
ID Constituents from Zingiber aromaticuma IC50 (lM)
26 (S)-8-gingerol 68.727 trans-10-shogaol 45.7
aData taken from reference (21)
Optimizing QSAR Models for Predicting Ligand Binding
Chem Biol Drug Des 2011; 78: 236–251 241
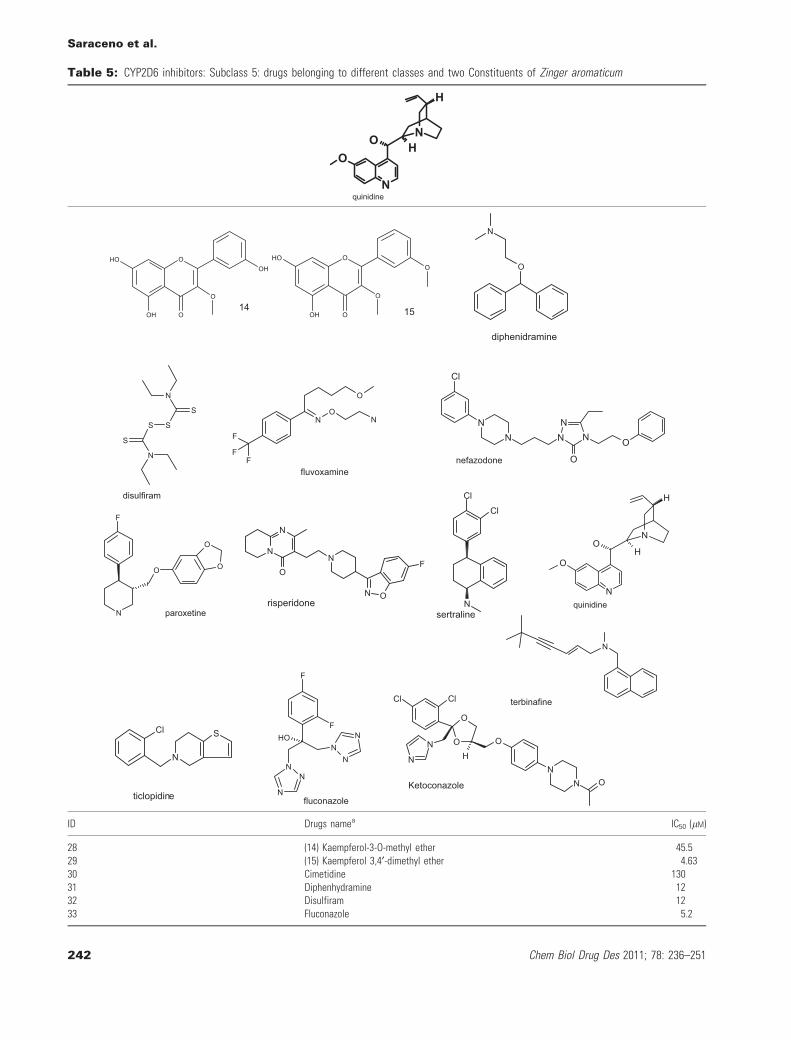
Table 5: CYP2D6 inhibitors: Subclass 5: drugs belonging to different classes and two Constituents of Zinger aromaticum
N
OO
NH
H
quinidine
O
OOH
HO
O
OH
14
O
OOH
HO
O
O
15
O
N
diphenidramine
N
S
S
S
N
S
disulfiram
NO
F
FF
O
N
fluvoxamine
NN
N
O
ONN
Cl
nefazodone
O
N
F
O
O
paroxetineN
Cl
Cl
sertraline
N O
NF
N
O
N
risperidone
F
FOH
N
NN
N
N
N
fluconazole
ClCl
O
O
N
N H
O
NN OKetoconazole
N
terbinafine
S
N
Cl
ticlopidine
N
O
O
N
H
H
quinidine
ID Drugs namea IC50 (lM)
28 (14) Kaempferol-3-O-methyl ether 45.529 (15) Kaempferol 3,4¢-dimethyl ether 4.6330 Cimetidine 13031 Diphenhydramine 1232 Disulfiram 1233 Fluconazole 5.2
Saraceno et al.
242 Chem Biol Drug Des 2011; 78: 236–251
CYPa and CYPq, respectively. All the ligands belonging to each ofthe previously mentioned subclasses were then docked, using themolecular docking program AutoDock 3.5a (28) to the appropriateoptimized active site of the enzyme to obtain a highly plausibleligand conformation.
MOPAC and CODESSA calculationsSeveral QSAR models were obtained using the CODESSA software(COmprehensive Descriptors for Structural and Statistical Analysis)(29). This program can calculate and handle a large number (>450)of molecular descriptors classified as: constitutional, topological,geometrical, electrostatic, quantum-chemical, and thermodynamic. Italso enables various statistical structure–property correlation tech-niques to be used for data analysis, all of which are based on clas-sical mathematical equations (Hansch-like approach). Based onaccurate optimization of the ligand 3D structures, quantum-chemicaland thermodynamic descriptors were computed to augment thedescriptors most commonly considered (constitutional, topological,and electrostatic). For these calculations, the quantum-chemicalMOPAC package, enabling semi-empirical quantum-mechanics calcu-lations, was exploited. The AM1 Hamiltonian was selected as the
most suitable for treating the ligands of interest (30) during single-point calculations.
Statistical analysisIdeally, all molecular descriptors used for developing a QSAR modelshould supply an 'orthogonal' set of variables. This objective cannotbe fully met when handling real systems, but it has to be achievedas much as possible, in relation to many other requirements(related to the content of information) that need to be fulfilledwhen selecting optimal descriptors for the development of a QSARmodel.
The amount of correlation among the descriptors used in this workwas checked out by computing their pairwise correlations and thevariance inflation factors (VIF). The VIF values, defined as (1)R2))1,were calculated to identify whether there were excessively highmulticollinear coefficients among the descriptors; a VIF greater than10 can be considered to be indicative of multicollinearity.
The models obtained in this work were validated by leave-one-outcross-validation (LOO-CV) and by training ⁄ test-set partitioning. In
Table 5: (Continued)
34 Fluvoxamine 1135 Ketoconazole 0.3236 Nefazodone 25037 Paroxetine 1.838 Quinidine 17039 Risperidone 2840 Sertraline 0.05841 Terbinafine 0.04142 Ticlopidine 4
aData taken from reference (21, 17, 19, 20).
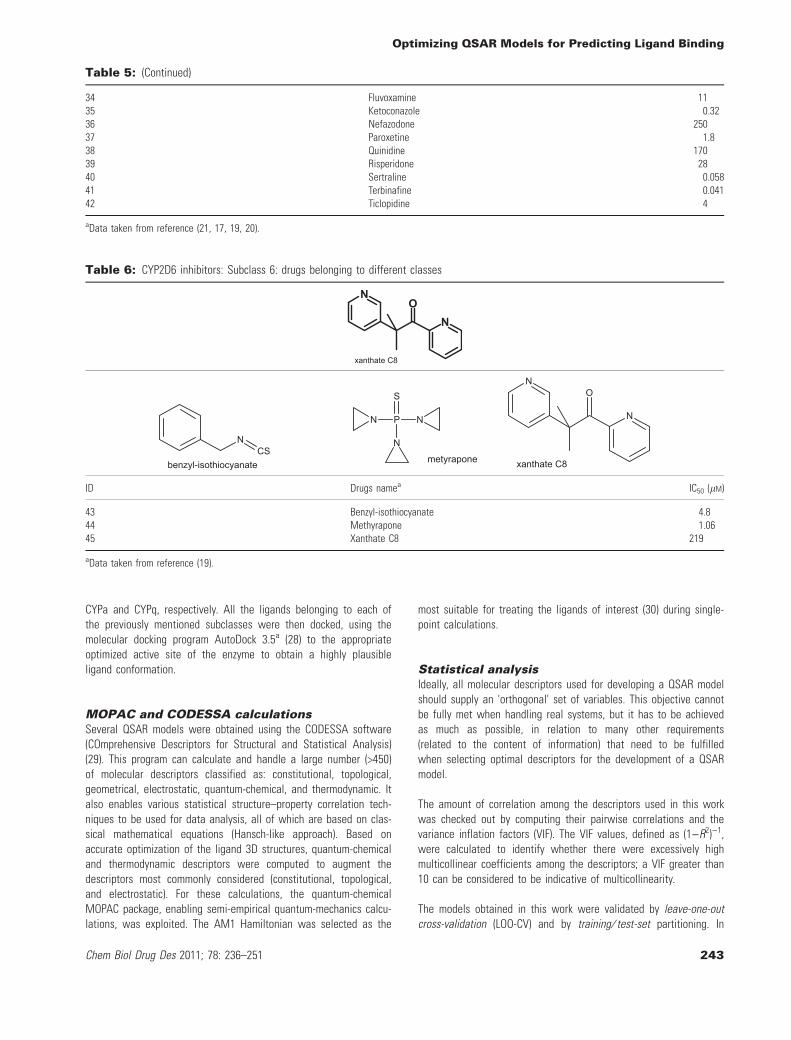
Table 6: CYP2D6 inhibitors: Subclass 6: drugs belonging to different classes
NO
N
xanthate C8
NCS
benzyl-isothiocyanate
P
S
N
N N
metyrapone
NO
N
xanthate C8
ID Drugs namea IC50 (lM)
43 Benzyl-isothiocyanate 4.844 Methyrapone 1.0645 Xanthate C8 219
aData taken from reference (19).
Optimizing QSAR Models for Predicting Ligand Binding
Chem Biol Drug Des 2011; 78: 236–251 243
addition to a high q2 value (obtained as the average correlationcoefficients from the LOO-CV), a reliable model should also be char-acterized by a high correlation coefficient (R2) between the pre-dicted and observed activities over the test set (20). Other relevantstatistical parameters, which are highly diagnostic for a model vali-dation, must fulfill further conditions. The ensemble of criteria usedfor validating the models described here may be summarized as fol-lows: (a) q2 > 0.5 and R2 > 0.6, over the training set; R2 > 0.6,0.85 £ k £ 1.15, and (R2)R0
2) ⁄ R2 < 0.1 over the test set, where kis the slope of the regression line (between the calculated versusexperimental target property values), and R0
2 refers to the regres-sion line forced through the origin (31). To avoid over-fitting, a fur-ther condition, suggested by OECD, was considered: R2 ) q2 < 0.3(27).
In addition, the y-scrambling (or response permutation) test wasused to check the robustness of the QSAR model. Such a testenables models to be identified based on chance correlation, i.e.,
models where the independent variables are randomly correlated tothe response variables. Y-scrambling is performed by randomly mod-ifying the sequence of the response vector y, i.e., by assigning eachcompound with a response randomly selected from the true set ofresponses. If the original model has no chance correlation, there isa significant difference in the quality of the original model and thatobtained with random responses. This procedure enables us to esti-mate the quality of the model by using the statistical parameterscurrently exploited such as R2 or, better, q2.
Results and Discussion
QSAR models obtained using onlyconstitutional, topological, and electrostaticdescriptors (2D-type molecular features)The QSAR models developed in this part of the study are based ontopological, constitutional, and electrostatic descriptors, which only
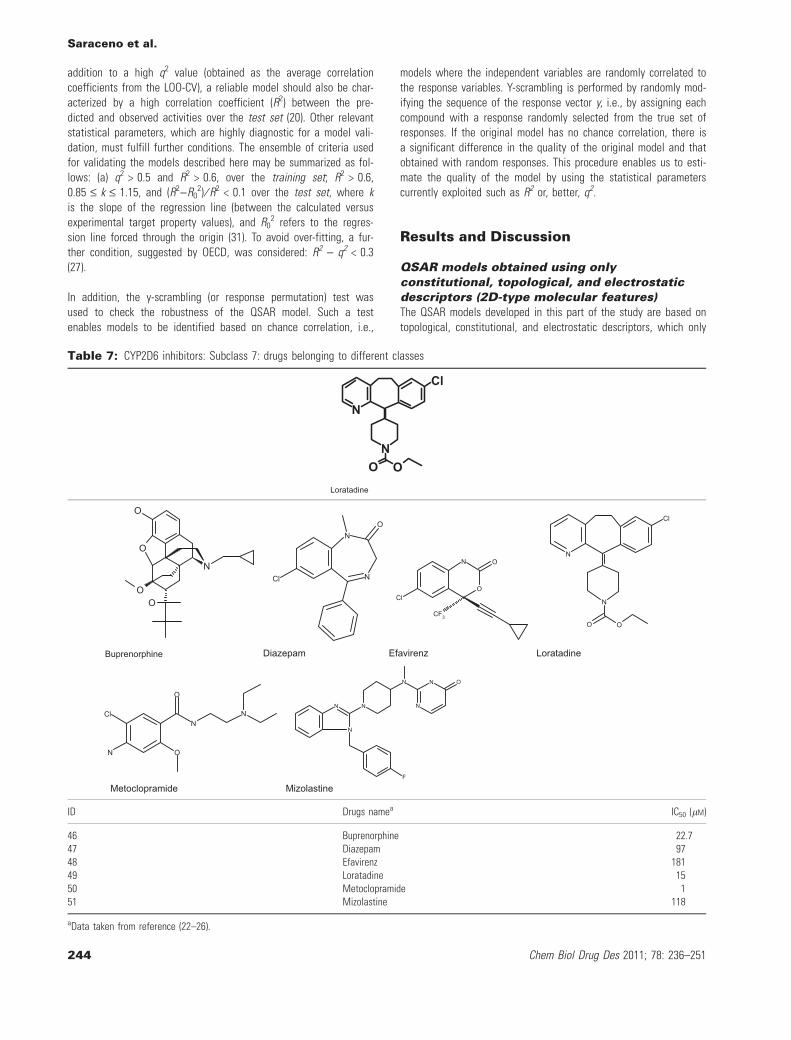
Table 7: CYP2D6 inhibitors: Subclass 7: drugs belonging to different classes
N
N
Cl
OO
Loratadine
O
N
O
O
O
Buprenorphine
N
N
Cl
O
Diazepam
O
N O
Cl
CF3
Efavirenz
N
N
Cl
OO
Loratadine
NN
O
ON
Cl
Metoclopramide
N
N
N
N
N O
F
Mizolastine
N
ID Drugs namea IC50 (lM)
46 Buprenorphine 22.747 Diazepam 9748 Efavirenz 18149 Loratadine 1550 Metoclopramide 151 Mizolastine 118
aData taken from reference (22–26).
Saraceno et al.
244 Chem Biol Drug Des 2011; 78: 236–251
depend upon 2D-type structural features. As already mentioned, theso-called electrostatic descriptors involved in these calculationswere only computed using approximate empirical formulas, withoutinvolving any quantum-chemical treatment.
The target property values for all 51 molecules refer to biologicaldata acquired with human liver microsomes using dextromethorphanas a specific CYP2D6 probe. The entire available data set was splitinto different training ⁄ test sets pairs using an algorithm derivedfrom the Direct Sphere-Exclusion algorithm (32), implemented in ourlaboratory (33).
The idea behind this algorithm is to select for the TR set moleculeswhose similarities (computed through molecular descriptors andexploited to quantify molecular similarity through Euclidean dis-tances), with respect to each other, are not higher than a prede-fined threshold. Each molecule gives rise to a hyper-sphere arounditself, so that any candidate molecules inside the sphere areexcluded from the selection in the TR set and driven toward the TSset. This procedure ensures that the sampling within the two sub-sets (TR and TS) is optimized within the limits of the amount ofinformation contained in the selected molecular descriptors.
Different combinations of training ⁄ test sets were considered in thedevelopment of the 2D-descriptor-based models. The results showedthat, in terms of a preliminary analysis performed through heuristicmethods available in CODESSA, the models obtained still did notsatisfy the validation criteria adopted: R2 > 0.6 and q2 > 0.5. Statis-tical analysis results are reported in Table 8. The best model is theone labeled as Tr40 ⁄ Ts11, which is characterized by a good R2
value. However, it has a low q2 value, which indicates a low pre-dictive ability and poor robustness. Indeed, a high q2 value is thenecessary condition for a model to have good predictive power.
QSAR models obtained using all the availableCODESSA descriptors, including 3D-typestructural featuresThe same ligands were considered for building more accurate QSARmodels based on the use of constitutional, topological, geometricalelectrostatic, quantum-chemical, and thermodynamic descriptors,many of which do depend upon the three-dimensional arrangementof the ligands themselves.
Optimal 3D structures of the ligands were obtained through molecu-lar docking calculations, performed for each molecule within theP450 binding site, which had been previously fitted with the parentcompound. The best-scoring conformer of each inhibitor was sub-jected to quantum-chemical and thermodynamic calculations via theMOPAC program. The structures were loaded into CODESSA, and acomplete set of computable molecular descriptors was obtained.The data set was split into different training ⁄ test sets using thesame DISE-derived algorithm mentioned above. Good multi-parame-ter correlations were found using the heuristic method implementedin CODESSA. Several very reliable models were then selectedaccording to the validation criteria previously described. The twobest performing models, labeled here as Tr45 ⁄ Ts6 and Tr44 ⁄ Ts7,gave the statistical parameters reported in Table 9 together withthe regression equations.
The first model is characterized by a training set of 45 moleculesand a test of 6 molecules. The test set comprises molecules labeledas: 3, 5, 8, 10, 16, 18. The second model has a training set of 44molecules and a test of seven molecules, where the test set com-prises molecules labeled as: 4, 8, 10, 12, 16, 18.
The equation corresponding to the Tr45 ⁄ Ts6 model is based onten parameters and nine descriptors. The descriptors involved inthe equation can be grouped as follows: (i) one constitutional (rel-ative number of triple bonds, labeled as D8); (ii) seven quantum-chemical (HA-dependent HDSA-2 [Quantum-Chemical PC], labeledas D1; FNSA-1 Fractional PNSA (PNSA-1 ⁄ TMSA) [Zefirov's PC],labeled as D2, where FNSA = fractional negative surface area;PNSA = partial negative surface area and TMSA = total molecularsurface area; Avg 1-electron react. index for a C atom, labeled asD4, where Avg = average and react. = reaction; Min coulombicinteraction for a C-H bond, labeled as D5, where the coulombicinteraction is the energy between two given atomic species inthe molecule; Tot molecular electrostatic interaction ⁄ no. of atoms,labeled as D6; Image of the Born solvation energy, labeled as D7;HOMO–LUMO energy gap, labeled as D9); (iii) one thermodynamic(lowest normal mode vibrational frequency, labeled as D3).Table 10 shows the best parameter correlations for the Tr45 ⁄ Ts6model.
With regard to the estimate of correlation among descriptors, thepairwise correlations (see Table S1 in the Supporting information)show that the descriptors are not inter-correlated as all the calcu-lated values are below 0.6. The VIF values for each descriptor ofthe Tr45 ⁄ Ts6 model are reported in Table 10. They appear to belargely <10, which enabled us to rule out the risk of multicollin-earity.
Table 11 shows Experimental and Predicted values for TR and TSset (in bold) molecules obtained using the Tr45 ⁄ Ts6 model. Theaverage |Error| of prediction on TR and TS sets is 0.39 and 0.36,respectively. These two values are very similar and even higher inthe TR set than in the TS set; thus, the risk of any overfitting onTR data is highly improbable. For TR set molecules, the |Error| val-ues span from 0.00 (molecule 39) to 1.41 (molecule 28). For TS setmolecules, the |Error| values span from 0.00 (molecule 3) to 0.33(molecule 16).
Table 8: Preliminary statistical parameters related to the valida-tion of quantitative structure–activity relationship models obtainedusing only 2D-type molecular descriptors
Models
Training data
R2 q2
Tr46 ⁄ Ts5COD1 0.55 0.32Tr45 ⁄ Ts6COD2 0.56 0.32Tr44 ⁄ Ts7COD3 0.55 0.35Tr43 ⁄ Ts8COD4 0.56 0.35Tr42 ⁄ Ts9COD5 0.57 0.31Tr41 ⁄ Ts10COD6 0.57 0.30Tr40 ⁄ Ts11COD6 0.6 0.34
Optimizing QSAR Models for Predicting Ligand Binding
Chem Biol Drug Des 2011; 78: 236–251 245
The results of the y-scrambling test for the Tr45 ⁄ Ts6 model arereported in Table S2 in the Supporting information. The R2 and q2
average values obtained for 50 permuted TR sets (0.22, 0.04respectively) show that 'permuted' models are of a very poor qualitycompared to the original model (0.75 and 0.57, respectively).
The equation corresponding to the Tr44 ⁄ Ts7 model is based on nineparameters and eight descriptors; the descriptors involved in theequation can be grouped as follows: (i) one constitutional (relativenumber of triple bonds, labeled as D8); (ii) six quantum-chemicalseven quantum-chemical [HA-dependent HDSA-2 (Quantum-ChemicalPC), labeled as D1; FNSA-1 Fractional PNSA (PNSA-1 ⁄ TMSA) (Zefi-rov's PC), labeled as D2 where FNSA = fractional negative surfacearea; PNSA = partial negative surface area and TMSA = totalmolecular surface area; Avg 1-electron react. index for a C atom,labeled as D4; Min coulombic interaction for a C-H bond, labeled asD5, where the coulombic interaction is the energy between giventwo atomic species in the molecule; Tot molecular 2-center reso-nance energy ⁄ # of atoms, D6; HOMO energy (compare this withwhat is in table), labeled as D7]; (iii) one thermodynamic (Lowestnormal mode vib frequency, labeled as D3). Table 12 shows the bestparameter correlations for the Tr44 ⁄ Ts7 model.
With regard to the estimate of correlation among descriptors, thepairwise correlations (see Table S3 in the Supporting Information)show that the descriptors are not inter-correlated; in fact, all thecalculated values are below 0.6. The VIF values referring to theTr44 ⁄ Ts7 model are reported in Table 12. Most appear to be <10,which enabled us to rule out the risk of multicollinearity.
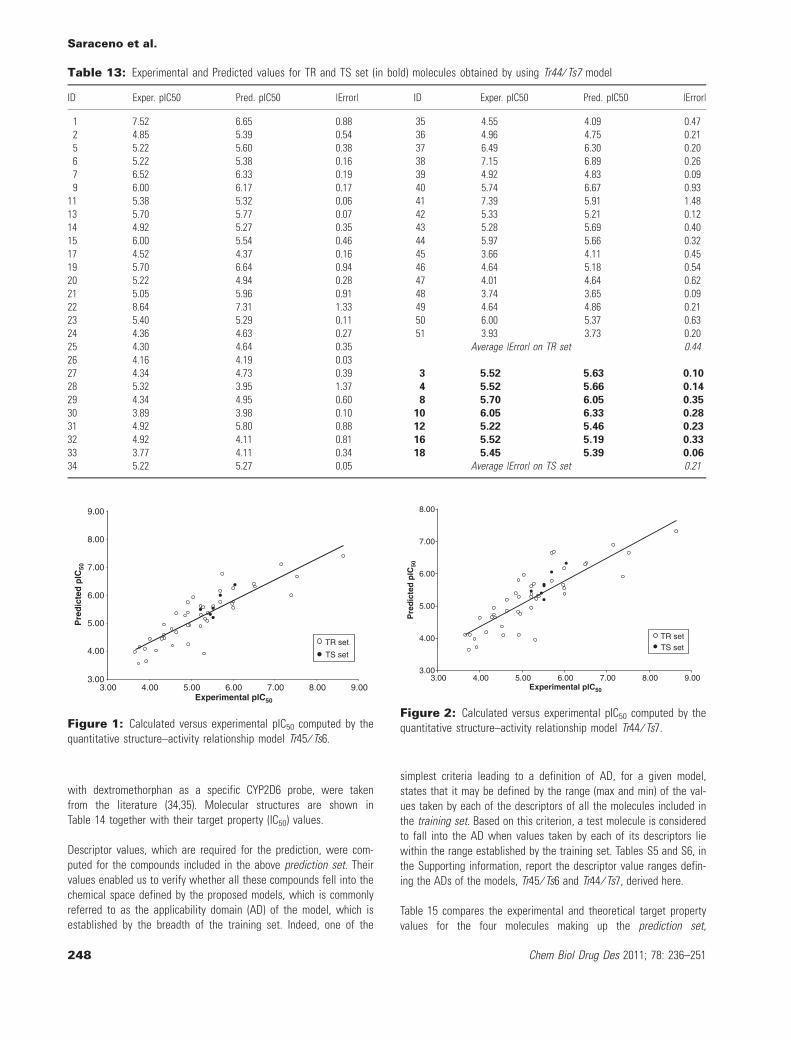
Table 13 reports Experimental and Predicted values for TR and TSset (in bold) molecules obtained using the Tr44 ⁄ Ts7 model. Theaverage |Error| of prediction on TR and TS sets is 0.44 and 0.21,respectively. These two values are very similar and even higher inthe TR set than the TS set; thus, the risk of overfitting on TR datais highly improbable. For TR set molecules, the |Error| values spanfrom 0.03 (molecule 26) to 1.48 (molecule 41). For TS set molecules,the |Error| values span from 0.06 (molecule 18) to 0.35 (molecule 8).
The results of the y-scrambling for the Tr44 ⁄ Ts7 model are reportedin Table S4 in the Supporting Information. The R2 and q2 averagevalues obtained for 50 permuted TR sets (0.19 and 0.04, respec-tively) show that 'permuted' models are of a very poor quality com-pared to the original model (0.71 and 0.51, respectively).
Figures 1 and 2 show plots of calculated versus experimental pIC50
values for the models Tr45 ⁄ Ts6 and Tr44 ⁄ Ts7 for training and testsets.
Attempts at associating a physical meaning with each descriptor,identified through the correlations with molecular structures, areexpected to give a deeper insight into factors that are likely to gov-ern the inhibitory activity of CYP2D6 inhibitors. It is also worthrecalling that the value of the descriptor coefficient does not enabletheir relevance in the QSAR equation to be estimated, as theirabsolute numerical values have not been scaled with respect toeach other, i.e., the descriptors are not normalized. Thus, t-Test val-ues for each descriptor were reported to give an idea of the rele-vance of individual descriptor. According to the t-Test values, the
Table 9: Statistical parameters related to the validation of the best quantitative structure–activity relationship equations, obtained usingboth 2D and 3D molecular descriptors. The relevant regression equations are also shown (Di: molecular descriptor: see details in Table 7)
Models
Training data Test data
R2 q2 R2)q2 R2 R02 [(R2 )R0
2) ⁄ R2 k
Tr45 ⁄ Ts6 0.75 0.57 0.18 0.68 0.64 0.06 1.01Tr44 ⁄ Ts7 0.71 0.51 0.2 0.68 0.65 0.04 1.02Models Equation
Tr45 ⁄ Ts6 pIC50 = 22.05)0.04D1)5.85D2 + 0.05D3)2703D4)5.71D5 + 0.7D6)1.4D7)39.73D8)0.17D9
Tr44 ⁄ Ts7 pIC50 = 23.74)0.05D1)6.64D2 + 0.05D3)2525D4)6.68D5)0.4D6 + 0.13D7)32.09D8
Table 10: Details on the best nine-parameter correlation for quantitative structure–activity relationship model Tr45 ⁄ Ts6
N0 Xa €DXa t-Test VIF Descriptors
0 2.2052e+01 4.0348e+00 5.4656 – InterceptD1 )4.3134e)02 1.4994e)02 )2.8767 3.25 HA-dependent HDSA-2 [Quantum-Chemical PC]D2 )5.8480e+00 1.3261e+00 )4.4098 2.58 FNSA-1 Fractional PNSA (PNSA-1 ⁄ TMSA) [Zefirov's PC]D3 5.1780e)02 8.9007e)03 5.8175 2.04 Lowest normal mode vib frequencyD4 )2.7039e+03 5.3974e+02 )5.0097 2.34 Avg 1-electron react. index for a C atomD5 )5.7128e+00 1.4191e+00 )4.0256 2.74 Min coulombic interaction for a C-H bondD6 6.6918e)01 2.9753e)01 2.2491 3.51 Tot molecular electrostatic interaction ⁄ no. of atomsD7 )1.3964e+00 4.3305e)01 )3.2246 3.09 Image of the Born solvation energyD8 )3.9731e+01 1.6458e+01 )2.4141 3.44 Relative number of triple bondsD9 )1.7485e)01 8.0851e)02 )2.1626 3.54 HOMO–LUMO energy gap
FNSA, fractional negative surface area; PNSA, partial negative surface area; TMSA, total molecular surface area.aX is the weighting coefficient, which is used in the regression equation shown in Table 6; DX is error.
Saraceno et al.
246 Chem Biol Drug Des 2011; 78: 236–251
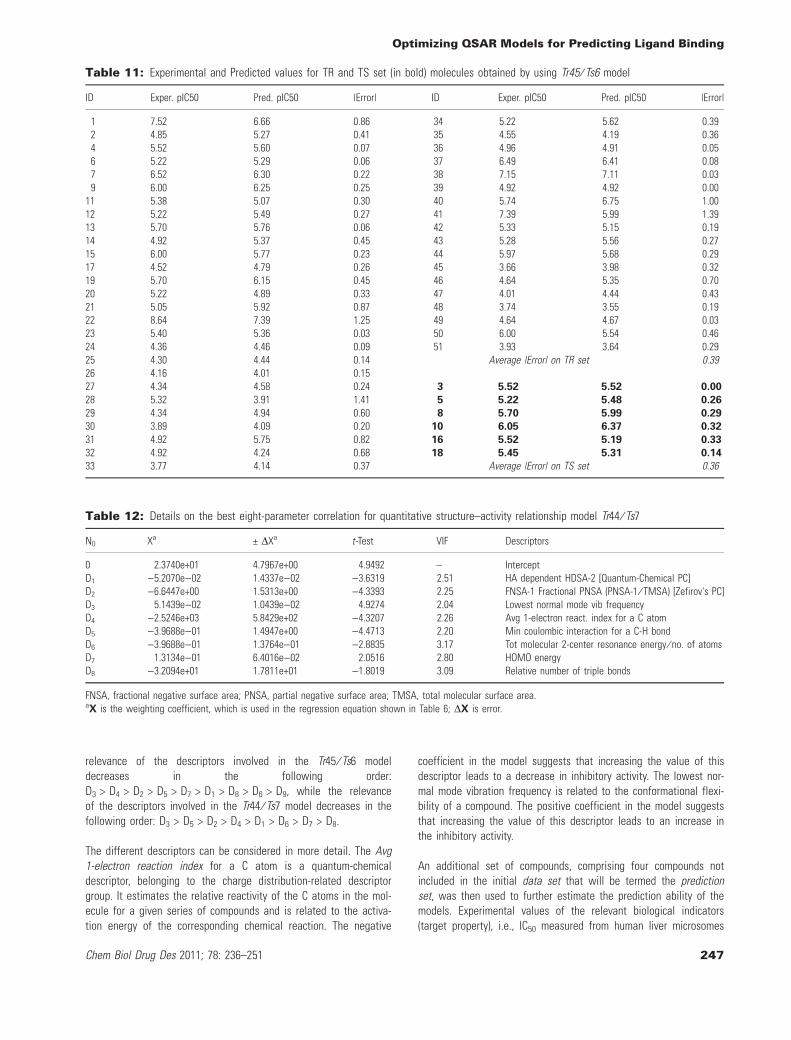
relevance of the descriptors involved in the Tr45 ⁄ Ts6 modeldecreases in the following order:D3 > D4 > D2 > D5 > D7 > D1 > D8 > D6 > D9, while the relevanceof the descriptors involved in the Tr44 ⁄ Ts7 model decreases in thefollowing order: D3 > D5 > D2 > D4 > D1 > D6 > D7 > D8.
The different descriptors can be considered in more detail. The Avg1-electron reaction index for a C atom is a quantum-chemicaldescriptor, belonging to the charge distribution-related descriptorgroup. It estimates the relative reactivity of the C atoms in the mol-ecule for a given series of compounds and is related to the activa-tion energy of the corresponding chemical reaction. The negative
coefficient in the model suggests that increasing the value of thisdescriptor leads to a decrease in inhibitory activity. The lowest nor-mal mode vibration frequency is related to the conformational flexi-bility of a compound. The positive coefficient in the model suggeststhat increasing the value of this descriptor leads to an increase inthe inhibitory activity.
An additional set of compounds, comprising four compounds notincluded in the initial data set that will be termed the predictionset, was then used to further estimate the prediction ability of themodels. Experimental values of the relevant biological indicators(target property), i.e., IC50 measured from human liver microsomes
Table 11: Experimental and Predicted values for TR and TS set (in bold) molecules obtained by using Tr45 ⁄ Ts6 model
ID Exper. pIC50 Pred. pIC50 |Error| ID Exper. pIC50 Pred. pIC50 |Error|
1 7.52 6.66 0.86 34 5.22 5.62 0.392 4.85 5.27 0.41 35 4.55 4.19 0.364 5.52 5.60 0.07 36 4.96 4.91 0.056 5.22 5.29 0.06 37 6.49 6.41 0.087 6.52 6.30 0.22 38 7.15 7.11 0.039 6.00 6.25 0.25 39 4.92 4.92 0.00
11 5.38 5.07 0.30 40 5.74 6.75 1.0012 5.22 5.49 0.27 41 7.39 5.99 1.3913 5.70 5.76 0.06 42 5.33 5.15 0.1914 4.92 5.37 0.45 43 5.28 5.56 0.2715 6.00 5.77 0.23 44 5.97 5.68 0.2917 4.52 4.79 0.26 45 3.66 3.98 0.3219 5.70 6.15 0.45 46 4.64 5.35 0.7020 5.22 4.89 0.33 47 4.01 4.44 0.4321 5.05 5.92 0.87 48 3.74 3.55 0.1922 8.64 7.39 1.25 49 4.64 4.67 0.0323 5.40 5.36 0.03 50 6.00 5.54 0.4624 4.36 4.46 0.09 51 3.93 3.64 0.2925 4.30 4.44 0.14 Average |Error| on TR set 0.3926 4.16 4.01 0.1527 4.34 4.58 0.24 3 5.52 5.52 0.00
28 5.32 3.91 1.41 5 5.22 5.48 0.26
29 4.34 4.94 0.60 8 5.70 5.99 0.29
30 3.89 4.09 0.20 10 6.05 6.37 0.32
31 4.92 5.75 0.82 16 5.52 5.19 0.33
32 4.92 4.24 0.68 18 5.45 5.31 0.14
33 3.77 4.14 0.37 Average |Error| on TS set 0.36
Table 12: Details on the best eight-parameter correlation for quantitative structure–activity relationship model Tr44 ⁄ Ts7
N0 Xa € DXa t-Test VIF Descriptors
0 2.3740e+01 4.7967e+00 4.9492 – InterceptD1 )5.2070e)02 1.4337e)02 )3.6319 2.51 HA dependent HDSA-2 [Quantum-Chemical PC]D2 )6.6447e+00 1.5313e+00 )4.3393 2.25 FNSA-1 Fractional PNSA (PNSA-1 ⁄ TMSA) [Zefirov's PC]D3 5.1439e)02 1.0439e)02 4.9274 2.04 Lowest normal mode vib frequencyD4 )2.5246e+03 5.8429e+02 )4.3207 2.26 Avg 1-electron react. index for a C atomD5 )3.9688e)01 1.4947e+00 )4.4713 2.20 Min coulombic interaction for a C-H bondD6 )3.9688e)01 1.3764e)01 )2.8835 3.17 Tot molecular 2-center resonance energy ⁄ no. of atomsD7 1.3134e)01 6.4016e)02 2.0516 2.80 HOMO energyD8 )3.2094e+01 1.7811e+01 )1.8019 3.09 Relative number of triple bonds
FNSA, fractional negative surface area; PNSA, partial negative surface area; TMSA, total molecular surface area.aX is the weighting coefficient, which is used in the regression equation shown in Table 6; DX is error.
Optimizing QSAR Models for Predicting Ligand Binding
Chem Biol Drug Des 2011; 78: 236–251 247
with dextromethorphan as a specific CYP2D6 probe, were takenfrom the literature (34,35). Molecular structures are shown inTable 14 together with their target property (IC50) values.
Descriptor values, which are required for the prediction, were com-puted for the compounds included in the above prediction set. Theirvalues enabled us to verify whether all these compounds fell into thechemical space defined by the proposed models, which is commonlyreferred to as the applicability domain (AD) of the model, which isestablished by the breadth of the training set. Indeed, one of the
simplest criteria leading to a definition of AD, for a given model,states that it may be defined by the range (max and min) of the val-ues taken by each of the descriptors of all the molecules included inthe training set. Based on this criterion, a test molecule is consideredto fall into the AD when values taken by each of its descriptors liewithin the range established by the training set. Tables S5 and S6, inthe Supporting information, report the descriptor value ranges defin-ing the ADs of the models, Tr45 ⁄ Ts6 and Tr44 ⁄ Ts7, derived here.
Table 15 compares the experimental and theoretical target propertyvalues for the four molecules making up the prediction set,
Table 13: Experimental and Predicted values for TR and TS set (in bold) molecules obtained by using Tr44 ⁄ Ts7 model
ID Exper. pIC50 Pred. pIC50 |Error| ID Exper. pIC50 Pred. pIC50 |Error|
1 7.52 6.65 0.88 35 4.55 4.09 0.472 4.85 5.39 0.54 36 4.96 4.75 0.215 5.22 5.60 0.38 37 6.49 6.30 0.206 5.22 5.38 0.16 38 7.15 6.89 0.267 6.52 6.33 0.19 39 4.92 4.83 0.099 6.00 6.17 0.17 40 5.74 6.67 0.93
11 5.38 5.32 0.06 41 7.39 5.91 1.4813 5.70 5.77 0.07 42 5.33 5.21 0.1214 4.92 5.27 0.35 43 5.28 5.69 0.4015 6.00 5.54 0.46 44 5.97 5.66 0.3217 4.52 4.37 0.16 45 3.66 4.11 0.4519 5.70 6.64 0.94 46 4.64 5.18 0.5420 5.22 4.94 0.28 47 4.01 4.64 0.6221 5.05 5.96 0.91 48 3.74 3.65 0.0922 8.64 7.31 1.33 49 4.64 4.86 0.2123 5.40 5.29 0.11 50 6.00 5.37 0.6324 4.36 4.63 0.27 51 3.93 3.73 0.2025 4.30 4.64 0.35 Average |Error| on TR set 0.4426 4.16 4.19 0.0327 4.34 4.73 0.39 3 5.52 5.63 0.10
28 5.32 3.95 1.37 4 5.52 5.66 0.14
29 4.34 4.95 0.60 8 5.70 6.05 0.35
30 3.89 3.98 0.10 10 6.05 6.33 0.28
31 4.92 5.80 0.88 12 5.22 5.46 0.23
32 4.92 4.11 0.81 16 5.52 5.19 0.33
33 3.77 4.11 0.34 18 5.45 5.39 0.06
34 5.22 5.27 0.05 Average |Error| on TS set 0.21
9.00
8.00
7.00
6.00
5.00
4.00
3.009.00
TR set
TS set
8.007.006.00Experimental plC50
Pre
dic
ted
plC
50
5.004.003.00
Figure 1: Calculated versus experimental pIC50 computed by thequantitative structure–activity relationship model Tr45 ⁄ Ts6.
8.00
7.00
6.00
5.00
4.00
3.009.00
TR setTS set
8.007.006.00Experimental plC50
Pre
dic
ted
plC
50
5.004.003.00
Figure 2: Calculated versus experimental pIC50 computed by thequantitative structure–activity relationship model Tr44 ⁄ Ts7.
Saraceno et al.
248 Chem Biol Drug Des 2011; 78: 236–251
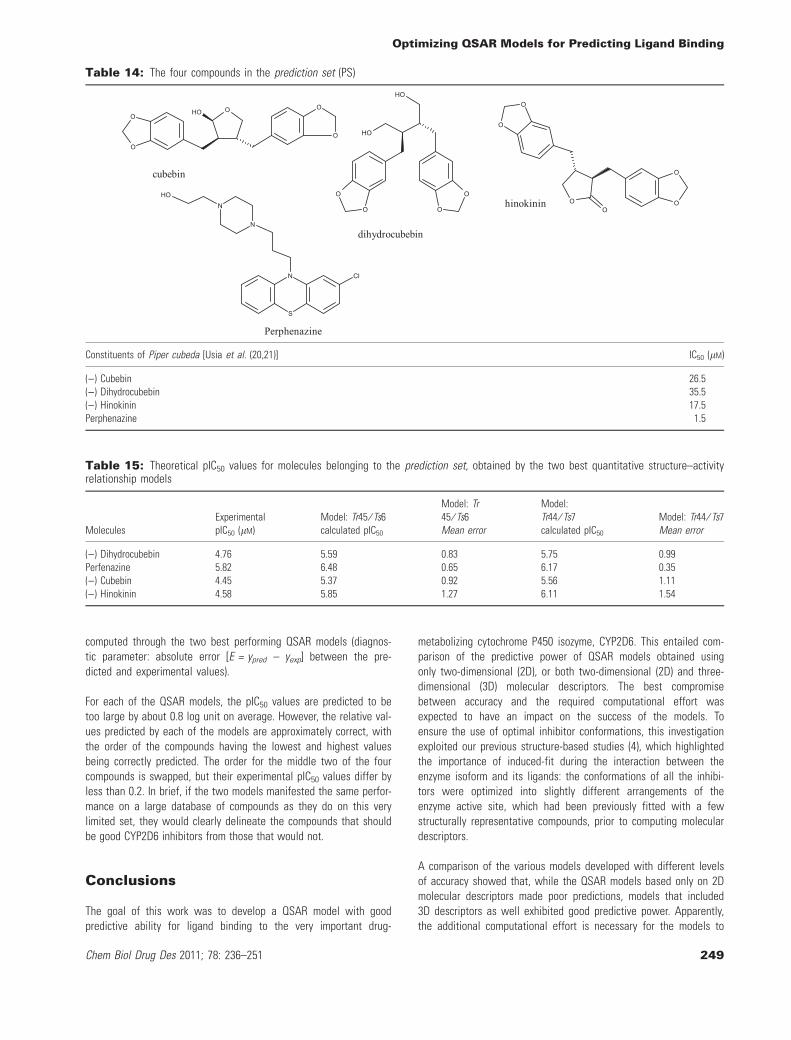
computed through the two best performing QSAR models (diagnos-tic parameter: absolute error [E = ypred – yexp] between the pre-dicted and experimental values).
For each of the QSAR models, the pIC50 values are predicted to betoo large by about 0.8 log unit on average. However, the relative val-ues predicted by each of the models are approximately correct, withthe order of the compounds having the lowest and highest valuesbeing correctly predicted. The order for the middle two of the fourcompounds is swapped, but their experimental pIC50 values differ byless than 0.2. In brief, if the two models manifested the same perfor-mance on a large database of compounds as they do on this verylimited set, they would clearly delineate the compounds that shouldbe good CYP2D6 inhibitors from those that would not.
Conclusions
The goal of this work was to develop a QSAR model with goodpredictive ability for ligand binding to the very important drug-
metabolizing cytochrome P450 isozyme, CYP2D6. This entailed com-parison of the predictive power of QSAR models obtained usingonly two-dimensional (2D), or both two-dimensional (2D) and three-dimensional (3D) molecular descriptors. The best compromisebetween accuracy and the required computational effort wasexpected to have an impact on the success of the models. Toensure the use of optimal inhibitor conformations, this investigationexploited our previous structure-based studies (4), which highlightedthe importance of induced-fit during the interaction between theenzyme isoform and its ligands: the conformations of all the inhibi-tors were optimized into slightly different arrangements of theenzyme active site, which had been previously fitted with a fewstructurally representative compounds, prior to computing moleculardescriptors.
A comparison of the various models developed with different levelsof accuracy showed that, while the QSAR models based only on 2Dmolecular descriptors made poor predictions, models that included3D descriptors as well exhibited good predictive power. Apparently,the additional computational effort is necessary for the models to
Table 14: The four compounds in the prediction set (PS)
O
OOOHO
O
cubebin
OO
O
O
O
O
hinokinin
N
S
Cl
N
NOH
Perphenazine
OH
OH
O
OO
O
dihydrocubebin
Constituents of Piper cubeda [Usia et al. (20,21)] IC50 (lM)
()) Cubebin 26.5()) Dihydrocubebin 35.5()) Hinokinin 17.5Perphenazine 1.5
Table 15: Theoretical pIC50 values for molecules belonging to the prediction set, obtained by the two best quantitative structure–activityrelationship models
MoleculesExperimentalpIC50 (lM)
Model: Tr45 ⁄ Ts6calculated pIC50
Model: Tr45 ⁄ Ts6Mean error
Model:Tr44 ⁄ Ts7calculated pIC50
Model: Tr44 ⁄ Ts7Mean error
()) Dihydrocubebin 4.76 5.59 0.83 5.75 0.99Perfenazine 5.82 6.48 0.65 6.17 0.35()) Cubebin 4.45 5.37 0.92 5.56 1.11()) Hinokinin 4.58 5.85 1.27 6.11 1.54
Optimizing QSAR Models for Predicting Ligand Binding
Chem Biol Drug Des 2011; 78: 236–251 249
have value for predicting CYP2D6 inhibitory tendencies of com-pounds in large databases.
Acknowledgments
This work was supported by the International Society for DrugDevelopment Srl (ISDD), Milano (Italy).
References
1. Shirga T., Matsuda H., Nagase K., Iwasaki K., Noda K., YamazakiH., Shimada T., Funae Y. (1994) Metabolism of FK506, a potentimmunosuppressive agent, by cytochrome P450 3A enzymes inrat, dog and human liver microsomes. Biochem Pharma-col;47:727–735.
2. Snyder R., Sangar R., Wang J., Ekins S. (2002) Three-dimen-sional quantitative structure activity relationship for Cyp2d6 sub-strates. Quant Struct- Act Relat;21:357–368.
3. Arimoto R. (2006) Computational models for predicting interac-tions with cytochrome p450 enzyme. Curr Top MedChem;6:1609–1618.
4. Strobl G.R., von Kruedener S., Stockigt J., Guengerich F.P., WolffT. (1993) Development of a pharmacophore for inhibition ofhuman liver cytochrome P-450 2D6: molecular modeling andinhibition studies. J Med Chem;36:1136–1145.
5. Ekins S., Bravi G., Binkley S., Gillespie J.S., Ring J.B.J., WikelJ.H., Wrighton S.A. (1999) Three and four dimensional-quantita-tive structure activity relationship (3D ⁄ 4D-QSAR) analyses ofCYP2D6 inhibitors. Pharmacogenetics;9:477–489.
6. Susnow R.G., Dixon S.L. (2003) Use of robust classification tech-niques for the prediction of human cytochrome P450 2D6 inhibi-tion. J Chem Inf Comput Sci;43:1308–1315.
7. Ekins S., Berbaum J. (2003) Generation and validation of rapidcomputational filters for cyp2d6 and cyp3a4. Drug Metab Dis-pos;31:1077–1080.
8. O'Brien S.E., de Groot M.J. (2005) Greater than the sum of itsparts: combining models for useful ADMET prediction. J MedChem;48:1287–1291.
9. Crivori P., Poggesi I. (2005) Predictive model for identifyingpotential CYP2D6 inhibitors. Basic Clin, Pharmacol Toxi-col;96:251–253.
10. Vaz R.J., Nayeem A., Santone K., Chandrasena G., Gavai A.V.(2005) A 3D-QSAR model for CYP2D6 inhibition in the aryloxy-propanolamine series. Bioorg Med Chem Lett;15:3816–3820.
11. Yap C.W., Chen Y.Z. (2005) Prediction of cytochrome P450 3A4,2D6, and 2C9 inhibitors and substrates by using support vectormachines. J Chem Inf Model;45:982–992.
12. Terfloth L., Bienfait B., Gasteiger J. (2007) Ligand-based modelsfor the isoform specificity of cytochrome P450 3A4, 2D6, and2C9 substrates. J Chem Inf Model;47:1688–1701.
13. Yamashita F., Hara H., Ito T., Hashida M. (2008) Novel hierarchi-cal classification and visualization method for multiobjectiveop-timization of drug properties: application to structure-activityrelationship analysis of cytochrome p450 metabolism. J ChemInf Model;48:364–369.
14. Ringsted T., Nikolov N., Jensen G.E., Wedebye E.B., Niemel� J.(2009) QSAR models for P450 (2D6) substrate activity. SARQSAR Environ Res;20:309–325.
15. Saraceno M., Coi A., Bianucci A.M. (2008) Molecular modellingof human CYP2D6 and molecular docking of a series of ajmali-cine- and quinidine-like inhibitors. Int J Biol Macromol;42:362–371.
16. Berlin M., Ting P.C., Vaccaio W.D., Aslanian R., McCormick K.D.,Lee J.F., Albanes M.M. et al. (2006) Reduction of CYP450 inhibi-tion in the 4-[(1H-imidazol-4-yl)methyl] piperidine series of hista-mine H3 receptor antagonists. Bioorg Med Chem Lett;16:989–994.
17. Obach R.S., Walsky R.L., Venkatakrishnan K., Gaman E.A., Hous-ton J.B., Tremaine L.M. (2006) The utility of in vitro cytochromeP450 inhibition data in the prediction of drug-drug interactions.J Pharmacol Exp Ther;316:336–348.
18. Usia T., Iwata H., Hiratsuka A., Watabe T., Kadota S., Tezuka Y.(2004) Sesquiterpenes and flavonol glycosides from Zingiberaromaticum and Their CYP3A4 and CYP2D6 inhibitory activities.J Nat Prod;67:1079–1083.
19. Turpeinen M., Nieminen R., Juntunen T., Taavitsainen P., RaunioH., Pelkonen O. (2004) Selective inhibition of CYP2B6-catalyzedbupropion hydroxylation in human liver microsomes in vitro. DrugMet Disp;32:626–631.
20. Usia T., Watabe T., Kadota S., Tezuka Y. (2005) Cytochrome P4502D6 (CYP2D6) inhibitory constituents of Catharanthus roseus.Biol Pharm Bull;28:1021–1024.
21. Usia T., Watabe T., Kadota S., Tezuka Y. (2005) Constituents ofZingiber aromaticum and Their CYP3A4 and CYP2D6 InhibitoryActivity. Chem Pharm Bull;53:333–335.
22. Turpeinen M., Korhonenb L.E., Tolonenc A., Uusitaloc J., Juvo-nenb R., Rauniob H., Pelkonena O. (2006) Cytochrome P450(CYP) inhibition screening: comparison of three tests. Eur JPharm Sci;29:130–138.
23. Nicolas J.M., Whomsley R., Collart P., Roba J. (1999) In vitroinhibition of human liver drug metabolizing enzymes by secondgeneration antihistamines. Chem Biol Interact;123:63–79.
24. Umeda S., Harakawa N., Yamamoto M., Ueno K. (2005) Effect ofnonspecific binding to microsomes and metabolic elimination ofbuprenorphine on the inhibition of cytochrome P4502D6. BiolPharm Bull;28:212–216.
25. Desta Z., Kerbusch T., Soukhova N., Richard E., Ko J.W., Flock-hart D.A. (1998) Identification and characterization of humancytochrome P450 isoforms interacting with pimozide. J Pharma-col Exp Ther;285:428–437.
26. von Moltke L.L., Greenblatt D.J., Granda B.W., GiancarloG.M., Xiang Duan S., Daily J.P., Harmatz J.S., Shaker R.I.(2001) Inhibition of human cytochrome P450 isoforms by nonnu-cleoside reverse transcriptase inhibitors. J Clin Pharma-col;41:85–91.
27. ENV ⁄ JM ⁄ MONO Environment directorate joint meeting of thechemicals committee and the working party on chemicals, pesti-cides and biotechnology (2007) Guidance document on the vali-dation of (Quantitative) structure-activity relationships [(Q)SAR]models. ENV/JM/MONO;2 (69):42–58.
28. Morris G.M., Goodsell D.S., Halliday R.S., Huey R., Hart W.E.,Belew R.K., Olson A.J. (1998) Automated docking using a
Saraceno et al.
250 Chem Biol Drug Des 2011; 78: 236–251
Lamarckian genetic algorithm and an empirical binding freeenergy function. J Comput Chem;19:1639–1662.
29. Katritzky A.R., Lobanov V.S., Karelson M. (1994) CODESSA:Reference Manual; Version 2. University of Florida: Gainesville,FL.
30. Dewar M.J.S., Zoebisch E.G., Healy E.F., Stewart J.J.P. (1985) Anew general purpose quantum mechanical model. J Am ChemSoc;107:3902–3909.
31. Golbraikh A., Tropsha A. (2002) Beware of q2!. J. Mol. Graph.Model.;20:269–276.
32. Gobbi A., Lee M.-L. (2003) DISE: directed sphere exclusion. JChem Inf Comput Sci;43:317–323.
33. Coi A., Massarelli I., Saraceno M., Carli N., Testai L., CalderoneV., Bianucci A.M. (2009) QSAR models for predicting biologicalproperties, developed by combining structure- and ligand -basedapproaches: an application to the hERG potassium channel inhi-bition. Chem Biol Drug Des;74:416–433.
34. Usia T.U., Watabe T., Kadota S.K., Tezuka Y. (2005) PotentCYP3A4 inhibitory constituents of Piper cubeba. J NatProd;68:64–68.
35. Shin J.G., Soukhova N., Flockhart D.A. (1999) Effect of antipsy-chotic drugs on human liver cytochrome P-450 (CYP) isoforms invitro: preferential inhibition of CYP2D6. Drug Metab Dis-pos;27:1078–1084.
Note
aWhen we first started the study, the available version of Autodockwas the 3.5 one; then, after the AutoDock version 4.2 was
released, a few compounds were run with both versions andyielded the same results.
Supporting Information
Additional Supporting Information may be found in the online ver-sion of this article:
Table S1. Correlation matrix for the descriptors of QSAR modelTr45 ⁄ Ts6.
Table S2. Y-scrambling test for QSAR model Tr45 ⁄ Ts6.
Table S3. Correlation matrix for the descriptors of QSAR modelTr44 ⁄ Ts7.
Table S4. Y-scrambling test for QSAR model Tr44 ⁄ Ts7.
Table S5. Range of values of the nine descriptors incorporated inQSAR model Tr45 ⁄ Ts6.
Table S6. Range of values of the eight descriptors involved inQSAR model Tr44 ⁄ Ts7.
Please note: Wiley-Blackwell is not responsible for the content orfunctionality of any supporting materials supplied by the authors.Any queries (other than missing material) should be directed to thecorresponding author for the article.
Optimizing QSAR Models for Predicting Ligand Binding
Chem Biol Drug Des 2011; 78: 236–251 251