Embed Size (px)
Citation preview
Order effects in the assessment of quality of life in cancer patients
Yin-Bun Cheung1, Lea-Choung Wong2, Miah-Hiang Tay3, Chee-Keong Toh3, Wen-Hsin Koo3, RichardEpstein4 & Cynthia Goh51Division of Clinical Trials and Epidemiological Sciences (E-mail: [email protected]); 2Department ofTherapeutic Radiology; 3Department of Medical Oncology, National Cancer Centre, Singapore; 4Departmentof Medicine, University of Hong Kong, Hong Kong; 5Department of Palliative Medicine, National CancerCentre, Singapore
Accepted in revised form 30 October 2003
Abstract
Methodological studies and outcome research often include several health-related quality of life (HRQoL)measurement scales in one questionnaire. Psychological studies have previously demonstrated thatchanging the sequential order of measurement scales within a questionnaire can alter the pattern of re-sponses. Little is known, however, about whether there are order effects on the assessment of HRQoL incancer patients. Here we address this issue in a study of 190 Singaporean cancer patients who were assessedusing two different HRQoL instruments placed in alternating sequence within a questionnaire package.Measurement properties of the instruments, including the number of missing values, means, variability,known-group validity and internal consistency, were compared in the two samples representing differentpresentation orders. The HRQoL instruments administered in different sequential orders appeared to beequivalent in several aspects. No major effect of presentation order on outcomes was shown. The reasonsand implications of the absence of an order effect are discussed. We conclude that presentation order isunlikely to alter the responses to the two HRQoL instruments.
Key words: Cancer, Health-related quality of life (HRQoL), Order effect
Introduction
The order of questions in a questionnaire haspreviously been shown to affect the responses ob-tained [1–3]. Conventional wisdom suggests thatsurveys should begin with simple, descriptive, andnon-sensitive questions [2, 3]. It is also suggestedthat the items of composite measurement scalesmay subject to a context effect [4]. However, notmuch is known about whether the order of pre-sentation of composite measurement scales withina questionnaire would influence the research pro-cess and results.
Jensen et al. [5] and Mook [6] discussed variousreasons why order effects could appear. Respon-dents may become fatigued or lose concentrationtowards the end of a questionnaire, and therefore
tend to misunderstand or omit more items. Fur-thermore, respondents may become familiar with agiven topic being asked about and/or desensitisedby previous questions on the same topic, thusproduce a different pattern of answers. Thedevelopment of new quality of life instrumentsoften employs several instruments for the purposesof determining convergent and divergent validity.In clinical practice and outcome research it is alsocommon to use more scales than one. As such, thepresence of order effects may affect the results andthe interpretation of them. It is important todetermine and/or exclude order effects in thoseresearch contexts.
Using randomised and counterbalanced designs,two studies demonstrated that the presentationorder of some psychological instruments did affect
Quality of Life Research 13: 1217–1223, 2004.� 2004 Kluwer Academic Publishers. Printed in the Netherlands.
1217
the results [5, 7]. In a postal survey that includedfour health and health-related quality of life(HRQoL) measurement scales, the researchersused two versions of a questionnaire [8]. Onebegan with generic measures followed by specificmeasures; another presented the constituentgroups of items in chronological order accordingto the time period the items referred to. It wasfound that although the orders did not appear toaffect the answers, the questionnaire using chro-nological order were returned more speedily. In astudy of cancer patients, the participants self-administered a questionnaire in which the Euro-pean Organisation for Research and Treatment ofCancer Quality of Life Questionnaire – C30 (EO-RTC QLQ C-30) always preceded the FunctionalAssessment of Cancer Therapy – General (FACT-G) [9]. The researchers suggested that an ordereffect could be investigated by comparing thescores on four aspects enumerated by similarquestions in the two HRQoL measures, namely,pain, nausea, meeting family needs, and generalsatisfaction. The four items in the two instrumentsindicated similar level of HRQoL.
In a recent study of cancer patients that was notspecifically designed for the testing of the ordereffects, we employed the FACT-G and an abbre-viated version of the Functional Living Index –Cancer, which was called Quick-FLIC [10], in aquestionnaire package. The two HRQoL measureswere placed in different sequences to form twoversions of the package. Capitalising on thisexisting data set, we report here the psychometricand clinical findings of the two measures used indifferent order of presentation.
Methods
Design and procedure
The questionnaires included the Chinese version ofFACT-G and the Quick-FLIC, as well as fourdemographic and health variables. There were twoversions of the questionnaire, in the sequences of(A) demographic/health items – FACT-G – Quick-FLIC, and (B) demographic/health items – Quick-FLIC – FACT-G; for brevity we refer to these asorder A and order B respectively. The two versionswere distributed to participants in alternate order.
Karnofsky performance score, treatment statusand some other clinical information were rated bythe referring oncologists. Treatment status wasclassified as under active treatment (chemother-apy, radiotherapy, or pain medication) or not.
Patients
Between September 2002 and January 2003, pa-tients who attended the out-patient clinic of theNational Cancer Centre of Singapore, as well asin-patients under the care of the Centre’s Depart-ment of Palliative Medicine, were recruited intothe study. Patients were deemed eligible for thestudy according to the following inclusion criteria:able to understand written and spoken Chinese,aged 18 years or older, and capable of self-administering a questionnaire. Patients with evi-dence of brain metastasis, psychosis, or severedepression were excluded. The study was approvedby the Ethics Committee of the Centre.
A total of 220 consecutive eligible patients wereapproached. Seventeen patients decline to partici-pate. Five subjects allocated to order A and five toorder B completed about half of the questionnairesand then withdrew. In addition, one order A(FACT-G preceded Quick-FLIC) and two order B(Quick-FLIC preceded FACT-G) questionnaireswere excluded due to missing values beyondimputation by the half-rule [11]. Overall, therewere six and seven incomplete questionnaires inorders A and B, respectively (Fisher’s exact test,p ¼ 0.783).
Analysis
Missing values in the FACT-G and Quick-FLICwere imputed by the half-rule [11]. Negativelyworded items were recoded so that a higher scoreindicated a better HRQoL by all items. TheFACT-G score was a sum of the 27 item scores,each ranged between 0 and 4. The Quick-FLICscore was a sum of the 11 item scores, each rangedbetween 1 and 7. Comparisons of categoricalvariables between groups were based on the v2 testor an exact test [12], depending on whether any ofthe expected cell counts were smaller than five.Comparison of means of continuous variablesbetween groups were based on ANOVA. Standarddeviations of HRQoL scores were compared by
1218
Levene’s test [13]. Internal consistency was char-acterised by Cronbach’s a.
In order to examine the equivalence of theHRQoL instruments administered in different or-ders of presentation, we defined equivalence zonesof the quantities concerned and estimated the 95%confidence intervals of the difference between thetwo orders [14, 15]. If the 95% confidence intervaltotally lay within the zone, equivalence was con-firmed. For comparison of mean number of miss-ing values, the equivalence zone was set as 1 item.For comparison of Cronbach’s a, the zone was 0.1.There is no definite interpretation of FACT-G andQuick-FLIC score values. The present data setincluded a 5-point scale of self-assessed quality oflife (‘very good’, ‘good’, ‘average’, ‘poor’ or ‘verypoor’), and a similar 5-point scale of self-assessedhealth status. Separately regressing FACT-Gscores upon the self-assessed quality of life scaleand the self-assessed health status scale showedthat one step decrease in self-assessed quality oflife and health were associated with, respectively,
9.6 and 8.9 points decrease in FACT-G scores.With reference to this, we defined a difference ofless than 9 points in FACT-G score equivalence.Similarly, we defined the equivalence zone forQuick-FLIC scores as not more than 7 points. Theconfidence intervals for difference in Cronbach’s awere estimated by the bootstrap method [16].
Results
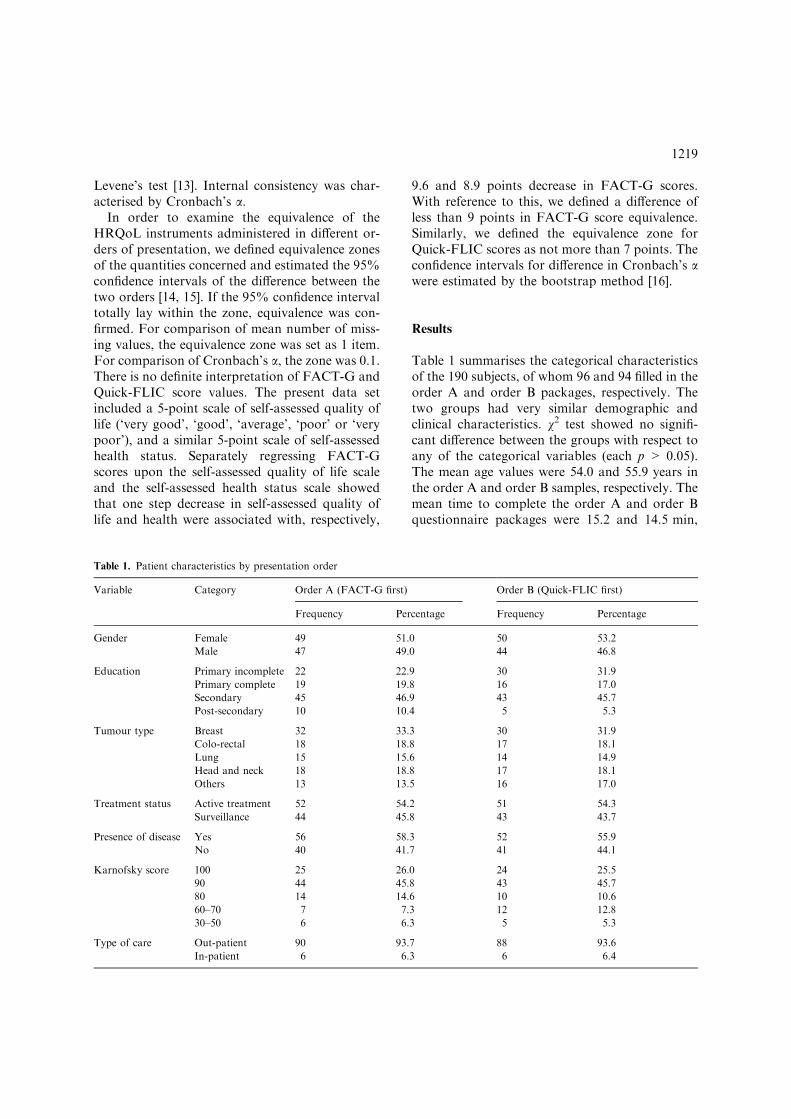
Table 1 summarises the categorical characteristicsof the 190 subjects, of whom 96 and 94 filled in theorder A and order B packages, respectively. Thetwo groups had very similar demographic andclinical characteristics. v2 test showed no signifi-cant difference between the groups with respect toany of the categorical variables (each p > 0.05).The mean age values were 54.0 and 55.9 years inthe order A and order B samples, respectively. Themean time to complete the order A and order Bquestionnaire packages were 15.2 and 14.5 min,
Table 1. Patient characteristics by presentation order
Variable Category Order A (FACT-G first) Order B (Quick-FLIC first)
Frequency Percentage Frequency Percentage
Gender Female 49 51.0 50 53.2
Male 47 49.0 44 46.8
Education Primary incomplete 22 22.9 30 31.9
Primary complete 19 19.8 16 17.0
Secondary 45 46.9 43 45.7
Post-secondary 10 10.4 5 5.3
Tumour type Breast 32 33.3 30 31.9
Colo-rectal 18 18.8 17 18.1
Lung 15 15.6 14 14.9
Head and neck 18 18.8 17 18.1
Others 13 13.5 16 17.0
Treatment status Active treatment 52 54.2 51 54.3
Surveillance 44 45.8 43 43.7
Presence of disease Yes 56 58.3 52 55.9
No 40 41.7 41 44.1
Karnofsky score 100 25 26.0 24 25.5
90 44 45.8 43 45.7
80 14 14.6 10 10.6
60–70 7 7.3 12 12.8
30–50 6 6.3 5 5.3
Type of care Out-patient 90 93.7 88 93.6
In-patient 6 6.3 6 6.4
1219
respectively. ANOVA showed no significant dif-ference between the two groups in age and time tocompletion of questionnaire (each p > 0.05).
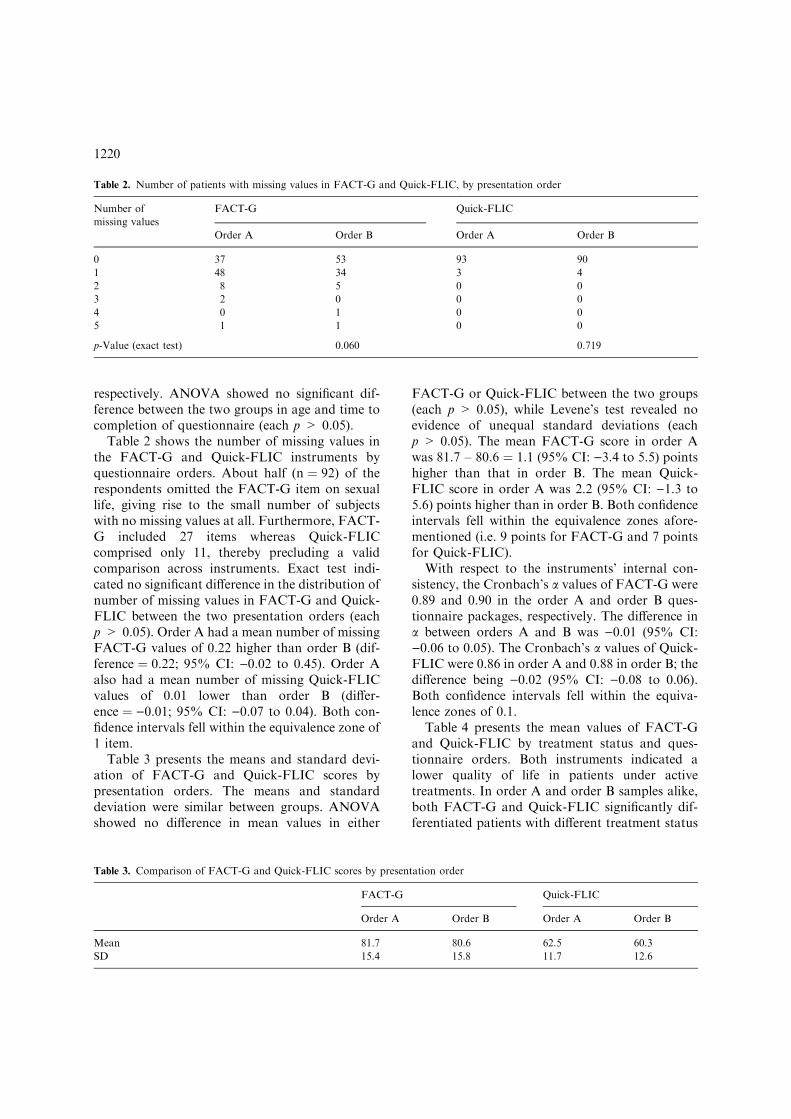
Table 2 shows the number of missing values inthe FACT-G and Quick-FLIC instruments byquestionnaire orders. About half (n ¼ 92) of therespondents omitted the FACT-G item on sexuallife, giving rise to the small number of subjectswith no missing values at all. Furthermore, FACT-G included 27 items whereas Quick-FLICcomprised only 11, thereby precluding a validcomparison across instruments. Exact test indi-cated no significant difference in the distribution ofnumber of missing values in FACT-G and Quick-FLIC between the two presentation orders (eachp > 0.05). Order A had a mean number of missingFACT-G values of 0.22 higher than order B (dif-ference ¼ 0.22; 95% CI: )0.02 to 0.45). Order Aalso had a mean number of missing Quick-FLICvalues of 0.01 lower than order B (differ-ence ¼ )0.01; 95% CI: )0.07 to 0.04). Both con-fidence intervals fell within the equivalence zone of1 item.
Table 3 presents the means and standard devi-ation of FACT-G and Quick-FLIC scores bypresentation orders. The means and standarddeviation were similar between groups. ANOVAshowed no difference in mean values in either
FACT-G or Quick-FLIC between the two groups(each p > 0.05), while Levene’s test revealed noevidence of unequal standard deviations (eachp > 0.05). The mean FACT-G score in order Awas 81.7 – 80.6 ¼ 1.1 (95% CI: )3.4 to 5.5) pointshigher than that in order B. The mean Quick-FLIC score in order A was 2.2 (95% CI: )1.3 to5.6) points higher than in order B. Both confidenceintervals fell within the equivalence zones afore-mentioned (i.e. 9 points for FACT-G and 7 pointsfor Quick-FLIC).
With respect to the instruments’ internal con-sistency, the Cronbach’s a values of FACT-G were0.89 and 0.90 in the order A and order B ques-tionnaire packages, respectively. The difference ina between orders A and B was )0.01 (95% CI:)0.06 to 0.05). The Cronbach’s a values of Quick-FLIC were 0.86 in order A and 0.88 in order B; thedifference being )0.02 (95% CI: )0.08 to 0.06).Both confidence intervals fell within the equiva-lence zones of 0.1.
Table 4 presents the mean values of FACT-Gand Quick-FLIC by treatment status and ques-tionnaire orders. Both instruments indicated alower quality of life in patients under activetreatments. In order A and order B samples alike,both FACT-G and Quick-FLIC significantly dif-ferentiated patients with different treatment status
Table 2. Number of patients with missing values in FACT-G and Quick-FLIC, by presentation order
Number of
missing values
FACT-G Quick-FLIC
Order A Order B Order A Order B
0 37 53 93 90
1 48 34 3 4
2 8 5 0 0
3 2 0 0 0
4 0 1 0 0
5 1 1 0 0
p-Value (exact test) 0.060 0.719
Table 3. Comparison of FACT-G and Quick-FLIC scores by presentation order
FACT-G Quick-FLIC
Order A Order B Order A Order B
Mean 81.7 80.6 62.5 60.3
SD 15.4 15.8 11.7 12.6
1220
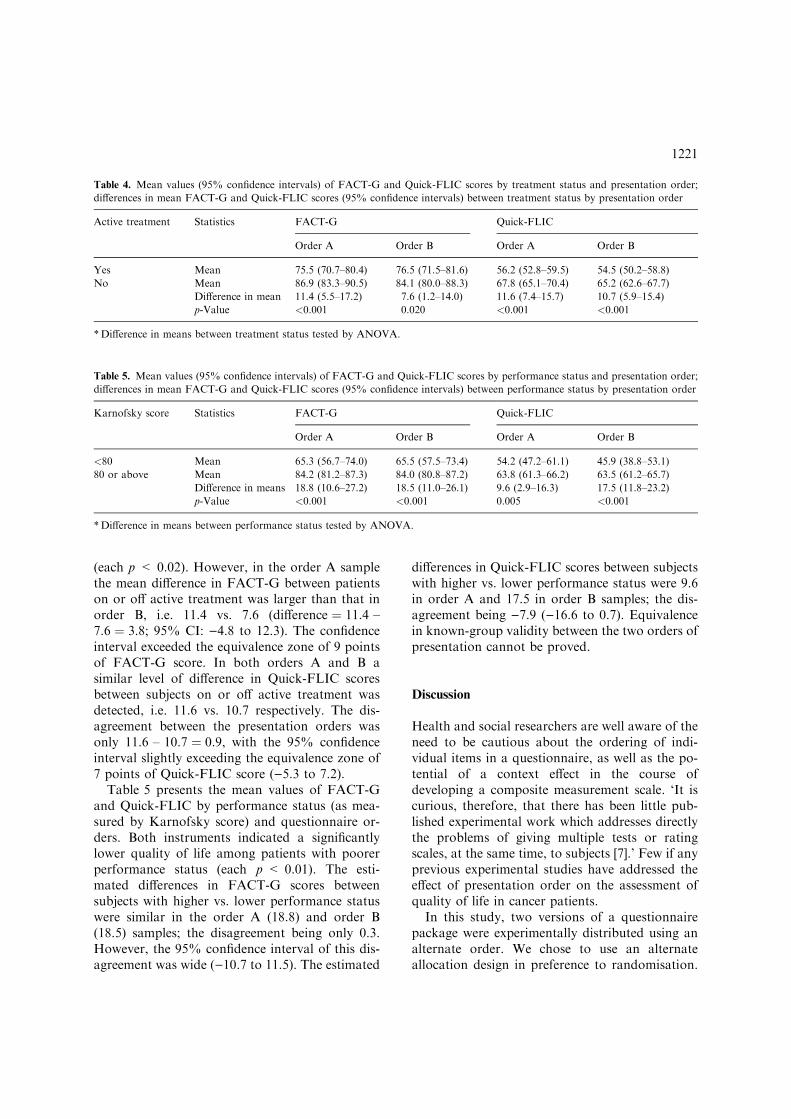
(each p < 0.02). However, in the order A samplethe mean difference in FACT-G between patientson or off active treatment was larger than that inorder B, i.e. 11.4 vs. 7.6 (difference ¼ 11.4 –7.6 ¼ 3.8; 95% CI: )4.8 to 12.3). The confidenceinterval exceeded the equivalence zone of 9 pointsof FACT-G score. In both orders A and B asimilar level of difference in Quick-FLIC scoresbetween subjects on or off active treatment wasdetected, i.e. 11.6 vs. 10.7 respectively. The dis-agreement between the presentation orders wasonly 11.6 – 10.7 ¼ 0.9, with the 95% confidenceinterval slightly exceeding the equivalence zone of7 points of Quick-FLIC score ()5.3 to 7.2).
Table 5 presents the mean values of FACT-Gand Quick-FLIC by performance status (as mea-sured by Karnofsky score) and questionnaire or-ders. Both instruments indicated a significantlylower quality of life among patients with poorerperformance status (each p < 0.01). The esti-mated differences in FACT-G scores betweensubjects with higher vs. lower performance statuswere similar in the order A (18.8) and order B(18.5) samples; the disagreement being only 0.3.However, the 95% confidence interval of this dis-agreement was wide ()10.7 to 11.5). The estimated
differences in Quick-FLIC scores between subjectswith higher vs. lower performance status were 9.6in order A and 17.5 in order B samples; the dis-agreement being )7.9 ()16.6 to 0.7). Equivalencein known-group validity between the two orders ofpresentation cannot be proved.
Discussion
Health and social researchers are well aware of theneed to be cautious about the ordering of indi-vidual items in a questionnaire, as well as the po-tential of a context effect in the course ofdeveloping a composite measurement scale. ‘It iscurious, therefore, that there has been little pub-lished experimental work which addresses directlythe problems of giving multiple tests or ratingscales, at the same time, to subjects [7].’ Few if anyprevious experimental studies have addressed theeffect of presentation order on the assessment ofquality of life in cancer patients.
In this study, two versions of a questionnairepackage were experimentally distributed using analternate order. We chose to use an alternateallocation design in preference to randomisation.
Table 4. Mean values (95% confidence intervals) of FACT-G and Quick-FLIC scores by treatment status and presentation order;
differences in mean FACT-G and Quick-FLIC scores (95% confidence intervals) between treatment status by presentation order
Active treatment Statistics FACT-G Quick-FLIC
Order A Order B Order A Order B
Yes Mean 75.5 (70.7–80.4) 76.5 (71.5–81.6) 56.2 (52.8–59.5) 54.5 (50.2–58.8)
No Mean 86.9 (83.3–90.5) 84.1 (80.0–88.3) 67.8 (65.1–70.4) 65.2 (62.6–67.7)
Difference in mean 11.4 (5.5–17.2) 7.6 (1.2–14.0) 11.6 (7.4–15.7) 10.7 (5.9–15.4)
p-Value <0.001 0.020 <0.001 <0.001
*Difference in means between treatment status tested by ANOVA.
Table 5. Mean values (95% confidence intervals) of FACT-G and Quick-FLIC scores by performance status and presentation order;
differences in mean FACT-G and Quick-FLIC scores (95% confidence intervals) between performance status by presentation order
Karnofsky score Statistics FACT-G Quick-FLIC
Order A Order B Order A Order B
<80 Mean 65.3 (56.7–74.0) 65.5 (57.5–73.4) 54.2 (47.2–61.1) 45.9 (38.8–53.1)
80 or above Mean 84.2 (81.2–87.3) 84.0 (80.8–87.2) 63.8 (61.3–66.2) 63.5 (61.2–65.7)
Difference in means 18.8 (10.6–27.2) 18.5 (11.0–26.1) 9.6 (2.9–16.3) 17.5 (11.8–23.2)
p-Value <0.001 <0.001 0.005 <0.001
*Difference in means between performance status tested by ANOVA.
1221
In doing so, we made a conscious decision to fa-vour the logistically simpler approach. We canthink of no reason why bias should arise from theallocation method in this specific research context.Moreover, various clinical and demographiccharacteristics of the two groups of respondentscompared well, supporting the comparability ofthe two samples and the randomness of the allo-cation. There is no commonly agreed definition ofequivalence; in particular we could not find anysuch proposals for the present context. Our choiceof 1 item of missing value, 0.1 of Cronbach’ a, and9 FACT-G and 7 Quick-FLIC points (which re-flected a one-step change in 5-point Likert scales ofself-reported quality of life and health) for theequivalence zone was subjective. Nevertheless,95% confidence interval of the disagreement be-tween presentation orders have been included forreaders to form their own subjective judgements.
One limitation is that the questionnaires used inthis study are relatively short, requiring a medianof 14 min to complete. We would expect that thelonger a questionnaire, the larger an order effectwould accumulate because of more exposure dur-ing the course of answering the questions. As such,the findings may not be extrapolated to studiesusing much longer interviews. Another limitationis about generalisability. The exclusion of patientswith severe depression, who might be more sus-ceptible to fatigue and therefore order effects,limited the generalisation in patient groups. Theuse of only FACT-G and Quick-FLIC was a resultof data availability and this also limited the gen-eralisation to HRQoL assessment more generally.Nevertheless, FACT-G is a widely used measureand therefore the findings are relevant to manyresearchers. Furthermore, the present study hasnot investigated test–retest reliability and haslimited power in showing equivalence in assessingknown-group validity.
Despite the limitations, the present study hastaken one step forward in the study of order effectsin quality of life research. If an order effect arosebecause patients got familiar with or (de)sensitisedby the questions, a shift in the level of scores mightappear. The central finding of the present studywas that both FACT-G and Quick-FLIC gaveequivalent mean values of HRQoL regardless theywere administered first or last. Both FACT-G andQuick-FLIC involved negatively worded items,
which had to be recoded into the direction of ahigher score indicating better HRQoL beforeanalysis. If an order effect was resultant ofrespondents becoming fatigued or inattentive, wewould expect a larger amount of missing valuesand a decreased Cronbach’s a when the scale waspresented last because the respondents may answerin the wrong way or give a monotonic pattern ofanswers (e.g. marking one end of the scale for allitems). However, the amount of missing valuesand the Cronbach’s a value were also equivalentacross the two versions of questionnaire package.In terms of differentiating the HRQoL of known-groups, neither equivalence nor difference could beconfirmed quantitatively. Nevertheless, qualita-tively regardless of presentation order bothinstruments were able to detect a significant dif-ference between patients with distinct treatmentand performance status.
That there was no major order effect isencouraging news since it means clinicalresearch and methodological studies do not needto take this into account. More laboriousresearch designs like randomised design suggestedby previous researchers seemed to be unnecessary[5, 6]. It is curious to find substantial evi-dence revealing order effects in psychological andpsychiatric research [5–7, 17], while the presentstudy and two previous studies in HRQoL didnot find any that was important [8, 9]. One pos-sibility is that in the former types of research therespondents may feel stigmatised or threatenedby the questionnaires. So perhaps they would tryto give different answers, intentionally or not, asthey become familiar with the topics. InHRQoL studies the respondents probably do notfeel so stigmatised as the measurements are aboutoutcomes of their diseases and are less threatening/sensitive. Another possibility is that somepsychological/psychiatric measures have morecomplicated structure, which may give rise toorder effects related to the ‘punishment hypo-thesis’ and ‘learning hypothesis’ [5]. In con-trast, HRQoL measures are usually designed to besimple.
In summary, the present study of HRQoL incancer patients did not show any order effects inthe administration of FACT-G and Quick-FLICin terms of mean values, Cronbach’s a and amountof missing values. Further studies that examine
1222
other measurement properties and extend thegeneralisability of the findings here will be useful.
Acknowledgement
This work is supported by a research grant(# NMRC/0546/2001) of the National MedicalResearch Council, Singapore.
References
1. Serdula MK, Mokdad AH, Pamuk ER, Williamson DF,
Byers T. Effects of question order on estimates of the
prevalence of attempted weight loss. Am J Epidemiol 1995;
42: 64–67.
2. Bowling A. Research Methods in Health. Buckingham:
Open University Press, 1997: 241–270.
3. Schuman H, Presser S. Questions and Answers in Attitude
Surveys. NY: Academic Press, 1981.
4. Streiner DL, Norman GR. Health Measurement Scales: A
Practical Guide to their Development and Use. Oxford:
Oxford University Press, 1989: 144.
5. Jensen PS, Watanabe HK, Richters JE. Who’s up first?
Testing for order effects in structured interviews using a
counterbalanced experimental design. J Abnorm Child
Psychol 1999; 27: 439–436.
6. Mook DG. Psychological Research: Strategy and Tactics.
NY: Harper & Row, 1982.
7. Lucas CP. The order effect: Reflections on the validity of
multiple test presentations. Psychol Med 1992; 22: 197–
202.
8. Dunn KM, Jordan K, Croft PR. Does questionnaires
structure influence response in postal surveys? J Clin Epi-
demiol 2003; 56: 10–16.
9. Kemmler G, Holzner B, Kopp M, et al. Comparison of
two quality-of-life instruments for cancer patients: The
Functional Assessment of Cancer Therapy-General and the
European Organization for Research and Treatment
of Cancer Quality of Life Questionnaire-C30. J Clin On-
col 1999; 17: 2932–2940.
10. Cheung YB, Khoo KS, Wong ZW, et al. Quick-FLIC: A
short questionnaire for assessing quality of life of cancer
patients. Acta Oncol 2003; 42: 36–42.
11. Fairclough DL. Design and Analysis of Quality of Life
Studies in Clinical Trials. London: Chapman & Hall, 2002:
37–39.
12. Mehta CR, Patel NR. A network algorithm for performing
Fisher’s exact test in r · c contingency tables. J Am Stat
Asso 1983; 78: 427–434.
13. Levene H. Robust tests for equality of variances. In: Olkin
I, et al. (eds), Contributions to Probability and Statistics.
Stanford: Stanford University Press, 1960: 278–
292.
14. Chow SC, Liu JP. Design and Analysis of Bioavaiability
and Bioequivalence Studies. New York, NY: Marcel Dek-
ker, 1992: 70–73.
15. Westlake WJ. Use of confidence intervals in analysis of
comparative bioavailability trials. J Pharm Sci 1972; 61:
1340–1341.
16. Efron B, Tibshirani R. An Introduction to the Bootstrap.
New York: Chapman & Hall, 1993.
17. Laberge M, Fournier S, Freeston MH, Ladouceur R,
Provencher MD. Strutured and free-recall measures
of worry themes: Effect of order of presentation on
worry report. J Anxiety Disord 2000; 14: 429–436.
Address for correspondence: Yin-Bun Cheung, Division of
Clinical Trials and Epidemiological Sciences, National Cancer
Centre, 11 Hospital Drive, Singapore 169610, Singapore
Phone: +65-6436-8208; Fax: +65-6225-0047
E-mail: [email protected]
1223