Embed Size (px)
Citation preview
(
.. • 1, ,.
BlM Facts Oregon and Washington
1990
u.s. Department of the Interior Bureau of Land Management
U.S. Department of the Interior BUREAU OF LAND MANAGEMENT
OREGON ST ATE OFFICE P.O. Box 2965 (1300 N.E. 44th St=t)
Portland, Oregon 97208
Dear Reader:
Before you turn to the lacts portion 01 this publication, I would like to share with you some 01 BLMs major achievements of the 1990 fiscal year in Oregon and Washington.
In continuation of a program designed to increase efficiency of public land management and optimize the utilization, conservation, and protection 01 resources, seven land exchanges involving over 26, 500 acres of Federal and private lands were consummated in FY 1990.
Three major archaeological projects were active in the Lakeview District this past summer - excavations in Warner Valley and Christmas Lake Valley, and a new paleontological project at Fossil Lake. In addition, archaeologists have been working to relocate historic mining structures in the Baker Resource Area, moving them to the new Flagstaff Hill Oregon Trail interpretive. site.
Management plans in conjunction with the Omnibus Ore90n Wild and Scenic Rivers Act, including 15 rivers under the jurisdiction 01 BLM , are proceeding according to schedule. In fiscal year 1990, the primary river planning effort was directed toward the Deschutes Wild and Scenic River in accordance with a lonnal agreement with the state 01 Oregon.
A. Two new areas witih impressive geothennal potential became available lor leasin9 under Federal mineral laws. The Army has agreed to leasing within the Yakima Firing Center in Washington, an area whose geologic strata is thought to contain large deposits 01 hydrocarbons. Legislation creating the Newberry National Volcanic Monument a1tows, for the first time, geothennalleasing in an area regarded as having the best potential in the Northwest lor development 01 geothermal resources as a source 01 electricity. Leasing in these areas will begin within the year.
Law enlorcement officers from the BLM and state and local agencies seized 6,205 marijuana plants lrom 159 gardens on BLM lands in Oregon and Washington in 1990. This crop would have had a street value 01 $302 million.
During the past fiscal year, we offered 1.169 billion board leet 01 timber lor sale. This volume, combined with the FY 1989 offerings, amounted to 14 million board leet more tihan the two year target 01 1.9 billion board leet. Timber harvest totalled 944 million board feet and this timber brought in more than $187 million in receipts. Half, or some $93.5 million, was shared with the 18 western Oregon counties.
Though laced with the challenges 01 a lack 01 lead time lor sale preparation and the additional requirements 01 working those sales through the consultation process required lor the Endangered Species Act, BLM still mana9ed to get the job done. I am proud 01 the lact that we were on target, on budget, and on time.
On our lorest lands, we planted more than 19.2 million seedlings on 38,905 acres, exceeding the FY 1989 record. The planting effort equates to a strip one mile wide and over sixty miles long.
Also in 1990, we welcomed more than 3,931 volunteers to projects on the public lands. These dedicated people contributed some 127,630 work hours at a value 01 more than $1,614,997 million.
I am proud 01 these and the other accomplishments which you will find listed in this book. The credit lor the work goes to both our employees and to the many citizens who contributed in some way, great Or small, to the stewardship 01 the public lands 01 Oregon and Washington. n AA
~~~ State Director

••
,,",YRhEWOOO A A
OIL LARD A" J------It-GUf.40AlE A A +--....J.-~-"""
GAANT'S PASS R A
-------------T-----, : I
i i_~ I
j .....~. i Will @[]l] 0~ ®tr ®m I
r--f---
\1 .('-'
BOROIER R. A.
WENATCHEE: R. A. 1 c.
L-_-------J~-t\
i ...
BAI'.[R
; I
/ ---.., t
I ~~
.~.1.(
r
BlM Offices in Oregon & Washington
Oregon State Office (503) 280-7026 D. Dean Bibles 1300 N.E. 44th Avenue State Director P.O. Box 2965 Portland, OR 97208
BUrns District (503) 573-5241 Michael T. Green HC 74-12533, Hwy. 20 West District Manager Hines, OR 97738
Coos Bay District (503) 756-0100 Melvin E. Chase 1300 Airport Lane District Manager North Bend, OR 97459
Eugene District (503) 683-6600 Ronald l. Kaufman 1255 Pearl Street District Manager P.O. Box 10226 Eugene, OR 97401
Lakeview District (503) 947-6110 Judy Nelson 1000 Ninth Street S. District Manager P.O. Box 151 Lakeview, OR 97630
Medford District (503) 770-2200 David A. Jones 3040 Biddle Road District Manager Medford, OR 97501
Prineville District (503) 447-4115 James l. Hancock 185 East 4th Street District Manager P.O. Box 550 Prineville, OR 97754
Roseburg District (503) 672-4491 James A. Moorhouse 777 N.w. Garden Valley Blvd. District Manager Roseburg, OR 97470
Salem District (503) 375-5646 Van Manning 1717 Fabry Road, S.E. District Manager Salem, OR 97306
Spokane District (509) 353-2570 Joseph K. Buesing East 4217 Main District Manager Spokane, WA 99202
Vale District (503) 473-3144 William C. Calkins 100 Oregon Street District Manager Vale, OR 97918
Ii
I ~--.-
iii
5
10
15
20
25
Contents 1 2 2 3
4
5 6 6 7 7 8 9
11
12 13 13
14
15 15 16 16 17 18 19
20 20
21 22 23
24
25 26 26 27
Iv
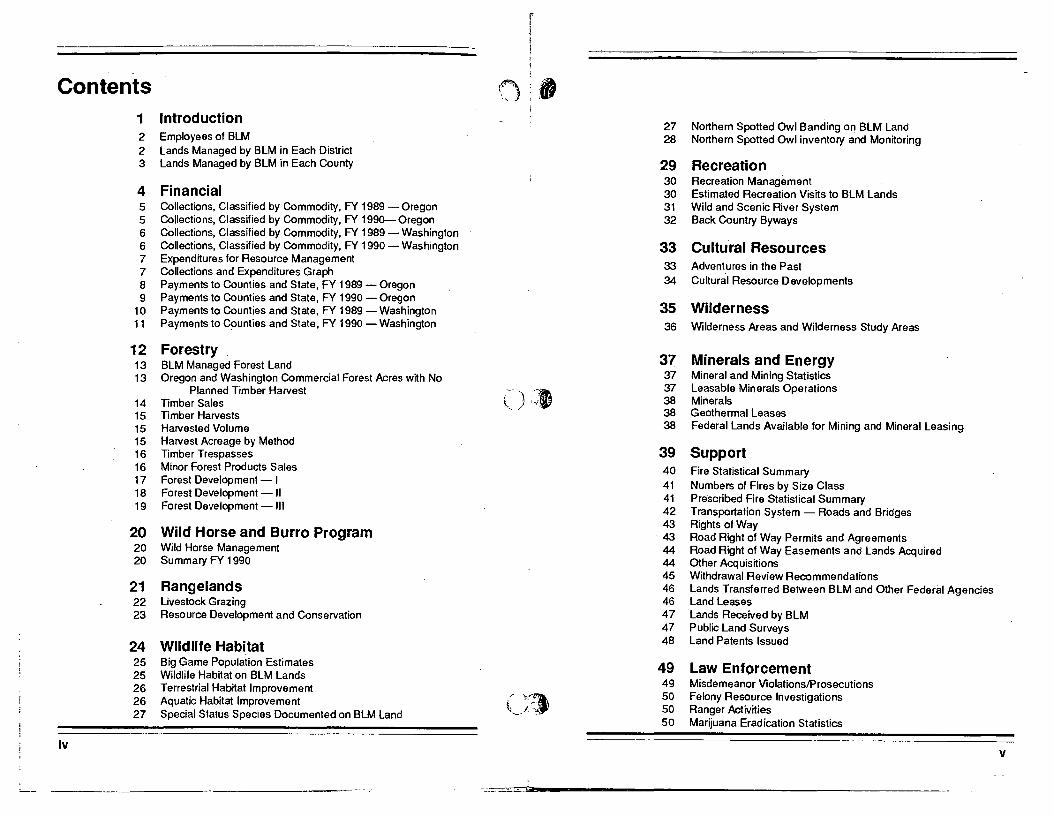
Introduction Employees of BLM Lands Managed by BLM in Each District Lands Managed by BLM in Each County
Financial Collections, Classified by Commodity, FY 1989 -Oregon Collections, Classified by Commodity, FY 1990-0regon Collections, Classified by Commodity, FY 1989 Washington Collections, Classified by Commodity, FY 1990 Washington Expenditures for Resource Management Collections and Expenditures Graph Payments to Counties and State, FY 1989 - Oregon Payments to Counties and State, FY 1990 - Oregon Payments to Counties and State, FY 1989 - Washington Payments to Counties and State, FY 1990 - Washington
Forestry BLM Managed Forest Land Oregon and Washington Commercial Forest Acres with No
Planned Timber Harvest Timber Sales Timber Harvests Harvested Volume Harvest Acreage by Method Timber Trespasses Minor Forest Products Sales Forest Development - I Forest Development - " Forest Development - III
Wild Horse and Burro Program Wild Horse Management Summary FY 1990
Rangelands Livestock Grazing Resource Development and Conservation
Wildlife Habitat Big Game Population Estimates Wildlife Habitat on BLM Lands Terrestrial Habitat Improvement Aquatic Habitat Improvement Special Status Species Documented on BLM Land
(')- t........
();'~.. ' -.;:
, / ~~ "h' \
~{._..f .....
:
27 Northern Spotted Owl Banding on BLM Land 28 Northern Spotted Owl inventory and Monitoring
29 Recreation 30 Recreation Management 30 Estimated Recreation Visits to BLM Lands 31 Wild and Scenic River System 32 Back Country Byways
33 Cultural Resources 33 Adventures in the Past 34 Cultural Resource Developments
35 Wilderness 36 Wilderness Areas and Wilderness Study Areas
37 Minerals and Energy 37 Mineral and Mining Statistics 37 Leasable Minerals Operations 38 Minerals 38 Geothermal Leases 38 Federal Lands Available for Mining and Mineral Leasing
39 Support 40 Fire Statistical Summary 41 Numbers of Fires by Size Class 41 Prescribed Fire Statistical Summary 42 Transportation System - Roads and Bridges 43 Rights of Way 43 Road Right of Way Permits and Agreements 44 Road Right of Way Easements and Lands Acquired 44 Other Acquisitions 45 Withdrawal Review Recommendations 46 Lands Transferred Between BLM and Other Federal Agencies 46 Land Leases 47 Lands Received by BLM 47 Public Land Surveys 48 Land Patents Issued
49 Law Enf()rcement 49 Misdemeanor ViolationslProsecutions 50 Felony Resource Investigations 50 Ranger Activities 50 Marijuana Eradication Statistics
• '.~ -<'
V
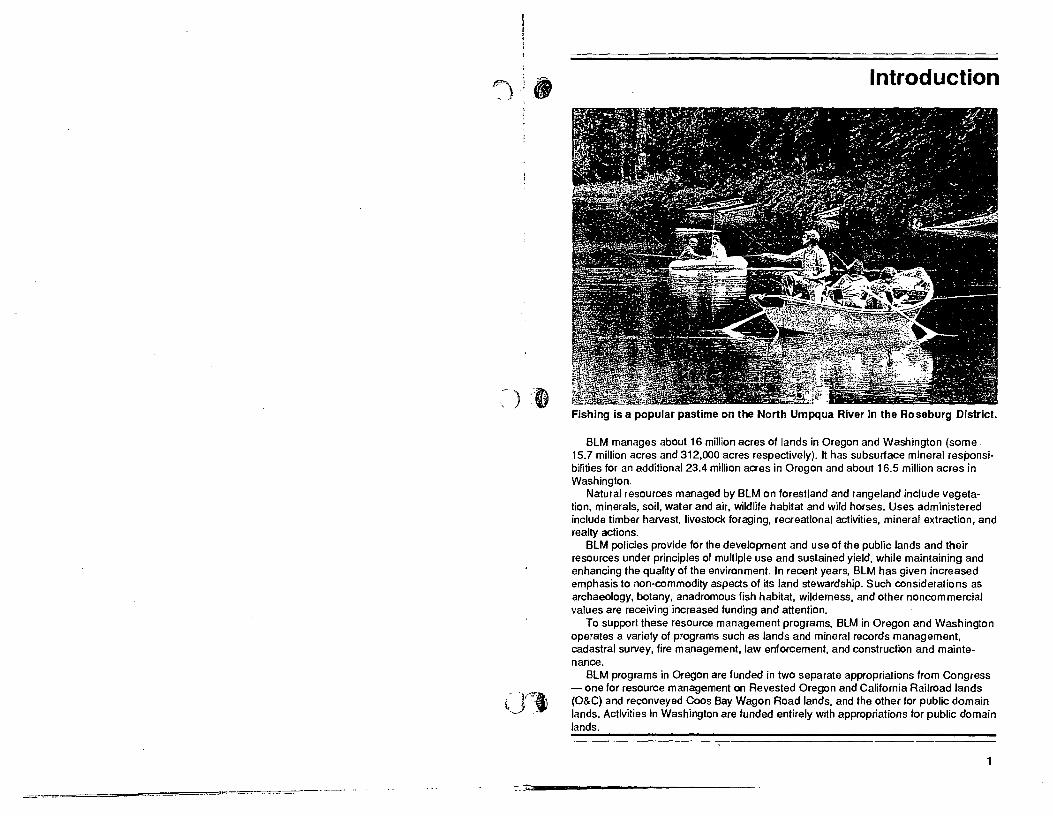
I ntrod uction
Fishing is a popular pastime on the North Umpqua River in the Roseburg District.
8lM manages about 16 million acres of lands in Oregon and Washington (some. 15.7 million acres and 312,000 acres respectively). It has subsurface mineral responsibilities for an additional 23.4 million acres in Oregon and aboUt 16.5 million acres in Washington.
Natural resources managed by BlM on forestland and rangeland include vegetation, minerals, soil, water and air, wildlife habitat and wild horses. Uses administered include timber harvest, livestock foraging, recreational activities, mineral extraction, and realty actions.
BlM policies provide for the development and use of the public lands and their resources under principles of multiple use and sustained yield, while maintaining and enhancing the quality of the environment. In recent years, 8lM has given increased emphasis to non-commodity aspects of its land stewardship. Such considerations as archaeology, botany, anadromous fish habitat, wilderness, and other noncommercial values are receiving increased funding and attention.
To support these resource management programs, 8lM in Oregon and Washington operates a variety of programs such as lands and mineral records management, cadastral survey, fire management, law enforcement, and construction and maintenance.
8lM programs in Oregon are funded in two separate appropriations from Congress - one lor resource management on Revesled Oregon and California Railroad lands
- 'I,XIf'tt ". (O&C) and reconveyed Coos 8ay Wagon Road lands, and the other lor public domain J. lands. Activities in Washington are funded entirely with appropriations for public domain
lands.
==:=--=~===-~----.--
1
------
Introduction
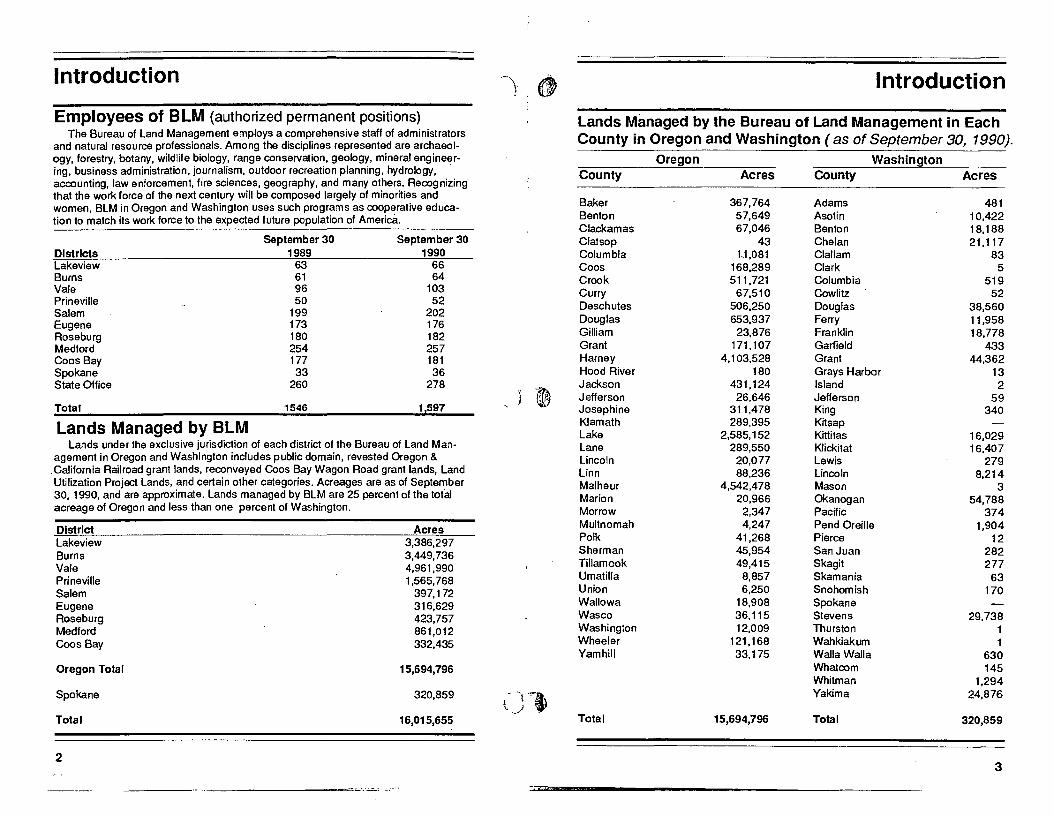
Employees of BlM (authorized permanent positions) The Bureau of land Management employs a comprehensive staff of administrators
and natural resource professionals. Among the disciplines represented are archaeology, forestry, botany, wildlife biology, range conservation, geology, mineral engineering, business administration, journalism, outdoor recreation planning, hydrology, accounting, law enforcement, fire sciences, geography, and many others. Recognizing that the work force of the next century wi" be composed largely of minorities and women, BlM in Oregon and Washington uses such programs as cooperative education to match its work force to the expected future population of America.
September 30 September 30 Districts 1989 1990 Lakeview 63 66 Bums 61 64 Vale 96 103 Prineville 50 52 Salem 199 202 Eugene 173 176 Roseburg 180 182 Medford 254 257 Coos Bay 177 181 Spokane 33 36 State Office 260 278
Total 1546 1,597
Introduction
Lands Managed by the Bureau of Land Management in Each County in Oregon and Washington (as of September 30, 1990).
Oregon Washington County Acres County Acres
Baker 367,764 Adams 481 Benton 57,649 Asotin 10,422 Clackamas 67,046 Benton 18,188 Clatsop 43 Chelan 21,117 Columbia 1J ,081 Cla"am 83 Coos 168,289 Clark 5 Crook 511,721 Columbia 519 Curry 67,510 Cowlitz 52 Deschutes 506,250 Douglas 38,560 Douglas 653,937 Ferry 11,958 Gilliam 23,876 Franklin 18,778 Grant 171,107 Garfield 433 Harney 4,103,528 Grant 44,362 Hood River 180 Grays Harbor 13 Jackson 431,124 Island 2
.~ Jefferson 26,646 Jefferson 59 Josephine 311,478 King 340 Klamath 289,395 Kitsap Lake 2,585,152 Kittitas 16,029 lane 289,550 Klickitat 16,407 lincoln 20,077 Lewis 279 Linn 88,236 lincoln 8,214 Malheur 4,542,478 Mason 3 Marion 20,966 Okanogan 54,788 Morrow 2,347 Pacific 374 Multnomah 4,247 Pend Oreille 1,904 Polk 41,268 Pierce 12 Sherman 45,954 San Juan 282 Tillamook 49,415 Skagit 277 Umatilla 8,857 Skamania 63 Union 6,250 Snohomish 170 Wallowa 18,908 Spokane Wasco 36,115 Stevens 29,738 Washington 12,009 Thurston 1 Wheeler 121,168 Wahkiakum 1 Yamhill 33,175 Walla Walla 630
Whatcom 145
-'1·1>"I Whitman Yakima
1,294 24,876
.J; Total 15,694,796 Total 320,859
lands Managed by BlM Lands under the exclusive jurisdiction of each district of the Bureau of land Man
agement in Oregon and Washington includes public domain, revested Oregon & .California Railroad grant lands, reconveyed Coos Bay Wagon Road grant lands, Land Utilization Project lands, and certain other categories. Acreages are as of September 30, 1990, and are approximate. lands managed by BLM are 25 percent of the total acreage of Oregon and less than one percent of Washington.
District Acres Lakeview 3,386,297 Burns 3,449,736 Vale 4,961,990 Prineville 1,565,768 Salem 397,172 Eugene 316,629 Roseburg 423,757 Medford 861,012 Coos Bay 332,435
Oregon Total 15,694,796
Spokane 320,859
Total 16,015,655
, j.iliil
2 3
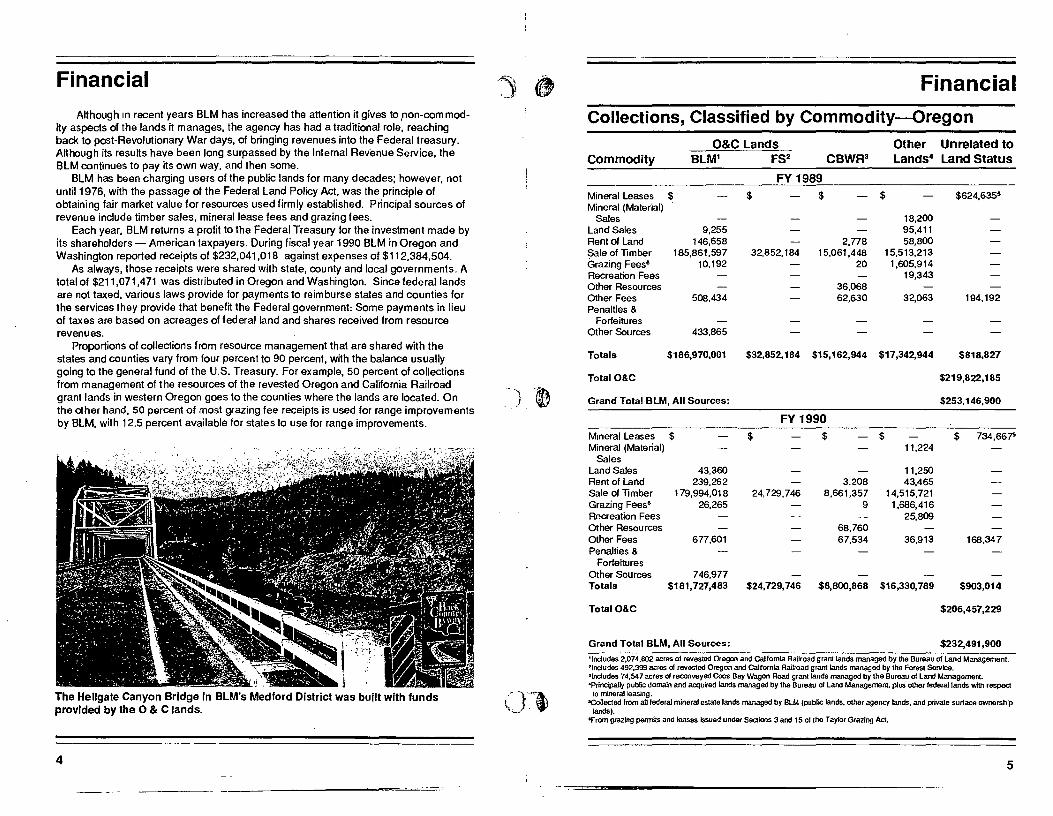
Financial Although in recent years BlM has increased the attention it gives to ,non-com mod
ity aspects of the lands it manages, the agency has had a traditional role, reaching back to post-Revolutionary War days, of bringing revenues into the Federal treasury. Although its results have been long surpassed by the Internal Revenue Service, the BlM continues to pay its own way, and then some.
BlM has been charging users of the public lands for many decades; however, not until 1976, with the passage of the Federal land Policy Act, was the principle of obtaining fair market value for resources used firm Iy established. Principal sources of revenue include timber sales, mineral lease fees and grazing fees.
Each year, BlM returns a profit to the Federal Treasury for the investment made by its shareholders - American taxpayers. During fiscal year 1990 BlM in Oregon and Washington reported receipts of $232,041,018 against expenses of $112,384,504.
As always, those receipts were shared with state, county and local governments. A total of $211,071,471 was distributed in Oregon and Washington. Since federal lands are not taxed, various laws provide for payments to reimburse states and counties for the services they provide that benefit the Federal government: Some payments in lieu of taxes are based on acreages of federal land and shares received from resource revenues.
Proportions of collections from resource management that are shared with the states and counties vary from four percent to 90 percent, with the balance usually going to the general fund of the U.S. Treasury. For example, 50 percent of collections from management of the resources of the revested Oregon and California Railroad grant lands in western Oregon goes to the counties where the lands are located. On the other hand, 50 percent of most grazing fee receipts is used for range improvements by BlM, with 12.5 percent available for states to use for range improvements.
The Hellgate Canyon Bridge In BlM's Medford District was built with funds provided by the 0 & C lands.
Financial
Collections, Classified by Commodity-Oregon
O&C Lands Other Unrelated to CommOdity BLM! FS2 CBWR3 Lands4 Land Status
FY 1989 Mineral Leases $ $ $ $ $624,635" Mineral (Material)
Sales 18,200 land Sales 9,255 95,411 Rental Land 146,658 2,778 58,800 Sale 01 Timber 185,861,597 32,852,184 15,061,448 15,513,213 Grazing Fees· 10,192 20 1,605,914 Recreation Fees 19,343 Other Resources 36,068 Other Fees 508,434 62,630 32,063 194,192 Penalties &
Forfeitures Other Sources 433,865
Totals $186,970,001 $32,852,184 $15,162,944 $17,342,944 $818,827
TotalO&C $219,822,185
) " ..~
Grand Total BlM, All Sources: $253,146,900
FY 1990 Mineral Leases $ $ $ $ $ 734,667" Mineral (Material) 11,224
Sales land Sales 43,360 11,250 Rent 01 Land 239,262 3,208 43,465 Sale 01 Timber 179,994,018 24,729,746 8,661,357 14,515,721 Grazing Fees· 26,265 9 1,686,416 Recreation Fees 25,809 Other Resources 68,760 Other Fees 677,601 67,534 36,913 168,347 Penalties &
Forfeitures Other Sources 746,977 Totals $181,727,483 $24,729,746 $8,800,868 $16,330,789 $903,014
TotalO&C $206,457,229
Grand Total BlM, All Sources: $232,491,900
'Includes 2,074,602 acres of revested Oregon and California Rai~oad grant lands managed by the Bureau 01 land Management 'Includes 492,399 acres of revested Oregon and CaI~ornia Railroad grant lands managed by the Forest Service. 'indudes 74,547 acres of reconveyed Coos Bay Wagon Road granllands managed by the Bureau of Land Management. 'Principally public domain and acquired lands managed by the Bureau of Land Manageroont. pius other federal lands with respect
10 mineral leasing. 'CoDeded from ail federal mineral eslatelands managed by BLM (public lands, other agency lands. and private surface ownership
lands). 'From grazing permits and teases issued under Sections 3 and t5 ollhe Taylor Grazing Act.
4 5
Financial Collections, Classified by Commodity-Washington Commodity BLM Lands Unrelated to Status
FY 1989
Mineral Leases' Mineral Material Sales Land Sales Rent of Land Sale of Timber Grazing Sec. 15 Recreation Fees Other Resources Other Fees Penalties & Forfeitures Other Sources
Total
Grand Total, All Sources:
Mineral Leases' Mineral Material Sales Land Sales Rent of Land Sale of Timber Grazing Sec. 15 Recreation Fees Other Resources Other Fees Penalties & Forfeitures Other Sources
Total
Grand Total, All Sources:
$ $646,843 57,058 63,893
5,926 82,931 43,646
61,218 15,652 7,379
62,376
$392,700 $654,222
$1,046,922
FY 1990
$ $344,548
41,702 6,386
120,513 46,114
8,334 1,305
59,422
282,471 345,853
$628,324
'Collected from aI/federal mineral estate lands managed by BLM (public lands, other agency lands, and private surface ownership lands).
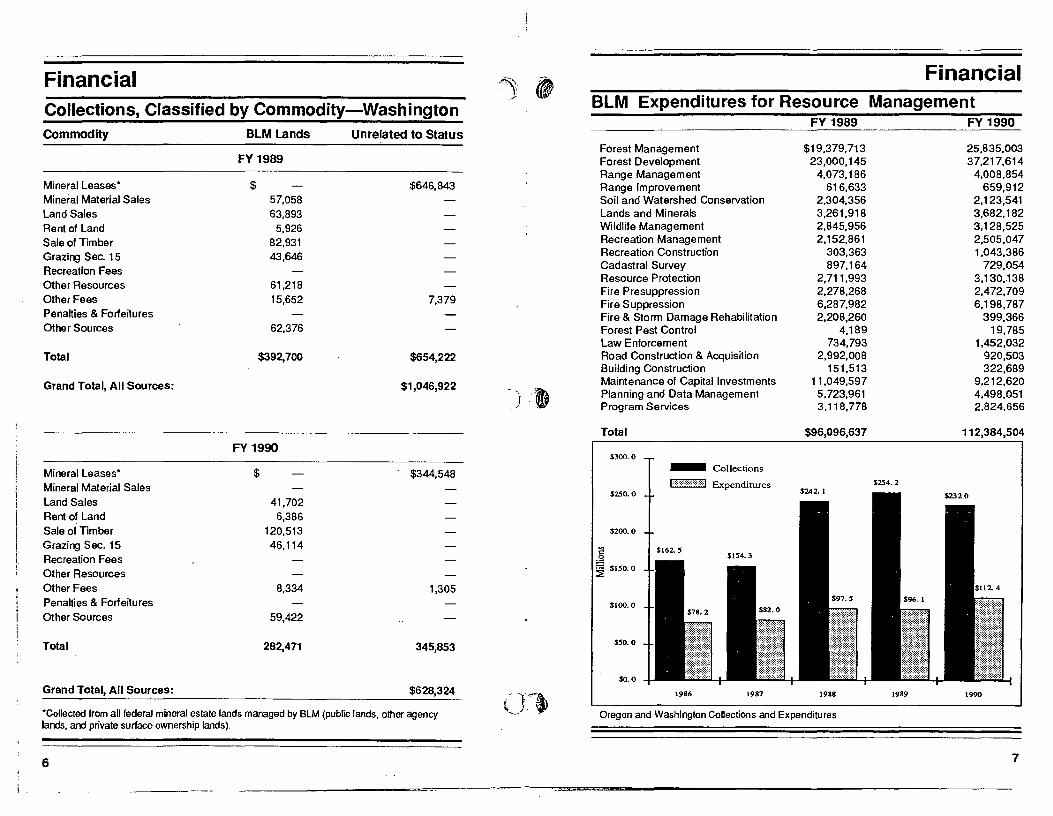
Financial BLM Expenditures for Resource Management
FY 1989 FY 1990
Forest Management Forest Development Range Management Range Improvement Soil and Watershed Conservation Lands and Minerals Wildlife Management Recreation Management Recreation Construction Cadastral Survey Resource Protection Fire Presuppression Fire Suppression Fire & Storm Damage Rehabilitation Forest Pest Control Law Enforcement Road Construction & Acquisition Building Construction Maintenance of Capital Investments Planning and Data Management Program Services
Total
$19,379,713 23,000,145
4,073,186 616,633
2,304,356 3,261,918 2,845,956 2,152,861
303,363 897,164
2,711,993 2,278,268 6,287,982 2,208,260
4,189 734,793
2,992,008 151,513
11,049,597 5,723,961 3,118,778
$96,096,637
25,835,003 37,217,614
4,008,854 659,912
2,123,541 3,682,182 3,128,525 2,505,047 1,043,386
729,054 3,130,.138 2,472,709. 6,198,787
399,366 19,785
1,452,032 920,503 322,689
9,212,620 4,498,051 2,824,656
112,384,504
$300.0
$250.0
$200.0
~~ ~ $150.0
$100.0
$50.0
$0.0
_ Collections
1"""""""""',',',',1 Expenditures
1986 1987 1988
$254.2
1989 1990
Oregon and Washington Collections and Expenditures
6 7

Financial Financial \, ~ " ~ Payments to Counties and State, FY 1990 - Oregon
Resource Sec. 15 PaymentsPayments to Counties and State, FY 1989 - Oregon Management Minerai Grazing inUeu Counties O&CLands Leasing' Leases of Taxes Totals
Resource Sec. 15 Payments Baker $ $ 508 $ $ 101,799 $102,307Management Minerai Grazing InUeu Benton 5,724,284 2,084 5,724,284
Counties O&CLands Leasing' Leases of Taxes Totals Clackamas 11,305,971 23,855 51,470 11,381,296 Clatsop 105 315 420 Columbia 4,196,450 4,025 4,200,475
Baker $ $ 565 $ $ 101,744 $ 102,309 Coos 12,739,5212 1,202 18 6,967 12,747,708 Benton 3,065,703 2,032 3,067,735 Crook 76,312 829 93,867 171,008 Clackamas 6,042,285 7,667 51,470 6,101,422 Curry 7,435,458 59,048 7,494,506 Clatsop 105 315 420 Deschutes 60,541 1,080 143,043 204,664 Columbia 2,228,657 5,032 2,233,689 Douglas 51,138,049" 2,340 111 94,196 51,234,696 Coos 7,285,785 1,202 15 6,967 7,293,969 Gilliam 9,905 6,199 7,899 24,003 Crook 44,994 363 93,896 139,253 Grant 16,218 31,580 174,733 222,531 Curry 3,921,045 59,051 3,980,096 Hamey 13,550 3,287 328,000 344,837 Deschutes 41,598 362 143,061 185,021 Hood River 20,962 20,962 Douglas 27,482,823 2,498 55 94,195 27,579,571 Jackson 31,921,543 7,262 5,298 46,719 31,980822 Gilliam 10,540 2,547 4,373 17,460 Jefferson =- 36,482 2,511 29,234 68,227 Grant 16,218 13,656 174,177 204,051 Josephine 24,608,311 58 34,942 24,643,311 Hamey 10,973 1,566 308,000 320,539 Klamath 4,766,842 8,886 214,486 4,990,214 Hood River 21,016 21,016 Lake 203 328,000 328,203 Jackson 17,059,930 7,423 1,283 46,711 17,115,347 Lane 31,106,698 250 11 137,274 31,244,233 Jefferson 14,090 1,037 29,234 44,361 Lincoln 733,360 26 18,340 751,726 Josephine 12,977,482 47 34,928 13,012,457 Linn 5,377,975 6,497 48,332 5,432,804 Klamath 2,547,558 14,292 3,508 214,491 2,779;849 Malheur 5,669 630,910 637,196 Lake 79 308,000 308,079 Marion 2,974,183 9,540 20,478 3,004,201 Lane 16,693,830 107 9 137,244 16,831,190 Morrow 12,029 402 15,431 27,862-)t;Uncaln 391,932 20 18,344 410,296 Multnomah 2,220,452 7,227 2,227,679 Unn 2,902,990 7,525 48,332 2,958,847 Polk 4,400,162 4,400,162 Malheur 6,907 646,617 653,524 Sherman 5,744 4,419 27,078 37,241 Marion 1,590,479 3,240 20,478 1,614,197 Tillamook 1,140,783 20 9,398 1,150,201 Morrow 24,654 169 15,966 40,789 Umatilla 9.037 1,896 41,629 52,562 Multnomah 1,186,683 7,185 1,193,868 Union 2,832 488 62,313 65,654 Polk 2,351,592 2,351,592 f' Wallowa 3,137 116,313 119,450-Sherman 6,091 1,990 28,461 36,542 Wasco 36,057 7,870 20,834 64,761 TIllamook 620,409 20 9,399 629,828 Washington 1,283,380 340 291 1,284,011 Umatilla 20,036 802 42,726 63,564 Wheeler 30,496 9,580 28,886 68,962 Union 2,835 273 62,312 65,420 Yamhill 1,466,721 2,564 1,469,285 Wallowa 1,302 116,313 117,615 Total $204,540,143*' $370,816 $87,889* $2,925,062 $207,923,910 Wasco 12,028 3,467 20,668 36,163 Washington 691,267 340 291 691,898 Payment to State 01 Oregon Irom sale 01 public domain timber, materials, and lands, totaling Wheeler 23,870 3,908 28,620 56,398 $ 1,138,308 and Section 3 grazing permits totaling_$386,266 ....................$1,524,574' Yamhill 809,693 62 2,564 812,319 Total payments to counties and state, FY 1990 ••••••••••••••••••••• , ••••$209,448,484 Total $109,850,143 $284,932 $36,438 $2,899,181 $113,070,694
Distribution of proceeds to Oregon counties and to the State of Oregon derived from resource Payment to State 01 Oregon from sale of public domain timber, materials, and lands, totaling management on lands managed by the Bureau 01 Land Management in Oregon. Revenues are $468,127and Section 3 grazing permits totaling $154,557 ...................... $622,684 from sales of timber, grazing fees, mineral fees, rental and sales of land, P.I.LT., and from other Payment to State 01 Oregon Irom mineral leasing. . . . . . . . . . . . . . . . . . . . . . . . . . . . .. $4,077 sources. Total payments to counties and state, FY·1989 ••• , •••••••••..••••••••• $113,697,455 Distribution of proceeds to Oregon counties and to the State of Oregon deriVed from resource , Includes FY 1990 payments for 10 months of lands and materials sales and 11 months of management on lands managed by the Bureau 01 Land Management in Oregon. Revenues are grazing lees paid at the end of FY 1990 rather than at the beginning of the next Fiscal Year as in from sales of timber, grazing fees, mineral fees, rental and sales 01 land, P.I.LT., and from other the past. sources.
'Does not inctude lnlnerals proceeds from O&C or CBWR lands, but does include proceeds from rental and bonus payments on federany held leases
'Does not inctude minerals proceeds from O&C or CBWR lands, bu1 does Indude proceeds from rental and bonus payments on 'Includes $720,561 01 CBWR. federally held leases 'Includes $108.397 of CBWR. 'Includes $844,455 of CBWR • Amount adually paid during the fiscal Yoal, 1011189 through S'3OI9O. See table on page 5 for to1al O&C receipts. 'lndudes S 135,685 01 CBWR. • Amount acluanypaid during lhe fiscal yeaJ. 10111881hrough 9130189. See lable on page 5 for lo1a1 O&C receipts.
8 9
-~~-------------------------------------------------
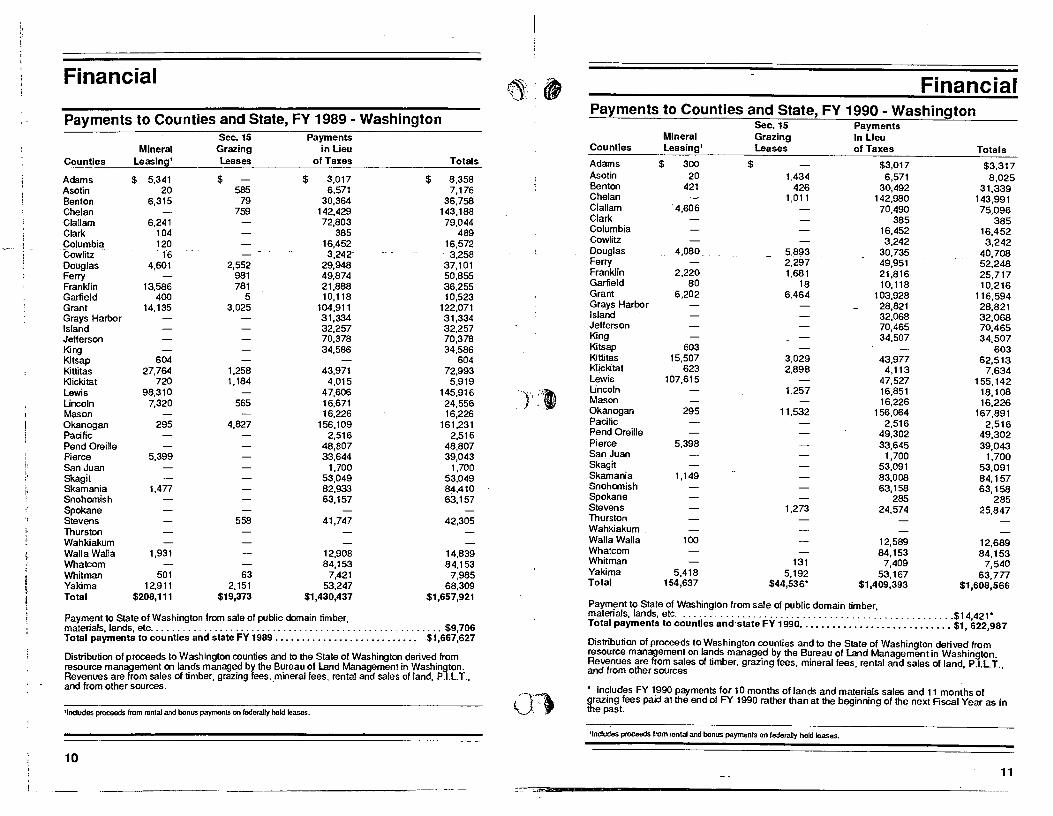
Financial Financial Payments to Counties and State, FY 1990 - Washington
Payments to Counties and State, FY 1989 - Washington Sec. 15 Payments Sec. 15 Payments Mineral Grazing In lieu
Mineral Grazing in Ueu Counties leasing' leases of Taxes Totals Counties leasing' leases of Taxes Totals Adams $ 300 $ $3,017 $3,317
Asotin 20 1,434 6,571Adams $ 5,341 $ $ 3,017 $ 8,358 8,025 Asotin 20 585 6,571 7,176 Benton 421 426 30,492 31,339 Benton 6,315 79 30,364 36,758 Chelan 1,011 142,980 143,991
Clallam 4,606Chelan 759 142,429 143,188 70,490 75,096 ClarkClallam 6,241 72,803 79,044 385 385 ColumbiaClark 104 385 489 16,452 16,452 Cowlitz 3,242Columbia 120 16,452 16,572 3,242 Douglas 4,080 5,893 30,735Cowlitz 16 3,242- - 3,258 40,708
Douglas 4,601 2,552 29,948 37,101 Ferry 2,297 49,951 52,248 Franklin 2,220 1,681 21,816Ferry 981 49,874 50,855 25,717Garfield 80 18 10,118 10,216Franklin 13,586 781 21,888 36,255 Grant 6,202Garfield 400 5 10,118 10,523 6,464 103,928 116,594Grays Harbor Grant 14,135 3,025 104,911 122,071 28,821 28,821IslandGrays Harbor 31,334 31,334 32,068 32,068Jefferson 70,465Island 32,257 32,257 70,465
Jefferson 70,378 70,378 King 34,507 34,507 King 34,586 34,586 603Kitsap 603 Kitsap 604 604 Kittitas 15,507 3,029 43,977 62,513
Klickitat 623Kittitas 27,764 1,258 43,971 72,993 2,898 4,113 7,634 Klickitat 720 1,184 4,015 5,919 Lewis 107,615 47,527 155,142 Lewis 98,310 47,606 145,916 Lincoln 1,257 16,851 18,108 Lincoln 7,320 565 16,671 24,556 Mason 16,226 16,226
Okanogan 295 11,532 156,064Mason 16,226 16,226 167,891 Pacific 2,516Okanogan 295 4,827 156,109 161,231 2,516PendOreilie 49,302 49,302Pacific 2,516 2,516
Pend Oreille 48,807 48,807 Pierce 5,398 33,645 39,043 Pierce 5,399 33,644 39,043 1,700 1,700San Juan San Juan 1,700 1,700 53,091 53,091Skagit Skagit 53,049 53,049 83,008 84,157Skamania 1,149 Skamania 1,477 82,933 84,410 63,158 63,158Snohomish
SpokaneSnohomish 63,157 63,157 285 285 Spokane 25,847Stevens 1,273 24,574 Stevens 558 41,747 42,305 Thurston Thurston Wahkiakum Wahkiakum 12,589 12,689Walla Walla 100
WhatcomWalla Walla 1,931 12,908 14,839 84,153 84,153Whitman 131Whatcom 84,153 84,153 7,409 7,540Yakima 5,418 5,192Whitman 501 63 7,421 7,985 53,167 63,777
Yakima 12,911 2,151 53,247 68,309 Total 154,637 $44,536' $1,409,393 $1,608,566 Total $208,111 $19,373 $1,430,437 $1,657,921
Paym~nt to State of Washington from sale of public domain timber, matenals, lands, etc ...................................................$14421'Payment to State of Washington from sale of public domain timber, Total payments to counties and-state FY 1990•.•.•••••••••••.••••••••••.• $1, 622,987 materials,lands, etc ...... _........ , ....................................... $9,706
Total payments to counties and state FY 1989..... ••. ••••••. ••.••••••• •• $1,667,627 Distribution of proceeds to Washington counties and to the State of Washington derived from resource management on lands managed by the Bureau of land Management in WashingtonDistribution of proceeds to Washington counties and to the State of Washington derived from Revenues are from sales of timber, grazing fees, mineral fees, rental and sales of land P.l.l iresource management on lands managed by the Bureau of land Management in Washington. and from other sources ' ..,
Revenues are from sales of timber, grazing fees,.mineral fees, rental and sales of land, P.I.l.T., and from other sources. , In/?Iudes FY 1.990 payments for 10 months 01 lands and materials sales and 11 mon;hs of
grazing fees paid at the end of FY 1990 rather than at the beginning of the next Fiscal Year as in the past. 'Includes proceeds from rental and bonus payments on federally held leases.
'Indudes proceeds from rental and bonus payments on federaDy held leases.
10 11
.&
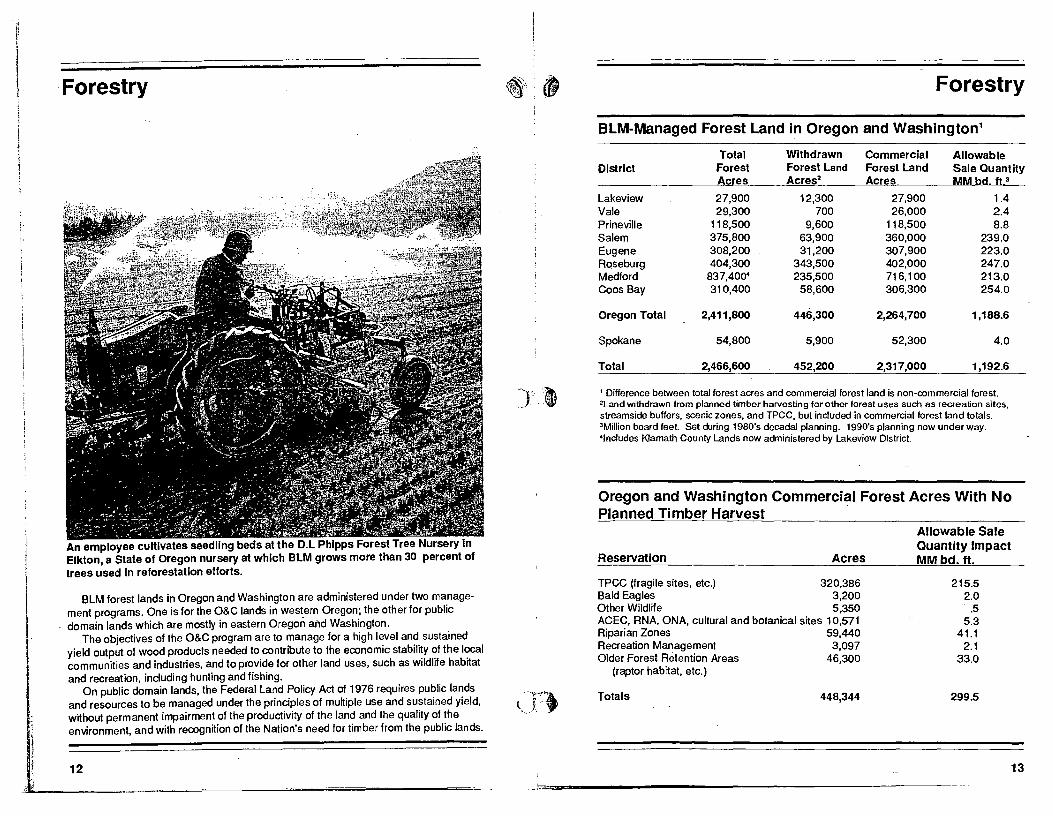
Forestry
An employee cultivates seedling beds at the D.l Phipps Forest Tree Nursery In Elkton, a State of Oregon nursery at which BlM grows more than 30 percent of trees used in reforestation efforts.
BLM forest lands in Oregon and Washington are administered under two management programs. One is for the O&C lands in western Oregon; the other for public domain lands which are mostly in eastern Oregon and Washington.
The objectives of the O&C program are to manage for a high level and sustained yield output of wood products needed to contribute to the economic stability of the local communities and industries, and to provide for other land uses, such as wildlife habitat and recreation, induding hunting and fishing.
On public domain lands, the Federal Land Policy Act of 1976 requires public lands and resources to be managed under the principles of multiple use and sustained yield, without permanent impairment of the productivity of the land and the quality of the environment, and with recognition of the Nation's need for timber from the public lands.
12
Forestry
BlM-Managed Forest Land in Oregon and Washington'
Total Withdrawn Commercial Allowable District Forest Forest Land Forest land Sale Quantity
Acres Acres2 AC[!i!s MM bd ft,
Lakeview 27,900 12,300 27,900 1.4 Vale 29,300 700 26,000 2.4 Prineville 118,500 9,600 118,500 8.8 Salem 375,800 63,900 360,000 239.0 Eugene 308,200 31,200 307,900 223.0 Rqseburg 404,300 343,500 402,000 247.0 Medford 837,400" 235,500 716,100 213.0 Coos Bay 310,400 58,600 306,300 254.0
Oregon Total 2,411,800 446,300 2,264,700 1,188.6
Spokane 54,800 5,900 52,300 4.0
Total 2,466,600 452,200 2,317,000 1,192.6
1 Difference between total forest acres and commerciallorest land is non-commercial forest. 2Land withdrawn from planned timber harvesting for other forest uses such as recreation sites, streamside buffers. scenic zones, and TPCC, but included in commercial forest land totals. 3Million board feet. Set during 1980's decadal planning. 1990's planning now under way. 'Includes Klamath County Lands now administered by Lakeview District.
Oregon and Washington Commercial Forest Acres With No Planned Timber Harvest
Reservation Acres
TPCC (fragile sites, etc.) 320,386 Bald Eagles 3,200 Other Wildlife 5,350 ACEC, RNA, ONA, cultural and botanical sites 10,571 Riparian Zones 59,440 Recreation Management 3,097 Older Forest Retention Areas 46,300
(raptor habitat, etc.)
Totals 448,344
Allowable Sale Quantity Impact MMbd. ft.
215.5 2.0
.5 5.3
41.1 2.1
33.0
299.5
13
Forestry
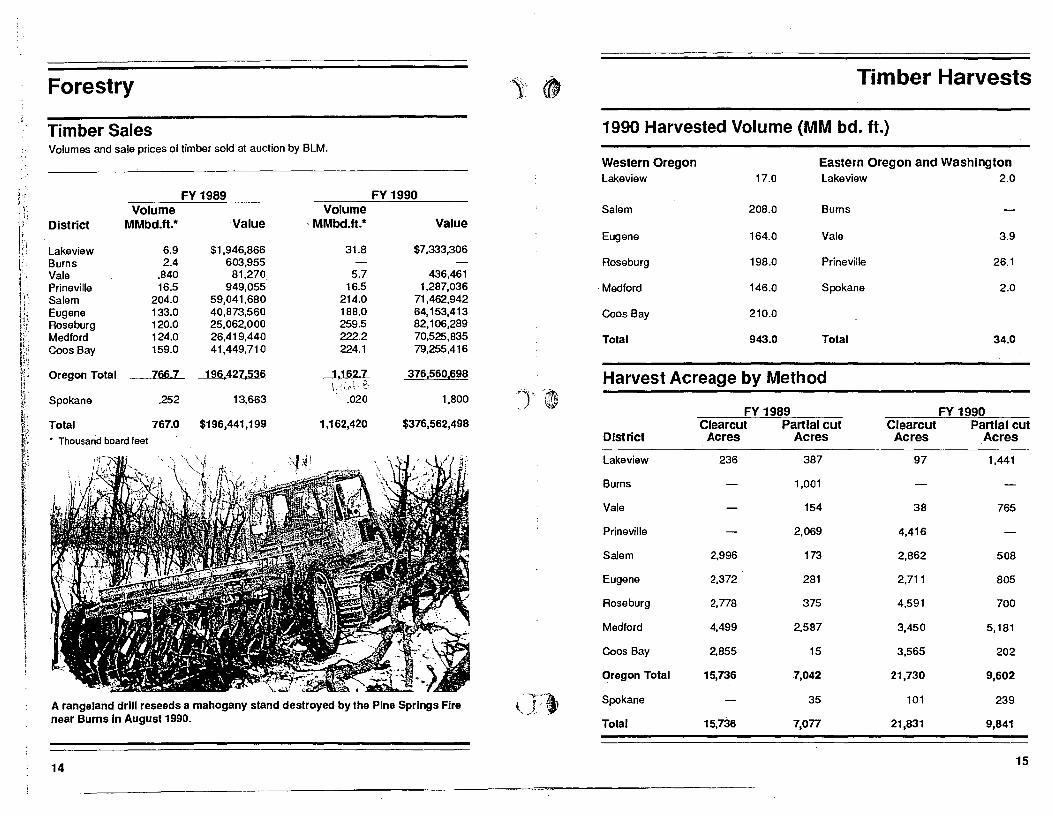
Timber Sales Volumes and sale prices of timber sold at auction by BlM.
District
lakeview Burns Vale Prineville Salem Eugene Roseburg Medford Coos Bay
Oregon Total
Spokane
Total
Volume MMbd.ft.*
6.9 2.4
.840 16.5
204.0 133.0 120.0 124.0 159.0
1661
.252
767.0
• Thousand board feet
FY 1989
Value
$1,946,866 603,955
81,270 949,055
59,041,680 40,873,560 25,062,000 26,419,440 41,449,710
196,421,536
13,663
$196,441,199
Volume , MMbd.ft.*
31.8
5.7 16.5
214.0 188.0 259.5 222.2 224.1
1.162.1 \)1L'!t. &
.020
1,162,420
FY1990
Value
$7,333,306
436,461 1,287,036
71,462,942 64,153,413 82,106,289 70,525,835 79,255,416
376,560,698
1,800
$376,562,498
A rangeland drill reseeds a mahogany stand destroyed by the Pine Springs Fire near Burns In August 1990.
14
J'.~ ~, '
<J'}
Timber Harvests
1990 Harvested Volume (MM bd. ft.)
Western Oregon lakeview 17.0
Salem 208.0
Eugene 164.0
Roseburg 198.0
Medford 146.0
Coos Bay 210.0
Total 943.0
Eastern Oregon and Washington lakeview 2.0
Burns
Vale 3.9
Prineville 26.1
Spokane 2.0
Total 34.0
Harvest Acreage by Method
FY 1989 FY 1990 Clearcut Partial cut Clearcut Partial cut
District Acres Acres Acres Acres
lakeview 236 387 97 1,441
Burns 1,001
Vale 154 38 765
Prineville 2,069 4,416
Salem 2,996 173 2,862 508
Eugene 2,372 281 2,711 805
Roseburg 2,778 375 4,591 700
Medford 4,499 2,587 3,450 5,181
Coos Bay 2,855 15 3,565 202
Oregon Total 15,736 7,042 21,730 9,602
Spokane 35 101 239
Total 15,736 7,077 21,831 9,841
15
Forestry
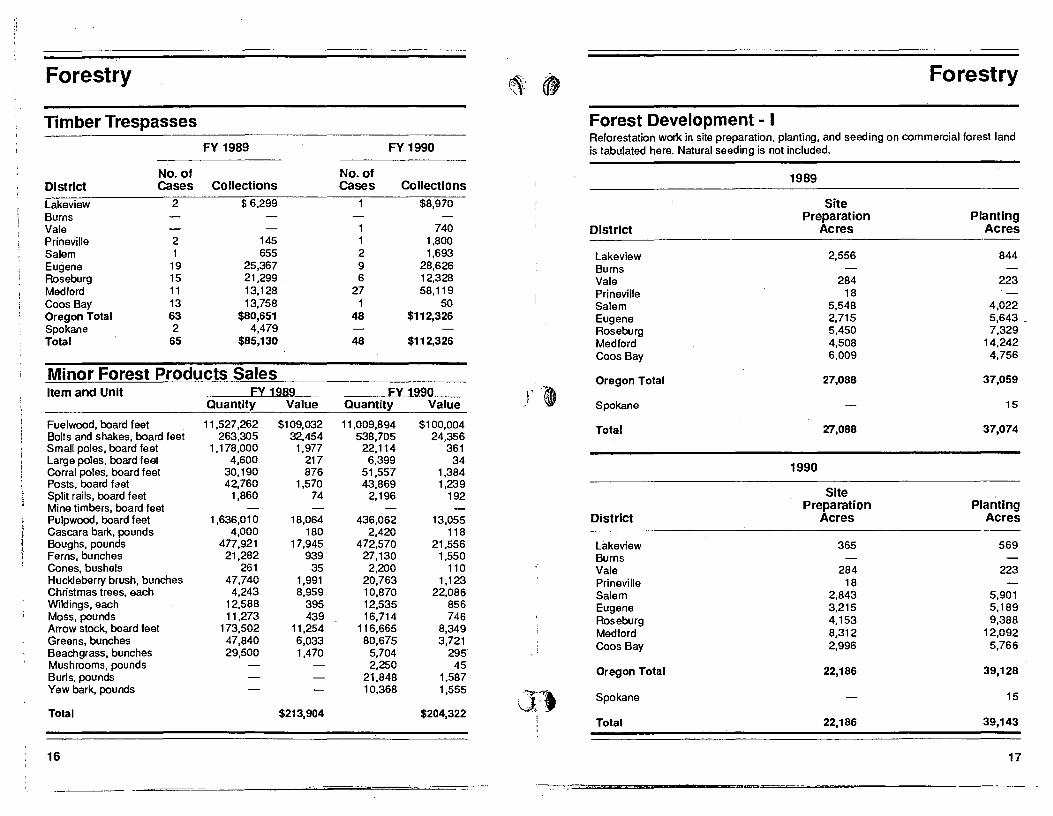
Timber Trespasses FY 1989
No. of District Cases Collections
Lakeview 2 $ 6,299 Burns Vale Prineville 2 145 Salem 1 655 Eugene 19 25,367 Roseburg 15 21,299 _ Medford 11 13,128 Coos Bay 13 13,758 Oregon Total 63 $80,651 Spokane 2 4,479 Total 65 $85,130
Minor Forest Products Sales Item and Unit
Fuelwood, board feet Bolts and shakes, board feet Small poles, board feet Large poles, board feet Corral poles, board feet Posts, board faet Split rails, board feet Mine timbers, board feet Pulpwood, board feet Cascara bark, pounds Boughs,pounds Ferns, bunches Cones, bushels Huckleberry brush, bunches Christmas trees, each Wildings, each Moss, pounds Arrow stock, board feet Greens, bunches Beachgrass, bunches Mushrooms, pounds Burls, pounds Yew bark, pounds
Total
16
FY 1989 Quantity Value
11,527,262 $109,032 263,305 32,454
1,178,000 1,977 4,600 217
30,190 876 42,760 1,570
1,860 74
1,636,010 4,000
477,921 21,282
261 47,740
4,243 12,588 11,273
173,502 47,840 29,500
18,064 180
17,945 939
35 1,991 8,959
395 439
11,254 6,033 1,470
$213,904
FY 1990
No. of Cases Collections
1 $8,970
1 740 1 1,800 2 1,693 9 28,626 6 12,328
27 58,119 1 50
48 $112,326
48 $112,326
FY 1990 )' '-~ Quantity Value
11,009,894 $100,004 538,705 24,356
22,114 361 6,399 34
51,557 1,384 43,869 1,239
2,196 192
436,062 13,055 2,420 118
472,570 21,556 27,130 1,550
2,200 110 20,763 1,123 10,870 22,086 12,535 856 16,714 746
116,665 8,349 80,675 3,721
5,704 295 2,250 45
21,848 1,587 10,368 1,555
-~~t \J--$204,322
-.'..; ,
Forestry
Forest Development - I Reforestation work in site preparation, planting, and seeding on commercial forest land is tabulated here. Natural seeding is not included.
District
Lakeview Burns Vale Prineville Salem Eugene Roseburg Medford Coos Bay
Oregon Total
Spokane
Total
District
Lakeview Burns Vale Prineville Salem Eugene Roseburg Medford Coos Bay
Oregon Total
Spokane
Total
"
1989
Site Preparation
Acres
1990
2,556
284 18
5,548 2,715 5,450 4,508 6,009
27,088
27,088
Site Preparation
Acres
365
284 18
2,843 3,215 4,153 8,312 2,996
22,186
22,186
Planting Acres
844
223
4,022 5,643 _ 7,329
14,242 4,756
37,059
15
37,074
Planting Acres
569
223
5,901 5,189 9,388
12,092 5,766
39,128
15
39,143
17
Forestry-
Forest Development - II
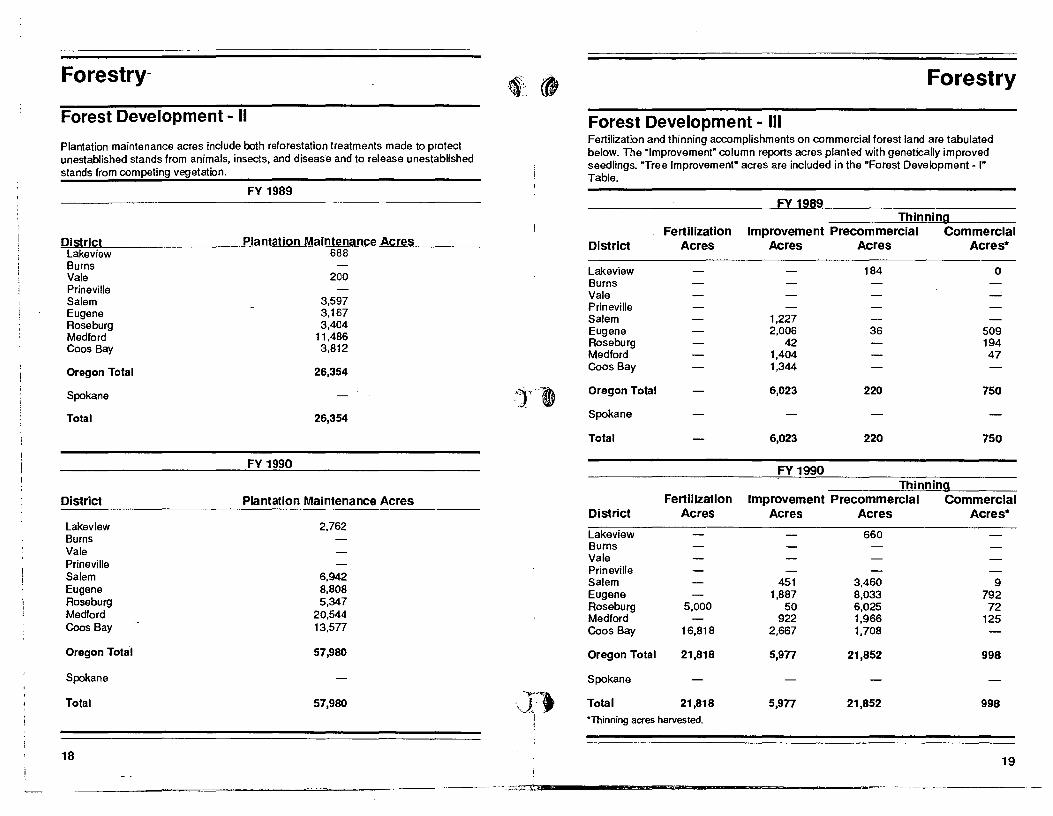
Plantation maintenance acres include both reforestation treatments made to protect unestablished stands from animals, insects, and disease and to release unestablished stands from competing vegetation.
District Lakeview Burns Vale Prineville Salem Eugene Roseburg Medford Coos Bay
Oregon Total
Spokane
Total
District
Lakeview Burns Vale Prineville Salem Eugene Roseburg Medford Coos Bay
Oregon Total
Spokane
Total
18
FY 1989
Plantation Maintenance Acres
FY 1990
688
200
3,597 3,167 3,404
11,486 3,812
26,354
26,354
Plantation Maintenance Acres
2,762
6,942 8,808 5,347
20,544 13,577
57,980
57,980
Forestry
Forest Development - III Fertilization and thinning accomplishments on commercial forest land are tabulated below. The "Improvement" column reports acres planted with genetically improved seedlings. "Tree Improvement" acres are included in the "Forest Development - I" Table.
District
Lakeview Burns Vale Prineville Salem Eugene Roseburg Medford Coos Bay
Oregon Total
Spokane
Total
District
Lakeview Burns Vale Prineville Salem Eugene Roseburg Medford Coos Bay
Oregon Total
Spokane
Total
Fertilization Acres
Fertilization Acres
5,000
16,818
21,818
21,818
"Thinning acres harvested.
FY 1989 Thinning
Improvement Precommerclal Commercial Acres Acres Acres*
1,227 2,006
42 1,404 1,344
6,023
6,023
FY 1990
184
36
220
220
Thinning
o
509 194 47
750
750
Improvement Precommerclal Commercial Acres Acres Acres*
660
451 3,460 9 1,887 8,033 792
50 6,025 72 922 1,966 125
2,667 1,708
5,9n 21,852 998
5,9n 21,852 998
19
20 ; 21
~ Rangelands ~~ ~ ~
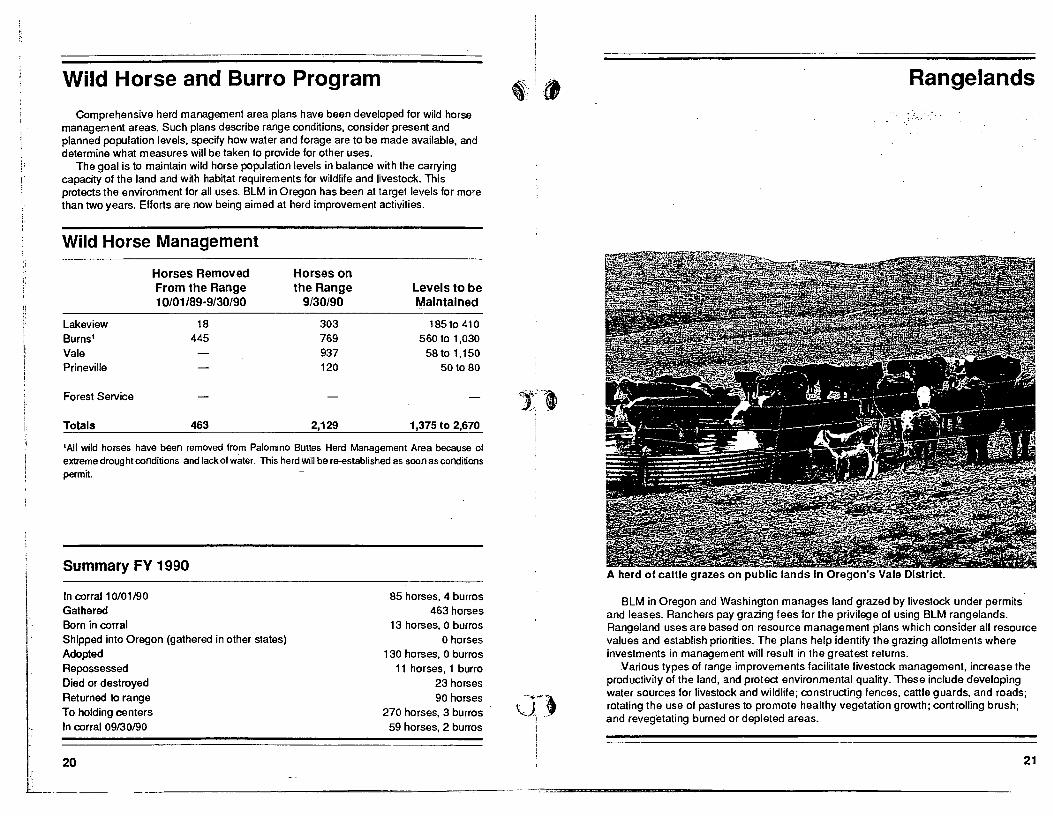
" Wild Horse and Burro Program ' Comprehensive herd management area plans have been developed for wild horse ~ management areas. Such plans describe range conditions, consider present and • planned population levels, specify how water and forage are to be made available, and ~ determine what measures will be taken to provide for oiher uses.
The goal is to maintain wild horse population leveis in balance with ihe carrying ~ capacity of the land and with habitat requirements for wildlife and livestock. This ~ protects the environment for all uses. BLM in Oregon has been at target leveis for more
than iwo years. Efforts are now being aimed at herd improvement activities. i
Wild Horse Management
~~ Horses Removed Horses on From the Range the Range Levels to be
'~; 10/01/89-9/30/90 9l30/90 Maintained
~ Lakeview 18 303 185 to 410 ~ Burns' 445 769 560 to 1,030 Ii Vale — 937 58to 1,150 ~ Prineville — 120 50 to 80
Forest Service — — —
Totals 463 2,129 1.375 to
'All wild horses have been removed from Palomino Buttes Herd Management Area because of extreme drought conditions and lackof water. This herd will be re-established as soon as conditions permit. -
Summary FY 1990
85 horses, 4 burros BLM in Oregon and Washington manages land grazed by livestock under permits 463 horses and leases. Ranchers pay grazing fees for the privilege of using BLM rangelands.
- 13 horses, 0 burros Rangeland uses are based on resource management plans which consider all resource 0 horses values and establish priorities. The plans help identify the grazing allotments where
130 horses, 0 burros investments in management will resuh in the greatest returns. 11 horses, 1 burro Various types of range improvements facilitate livestodc management, increase the
23 horses productivity of the land, and protect environmental quality. These include developing
90 horses --~- ° water sources for livestock and wildlife; constructing fences, cattle guards, and roads;
270 horses, 3 burros ~~. _~ rotating the use of pastures to promote healthy vegetation growth; controlling brush; ~ and revegetating burned or depleted areas.
59 horses, 2 burros ! i
In corral 10/01/90 Gathered Born in corral Shipped into Oregon (gathered in other states) Adopted Repassessed
Died or destroyed Returned to range To ho ►ding centers In corral 09/30/90
A herd of cattle grazes on public lands in Oregon's Vale District_
~~: ~
Rangelands ~> ~ Rangelands
Livestock Grazing .:. . .'1
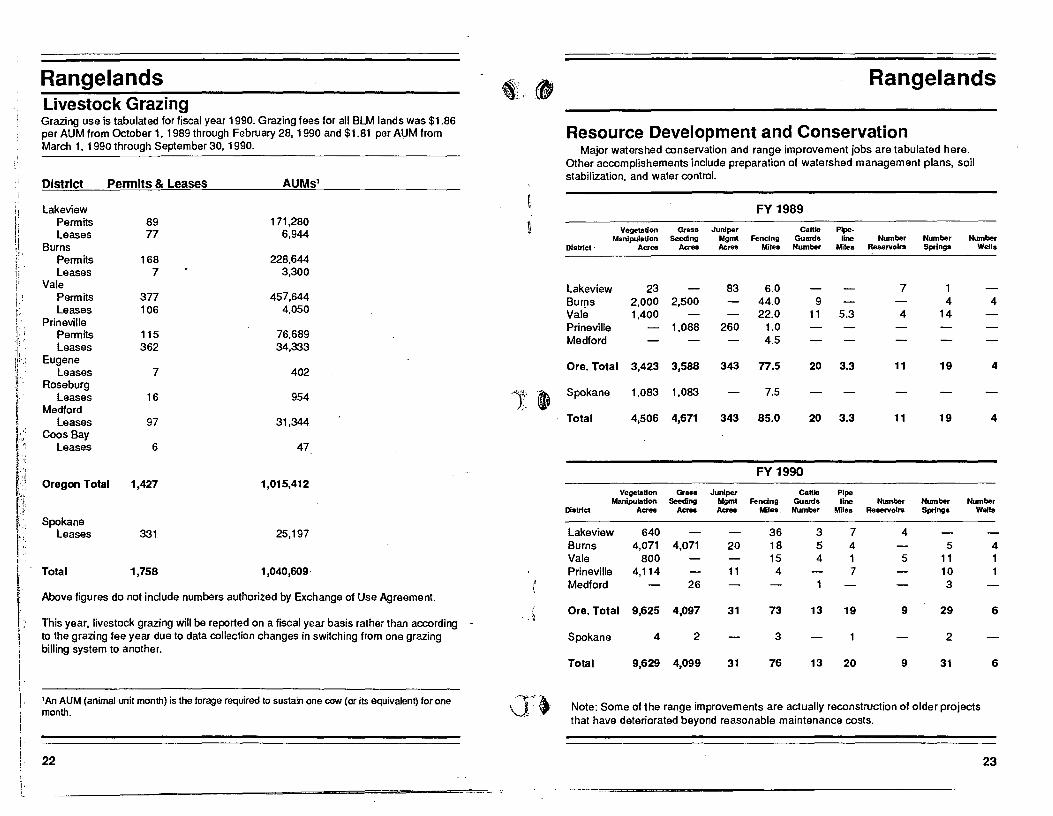
Grazing use is tabulated for fiscal year 1990. Grazing fees for all BLM lands was $1.86 Resource Development and Conservation per AUM from October 1, 1989 through February 28, 1990 and $1.81 per A{jM from
March 1, 1990 through September 30, 1990. Major watershed conservation and range improvement jobs are tabulated here. Other accomplishements include preparation of watershed management plans, soil
District Penn its & Leases AUMs' stabilization, and water control.
:i Lakeview FY 1989 ., Permits 89 171,280
H Leases 77 6,944 Vegetation Grass Juniper Cattle Pipe· Manipulation Seeding Mgmt fencing Guard. fine Number Number Number
it Burns Dislrlct Acres Acres Acres Miles Number Miles Reservoirs Springs Well. if<
Permits 168 228,644 i Ii Leases 7 3,300
Vale Lakeview 23 83 6.0 7 1 : Permits 377 457,644 Burns 2,000 2,500 44.0 9 4 4 !. t, Leases 106 4,050 Vale 1,400 22.0 11 5.3 4 14 t· Prineville Prineville 1,088 260 1.0 j; ;
Permits 115 76,689 .\': .. Medford 4.5 r Leases 362 34,333 .1
Eugene ir'·i, Leases 7 402 Ore. Total 3,423 3,588 343 77.5 20 3.3 11 19 4
ti: Roseburg
I' Leases 16 954 r:X: .~ Spokane 1,083 1,083 7.5
Medford " , Leases 97 31,344 Total 4,506 4,671 343 85.0 20 3.3 11 19 4 i,< Coos Bay I;~ . ' Leases 6 47 I·, ; "
r"! FY 1990
~ :'1 Oregon Total 1,427 1,015,412
It Vegetation Grass Juniper Callie Pipe Manlpuletlon Seeding Mgm1 fencing Guard. line Number Number Number
r District Acree Acres Acree Miles. Number Miles Reservoirs Springs Welh,
Spokane Leases 331 25,197 Lakeview 640 36 3 7 4
,. Burns 4,071 4,071 20 18 5 4 5 4 i, Vale 800 15 4 1 5 11 1
i Total 1,758 1,040,609 Prineville 4,114 11 4 7 10
t· Medford 26 3 ,. Above figures do not include numbers authorized by Exchange of Use Agreement.
l. . b Ore. Total 9,625 4,097 31 73 13 19 9 29 6 This year, livestock grazing will be reported on a fiscal year basis rather than according -
" I to the grazing fee year due to data collection changes in switching from one grazing Spokane 4 2 3 2
i billing system to another.
I Total 9,629 4,099 31 76 13 20 9 31 6
I
!. IAn AUM (animal unit month) is the forage required to sustain one row (or its equivalent) for one 0-. Note: Some of the range improvements are actually reconstruction of older projects month. that have deteriorated beyond reasonable maintenance costs.
22 23
L
, . d'
, ::
., '1 'I ii
\.
I .
\'
~ .
I
L ..
Wildlife Habitat
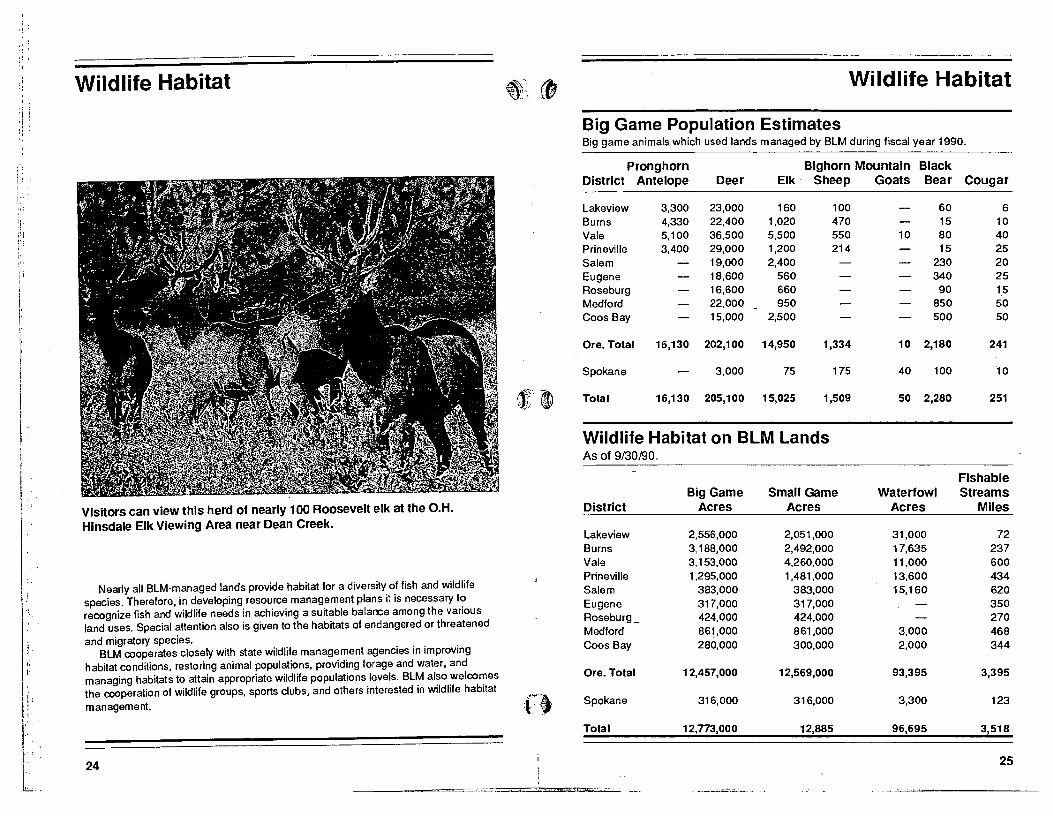
VlsHors can view this herd of nearly 100 Roosevelt elk at the O.H. Hinsdale Elk Viewing Area near Dean Creek.
Nearly all BlM-managed lands provide habitat for a diversity of fish and wildlife species. Therefore, in developing resource management plans it is necessary to recognize fish and wildlife needs in achieving a suitable balance among the various land uses. Special attention also is given to the habitats of endangered or threatened and migratory species.
BlM cooperates closely with state wildlife management agencies in improving habitat conditions, restoring animal popUlations, providing forage and water, and managing habitats to attain appropriate wildlife populations levels. BlM also welcomes the cooperation of wildlife groups, sports clubs, and others interested in wildlife habitat
management.
24
~.,
~" .ct1
1~ ~ \~.j.: :>. >
f'~
Wildlife Habitat
Big Game Population Estimates Big game animals which used lands managed by BlM during fiscal year 1990.
Pronghorn Bighorn Mountain Black District Antelope Deer Elk Sheep Goats Bear Cougar
lakeview 3,300 23,000 160 100 60 6 Burns 4,330 22,400 1,020 470 15 10 Vale 5,100 36,500 5,500 550 10 80 40 Prineville 3,400 29,000 1,200 214 15 25 Salem 19,000 2,400 230 20 Eugene 18,600 560 340 25 Roseburg 16,600 660 90 15 Medford 22,000 950 850 50 Coos Bay 15,000 2,500 500 50
Ore. Total 16,130 202,100 14,950 1,334 10 2,180 241
Spokane 3,000 75 175 40 100 10
Total 16,130 205,100 15,025 1,509 50 2,280 251
Wildlife Habitat on BlM lands As of 9/30/90.
Fishable Big Game Small Game Waterfowl Streams
District Acres Acres Acres Miles
lakeview 2,556,000 2,051,000 31,000 72 Burns 3,188,000 2,492,000 17,635 237 Vale 3,153,000 4,260,000 11,000 600 Prineville 1,295,000 1,481,000 13,600 434 Salem 383,000 383,000 15,160 620 Eugene 317,000 317,000 350 Roseburg_ 424,000 424,000 270 Medford 861,000 861,000 3,000 468 Coos Bay 280,000 300,000 2,000 344
Ore. Total 12,457,000 12,569,000 93,395 3,395
Spokane 316,000 316,000 3,300 123
Total 12,773,000 12,885 96,695 3,518
25
.---~.::..:---.
: i: ..
: i 'i J ~. 1
!.; 1
,I "
Ii. ; . ~ \"' '!j:
. i .
Ii,
." j'
:i I: " ,
,
I !
,
Wildlife Habitat
Terrestrial Habitat Improvement Water
Brush Control Grass/legume Fencing Development Acres Seeding, Acres' Miles Number
District 1989 1990 1989 1990 1989 1990 1989 1990
Lakeview 400 7 15 10 2 Burns 7' 1 6 1 7 Vale 405' 3 4 Prineville 280 30 280 2 7 Salem Eugene Roseburg 34 120 Medford 600 565 Coos Bay 1,810 1,109 2' 2'
Ore. Total 412 280 2,875 2,075 27 22 24 4
Spokane 3' 54 1s
Total 415 280 2,875 2,075 32 23 24 4
'Prescribed burn 'Artnlclal Nest boxes 1\Natat facilities br(l.rov9d 'Wetlands Improved 'Fence'modWicalion
Aquatic Habitat Improvement1
Spawning' Improved' Stream' and/or Fish In stream
Clearance Rearing Passage Structures Miles Area Miles Miles Number
District 1989 1990 1989 1990 1989 1990 1989 1990
Lakeview 1 Burns 3 Vale Prineville 15 20 15 Salem 1 153 571 Eugene 100 Roseburg 8 Medford 1 2 108 Coos Bay 11 5 10 11 26
Ore. Total 31 26 100 12 172 720
Spokane 5 2
Total 31 26 100 12 In 722
'Mies refer to numbe, 01 stream miles where fish production will be Increased by the projects. 'Removal 01 debris lams. 'Also Includes slrerurbank stablDzation. 'Includes fish passage over watatfaBs and dams and through culverts. 'Indudes new projeclS and Irnpravemant "'existing water.
I 26
L
Other Wildlife
Improvements 1989 1990
193 5 63 2' & 14
300s 3P
22 13 -3s 62
331 45
62 54 & 92
337 59
Improved5
Lakes and Reservoirs
Acres 1989 1990
Wildlife Habitat
. II ~ :(t<
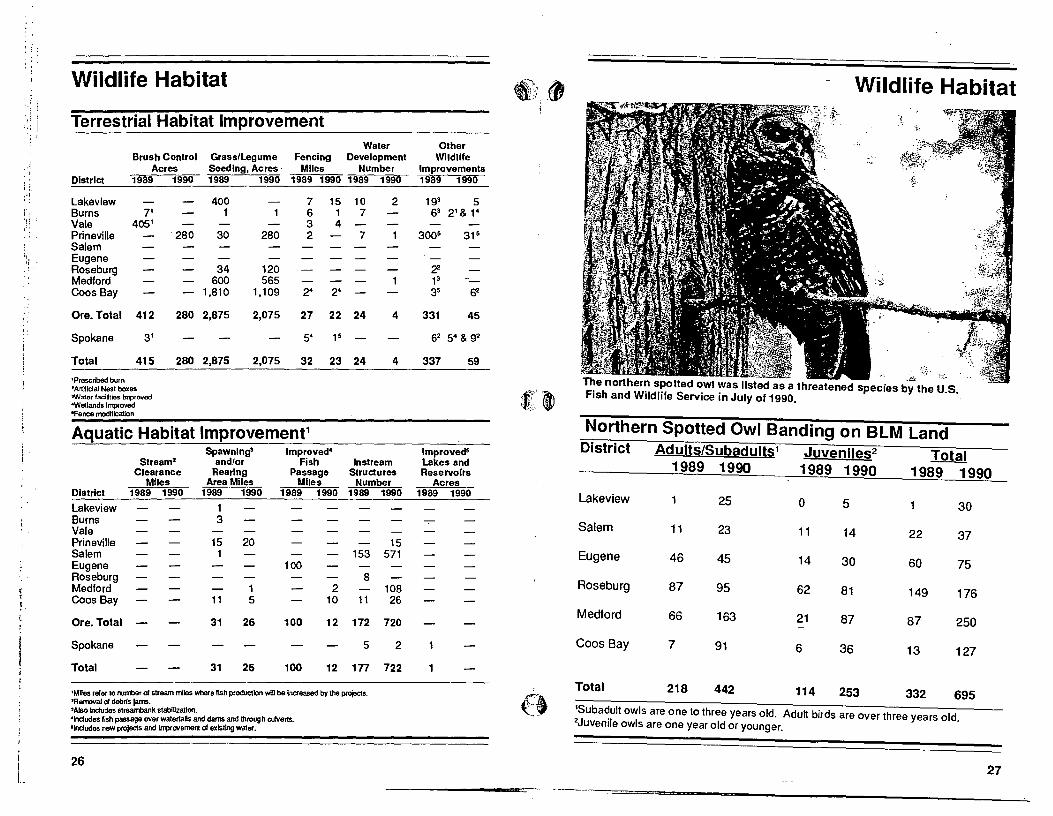
T~e northern spotted owl was listed as a threatened spe~ies b; the ~'s FfSh and Wildlife Service in July of 1990. . .
Northern Spotted Owl Banding on BlM land District Adults/Subadults1
1989 1990 Juveniles2
1989 1990 Total
1989 1990
Lakeview 25 0 5 30
Salem 11 23 11 14 22 37
Eugene 46 45 14 30 60 75
Roseburg 87 95 62 81 149 176
Medford 66 163 21 87 87 250
Coos Bay 7 91 6 36 13 127
Total 218 442 114 253 332 695 ~Suba~ult owls are one to three years old. Adult birds are over three years old Juvenrle owls are one year old or younger. .
27
I I'
'I'
I ,': ; , I: ' ,
':1 Wildlife Habitat i I Northern Spotted Owl Inventory and Monitoring
:; I ~ I
Juveniles District Confirmed Single I Unoccupied Total Pairs Unconfirmed Sites Sites Counted
Pairs Visited
1989 1990 1989 1990 1989 1990 1989 1990 1989 1990
., Lakeview 2 11 3 3 0 0 5 14 0 5 i
I· '6 8 59 69 19 23
I Salem 39 47 14 14 l!
Eugene 44 56 23 57 12 9 79 122 19 33
Roseburg 117 151 46 46 26 31 189 228 66 97
Medford 98 167 32 51 22 42 152 260 29 127
Coos Bay 23 54 26 13 3 52 68 13 44
Total 323 486 144 184 69 91 536 761 146 329
Special Status Species Documented on BlM land
~ Fedii!rilll~ Listed Sgii!~Iii!S E~d~rill CilndidiU~ SI2~Iii!s
WilshlngtQn Orii!gQn Wilshlngton OregQn
Birds 3 5 4 6
Fish 0 6 0 9
Mammals 2 2 0 0
Reptiles/amphibians 0 0 0 2
TQtal animals 5 13 4 17
TQtal plants 0 2 14 69
28
~.~
('.'~
i -t (
Recreation
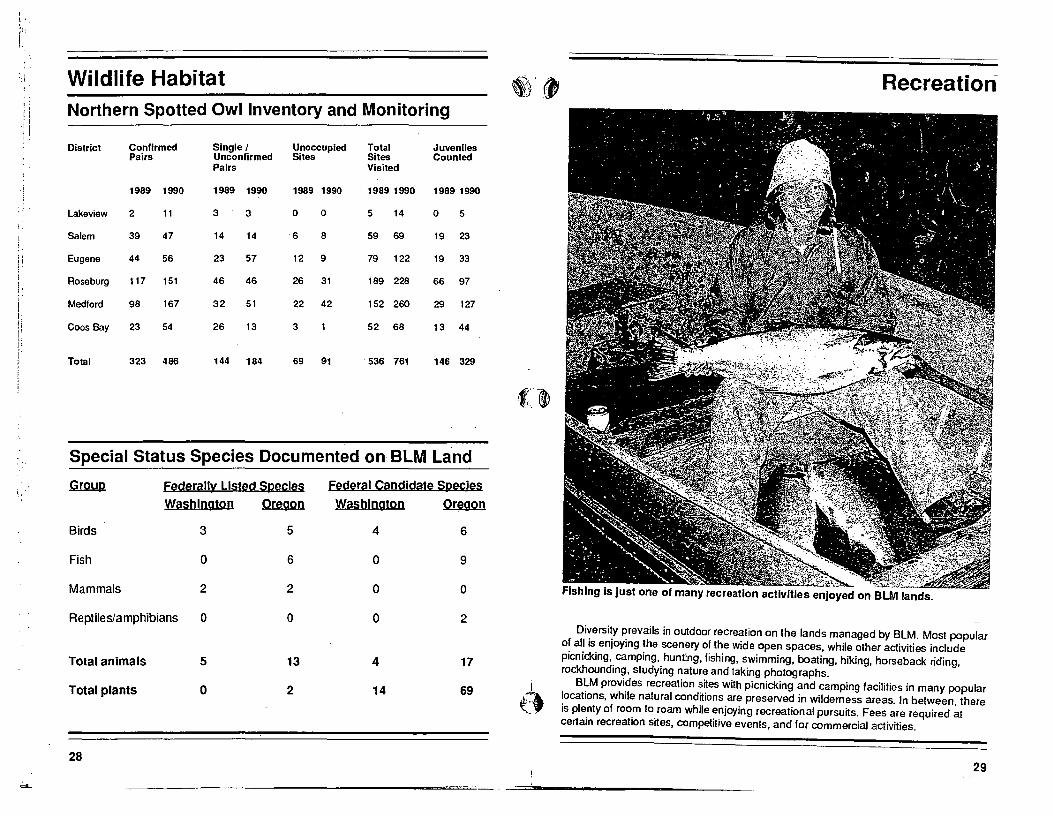
Fishing Is just one of many recreation activities enjoyed on BLM lands.
Diversity prevails in outdoor recreation on the lands managed by BLM. Most popular of ail is enjoying the scenery of the wide open spaces, while other activities include picnicking, camping, hunting, fishing, swimming, boating, hiking, horseback riding, rockhounding, studying nature and taking photographs.
BLM provides recreation sites with picnicking and camping facilities in many popular locations, while natural conditions are preserved in wilderness areas. In between, there is plenty of room to roam while enjoying recreational pursuits. Fees are required at certain recreation sites, competitive events, and for commercial activities.
29
Recreation
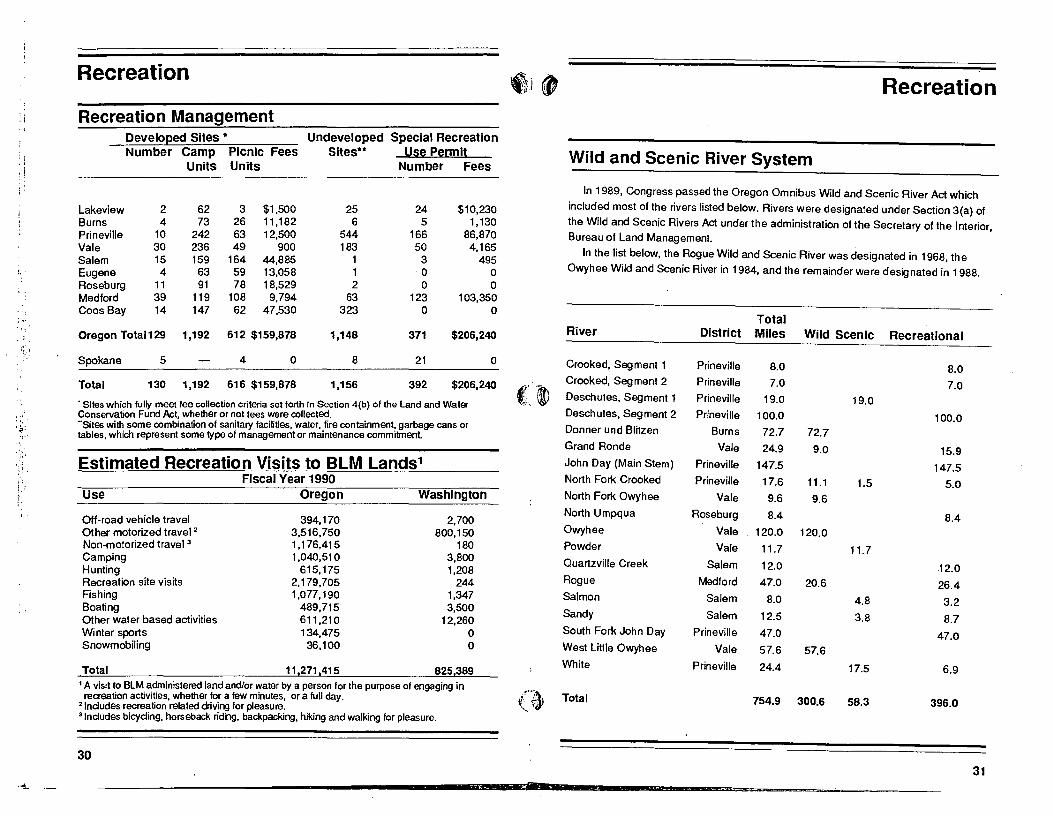
; i Recreation Management
:1
t,'
;"
!; . " " 1·: i ;'
.~.
Developed Sites * Undeveloped Special Recreation Number Camp Picnic Fees
Units Units Sites** Use Permit
Lakeview 2 Burns 4 Prineville 10 Vale 30 Salem 15 Eugene 4 Roseburg 11 Medford 39 Coos Bay 14
Oregon Total 129
Spokane 5
62 73
242 236 159 63 91
119 147
1,192
3 $1,500 26 11,182 63 12,500 49 900
164 44,885 59 13,058 78 18,529
108 9,794 62 47,530
612 $159,878
4 o
Total 130 1,192 616 $159,878
25 6
544 183
1 1 2
63 323
1,148
8
1,156
Number Fees
24 5
166 50
3 o o
123 o
371
21
392
$10,230 1,130
86,870 4,165
495 o o
103,350 o
$206,240
o
$206,240
• Sites which fully meet fee collection criteria set forth in Section 4(b) of the land and Water Conservation Fund kt, whether or not fees were collected. "Sites with some combination of sanitary facilities, water, fire containment, garbage cans or tables, which represent some type of management or maintenance commitment.
Estimated Recreation Visits to BlM lands1
Use
Off-road vehicle travel Other motorized travel 2
Non-motorized travel 3
Camping Hunting Recreation site visits Fishing Boating Other water based activities Wi nter sports Snowmobiling
Total
Fiscal Year 1990 Oregon
394,170 3,516,750 1,176,415 1,040,510
615,175 2,179,705 1,077,190
489,715 611,210 134,475
36,100
11,271,415
Washington
2,700 800,150
180 3,800 1,208
244 1,347 3,500
12,260 o o
825,389 1 A visit to BlM administered land and/or water by a person for the purpose of engaging in rea-eation activities, whether for a few minutes, or a full day.
21ndudes recreation related driving for pleasure. 'Indudes bicyding, horseback riding, backpacking, hiking and walking for pleasure.
30
Recreation
Wild and Scenic River System
In 1989, Congress passed the Oregon Omnibus Wild and Scenic River Act which
included most of the rivers listed below. Rivers were designate.d under Section 3(a) of
the Wild and Scenic Rivers Act under the administration of the Secretary of the Interior, Bureau of Land Management.
In the list below, the Rogue Wild and Scenic River was designated in 1968, the
Owyhee Wild and Scenic River in 1984, and the remainder were designated in 1988.
River
Crooked, Segment 1
Crooked, Segment 2
(' .. ~) Deschutes, Segment 1
Deschutes, Segment 2
Donner und Blitzen
Grand Ronde
John Day (Main Stem)
North Fork Crooked
North Fork Owyhee
North Umpqua
Owyhee
Powder
Quartzville Creek
Rogue
Salmon
Sandy
South Fork John Day
West Little Owyhee
White
(l Total
Total District Miles Wild Scenic Recreational
Prineville 8.0
Prineville 7.0
Prineville 19.0
Prineville 100.0
Burns 72.7
Vale 24.9
Prineville 147.5
Prineville 17.6
Vale 9.6
Roseburg
Vale
Vale
Salem
Medford
Salem
Salem
Prineville
Vale
Prineville
8.4
120.0
11.7
12.0
47.0
8.0
12.5
47.0
57.6
24.4
72.7
9.0
11.1
9.6
120.0
20.6
57.6
754.9 300.6
19.0
1.5
11.7
4.8
3.8
17.5
58.3
8.0
7.0
100.0
15.9
147.5
5.0
8.4
12.0
26.4
3.2
8.7
47.0
6.9
396.0
31
" , ,
~
Recreation
Back County Byways
In 1989, BLM designated 11 National Back County Byways in ?~egon. The byway program responds to the public demand for pleasur~ dnvm.g .. opportunities, while enhancing recreation experiences and Informmg VISitors
about public land resources.
District Byway Road Types
Lakeview Christmas Valley 102 paved, gravel
Lakeview Lakeview to Steens 91 paved, gravel
and Burns
Burns Steens Mountains 66 gravel
"Diamond Loop 64 paved
Vale Leslie Gulch! 50 gravel, dirt
Succor Creek
·Snake River! 130 paved, gravel, dirt
Morman Basin
Prineville Lower Deschutes River 39 paved, gravel
Lower Crooked River 43 paved, gravel
South Fork John Day River 43 paved, gravel
Salem Nestucca River 48 paved, gravel
South Fork Alsea River 11 paved, gravel
Medford Galice-Helgate 39 paved
Grave Creek to Marial 33 paved
·In the coming year, twO additional Byways will be dedicated,
32 iid
f ~' ~', ,-;
~ t,
,IJ;
Cultural Resources Developments
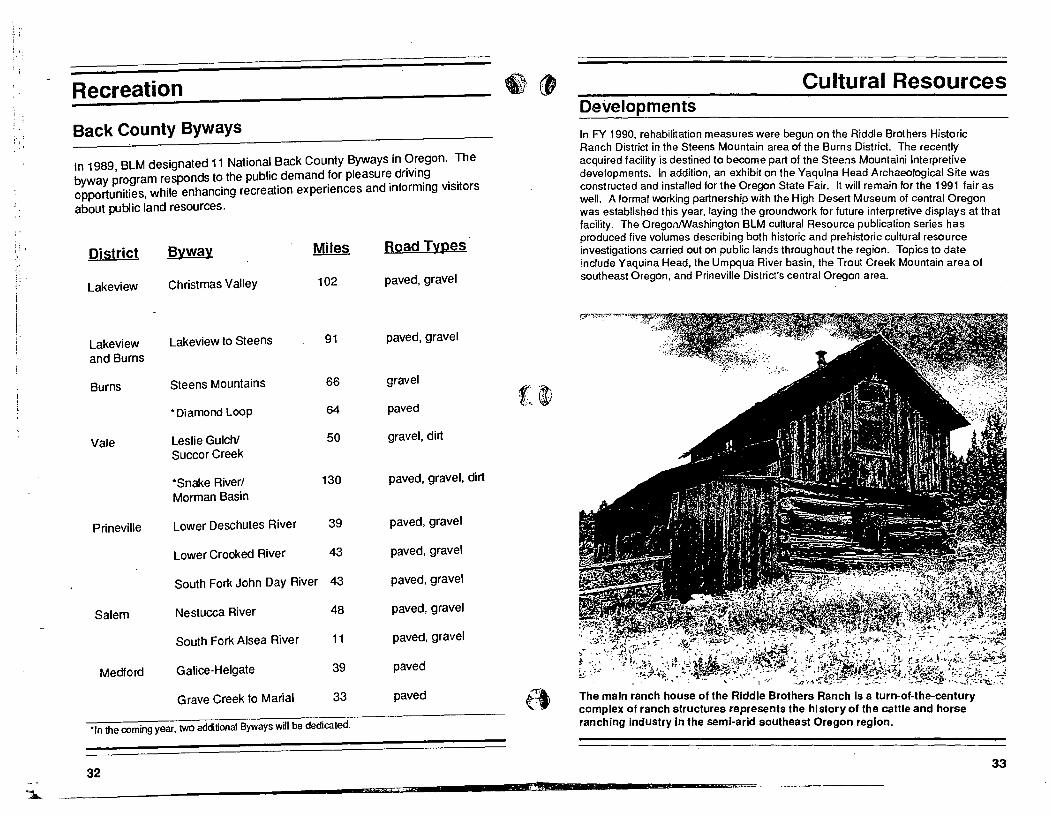
In FY 1990, rehabilitation measures were begun on the Riddle Brothers Historic Ranch District in the Steens Mountain area of the Burns District. The recently acquired facility is destined to become part of the Steens Mountaini Interpretive developments. In addition, an exhibit on the Yaquina Head Archaeological Site was constructed and installed for the Oregon State Fair. It will remain for the 1991 fair as well. A formal working partnership with the High Desert Museum of central Oregon was established this year, laying the groundwork for future interpretive displays at that facility. The OregonlWashington BLM cultural Resource publication series has produced five volumes describing both historic and prehistoric cultural resource investigations carried out on public lands throughout the region, Topics to date include Yaquina Head, the Umpqua River basin, the Trout Creek Mountain area of southeast Oregon, and Prineville District's central Oregon area.
The main ranch house of the Riddle Brothers Ranch is a turn-of-the-century complex of ranch structures represents the history of the cattle and horse ranching industry In the semi-arid southeast Oregon region.
33
i I 1
i L.
· ; ;j ,I. " :1,
Cultural Resources
Adventures in the Past To enhance public enjoyment of cultural resources on public lands in Oregon and Washington, "Adventures in the Past," was initiated bureauwide in FY 90. As part of this effort, a number of interpretive projects have been underway for some time, and others have been recently begun. A list of on-site interpretive accommodations are listed below.
Site
Rogue RiverRanch National Register Site
Whiskey Creek Cabin National Register Site
Yaquina Head Lighthouse and Archaeological Site
Mack Canyon National Register and Archaeological Site
China Mining Ditch
Keeney Pass Oregon Trail National Register District
Four Mile Canyon Oregon Trail Site
Flagstaff Hill Oregon Trail Site
34
District
Medford
Medford
Salem
Prineville
Roseburg
Vale
Prineville
Vale
Features
interpretive displays
public viewing
on-site naturalist interpreter
interpretive panels
interpretive panels
interpretive kiosk
interpretive signs
interpretive kiosk future visitor center
Wilderness
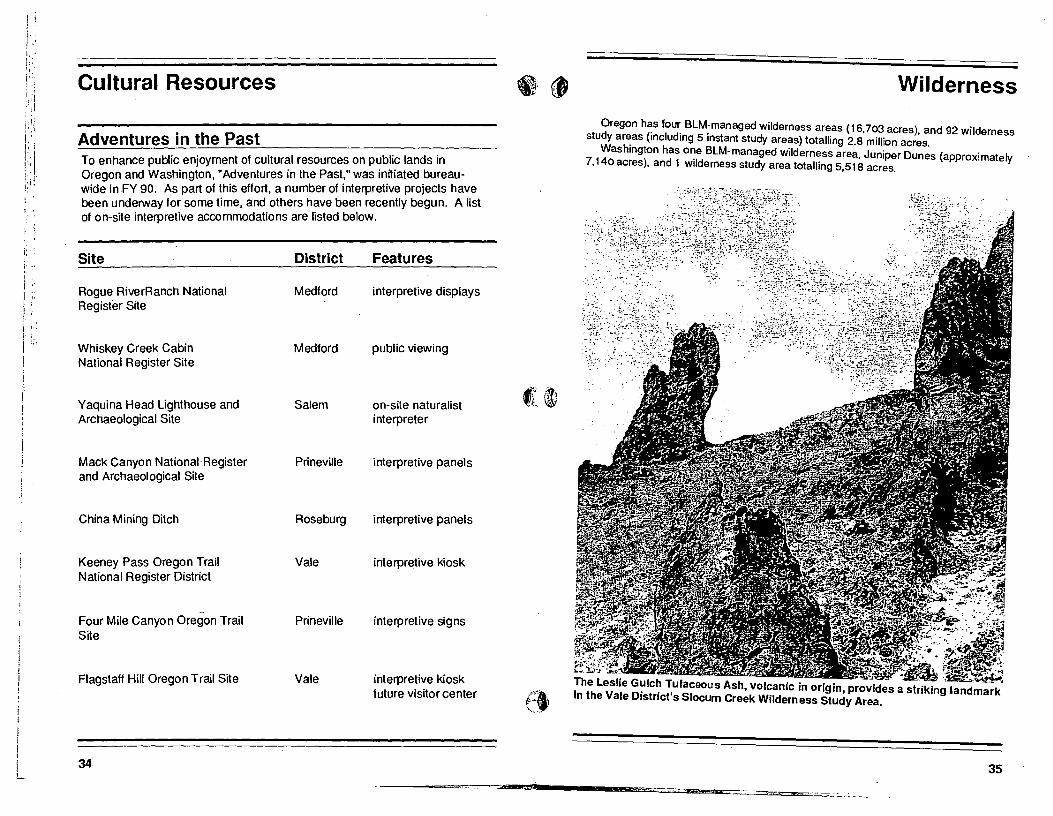
Oregon h~s fou~ BlM:managed wilderness areas (16,703 acres), and 92 wilderness study ar~as (including 5 Instant study areas) totalling 2.8 million acres.
Washington has o~e BlM-managed wilderness area, Juniper Dunes (approximately 7,140 acres), and 1 wilderness study area totalling 5,518 acres.
The Leslie G~lc~ ~ufaceous Ash, volcanic in origin, provides a striking landma;k' in the Vale District s Slocum Creek Wilderness Study Area.
35
i :; i
,.
, 1
\ . ;:
Wilderness
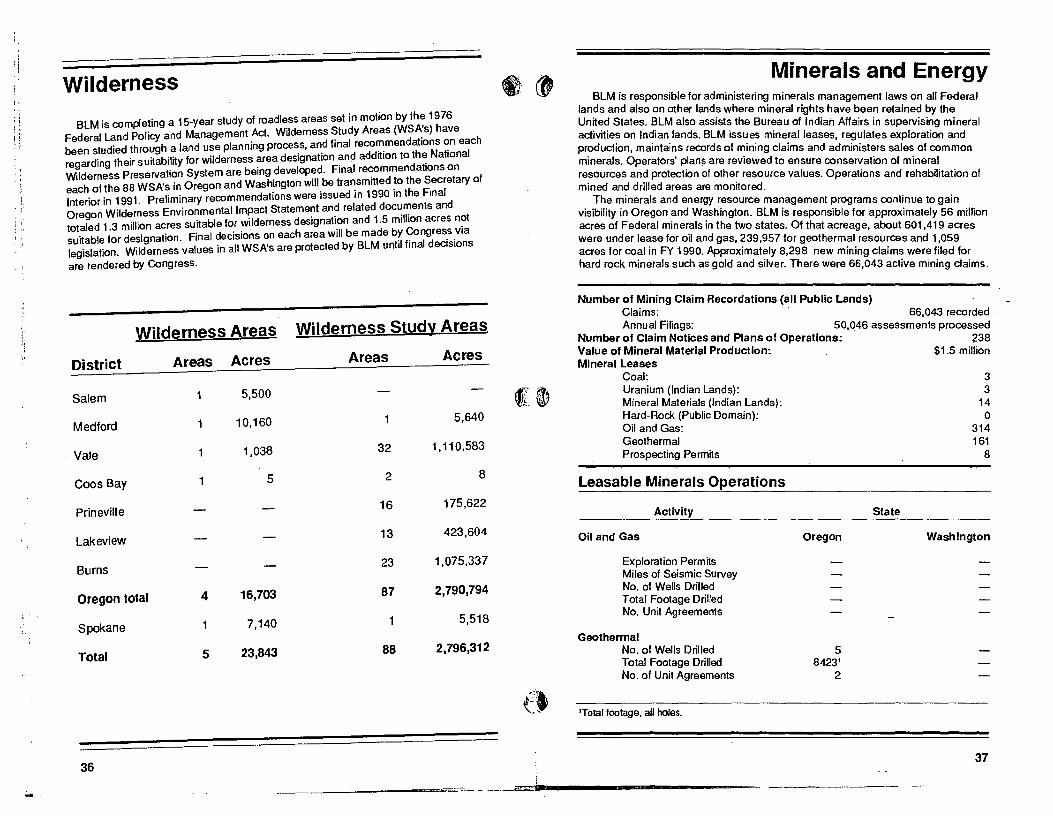
BLM is completing a 15-year study of roadless areas set in motion by the 1976 Federal Land Policy and Management Act. Wilderness Study Areas (WSA's) have been studied through a land use planning process, and final recommendations on each regarding their suitability for wilderness area designation and addition to the National Wilderness Preservation System are being developed. Final recommendations on each of the 88 WSA's in Oregon and Washington will be transmitted to the Secretary of Interior in 1991. Preliminary recommendations were issued in 1990 in the Final Oregon Wilderness Environmental Impact Statement and related documents and totaled 1.3 million acres suitable for wilderness designation and 1.5 million acres not suitable for designation. Final decisions on each area will be made by Congress via legislation. Wilderness values in all WSA's are protected by BLM until final decisions
are rendered by Congress.
Wilderness Areas Wilderness Study Areas
District Areas Acres Areas Acres
Salem 5,500
Medford 1 10,160 5,640
Vale 1,038 32 1,110,583
Coos Bay 1 5 2 8
Prineville 16 175,622
Lakeview 13 423,604
Burns 23 1,075,337
Oregon total 4 16,703 87 2,790,794
Spokane 7,140 5,518
Total 5 23,843 88 2,796,312
36
Minerals and Energy BLM is responsible for administering minerals management laws on all Federal
lan?s and also on other land~ where mineral rights have been retained by the Un~~~ States. ~LM also assists the Bureau of Indian Affairs in supervising mineral actlvitle~ on In~lan.lands. BLM issues mineral leases, regulates exploration and pr~ductlon, maintains records of mining claims and administers sales of common minerals. Operators' plans are reviewed to ensure conservation of mineral re~ources an? protection of other resource values. Operations and rehabilitation of mined and drilled areas are monitored. . !~.e ":,inerals and energy r.esource ma~agement programs continue to gain
VISibility In Oregon ~nd W~shlngton. BLM IS responsible for approximately 56 million acres of Federal mlner.als In the two states. Of that acreage, about 601,419 acres were under le~se for 011 and gas, 239,957 for geothermal resources and 1,059 acres for co~11n FY 1990. Approximately 8,298 . new mining claims were filed for hard rock minerals such as gold and silver. There were 66,043 active mining claims.
Number of ~inlng Claim Recordations (all Public Lands) Claims: .. . 66,043 recorded Annual Filings: 50,046 assessments processed
Number of Claim Notices and Plans of Operations; . 238 Value of Minerai Material Production' $1 5 'Ii' Minerai Leases' . ml Ion
Coal: Uranium (Indian Lands): Mineral Materials (Indian Lands): Hard-Rock (PubliC Domain): Oil and Gas: Geothermal Prospecting Permits
Leasable Minerals Operations
Activity
Oil and Gas
Exploration Permits Miles of Seismic Survey No. of Wells Drilled Total Footage Drilled No. Unit Agreements
Geothermal No. of Wells Drilled Total Footage Drilled No. of Unit Agreements
'Total footage, all holes.
Oregon
5 8423'
2
State
3 3
14 o
314 161
8
Washington
37
'.j
i:
c·
i ! r , I I , ,
"j' "
.i j.
,), .,' " ,
i: , t· , I'
I
.' " :-',' . ,:r· :
Minerals and Energy
Minerals Oregon Washington
Item FY1989 FY 1990 FY 1989 FY 1990
Mineral Patents Issued 3 2 Coal Leases Issued, Acres Coal Leases in Force, Acres 538 538 521 521 Oil & Gas Leases Issued, Acres 50,119 105,070 3,339 2,281 Oil & Gas Leases in Force, Acres 394,009 440,949 538,970 160,470
Geothermal Leases in Effect September 30, 1990
Oregon Washington Number Acreage Number Acreage
USDA Forest Service 143 220,636.08 USDA Forest Service 1,913.00 BLM 9 17,407.91 BLM 0 0
Total 152 238,043.99 Total 1,913.00
Federal Lands Available for Mining and Mineral Leasing (as of 9-30-90)_
Oregon
Acres Open
Acres Closed
Location and Entry Under the Mining Laws'
28,880,000 4,720,000
Application and Offer Under 29,670,000 the Mineral Leasing Laws··2
6,170,000
Washington
Acres Open
Acres Closed
6,327,000 5,303,000
6,310,000 5,320,000
'Acreage also includes Federal subsurface ownership where surface is not owned by the United States. >Acreage also includes acquired lands.
38
t.~
1
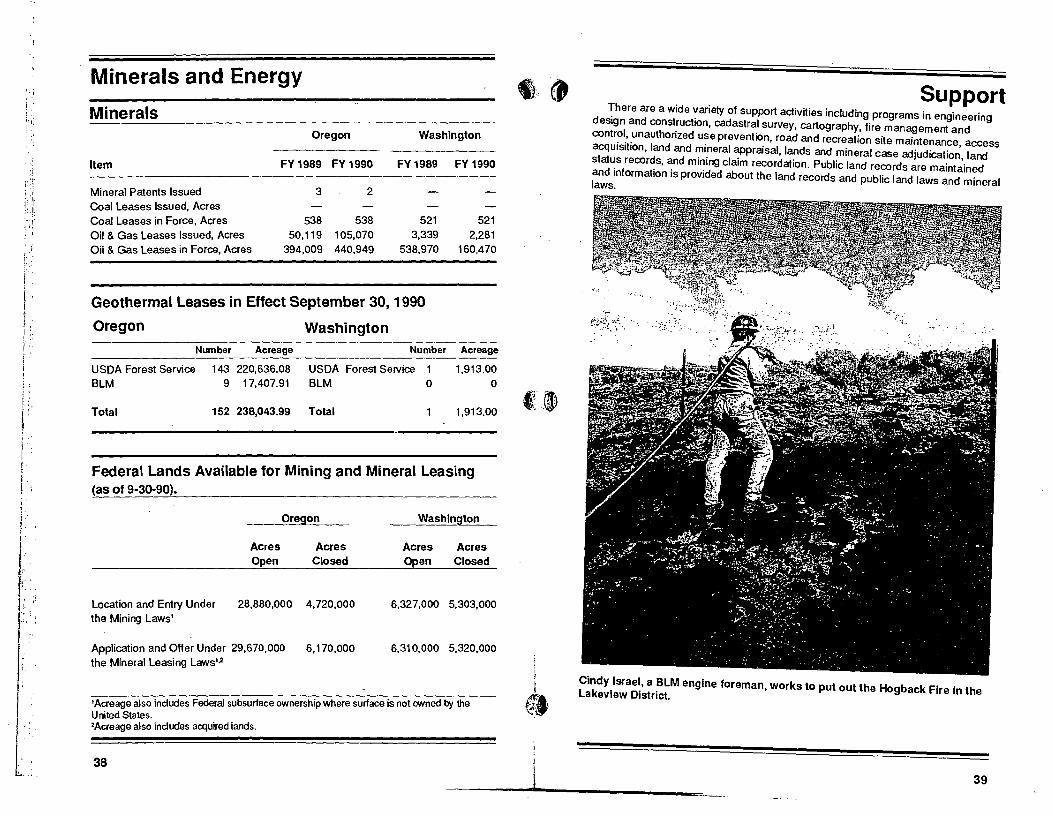
, . Support d :here are a wide ~anety of support activities including programs in engineering
eSlgn and const.ructlon, cadastral survey, cartography, fire management and contr?I.' .unauthonzed u~e prevention, road and recreation site maintenance access acquIsItion, land and minerai appraisal, lands and mineral case adjudica\' . 'I d stat~s recor~s, ~nd mi~ing claim recordation. Public land records are mail~t:in~~ and information IS provided about the land records and public land laws ad' I laws. n mlnera
LaCinkdY Israe~, a ~LM engine foreman, works to put out the Hogback Fire in the
evlew Dlstnct.
39

, ,
, 1,1
' ..
Support
Fire Management
BlM's electronic lightning detection system instantly plots cloud-to-ground lightning strikes, permitting prompt suppression of lightning-caused fires if necessary. However, BlM strives to manage fire, rather than merely suppress it. Prescribed burning enhances wildlife habitat, improves range forage mixes, improves watersheds, and removes timber harvest residues to avoid wildfires and simplify reforestation.
Fire Statistical Summary Number of fires and acres burned on lands managed by the Bureau of land Management in Oregon and Washington during 1990.
Human Caused lightning Caused Total Total No. of BLM Acres No. Of BLM Acres Number BlM Acres Fires Burned Fires Burned Fires Burned
lakeview 10 6 61 261 71 267 Burns 8 1 46 34,647 54 34,648 Vale 9 8 54 4,000 63 4,008 Prineville 16 3 94 2895 110 2898 Salem 5 57 2 0 7 57 Eugene 6 13 0 0 6 13 Roseburg 9 87 4 3 13 100 Medford 23 96 28 160 51 256 Coos Bay 7 33 0 0 7 33
Oregon Total 73 304 289 41,966 382 42,280
Spokane 9 324 7 302 16 626
Total 82 628 296 42268 398 42,906
Average Number of Fires Annually During Five Years, 1985-1989 Human Caused:
Number 118 BlM Acres 17,267
Total Fires for 5 Years: Total BlM Acres for 5 Years:
Lightning Caused:
1,964 650,009
Number BlM Acres
275 112,735
Average Number of Fires Annually During Ten Years, 1980-1989 Human Caused: Lightning Caused:
Number 112 Number BlM Acres 20,290 BlM Acres
Total Fires for 10 Years: 3,602 Total BlM Acres for 10 Years: 1,172,735
40
248 96,984
fl ® 9~, .~ ,
i I
(~t
Numbers of Fires by Size Class
Size Class
A (0-.25 acres) B (.26-9 acres) C ( 10-99 acres) D (100-299 acres) E and larger (300+ acres) False Alarms
1990
238 100 30 10 21 58
Prescribed Fire Statistical Summary
Prescribed Forestry Hazard Water· Fires Site Prep Wildlife Reduct. Range shed Total
Other Acres
Eastern Oregon & Washington
lakeview 28 1,050 0 0 600 0 0 Burns 1 0 490 1,650
Vale 0 0 0 0 490 1 0 0 0 800
Prineville 0 0 800 10 0 335 0 40 1,400 0 Spokane 0 1,775 0 0 0 0 0 0 0
Total 40 1,050 825 0 1,440 1,400 0 4,715
Salem Western Oregon
84 2,353 0 0 0 0 0 2,353 Eugene 44 1,411 0 0 0 0 0 1,411 Roseburg 163 4,427 0 0 0 0 0 4,427 Medford 186 5,669 0 0 0 0 0 5,669 Coos Bay 112 3,470 0 0 0 0 0 3,470
Total 589 17,330 0 0 0 0 017,330
Total 629 18,380 Oregon & Washington
825 0 1,440 1,400 022,045
State 5-year Average (FY 1985-1989) Average Number of Projects: 597 Average Acres Treated: 21 538
Forestry 15 173 R ' Wildlife ,ange
391 Watershed Hazard Reduction 848 Other
Total Projects for 5 Years: 2 896 Total Acres Trealed for 5 Years: 107:693
Support
5-Year Average (1985-1989)
193 107 41 17 36 41
Escaped Fires. Number Acres
0 0 0 0 0
0
0 3 3 1 6
13
13
0 0 0 0 0
0
0 3
77 1
32
113
113
3,643 1,153
330
41
i,
: : i; "
Support Roads
The BlM road transportation system in Oregon as of 9130/90 totaled 28.712 miles -19.177 miles in western Oregon and 9,401 miles in eastern Oregon. Washington has
134 miles. Appropriated-fund-constructed mileage has stayed at 1,109 miles (312 miles in
eastern Oregon, 797 miles in western Oregon) since no funds have been appropriated for road construction for the past several years. No appropriated-fund roads have been
constructed in Washington. Roads constructed under the terms of timber sale contracts are shown in the table
below. Other road mileage has been acquired by purchase. donation, and construction by others under permit, such as the Civilian Conservation Corps in the 1930s.
In FY 1990, 7.928 miles, or about one third of the 28.712-mile BlM transportation system, were maintained.This included 5.398 miles of road in western Oregon and 648 miles in eastern Oregon maintained by Bl M; and 1,809 miles on the west side and 73 miles on the east side maintained by timber purchasers (under the terms of timber sale contracts) and by other government agencies or timber companies (under the terms of agreements). All roads are not maintained annually, but at varying intervals based on need.
~/ ~ ~~ ?;:', >'i '"
, . , I
Support
Rights of Way Right of w~y permits is~ued by th~ Oregon State Office during the 1988 and 1989 fiscal years. (Does not Include permits for logging roads in western Oregon.)
Oregon Washington Kind FV 1989 FY 1990 FY 1989 FY 1990 Energy Related 1
Norrenergy Related 2
18 126
4 137
1 0 12 9
Total 144 141 13 :Includes electric transmission lines. and oil and gas pipelines. -
hll!'lgclhUdes telePth<?nle !lnd telegraph hnes. communication sites water pipelines roads
ways. ma ena sites. etc. •. ,
9
~oad Right of Way Permits and Agreements ~~:~~f way permits issued for logging and reciprocal right of way "and road use agreements
Ee[mlts Issued Ag[eements Signed District FY 1989 FY 1990 FY 1989 FV 1990 lakeview 1 9 Burns 4 Vale Prineville 38 16 4 Salem 30 11 Eugene 17 17 Roseburg 13 12 5 Medford 53 4 4 Coos Bay 11 10 Oregon Total 163 83 5 9
Spokane
Total 163 83 5 9
Lands The lands program includes the processing of lands and minerals application
~ca~7work) fro~ ~ther Fed.eral agen.cies, state and local governments, and private Indl~l?uals .. ThIS Includes field examination, classification and issuance of land use deciSions, ~itle conveyances, leases, permits, rights-of-way, withdrawals and withdraw~1 revle~. It also provid.es for maintenance of public records in Oregon and W.ashlngton, Issuance of public land status. and information about the public land a d minerals laws. n
43
--------------==~--~"~~~ .. ------------------====~

i ,
! .
:,'
[ .. !.
j'
:'
i
I
I r i I,,: I .
Ii
II :; . ~,.
~~
Support
Road Right of Way Easements and Lands Acquired "1M9 "1~0
District
Lakeview Burns Vale Prineville Salem Eugene Roseburg Medford Coos Bay Spokane
Total
Direct Purchase
1 4 4
3 4 9 9
34
Direct Purchase
2
14 2 4 7 2 5
36
·There have not been any eminent domain aquisitions for several years. That portion of the table has been dropped as of 1989.
Other Acquisitions
District
Lakeview: Warner Lakes
Burns: Steens Mtn. Ree. Area
Spokane: Juniper Dunes Wilderness Donation
Total
44
"1989 Direct Purchase
Acres
7,888
1,080
306
9,274
FY 1990 Direct Purchase
Acres
20
20
g4'i'i- .
Support Withdrawal Review Recommendations , Through the Federal Land Policy and Management Act of 1976, Congress mandated that the Secretary of the Interior, through the Bureau of Land Managment, must review certain land withdrawals of all Federal lands to determine whether the withdrawals are still justified, and to what extent the lands involved can be opened for multiple use. Land classifications are also being reviewed in this effort. Oregon and Washington have approximately 25 percent of the 6,000 land withdrawals subject to review nationwide.
Oregon
Withdrawals Land Classifications
Washington
Withdrawals Land Classifications
Total
Oregon
Withdrawals Land Classifications
Washington
Withdrawals Land Classifications
Total
Reviewed in FY 1990
Revoke Continue Totals No. Acres No. Acres No. Acres
14 201 o o 14 201
305 o o 305
15 506 o o 15 506
Total Reviewed Since October 21,1976
Revoke No. Acres
417 931,074 87 9,544,120
227 911,333 18 24,379
749 11,410,906
Continue No. Acres
118 432,196 61 3,893,612
54 10,890 19 1,690
252 4,338,388
Totals No. Acres
535 1,363,270 148 13,437,732
281 922,223 37 26,069
1,001 15,749,294
45
Support
lands Transferred Between BlM and Other Federal Agencies
Oregon Jurisdiction Transferred to BlM Jurisdiction Transferred from BlM
Washington Jurisdiction Transferred to BlM Jurisdiction Transferred from BLM
land leases (In effect 9-30-89)
Kind
Recreation & Public Purposes k1 Small Tract Airport Mining Claim Occupancy Act Public Works Communication Site Sec. 302 FLPMA leases, Permits
and Easements
Total
land leases (In effect 9-30-90)
Kind
Recreation & Public Purposes Act Smail Tract Airport Mining Claim Occupancy Act Public Works Communication Site Sec. 302 FLPMA Leases, Permits
and Easements
Total
46
FY 1989 FY 1990 Acres Acres
2,622
2,211
Oregon Washington
Number Acres Number Acres
48 3,237 12 1,877 4 4 4 197 8 15 1 4 1 1
137 64,411 9 138
203 67,869 22 - 2,016
Oregon Washington
Number Acres Number Acres
48 3,237 12 1,877
4 4 4 197 8 15 1 4 1 1
147 64,774 8 112
213 683232
~,~ VI 1:.11
I'@ '! " •. :,)1 '.'
"
,I'D," , r ;/,: .
J
lands Received by BlM
Oregon Exchanges, Reconveyance of Recreation & Public
Purposes Act land Acquisitions in Fee Total
Washington Exchanges Reconveyance of Recreation & Public
Purposes Act land Acquisition in Fee Total
Grand Total
Surveys
FY 1989 Acres
7,339
8,469 15,808
1,960
307 2,267
18,075
Support
FY 1990 Acres
8,356
8,356
9,685
20 9,705
18,061
Cadastral surveys are performed to create, mark and define, or to retrace the boundaries between adjoining lands and, more particularly, between land of the federal government and private owners or local governments. The Bureau of Land Management is the only agency that is authorized to determine the boundaries of the public, lands of the United States.
Public land Surveys
FY 1989 FY 1990
Kind Oregon Washington Oregon Washington
Miles of Line Retraced or Surveyed 472 Corners Monumented 423 Plats Accepted 48
111 247
14
532 780
70
93 157
22
47
1'/
U: I ~1 it: J!
Support It ~ 1;-1
,.': 1:1 Land Patents Issued ili EY 1989 ,'J
No. Acres h: Kind of Patent , \
: ! Oregon-BlM I I
i, I Public Sale 10 964
j'J ~ 6 2,425 I'~ ;
Exchange I;~ 4 ;.Ii
106 !;!: Mining Claim Patent 2 < ,!:
Color of Title Patent 39 i:
:;i· Conveyance of Federally Owned Minerals 'j: ;ij Corrective Patent ii,:
Ii:;; Equitable Ajudication Patent 7 " . 1\ :
Total 20 3,541 i;:: 1'::1 Oregon-Other Agency , , I; , I' ~ Indian Fee Patents 2 80
t· ! 7 11,306 , I National Forest Exchange t'l " ! Reclamation Sale 49 ~: ; f q I
Wildlife Refuge Exchange ilij j!;i Currative Forest Exchange
iU Total 10 11,435
iii Wash Ington-BlM :1;1 ';,1
(I Exchange 2 969 .' I \;\·1 Public Sale 3 8 !::j
1.:1 Currative Sale Patent 2 I" ,',
6 979 (I Total i'J
::11 Washlngton-Other Agency
I r I:, Indian Fee and Re-issue Trust 5 125 'j:: ' 1 Ii! National Forest Exchange 5 16,355 r:;1
Total 10 16,480
lr Total- BLM 26 4,520
I. Total - Other Agency 20 27,915
f "
Ii: 48 'Ii r "
EY 1990 No. Acres
5 214
6 4,928
2 865
484
6
15 6,497
6 11
7 5,779
13 5,790
2 3,638
2 3,638
6 366
10 11,050
16 11,416
17 10,135
29 17,206
' .~, -" (t
~' @ « :; . ~ .•. , ' ,.
I l ;
I ~~;~ -y! -
l
Law Enforcement
The law Enforcement office has two sections: the Resource Investigations and Patrol Operations Section and the Drug Enforcement Section. Uniformed Rangers work in Districts and Resource Areas performing patrol activities and law enforcement services on BlM administered lands. The Special Agents, who work out of the state office, conduct investigations covering a full range of violations which include timber theft, drug crimes, thefts of BlM property, assaults on employees, theft of archaeological resources, occupancy trespass, destruction of BlM property, and investigations of all other crimes which affect the administration of the Bureau of land Management.
BlM's Agents and Rangers work closely with their State and Federal counterparts, taking part in drug task forces on public lands, jOint timber investigations, as well a~ taking part in many local and state level law enforcement associations, meetings on crime prevention, and criminal information sharing.
Misdemeanor Violations/Prosecutions
Archaeological Resource Protection Act
Destruction of Government Property
Timber theft 10
Theft of Natural Resources
Violation of Fire Regulations 6
Sanitation and littering 5
Theft of Small Forest Products 3
Destruction of Natural Features
Grazing without Authorization
Total 29
49
:" ", I, , ,
, '
, .\
Law Enforcement
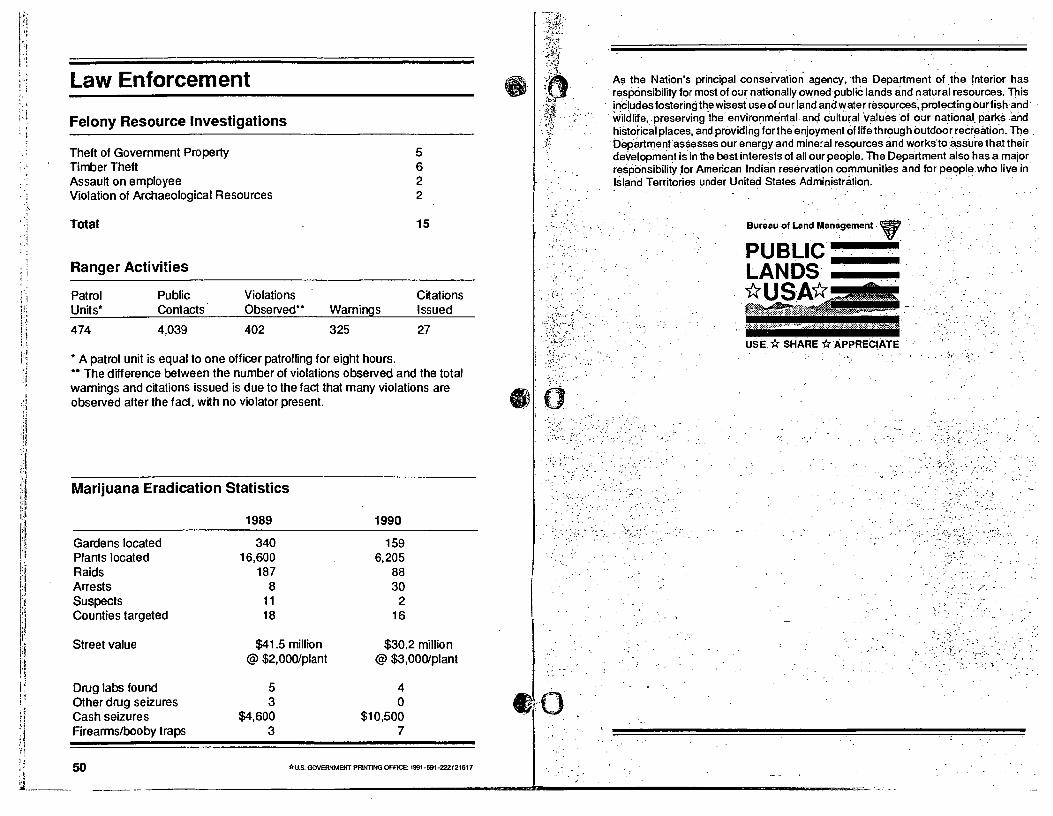
Felony Resource Investigations
Theft of Government Property Timber Theft Assault on employee Violation of Archaeological Resources
Total
Ranger Activities
Patrol Units·
474
Public Contacts
4,039
Violations Observed··
402
Warnings
325
5 6 2 2
15
Citations Issued
27
• A patrol unit is equal to one officer patrolling for eight hours. •• The difference between the number of violations observed and the total warnings and citations issued is due to the fact that many violations are observed after the fact, with no violator present.
Marijuana Eradication Statistics
Gardens located Plants located Raids Arrests Suspects Counties targeted
Street value
Drug labs found Other drug seizures Cash seizures Firearmslbooby traps
50
1989
340 16,600
187 8
11 18
$41.5 million @ $2,000/plant
5 3
$4,600 3
1990
159 6,205
88 30
2 16
$30.2 million @ $3,OOOfplant
4 o
$10,500 7
" u.s. GOVERNMENT PRINTING OFFICE: 1991-591-222/21617
'.," :""
'. "-'.
~~"
0)0-
• 1·. ~ • -- ... t.
. ;;.
·,,0" Wl~ .
As the Nation's prinCipal conse'rvation- agency, the Department of .the Interior has respOnsibility for most of our nationally owned public lands and natural resources. This includes fostering the wisest use of our land and water resources~ protecting ourfish'and wildlife,preserving'the environmental and cultural, viiluesof our nationa1.parksand historical places, and providing forthe'enjoyment of life through outdoorrecr~ation_ The, Departmentassesses our energy and mirieral resources and works'to ,assure that their development is in the best interests of all our people_ The Department also has a major respOnsibility 'or American Indian reservation communities and for people who live in Islarid Territories under United States Administration. " '
Bureau of land Management, V ' PUBLIC ' LANDS *USA*
<., .. -~. , "
. '. ;. ~"
;-'-.
. - .-,". ~ .
. .... ,"'_.
,. "/~.
'; ... ,
1'" ...
"
------------------------"--------------~= i'l ..a, ____ _
UNITED STATES DEPARTMENT OF THE INTERIOR BUREAU OF LAND MANAGEMENT OREGON STATE OFFICE P.O. BOX 2965 (1300 N.E. 44TH AVENUE) PORTLAND, OREGON 97208 o To change your mailing address, please return
this panel with revisions noted
I " III BULK MAIL
POSTAGE AND FEE PAID DEPARTMENT OF THE INTERIOR
G-76