Embed Size (px)
Citation preview
1Øresund Trends 2012
English www.tendensoresund.org
Øresund Trends 2012
2 Øresund Trends 2012
Project ManagerBirgitte Steenstrup, [email protected]
Data collection, analysis and text Thomas Behrens The Swedish Employment ServiceMai Lundemark Copenhagen Municipality, Interreg-projektet Job og UddannelseGert Jørgensen Employment Region Copenhagen & ZealandEivor Johansson Malmö MunicipalityAnders Axelsson Region SkåneChristian Lindell Region SkåneChristina Ripa Region SkåneDaniel Svärd Region SkåneLova Wigvall Region SkåneLene Wittek-Holmberg Wonderful CopenhagenBritt Andresen The Öresund CommitteePeter Krygell The Öresund Committee
Editing and translation into Danish Marianne WormEtcetera Communicationswww.etcetera.dk
Translation into English Katie Schwarck, [email protected]
For more information, visitwww.tendensoresund.org
Graphic designMikael Forthwww.forth.dk
PrintingCS-Grafisk A/S
Print run500
3Øresund Trends 2012
ContEnts
A region in development . . . . . . . . . . . . . . . . . . . . . . . 4 Preface . . . . . . . . . . . . . . . . . . . . . . . . . . . . . . . . . . . . . . . . 4
Facts about the Øresund Region . . . . . . . . . . . . . . . . . 6 Geography. . . . . . . . . . . . . . . . . . . . . . . . . . . . . . . . . . . . . 6 Map of the Øresund Region. . . . . . . . . . . . . . . . . . . . . . . . 7 Demographics . . . . . . . . . . . . . . . . . . . . . . . . . . . . . . . . . . 8
Knowledge and innovation . . . . . . . . . . . . . . . . . . . . 12 Economic development. . . . . . . . . . . . . . . . . . . . . . . . . . .12 Business structure . . . . . . . . . . . . . . . . . . . . . . . . . . . . . . .16 Research and development . . . . . . . . . . . . . . . . . . . . . . . .28 Education . . . . . . . . . . . . . . . . . . . . . . . . . . . . . . . . . . . . . .36
Culture and Experience . . . . . . . . . . . . . . . . . . . . . . 40 Culture . . . . . . . . . . . . . . . . . . . . . . . . . . . . . . . . . . . . . . . .40 Identity. . . . . . . . . . . . . . . . . . . . . . . . . . . . . . . . . . . . . . . .45 tourism . . . . . . . . . . . . . . . . . . . . . . . . . . . . . . . . . . . . . . .46 Health. . . . . . . . . . . . . . . . . . . . . . . . . . . . . . . . . . . . . . . . .48 Welfare. . . . . . . . . . . . . . . . . . . . . . . . . . . . . . . . . . . . . . . .54
A coherent and diverse labour market . . . . . . . . . . . 56 the labour market . . . . . . . . . . . . . . . . . . . . . . . . . . . . . . .56 Commuting across Øresund . . . . . . . . . . . . . . . . . . . . . . .62
Accessibility and mobility . . . . . . . . . . . . . . . . . . . . 70 Migration . . . . . . . . . . . . . . . . . . . . . . . . . . . . . . . . . . . . . .70 Housing and construction . . . . . . . . . . . . . . . . . . . . . . . . .78 House prices . . . . . . . . . . . . . . . . . . . . . . . . . . . . . . . . . . .84 traffic across Øresund. . . . . . . . . . . . . . . . . . . . . . . . . . . .90 Copenhagen Airport . . . . . . . . . . . . . . . . . . . . . . . . . . . . .94
About the analysis . . . . . . . . . . . . . . . . . . . . . . . . . 100Dark figures . . . . . . . . . . . . . . . . . . . . . . . . . . . . . . . . . . .100 About Ørestat. . . . . . . . . . . . . . . . . . . . . . . . . . . . . . . . . .101 About Øresund trends . . . . . . . . . . . . . . . . . . . . . . . . . .102
Contact list . . . . . . . . . . . . . . . . . . . . . . . . . . . . . . . 103
4 Øresund Trends 2012A REGIon In DEvEloPMEnt | PREFACE
A REGIon In DEvEloPMEnt Preface
The Øresund Region is home to 3.8 million people. Over the next 20 years, the population is projected to grow by a further 10 per cent.
The region is an important factor for both the Danish and Swedish national economy since 27 per cent of their com-bined GDP is created in the Øresund Region.
Within an economic context, Øresund integration is an important element on both sides of Øresund. In 2010, Øresund commuters contributed 751 million EUR in added value to the Danish economy. Since the opening of the Øresund Bridge in 2000 and as a re-sult of Øresund commuting, the Dan-ish economy has received a substantial financial injection totalling 4,4 billion EUR – which in 2010 prices is equiv-alent to 1.3 Øresund Bridges. In other
words, the social gains from the Øresund Bridge far exceed what it cost to build it. At the same time, Sweden saves 178 mil-lion euro per annum in unemployment benefit because unemployed Swedes find work in Denmark.
Like the rest of Europe, the Øresund Region has been affected by the finan-cial crisis. The crisis has led to a halt to the increase in relocation, commuting and traffic across the Øresund. In 2011, the number of daily commuters totalled 18,000, slightly lower than in 2008, when commuting was at its highest level with almost 20,000 commuters across Øresund. In 2011, an average of 91,500 individuals crossed Øresund (by car, coach, train and ferry) and 24,700 ve-hicles crossed Øresund every day. This is an increase of 1 per cent in passenger numbers and a decrease of 2 per cent on the year in the number of vehicles.Economic growth in the Øresund
Region (6 per cent) in the period 2000-2009 was lower than the average for the EU27 area (13 per cent). The develop-ment is significantly lower than in both the Helsinki Region (24 per cent) and Stockholm County (30 per cent).
However, gross regional product per employee during 2000-2009 was stronger in the Øresund Region (5.3 per cent) than the average for all regions in Europe (4.2 per cent). This is still lower than in Stockholm (19.2 per cent) and Helsinki (16.9 per cent) for the period 2000-2009. This is a situation that needs to be addressed if the Øresund Region is to remain an important driver for the whole of Scandinavia.
The Øresund Region has considera-ble potential, which could be exploit-ed better. 35 per cent of the population has a higher education, which is above the national level in both Denmark
5Øresund Trends 2012
and Sweden. In total, approximately 150,000 students study at the region's 11 universities and higher educational in-stitutions.
The percentage of gross regional prod-uct spent on research and development in the Øresund Region is among the highest (4.9 per cent) in Europe. At the same time, 43 per cent of industry’s total investment in research and development for the whole of Denmark and Sweden is placed in the region. Nevertheless, all signs are that it is not easy to turn these investments into innovation and commercial products, which is a general problem in Denmark and Sweden.
12 years after the opening of the Øresund Bridge, it is gratifying to note that a common Øresund regional iden-tity among the citizens of the region is growing. But identity and integration assume increased and mutual communi-
cation across Øresund within the areas of culture, the labour market, knowl-edge and innovation as well as traf-fic and infrastucture. Øresund Trends monitors and analyses this integration and we hope you will find the analysis interesting.
A REGIon In DEvEloPMEnt | PREFACE
6 Øresund Trends 2012
FACts ABout tHE ØREsunD REGIon GEoGRAPhy
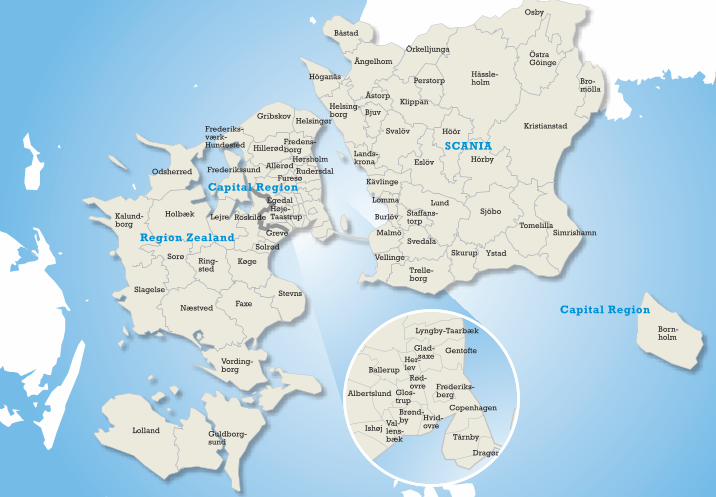
Geographically, the Øresund Region consists of Zealand, Lolland, Falster, Møn and Bornholm on the Danish side and Scania on the Swedish side of Øresund – hence the name. Adminis-tratively, it consists of three regions: the Capital Region of Denmark and Region Zealand on the Danish side and Scania on the Swedish side.
The Øresund Region’s Danish and Swed-ish sides are connected in the south by the 16 km long Øresund Bridge between Co-penhagen and Malmö, which opened in 2000, and in the north, by the ferry link between Elsinore and Helsingborg.
The Øresund Region covers a total area of 21,203 square kilometres – equiva-lent to half the entire area of Denmark – with 9,834 square kilometres on the Danish side and 11,369 on the Swedish
side. Measured in square metres, Scania is the largest, but about two-thirds of the 3.8 million inhabitants in the Øresund Region live on the Danish side, which has 2.5 million inhabitants while there are 1.3 million on the Swedish side.
The Øresund Region includes the capi-tal of Denmark, Copenhagen, and Swe-den's third largest city, Malmö. Copen-hagen-Malmö is the largest urban area in Scandinavia.
The average population density is 179 inhabitants per square kilometre: high-est on the Danish side with 258 inhabit-ants per square kilometre and lowest on the Swedish side with 110 inhabitants per square kilometre. There is signifi-cant geographic variation: from dense metropolitan areas such as Copenhagen and Malmö to the relatively sparsely populated rural municipalities of Lol-land and in eastern Scania.
Administratively, the Øresund Region consists of the 33 municipalities that make up the Scania region on the Swed-ish side, while on the Danish side there are the 46 municipalities that make up the Capital Region and Region Zea-land.
Population figures in the Øresund Region’s six largest municipalities (mid-2012)
Copenhagen 552,000Frederiksberg 101,000Roskilde 83,000
Malmö 305,000helsingborg 131,000Lund 112,000
Source: Statistics Denmark and Statistics Sweden.
FACts ABout tHE ØREsunD REGIon | GEoGRAPhy
7Øresund Trends 2012
lolland Guldborg-sund
næstved
slagelse
vording-borg
Faxe
Køge
stevns
Ring-sted
sorø
Kalund-borg
Holbæk
odsherred Frederikssund
lejre Roskilde
solrød
Greve
Egedal
Frederiks-værk-Hundested
GribskovHelsingør
HillerødFredens-borg
HørsholmAllerød
RudersdalFuresø
Høje-taastrup
lyngby-taarbæk
GentofteGlad- saxeHer-
levBallerup
Copenhagen
Frederiks-bergAlbertslund Glos-
trup
Rød-ovre
Ishøjval-lens-bæk
Brønd-by Hvid-
ovretårnby
Dragør
Båstad
Ängelhom
Höganäs
Helsing-borg
Åstorp
BjuvKlippan
svalöv
lands-krona
Kävlinge
lomma
Burlöv
Malmö
staffans-torp
lund
vellinge
trelle-borg
svedalaskurup
Eslöv
Höör
Hörby
sjöbo
Ystad
tomelillasimrishamn
Kristianstad
Hässle-holmPerstorp
Örkelljunga
Bro-mölla
Östra Göinge
osby
Born-holm
Capital Region
Region Zealand
Capital Region
SCAniA
FACts ABout tHE ØREsunD REGIon | GEoGRAPhy
8 Øresund Trends 2012
DEMoGRAPhiCS
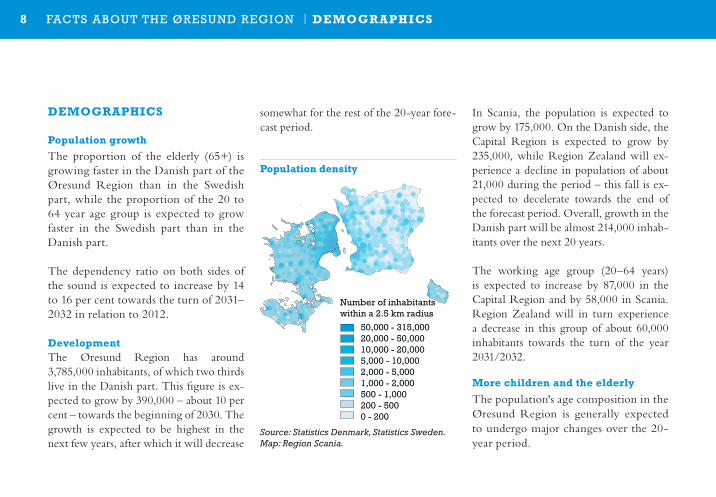
Population growth
The proportion of the elderly (65+) is growing faster in the Danish part of the Øresund Region than in the Swedish part, while the proportion of the 20 to 64 year age group is expected to grow faster in the Swedish part than in the Danish part.
The dependency ratio on both sides of the sound is expected to increase by 14 to 16 per cent towards the turn of 2031–2032 in relation to 2012.
DevelopmentThe Øresund Region has around 3,785,000 inhabitants, of which two thirds live in the Danish part. This figure is ex-pected to grow by 390,000 – about 10 per cent – towards the beginning of 2030. The growth is expected to be highest in the next few years, after which it will decrease
somewhat for the rest of the 20-year fore-cast period.
In Scania, the population is expected to grow by 175,000. On the Danish side, the Capital Region is expected to grow by 235,000, while Region Zealand will ex-perience a decline in population of about 21,000 during the period – this fall is ex-pected to decelerate towards the end of the forecast period. Overall, growth in the Danish part will be almost 214,000 inhab-itants over the next 20 years.
The working age group (20–64 years) is expected to increase by 87,000 in the Capital Region and by 58,000 in Scania. Region Zealand will in turn experience a decrease in this group of about 60,000 inhabitants towards the turn of the year 2031/2032.
More children and the elderly
The population's age composition in the Øresund Region is generally expected to undergo major changes over the 20-year period.
50,000 - 315,00020,000 - 50,00010,000 - 20,0005,000 - 10,0002,000 - 5,0001,000 - 2,000500 - 1,000200 - 5000 - 200
Number of inhabitants within a 2.5 km radius
Source: Statistics Denmark, Statistics Sweden.Map: Region Scania.
Population density
FACts ABout tHE ØREsunD REGIon | DEMoGRAPhiCS
9Øresund Trends 2012
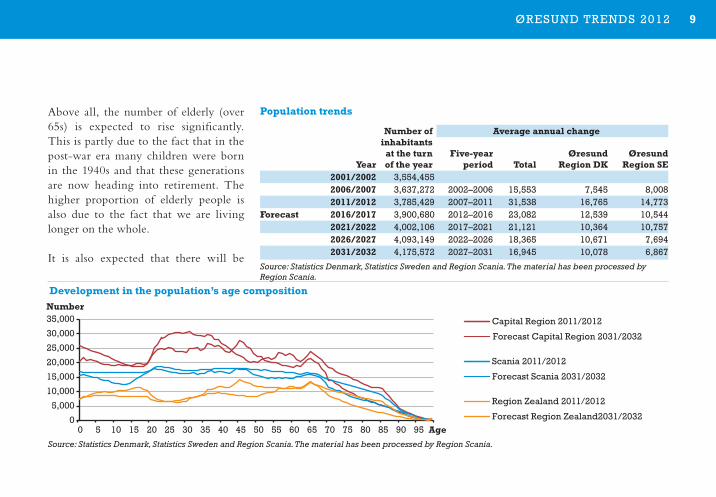
Above all, the number of elderly (over 65s) is expected to rise significantly. This is partly due to the fact that in the post-war era many children were born in the 1940s and that these generations are now heading into retirement. The higher proportion of elderly people is also due to the fact that we are living longer on the whole.
It is also expected that there will be
Population trends
number of inhabitants
at the turn of the year
Average annual change
yearFive-year
period TotalØresund
Region DKØresund
Region SE2001/2002 3,554,4552006/2007 3,637,272 2002–2006 15,553 7,545 8,0082011/2012 3,785,429 2007–2011 31,538 16,765 14,773
Forecast 2016/2017 3,900,680 2012–2016 23,082 12,539 10,5442021/2022 4,002,106 2017–2021 21,121 10,364 10,7572026/2027 4,093,149 2022–2026 18,365 10,671 7,6942031/2032 4,175,572 2027–2031 16,945 10,078 6,867
Source: Statistics Denmark, Statistics Sweden and Region Scania. The material has been processed by Region Scania.
Source: Statistics Denmark, Statistics Sweden and Region Scania. The material has been processed by Region Scania.
0
5,000
10,000
15,000
20,000
25,000
30,000
35,000
0 5 10 15 20 25 30 35 40 45 50 55 60 65 70 75 80 85 90 95
Number
Age
Capital Region 2011/2012
Forecast Capital Region 2031/2032
Scania 2011/2012
Forecast Scania 2031/2032
Region Zealand 2011/2012
Forecast Region Zealand2031/2032
0.0 0.5 1.0 1.5 2.0 2.5 3.0 3.5 4.0 4.5 5.0
Capita
l
Region
Region
Zeal
and
Scan
ia
Stock
holm
County
Denmar
k
Sweden
0 1 2 3 4 5 6 7 8 9
10
-90 -91 -92 -93 -94 -95 -96 -97 -98 -99 -00 -01 -02 -03 -04 -05 -06 -07 -08 -09 -10 -11
Million vehicles
Øresund Bridge Ferries Copenhagen-Malmö Ferries Elsinore-Helsingborg
0
5
10
15
20
25
30
35
40
-01 -02 -03 -04 -05 -06 -07 -08 -09 -10 -11
Million individuals
Car Train Ferries Hydrofoil
0102030405060708090
100
Car Landing Car TrainHH Ferries The Øresund Bridge
Total
Holiday
Mini-break
Leisure
Business
Commuting to place of study
Commuting to place of work
Per cent
0%
2%
4%
6%
8%
10%
12%
14%
16%
18%
20%
0
500,000
1,000,000
1,500,000
2,000,000
2,500,000
3,000,000
3,500,000
4,000,000
4,500,000
2000 2001 2002 2003 2004 2005 2006 2007 2008 2009 2010 2011
Books, newspapers and magazines
Architectural business
Design, photography and translation
Theatre, concerts, artistic creation
Libraries and archives
Museums and cultural heritage collections
Film, video, TV, radio and press
Development in the population’s age composition
FACts ABout tHE ØREsunD REGIon | DEMoGRAPhiCS

10 Øresund Trends 2012
working age, Scanians supported three people more than the Danes.
By the turn of the year 2031–2032, it is expected that these figures will have increased to 0.79 (the Danish part) and 0.81 (the Swedish part). This will mean an increase in the dependency ratio of about 16 per cent in the Danish part and 14 per cent in the Swedish part. The gap between the two parts of the Øresund Region will then be narrowed down to a difference of about 2 per cent.
If you look at the breakdown of the dependency ratio between the two regions in the Danish part of the Øresund
FACts ABout tHE ØREsunD REGIon | DEMoGRAPhiCS
an increasing number of children and young people, especially in the Capital Region and Scania. This is due in large part to increased migration – both from peripheral areas in both countries and immigration from other countries – and that an increasing number are reaching childbearing age.
Consequences for the economy
The dependency ratio in the Øresund Region is expected to increase signif-icantly due to increasing population growth, especially in the non-active age groups, 0–19–year-olds and over 65s, which are growing faster than those aged 20–64.
The population’s changing age composi-tion will present challenges for the wel-fare state as we know it, particularly in relation to child care, schools, care of the elderly and demand for different types of housing. All types of care will come
under pressure because there will be few-er people of working age to support the overall dependency requirement, and more will demand public services.
The dependency ratio is defined as the burden of every person of working age (20–64) to provide beyond themselves. This ratio focuses purely on age, and not whether people of working age are in work or not.
In the Danish part of the Øresund Region, the dependency ratio in 2012 was 0.68 persons, while in the Swedish part it was marginally higher, at 0.71. This means that for every 100 people of
Development in dependency ratio (2012–2032)Geography 2011/2012 2012/2022 2031/2032Øresund Region DK 0.68 0.71 0.79Øresund Region SE 0.71 0.77 0.81Capital Region 0.64 0.65 0.72Region Zealand 0.77 0.86 0.98Source: Statistics Denmark, Statistics Sweden and Region Scania. The material has been processed by Region Scania.
11Øresund Trends 2012
Region, the difference between the two is significantly higher than the differ-ence between the Danish and Swedish parts. In 2012, the dependency ratio in the Capital Region was 0.64 while in Region Zealand it was 0.77 – a differ-ence of 0.13. At the turn of 2031–2032, the Capital Region's dependency ratio is expected to be 0.72, and Region Zealand will have a dependency ratio of 0.98 – these are significant increases of 27 per cent for Region Zealand and 13 per cent for the Capital Region, compared to 2012.
Although the dependency ratio is rising across the Øresund Region, the increase will be significantly greater in Region Zealand and Scania in comparison with the Capital Region. Scania and Region Zea-land will, at the turn of 2031–2032, have a dependency ratio of 0.81 and 0.98 respec-tively, while the Capital Region is expect-ed to have a dependency ratio of 0.72.
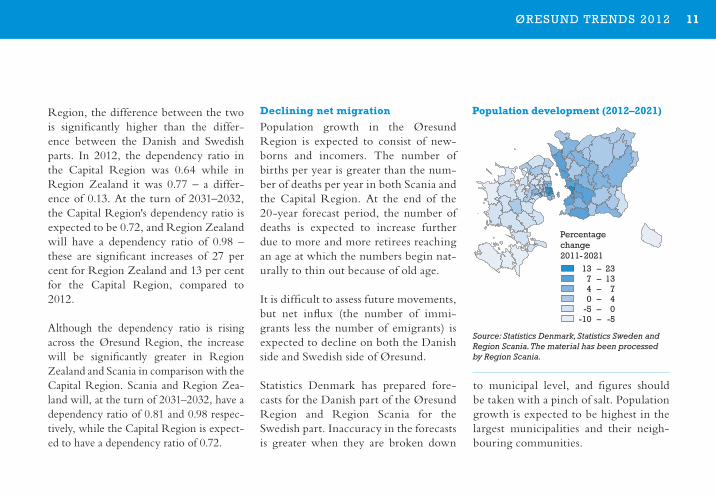
Declining net migration
Population growth in the Øresund Region is expected to consist of new-borns and incomers. The number of births per year is greater than the num-ber of deaths per year in both Scania and the Capital Region. At the end of the 20-year forecast period, the number of deaths is expected to increase further due to more and more retirees reaching an age at which the numbers begin nat-urally to thin out because of old age.
It is difficult to assess future movements, but net influx (the number of immi-grants less the number of emigrants) is expected to decline on both the Danish side and Swedish side of Øresund.
Statistics Denmark has prepared fore-casts for the Danish part of the Øresund Region and Region Scania for the Swedish part. Inaccuracy in the forecasts is greater when they are broken down
to municipal level, and figures should be taken with a pinch of salt. Population growth is expected to be highest in the largest municipalities and their neigh-bouring communities.
Percentage change 2011- 2021
13 – 23 7 – 13 4 – 7 0 – 4 -5 – 0 -10 – -5
Source: Statistics Denmark, Statistics Sweden and Region Scania. The material has been processed by Region Scania.
Population development (2012–2021)
FACts ABout tHE ØREsunD REGIon | DEMoGRAPhiCS
12 Øresund Trends 2012
EConoMiC DEvELoPMEnT
Gross regional product from a European perspective
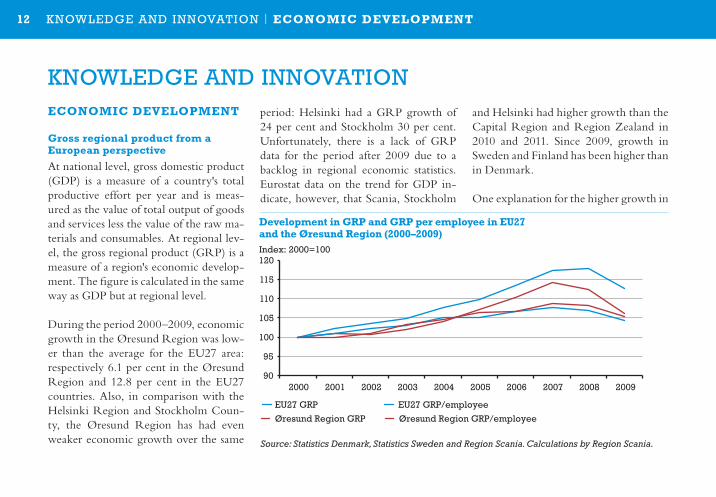
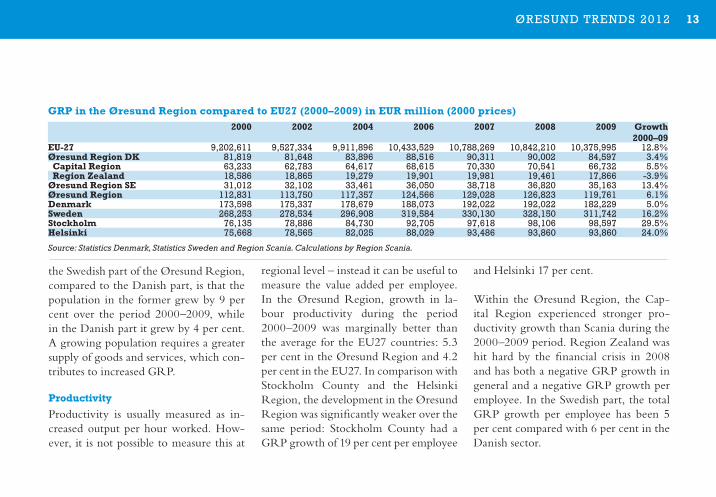
At national level, gross domestic product (GDP) is a measure of a country's total productive effort per year and is meas-ured as the value of total output of goods and services less the value of the raw ma-terials and consumables. At regional lev-el, the gross regional product (GRP) is a measure of a region's economic develop-ment. The figure is calculated in the same way as GDP but at regional level.
During the period 2000–2009, economic growth in the Øresund Region was low-er than the average for the EU27 area: respectively 6.1 per cent in the Øresund Region and 12.8 per cent in the EU27 countries. Also, in comparison with the Helsinki Region and Stockholm Coun-ty, the Øresund Region has had even weaker economic growth over the same
period: Helsinki had a GRP growth of 24 per cent and Stockholm 30 per cent. Unfortunately, there is a lack of GRP data for the period after 2009 due to a backlog in regional economic statistics. Eurostat data on the trend for GDP in-dicate, however, that Scania, Stockholm
and Helsinki had higher growth than the Capital Region and Region Zealand in 2010 and 2011. Since 2009, growth in Sweden and Finland has been higher than in Denmark.
One explanation for the higher growth in
90
95
100
105
110
115
120
2000 2001 2002 2003 2004 2005 2006 2007 2008 2009
Index: 2000=100
EU27 GRP
Øresund Region GRP
EU27 GRP/employee
Øresund Region GRP/employee
90
95
100
105
110
115
120
125
130
2000 2001 2002 2003 2004 2005 2006 2007 2008 2009
Øresund Region DK
Region Zealand
Capital Region
Øresund Region SE (Scania)
Development in GRP and GRP per employee in EU27 and the Øresund Region (2000–2009)
Source: Statistics Denmark, Statistics Sweden and Region Scania. Calculations by Region Scania.
KnoWlEDGE AnD InnovAtIon | EConoMiC DEvELoPMEnT
KnoWlEDGE AnD InnovAtIon
13Øresund Trends 2012
GRP in the Øresund Region compared to EU27 (2000–2009) in EUR million (2000 prices)2000 2002 2004 2006 2007 2008 2009 Growth
2000–09EU-27 9,202,611 9,527,334 9,911,896 10,433,529 10,788,269 10,842,210 10,375,995 12.8%Øresund Region DK 81,819 81,648 83,896 88,516 90,311 90,002 84,597 3.4% Capital Region 63,233 62,783 64,617 68,615 70,330 70,541 66,732 5.5% Region Zealand 18,586 18,865 19,279 19,901 19,981 19,461 17,866 -3.9%Øresund Region SE 31,012 32,102 33,461 36,050 38,718 36,820 35,163 13.4%Øresund Region 112,831 113,750 117,357 124,566 129,028 126,823 119,761 6.1%Denmark 173,598 175,337 178,679 188,073 192,022 192,022 182,229 5.0%Sweden 268,253 278,534 296,908 319,584 330,130 328,150 311,742 16.2%Stockholm 76,135 78,886 84,730 92,705 97,618 98,106 98,597 29.5%helsinki 75,668 78,565 82,025 88,029 93,486 93,860 93,860 24.0%
Source: Statistics Denmark, Statistics Sweden and Region Scania. Calculations by Region Scania.
the Swedish part of the Øresund Region, compared to the Danish part, is that the population in the former grew by 9 per cent over the period 2000–2009, while in the Danish part it grew by 4 per cent. A growing population requires a greater supply of goods and services, which con-tributes to increased GRP.
Productivity
Productivity is usually measured as in-creased output per hour worked. How-ever, it is not possible to measure this at
regional level – instead it can be useful to measure the value added per employee. In the Øresund Region, growth in la-bour productivity during the period 2000–2009 was marginally better than the average for the EU27 countries: 5.3 per cent in the Øresund Region and 4.2 per cent in the EU27. In comparison with Stockholm County and the Helsinki Region, the development in the Øresund Region was significantly weaker over the same period: Stockholm County had a GRP growth of 19 per cent per employee
and Helsinki 17 per cent.
Within the Øresund Region, the Cap-ital Region experienced stronger pro-ductivity growth than Scania during the 2000–2009 period. Region Zealand was hit hard by the financial crisis in 2008 and has both a negative GRP growth in general and a negative GRP growth per employee. In the Swedish part, the total GRP growth per employee has been 5 per cent compared with 6 per cent in the Danish sector.
KnoWlEDGE AnD InnovAtIon | EConoMiC DEvELoPMEnT
14 Øresund Trends 201290
95
100
105
110
115
120
2000 2001 2002 2003 2004 2005 2006 2007 2008 2009
Index: 2000=100
EU27 GRP
Øresund Region GRP
EU27 GRP/employee
Øresund Region GRP/employee
90
95
100
105
110
115
120
125
130
2000 2001 2002 2003 2004 2005 2006 2007 2008 2009
Øresund Region DK
Region Zealand
Capital Region
Øresund Region SE (Scania)
GRP development in the Øresund Region (2000–2009)
Source: Statistics Denmark, Statistics Sweden and Region Scania. Calculations by Region Scania.
GRP per employee in the Øresund Region compared to EU27 (2000–2009) in EUR (2000 prices) 2000 2002 2004 2006 2007 2008 2009 Growth
2000–09EU-27 45,579 46,583 47,863 48,592 49,113 48,790 47,516 4.2%Øresund Region DK 65,517 66,209 68,546 69,658 70,359 71,448 69,271 5.7% Capital Region 68,873 69,403 72,161 73,976 74,938 76,131 74,021 7.5% Region Zealand 56,200 57,416 58,690 57,989 57,905 58,423 55,878 -0.6%Øresund Region SE 64,261 65,008 67,106 69,311 72,290 68,606 67,161 4.5%Øresund Region 65,167 65,866 68,129 69,557 70,927 70,599 68,638 5.3%Denmark 63,540 64,859 66,753 67,480 68,043 69,986 69,118 8.8%Sweden 66,024 67,162 71,148 74,480 75,010 74,283 72,649 10.0%Stockholm 79,274 80,993 87,712 92,698 94,286 93,057 94,498 19.2%helsinki 61,614 62,586 65,963 68,329 71,249 70,150 72,045 16.9%
Source: Statistics Denmark, Statistics Sweden and Region Scania. Calculations by Region Scania.
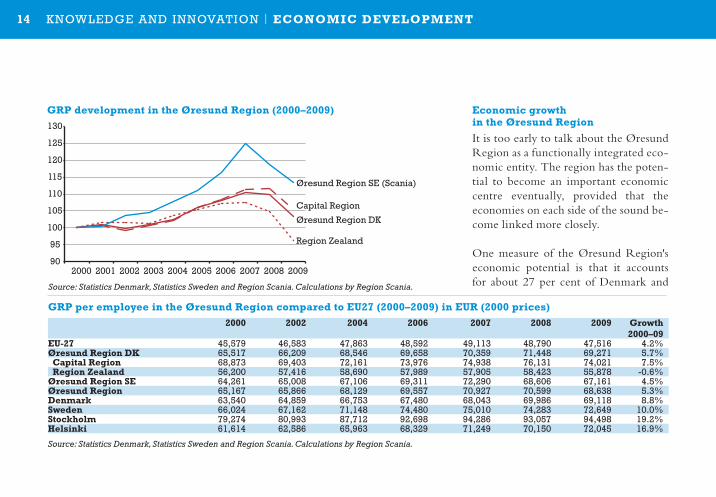
Economic growth in the Øresund Region
It is too early to talk about the Øresund Region as a functionally integrated eco-nomic entity. The region has the poten-tial to become an important economic centre eventually, provided that the economies on each side of the sound be-come linked more closely.
One measure of the Øresund Region's economic potential is that it accounts for about 27 per cent of Denmark and
KnoWlEDGE AnD InnovAtIon | EConoMiC DEvELoPMEnT
15Øresund Trends 2012
Sweden's total GDP. In 2009, the Danish part of the Øresund Region accounted for 49 per cent of Denmark’s total GDP. The Capital Region alone accounted for 38 per cent and Region Zealand for 11 per cent. The Swedish part of the Øresund Region accounted for 11 per cent of Sweden's total GDP, which has remained unchanged since 2000.
The Danish part of the Øresund Region accounts for two-thirds of the Øresund Region's total GRP. GRP growth has been higher in Scania than in the Dan-ish part of the Øresund Region, partly due to the fact that the financial cri-sis hit Denmark harder than Sweden. While Scania’s GRP increased by 13 per cent during the period, the corre-sponding increase in the Danish part of the Øresund Region was just 3 per cent.
KnoWlEDGE AnD InnovAtIon | EConoMiC DEvELoPMEnT
16 Øresund Trends 2012
BUSinESS STRUCTURE
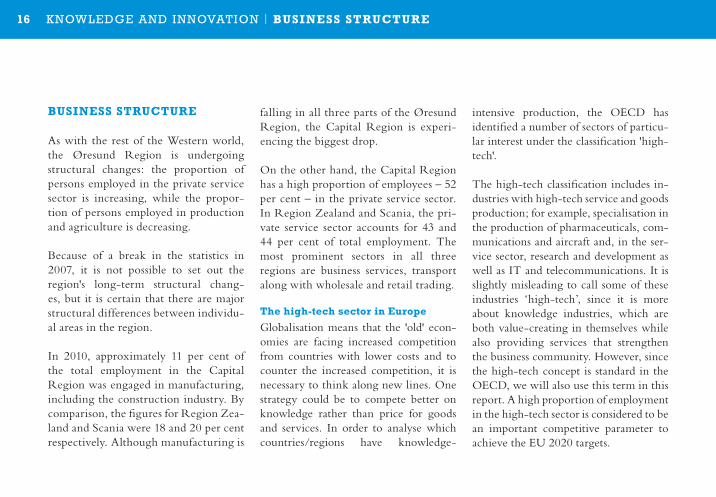
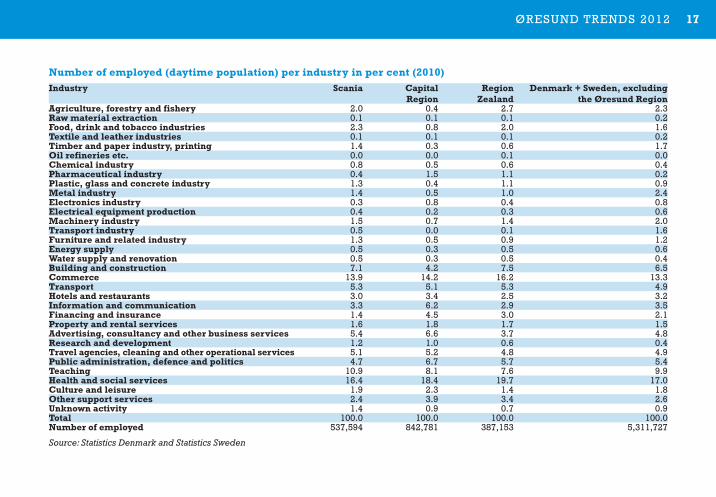
As with the rest of the Western world, the Øresund Region is undergoing structural changes: the proportion of persons employed in the private service sector is increasing, while the propor-tion of persons employed in production and agriculture is decreasing.
Because of a break in the statistics in 2007, it is not possible to set out the region's long-term structural chang-es, but it is certain that there are major structural differences between individu-al areas in the region.
In 2010, approximately 11 per cent of the total employment in the Capital Region was engaged in manufacturing, including the construction industry. By comparison, the figures for Region Zea-land and Scania were 18 and 20 per cent respectively. Although manufacturing is
falling in all three parts of the Øresund Region, the Capital Region is experi-encing the biggest drop.
On the other hand, the Capital Region has a high proportion of employees – 52 per cent – in the private service sector. In Region Zealand and Scania, the pri-vate service sector accounts for 43 and 44 per cent of total employment. The most prominent sectors in all three regions are business services, transport along with wholesale and retail trading.
The high-tech sector in Europe
Globalisation means that the 'old' econ-omies are facing increased competition from countries with lower costs and to counter the increased competition, it is necessary to think along new lines. One strategy could be to compete better on knowledge rather than price for goods and services. In order to analyse which countries/regions have knowledge-
intensive production, the OECD has identified a number of sectors of particu-lar interest under the classification 'high-tech'.
The high-tech classification includes in-dustries with high-tech service and goods production; for example, specialisation in the production of pharmaceuticals, com-munications and aircraft and, in the ser-vice sector, research and development as well as IT and telecommunications. It is slightly misleading to call some of these industries ‘high-tech’, since it is more about knowledge industries, which are both value-creating in themselves while also providing services that strengthen the business community. However, since the high-tech concept is standard in the OECD, we will also use this term in this report. A high proportion of employment in the high-tech sector is considered to be an important competitive parameter to achieve the EU 2020 targets.
KnoWlEDGE AnD InnovAtIon | BUSinESS STRUCTURE
17Øresund Trends 2012
number of employed (daytime population) per industry in per cent (2010)industry Scania Capital
RegionRegion
ZealandDenmark + Sweden, excluding
the Øresund RegionAgriculture, forestry and fishery 2.0 0.4 2.7 2.3Raw material extraction 0.1 0.1 0.1 0.2Food, drink and tobacco industries 2.3 0.8 2.0 1.6Textile and leather industries 0.1 0.1 0.1 0.2Timber and paper industry, printing 1.4 0.3 0.6 1.7oil refineries etc . 0.0 0.0 0.1 0.0Chemical industry 0.8 0.5 0.6 0.4Pharmaceutical industry 0.4 1.5 1.1 0.2Plastic, glass and concrete industry 1.3 0.4 1.1 0.9Metal industry 1.4 0.5 1.0 2.4Electronics industry 0.3 0.8 0.4 0.8Electrical equipment production 0.4 0.2 0.3 0.6Machinery industry 1.5 0.7 1.4 2.0Transport industry 0.5 0.0 0.1 1.6Furniture and related industry 1.3 0.5 0.9 1.2Energy supply 0.5 0.3 0.5 0.6Water supply and renovation 0.5 0.3 0.5 0.4Building and construction 7.1 4.2 7.5 6.5Commerce 13.9 14.2 16.2 13.3Transport 5.3 5.1 5.3 4.9hotels and restaurants 3.0 3.4 2.5 3.2information and communication 3.3 6.2 2.9 3.5Financing and insurance 1.4 4.5 3.0 2.1Property and rental services 1.6 1.8 1.7 1.5Advertising, consultancy and other business services 5.4 6.6 3.7 4.8Research and development 1.2 1.0 0.6 0.4Travel agencies, cleaning and other operational services 5.1 5.2 4.8 4.9Public administration, defence and politics 4.7 6.7 5.7 5.4Teaching 10.9 8.1 7.6 9.9health and social services 16.4 18.4 19.7 17.0Culture and leisure 1.9 2.3 1.4 1.8other support services 2.4 3.9 3.4 2.6Unknown activity 1.4 0.9 0.7 0.9Total 100.0 100.0 100.0 100.0number of employed 537,594 842,781 387,153 5,311,727
Source: Statistics Denmark and Statistics Sweden
KnoWlEDGE AnD InnovAtIon | BUSinESS STRUCTURE
18 Øresund Trends 2012
1Nuts2 is EU's regional subdivision and comprises a total of 319 regions – the majority of Eurostat's regional statistics are reported at Nuts2 level. Not all the regions are included in the statistics. In this report we have worked with a benchmark of approximately 150 European regions.
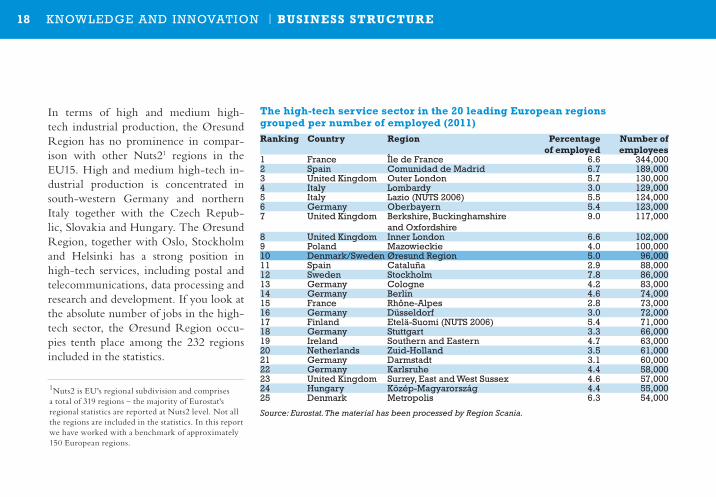
In terms of high and medium high-tech industrial production, the Øresund Region has no prominence in compar-ison with other Nuts21 regions in the EU15. High and medium high-tech in-dustrial production is concentrated in south-western Germany and northern Italy together with the Czech Repub-lic, Slovakia and Hungary. The Øresund Region, together with Oslo, Stockholm and Helsinki has a strong position in high-tech services, including postal and telecommunications, data processing and research and development. If you look at the absolute number of jobs in the high-tech sector, the Øresund Region occu-pies tenth place among the 232 regions included in the statistics.
The high-tech service sector in the 20 leading European regions grouped per number of employed (2011)Ranking Country Region Percentage
of employednumber of employees
1 France Île de France 6.6 344,0002 spain Comunidad de Madrid 6.7 189,0003 united Kingdom outer london 5.7 130,0004 Italy lombardy 3.0 129,0005 Italy lazio (nuts 2006) 5.5 124,0006 Germany oberbayern 5.4 123,0007 united Kingdom Berkshire, Buckinghamshire
and oxfordshire9.0 117,000
8 united Kingdom Inner london 6.6 102,0009 Poland Mazowieckie 4.0 100,00010 Denmark/sweden Øresund Region 5.0 96,00011 spain Cataluña 2.9 88,00012 sweden stockholm 7.8 86,00013 Germany Cologne 4.2 83,00014 Germany Berlin 4.6 74,00015 France Rhône-Alpes 2.8 73,00016 Germany Düsseldorf 3.0 72,00017 Finland Etelä-suomi (nuts 2006) 5.4 71,00018 Germany stuttgart 3.3 66,00019 Ireland southern and Eastern 4.7 63,00020 netherlands Zuid-Holland 3.5 61,00021 Germany Darmstadt 3.1 60,00022 Germany Karlsruhe 4.4 58,00023 united Kingdom surrey, East and West sussex 4.6 57,00024 Hungary Közép-Magyarország 4.4 55,00025 Denmark Metropolis 6.3 54,000
Source: Eurostat. The material has been processed by Region Scania.
KnoWlEDGE AnD InnovAtIon | BUSinESS STRUCTURE
19Øresund Trends 2012
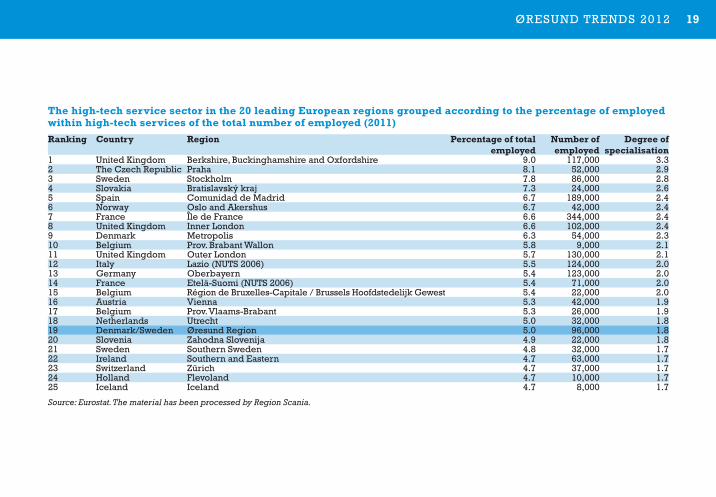
The high-tech service sector in the 20 leading European regions grouped according to the percentage of employed within high-tech services of the total number of employed (2011)Ranking Country Region Percentage of total
employednumber of employed
Degree of specialisation
1 united Kingdom Berkshire, Buckinghamshire and oxfordshire 9.0 117,000 3.32 the Czech Republic Praha 8.1 52,000 2.93 sweden stockholm 7.8 86,000 2.84 slovakia Bratislavský kraj 7.3 24,000 2.65 spain Comunidad de Madrid 6.7 189,000 2.46 norway oslo and Akershus 6.7 42,000 2.47 France Île de France 6.6 344,000 2.48 united Kingdom Inner london 6.6 102,000 2.49 Denmark Metropolis 6.3 54,000 2.310 Belgium Prov. Brabant Wallon 5.8 9,000 2.111 united Kingdom outer london 5.7 130,000 2.112 Italy lazio (nuts 2006) 5.5 124,000 2.013 Germany oberbayern 5.4 123,000 2.014 France Etelä-suomi (nuts 2006) 5.4 71,000 2.015 Belgium Région de Bruxelles-Capitale / Brussels Hoofdstedelijk Gewest 5.4 22,000 2.016 Austria vienna 5.3 42,000 1.917 Belgium Prov. vlaams-Brabant 5.3 26,000 1.918 netherlands utrecht 5.0 32,000 1.819 Denmark/sweden Øresund Region 5.0 96,000 1.820 slovenia Zahodna slovenija 4.9 22,000 1.821 sweden southern sweden 4.8 32,000 1.722 Ireland southern and Eastern 4.7 63,000 1.723 switzerland Zürich 4.7 37,000 1.724 Holland Flevoland 4.7 10,000 1.725 Iceland Iceland 4.7 8,000 1.7
Source: Eurostat. The material has been processed by Region Scania.
The high-tech service sector in the 20 leading European regions grouped per number of employed (2011)Ranking Country Region Percentage
of employednumber of employees
1 France Île de France 6.6 344,0002 spain Comunidad de Madrid 6.7 189,0003 united Kingdom outer london 5.7 130,0004 Italy lombardy 3.0 129,0005 Italy lazio (nuts 2006) 5.5 124,0006 Germany oberbayern 5.4 123,0007 united Kingdom Berkshire, Buckinghamshire
and oxfordshire9.0 117,000
8 united Kingdom Inner london 6.6 102,0009 Poland Mazowieckie 4.0 100,00010 Denmark/sweden Øresund Region 5.0 96,00011 spain Cataluña 2.9 88,00012 sweden stockholm 7.8 86,00013 Germany Cologne 4.2 83,00014 Germany Berlin 4.6 74,00015 France Rhône-Alpes 2.8 73,00016 Germany Düsseldorf 3.0 72,00017 Finland Etelä-suomi (nuts 2006) 5.4 71,00018 Germany stuttgart 3.3 66,00019 Ireland southern and Eastern 4.7 63,00020 netherlands Zuid-Holland 3.5 61,00021 Germany Darmstadt 3.1 60,00022 Germany Karlsruhe 4.4 58,00023 united Kingdom surrey, East and West sussex 4.6 57,00024 Hungary Közép-Magyarország 4.4 55,00025 Denmark Metropolis 6.3 54,000
Source: Eurostat. The material has been processed by Region Scania.
KnoWlEDGE AnD InnovAtIon | BUSinESS STRUCTURE
20 Øresund Trends 2012
2FA: Functional labour market region
KnoWlEDGE AnD InnovAtIon | BUSinESS STRUCTURE
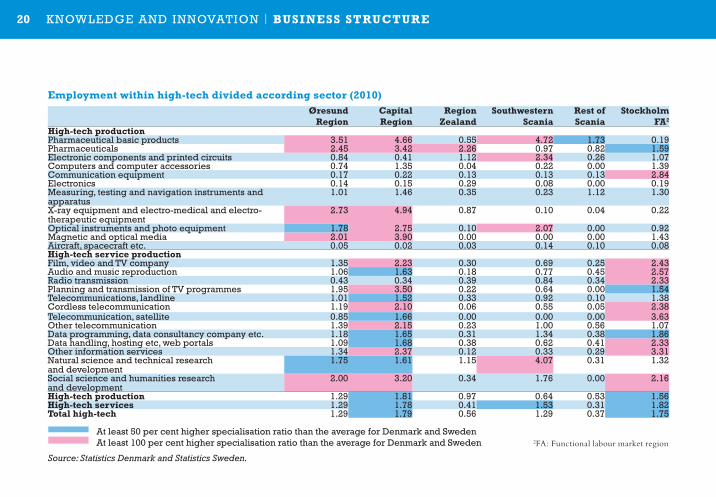
Employment within high-tech divided according sector (2010)Øresund
RegionCapital Region
Region Zealand
Southwestern Scania
Rest of Scania
Stockholm FA2
high-tech productionPharmaceutical basic products 3.51 4.66 0.55 4.72 1.73 0.19Pharmaceuticals 2.45 3.42 2.26 0.97 0.82 1.59Electronic components and printed circuits 0.84 0.41 1.12 2.34 0.26 1.07Computers and computer accessories 0.74 1.35 0.04 0.22 0.00 1.39Communication equipment 0.17 0.22 0.13 0.13 0.13 2.84Electronics 0.14 0.15 0.29 0.08 0.00 0.19Measuring, testing and navigation instruments and apparatus
1.01 1.46 0.35 0.23 1.12 1.30
X-ray equipment and electro-medical and electro-therapeutic equipment
2.73 4.94 0.87 0.10 0.04 0.22
optical instruments and photo equipment 1.78 2.75 0.10 2.07 0.00 0.92Magnetic and optical media 2.01 3.90 0.00 0.00 0.00 1.43Aircraft, spacecraft etc. 0.05 0.02 0.03 0.14 0.10 0.08high-tech service productionFilm, video and tv company 1.35 2.23 0.30 0.69 0.25 2.43Audio and music reproduction 1.06 1.63 0.18 0.77 0.45 2.57Radio transmission 0.43 0.34 0.39 0.84 0.34 2.33Planning and transmission of tv programmes 1.95 3.50 0.22 0.64 0.00 1.54telecommunications, landline 1.01 1.52 0.33 0.92 0.10 1.38Cordless telecommunication 1.19 2.10 0.06 0.55 0.05 2.38telecommunication, satellite 0.85 1.66 0.00 0.00 0.00 3.63other telecommunication 1.39 2.15 0.23 1.00 0.56 1.07Data programming, data consultancy company etc. 1.18 1.65 0.31 1.34 0.38 1.86Data handling, hosting etc, web portals 1.09 1.68 0.38 0.62 0.41 2.33other information services 1.34 2.37 0.12 0.33 0.29 3.31natural science and technical research and development
1.75 1.61 1.15 4.07 0.31 1.32
social science and humanities research and development
2.00 3.20 0.34 1.76 0.00 2.16
high-tech production 1.29 1.81 0.97 0.64 0.53 1.56high-tech services 1.29 1.78 0.41 1.53 0.31 1.82Total high-tech 1.29 1.79 0.56 1.29 0.37 1.75
At least 50 per cent higher specialisation ratio than the average for Denmark and sweden At least 100 per cent higher specialisation ratio than the average for Denmark and sweden
Source: Statistics Denmark and Statistics Sweden.
21Øresund Trends 2012
“Specialisation ratio” measures the share of employment in the high-tech sector in a region divided by the average em-ployment share in all regions.
Berkshire, Buckinghamshire and Ox-fordshire are the regions with the high-est proportion employed in high-tech services (9 per cent of total employ-ment), which gives a specialisation ratio of 3.3. Stockholm occupies third place with 7.8 per cent of employment and a specialisation ratio of 2.9. The Capital Region is in ninth place with 6.3 per cent of employment in high-tech serv- ices and a specialisation ratio of 2.3, while the Øresund Region is in nine-teenth place with 5 per cent employed in high-tech services, which corresponds to a specialisation ratio of 1.8.
The high-tech sectors in Denmark and Sweden
From a Danish-Swedish perspective, the Øresund Region's high-tech profile is not as strong as it is from a European perspective. By calculating a regional specialisation index for the high-tech sector, where 1 is equal to the average for Denmark and Sweden combined, it becomes possible to describe the tech-nological profile for each region. The Stockholm Region has a high-tech spe-cialisation index of some 60 per cent above the average for Denmark and Sweden. By comparison, the Øresund Region has a specialisation index of only 29 per cent of the Danish-Swedish average. Within the Øresund Region, the Capital Region has the highest spe-cialisation ratio with 57 per cent above the Danish-Swedish average, while southwestern Scania has 51 per cent.
Stockholm has a significantly higher
specialisation ratio within high-tech than the Øresund Region. If you look at industries in the high-tech sector indi-vidually, the picture changes somewhat. For example, the Øresund Region has a competitive position in pharmaceutical production compared to Stockholm.
Within the Øresund Region, Scania specialises not only in manufacturing, but also in natural science and technical research and development; for example, there are several research and develop-ment-intensive enterprises in both bio-technology and telecommunications.
The Capital Region occupies a prom-inent position, primarily in the phar-maceutical industry, other advanced technological production and other data related industries.
Region Zealand specialises particularly in medical technology. Of all employ-
KnoWlEDGE AnD InnovAtIon | BUSinESS STRUCTURE
22 Øresund Trends 2012
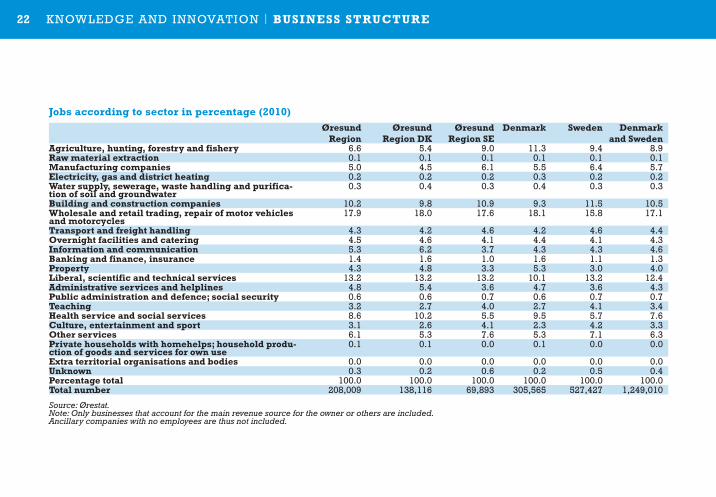
Jobs according to sector in percentage (2010)Øresund
RegionØresund
Region DKØresund
Region SEDenmark Sweden Denmark
and SwedenAgriculture, hunting, forestry and fishery 6.6 5.4 9.0 11.3 9.4 8.9Raw material extraction 0.1 0.1 0.1 0.1 0.1 0.1Manufacturing companies 5.0 4.5 6.1 5.5 6.4 5.7Electricity, gas and district heating 0.2 0.2 0.2 0.3 0.2 0.2Water supply, sewerage, waste handling and purifica-tion of soil and groundwater
0.3 0.4 0.3 0.4 0.3 0.3
Building and construction companies 10.2 9.8 10.9 9.3 11.5 10.5Wholesale and retail trading, repair of motor vehicles and motorcycles
17.9 18.0 17.6 18.1 15.8 17.1
Transport and freight handling 4.3 4.2 4.6 4.2 4.6 4.4overnight facilities and catering 4.5 4.6 4.1 4.4 4.1 4.3information and communication 5.3 6.2 3.7 4.3 4.3 4.6Banking and finance, insurance 1.4 1.6 1.0 1.6 1.1 1.3Property 4.3 4.8 3.3 5.3 3.0 4.0Liberal, scientific and technical services 13.2 13.2 13.2 10.1 13.2 12.4Administrative services and helplines 4.8 5.4 3.6 4.7 3.6 4.3Public administration and defence; social security 0.6 0.6 0.7 0.6 0.7 0.7Teaching 3.2 2.7 4.0 2.7 4.1 3.4health service and social services 8.6 10.2 5.5 9.5 5.7 7.6Culture, entertainment and sport 3.1 2.6 4.1 2.3 4.2 3.3other services 6.1 5.3 7.6 5.3 7.1 6.3Private households with homehelps; household produ-ction of goods and services for own use
0.1 0.1 0.0 0.1 0.0 0.0
Extra territorial organisations and bodies 0.0 0.0 0.0 0.0 0.0 0.0Unknown 0.3 0.2 0.6 0.2 0.5 0.4Percentage total 100.0 100.0 100.0 100.0 100.0 100.0Total number 208,009 138,116 69,893 305,565 527,427 1,249,010
Source: Ørestat.Note: Only businesses that account for the main revenue source for the owner or others are included. Ancillary companies with no employees are thus not included.
KnoWlEDGE AnD InnovAtIon | BUSinESS STRUCTURE
23Øresund Trends 2012
ees in the pharmaceutical industry in Denmark and Sweden, 62 per cent were found in the Øresund Region in 2010.
It should be remembered, however, that the above information is from 2010. Since then there has been a major re-structuring of the telecommunications and medical technology industries in the Øresund Region: Nokia in Copen-hagen and AstraZeneca in Lund have closed while Sony has announced cuts.
The Øresund Region had well over 44,000 employees (2010) in technical research and high-tech manufacturing – which accounts for 35 per cent of Den-mark's and Sweden's total employment in this sector – and is the largest know-ledge centre, followed by Stockholm FA in second place with 32,800 people em-
ployed within this sector. It is important, however, to remember that the Øresund Region cannot yet be described as an economically homogeneous region in the same way as other metropolitan regions like Stockholm, for example. In the longer term, increased integra-tion between business in Zealand and in Scania will be encouraged through scale effects3, which can also help to strength-en the Øresund Region's position in terms of competition and in cooperation
with other metropolitan regions across the rest of Scandinavia and Europe.
Jobs in the Øresund Region
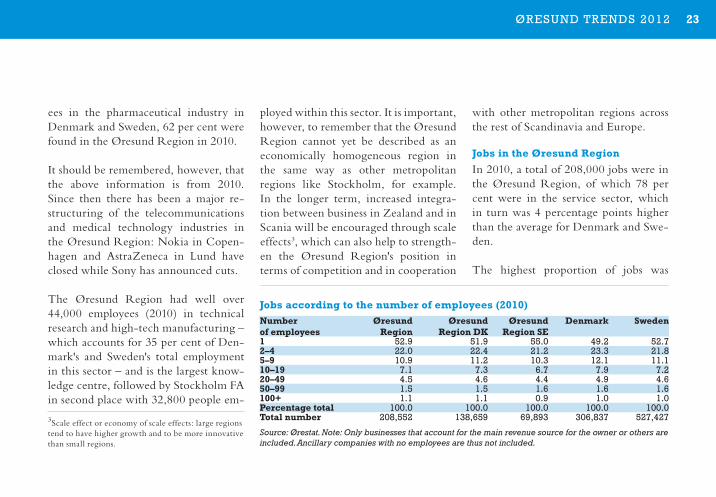
In 2010, a total of 208,000 jobs were in the Øresund Region, of which 78 per cent were in the service sector, which in turn was 4 percentage points higher than the average for Denmark and Swe-den.
The highest proportion of jobs was
Jobs according to the number of employees (2010)number of employees
Øresund Region
Øresund Region DK
Øresund Region SE
Denmark Sweden
1 52.9 51.9 55.0 49.2 52.72–4 22.0 22.4 21.2 23.3 21.85–9 10.9 11.2 10.3 12.1 11.110–19 7.1 7.3 6.7 7.9 7.220–49 4.5 4.6 4.4 4.9 4.650–99 1.5 1.5 1.6 1.6 1.6100+ 1.1 1.1 0.9 1.0 1.0Percentage total 100.0 100.0 100.0 100.0 100.0Total number 208,552 138,659 69,893 306,837 527,427
Source: Ørestat. Note: Only businesses that account for the main revenue source for the owner or others are included. Ancillary companies with no employees are thus not included.
KnoWlEDGE AnD InnovAtIon | BUSinESS STRUCTURE
3Scale effect or economy of scale effects: large regions tend to have higher growth and to be more innovative than small regions.
24 Øresund Trends 2012
made it a priority to increase the number of start-ups in future.
Both the Danish and the Swedish side of the Øresund Region have a higher proportion of start-ups than the average for the respective countries. The num-ber of start-ups is higher in Sweden than in Denmark. The number of start-ups in the Capital Region is lower than in Stockholm County and Scania, but is higher than in Region Zealand.
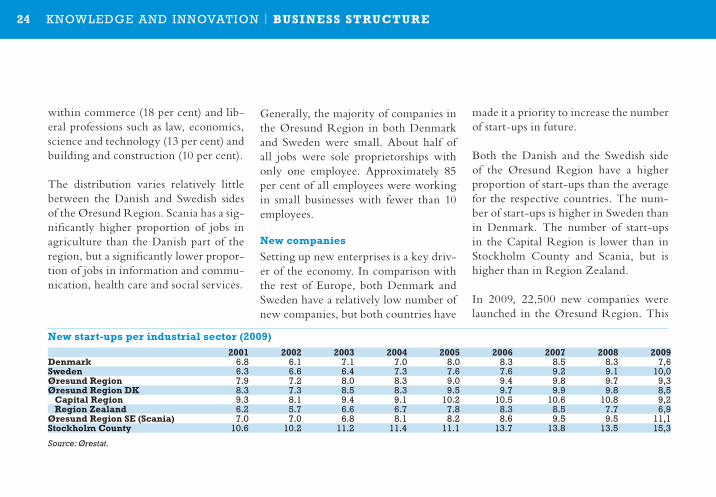
In 2009, 22,500 new companies were launched in the Øresund Region. This
within commerce (18 per cent) and lib-eral professions such as law, economics, science and technology (13 per cent) and building and construction (10 per cent).
The distribution varies relatively little between the Danish and Swedish sides of the Øresund Region. Scania has a sig-nificantly higher proportion of jobs in agriculture than the Danish part of the region, but a significantly lower propor-tion of jobs in information and commu-nication, health care and social services.
Generally, the majority of companies in the Øresund Region in both Denmark and Sweden were small. About half of all jobs were sole proprietorships with only one employee. Approximately 85 per cent of all employees were working in small businesses with fewer than 10 employees.
new companies
Setting up new enterprises is a key driv-er of the economy. In comparison with the rest of Europe, both Denmark and Sweden have a relatively low number of new companies, but both countries have
new start-ups per industrial sector (2009)2001 2002 2003 2004 2005 2006 2007 2008 2009
Denmark 6.8 6.1 7.1 7.0 8.0 8.3 8.5 8.3 7,6Sweden 6.3 6.6 6.4 7.3 7.6 7.6 9.2 9.1 10,0Øresund Region 7.9 7.2 8.0 8.3 9.0 9.4 9.8 9.7 9,3Øresund Region DK 8.3 7.3 8.5 8.3 9.5 9.7 9.9 9.8 8,5 Capital Region 9.3 8.1 9.4 9.1 10.2 10.5 10.6 10.8 9,2 Region Zealand 6.2 5.7 6.6 6.7 7.8 8.3 8.5 7.7 6,9Øresund Region SE (Scania) 7.0 7.0 6.8 8.1 8.2 8.6 9.5 9.5 11,1Stockholm County 10.6 10.2 11.2 11.4 11.1 13.7 13.8 13.5 15,3
Source: Ørestat.
KnoWlEDGE AnD InnovAtIon | BUSinESS STRUCTURE
25Øresund Trends 2012KnoWlEDGE AnD InnovAtIon | BUSinESS STRUCTURE
Full-time work in new start-ups as a percentage (2009)Øresund
Region Øresund
Region DKØresund
Region SESweden Denmark Sweden +
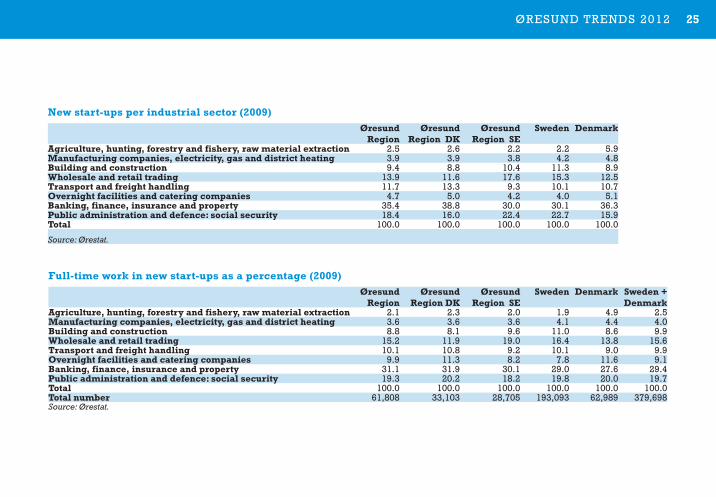
DenmarkAgriculture, hunting, forestry and fishery, raw material extraction 2.1 2.3 2.0 1.9 4.9 2.5Manufacturing companies, electricity, gas and district heating 3.6 3.6 3.6 4.1 4.4 4.0Building and construction 8.8 8.1 9.6 11.0 8.6 9.9Wholesale and retail trading 15.2 11.9 19.0 16.4 13.8 15.6Transport and freight handling 10.1 10.8 9.2 10.1 9.0 9.9overnight facilities and catering companies 9.9 11.3 8.2 7.8 11.6 9.1Banking, finance, insurance and property 31.1 31.9 30.1 29.0 27.6 29.4Public administration and defence: social security 19.3 20.2 18.2 19.8 20.0 19.7Total 100.0 100.0 100.0 100.0 100.0 100.0Total number 61,808 33,103 28,705 193,093 62,989 379,698Source: Ørestat.
new start-ups per industrial sector (2009)Øresund
Region Øresund
Region DKØresund
Region SESweden Denmark
Agriculture, hunting, forestry and fishery, raw material extraction 2.5 2.6 2.2 2.2 5.9Manufacturing companies, electricity, gas and district heating 3.9 3.9 3.8 4.2 4.8Building and construction 9.4 8.8 10.4 11.3 8.9Wholesale and retail trading 13.9 11.6 17.6 15.3 12.5Transport and freight handling 11.7 13.3 9.3 10.1 10.7overnight facilities and catering companies 4.7 5.0 4.2 4.0 5.1Banking, finance, insurance and property 35.4 38.8 30.0 30.1 36.3Public administration and defence: social security 18.4 16.0 22.4 22.7 15.9Total 100.0 100.0 100.0 100.0 100.0
Source: Ørestat.
26 Øresund Trends 2012
figure represents 26 per cent of all new businesses in Denmark and Sweden. 61 per cent of the new businesses were established on the Danish side of the Øresund.
The majority of new companies in the Øresund Region were set up in the financial and business services sectors (35 per cent), commerce (14 per cent), build-ing and construction (9 per cent) and hotels and restaurants (5 per cent). The industry breakdown of start-ups in Sca-nia roughly corresponds to the distribu-tion in Sweden as a whole, but with some over-representation in terms of wholesale and retail businesses. The Danish part of the Øresund Region differs primarily from Denmark as a whole in that it has a larger share in the financial sector and business services together with a smaller share of start-up companies in the whole-sale and retail trade. Industry structural differences are greater between the Dan-
ish and the Swedish parts of the Øresund Region than they are in proportion to the respective countries as a whole.
In 2009, 31 per cent of man years in the Øresund Region's new businesses were established in the financial sector and business services. This was followed by commerce (15 per cent) and transport and communications (10 per cent). This pattern is consistent regardless of geog-raphy.
KnoWlEDGE AnD InnovAtIon | BUSinESS STRUCTURE

27Øresund Trends 2012KnoWlEDGE AnD InnovAtIon | BUSinESS STRUCTURE
28 Øresund Trends 2012
RESEARCh AnD DEvELoPMEnT
The first phase of the innovation process is usually founded upon research and development (R&D). The knowledge base that underlies high tech and quali-tative products, goods and services arises from this.
However, it is far from certain wheth-er the results of R&D are always com-mercialised in the same region in which the research takes place. This can affect economic growth1.
The regional return on R&D invest-ment depends on several factors, such as conducting R&D projects in rela-
tion to other economic activities in the value chain: R&D activity focus (basic research, applied research or experi-mental development), the regional mar-ket size and access to capital. The time factor also plays an important role in the innovation process, which can frequent-ly have a time frame of several decades. A specialised R&D sector of appropriate size and quality is the first step towards financial success in the modern knowl-edge economy.
In this context, the Øresund Region occupies a prominent place at the Nor-dic and European level (see page 16 on business structure). This is also reflected in access to capital – especially foreign capital – to finance R&D. In addition,
the Nordic countries are generally char-acterised by a good business climate2.
R&D investments
Investment in R&D is a key objective of regional capacity and willingness to optimise the knowledge base. It does not, however, necessarily mean that all investments in R&D are transformed into commercial products. The EU2020 plan, which aims to make the EU the world's most competitive knowledge economy, uses R&D investments as one of 14 indicators to measure progress. The goal is an investment level of at least 3 per cent of GDP.
The Nordic countries – apart from Nor-way and Iceland – are world leaders in
1This is supported by empirical studies. Further evidence to support it is demonstrated in a 2006 study, which included Nuts2 regions that compared R&D intensity and number of patents on the one hand against economic development (measured in GDP per capita) on the other. The study showed that the region that invested the most in R&D – Braunschweig in Germany – was simultaneously the fourth weakest region in terms of economic growth. Conversely, none of the league's top 10 growth regions has an R&D intensity of more than 2 per cent (Hanell, T & Neubauer, J: Geographies of Knowledge Production in Europe. Nordregio WP 2006: 3).
2Forbes Best Countries for Business 2011. The Nordic countries' position in the world (in parentheses): Denmark (5), Sweden (7), Norway (8), Finland (13) and Iceland (23).
KnoWlEDGE AnD InnovAtIon | RESEARCh AnD DEvELoPMEnT
29Øresund Trends 2012
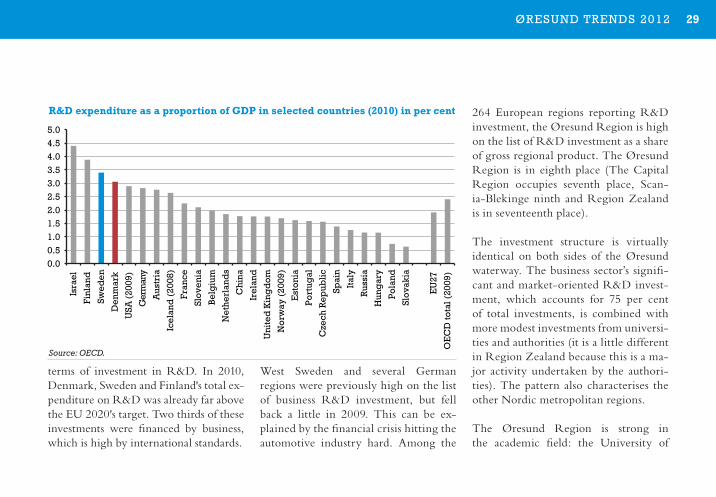
terms of investment in R&D. In 2010, Denmark, Sweden and Finland's total ex-penditure on R&D was already far above the EU 2020's target. Two thirds of these investments were financed by business, which is high by international standards.
West Sweden and several German regions were previously high on the list of business R&D investment, but fell back a little in 2009. This can be ex-plained by the financial crisis hitting the automotive industry hard. Among the
264 European regions reporting R&D investment, the Øresund Region is high on the list of R&D investment as a share of gross regional product. The Øresund Region is in eighth place (The Capital Region occupies seventh place, Scan-ia-Blekinge ninth and Region Zealand is in seventeenth place).
The investment structure is virtually identical on both sides of the Øresund waterway. The business sector’s signifi-cant and market-oriented R&D invest-ment, which accounts for 75 per cent of total investments, is combined with more modest investments from universi-ties and authorities (it is a little different in Region Zealand because this is a ma-jor activity undertaken by the authori-ties). The pattern also characterises the other Nordic metropolitan regions.
The Øresund Region is strong in the academic field: the University of
90
95
100
105
110
115
120
2000 2001 2002 2003 2004 2005 2006 2007 2008 2009
Index: 2000=100
EU27 BRP
Öresundsregionen BRP
EU27 BRP/sysselsatt
Öresundsregionen BRP/sysselsatt
90
95
100
105
110
115
120
125
130
2000 2001 2002 2003 2004 2005 2006 2007 2008 2009
Öresund DK
Region Sjælland
Region Hovedstaden
Skåne
0.0 0.5 1.0 1.5 2.0 2.5 3.0 3.5 4.0 4.5 5.0
Isra
el
Finl
and
Swed
en
Den
mar
k
USA
(20
09)
Ger
man
y
Aus
tria
Icel
and
(20
08)
Fran
ce
Slov
enia
Belg
ium
Net
herl
and
s
Chi
na
Irel
and
Uni
ted
Kin
gd
om
Nor
way
(20
09)
Est
onia
Port
ugal
Cze
ch R
epub
lic
Spai
n
Ital
y
Rus
sia
Hun
gar
y
Pola
nd
Slov
akia
EU
27
OE
CD
tota
l (20
09)
R&D expenditure as a proportion of GDP in selected countries (2010) in per cent
Source: OECD.
KnoWlEDGE AnD InnovAtIon | RESEARCh AnD DEvELoPMEnT
30 Øresund Trends 2012
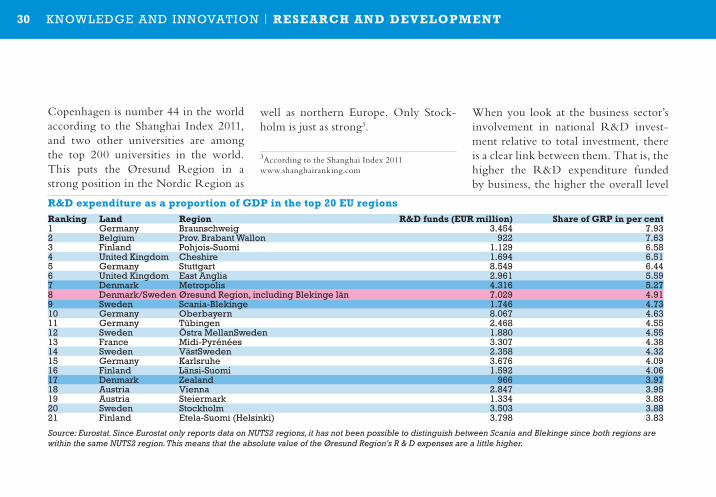
Copenhagen is number 44 in the world according to the Shanghai Index 2011, and two other universities are among the top 200 universities in the world. This puts the Øresund Region in a strong position in the Nordic Region as
well as northern Europe. Only Stock-holm is just as strong3.
When you look at the business sector’s involvement in national R&D invest-ment relative to total investment, there is a clear link between them. That is, the higher the R&D expenditure funded by business, the higher the overall level
3According to the Shanghai Index 2011www.shanghairanking.com
R&D expenditure as a proportion of GDP in the top 20 EU regionsRanking Land Region R&D funds (EUR million) Share of GRP in per cent1 Germany Braunschweig 3.454 7.932 Belgium Prov. Brabant Wallon 922 7.633 Finland Pohjois-suomi 1.129 6.584 united Kingdom Cheshire 1.694 6.515 Germany stuttgart 8.549 6.446 united Kingdom East Anglia 2.961 5.597 Denmark Metropolis 4.316 5.278 Denmark/sweden Øresund Region, including Blekinge län 7.029 4.919 sweden scania-Blekinge 1.746 4.7310 Germany oberbayern 8.067 4.6311 Germany tübingen 2.468 4.5512 sweden Östra Mellansweden 1.880 4.5513 France Midi-Pyrénées 3.307 4.3814 sweden västsweden 2.358 4.3215 Germany Karlsruhe 3.676 4.0916 Finland länsi-suomi 1.592 4.0617 Denmark Zealand 966 3.9718 Austria vienna 2.847 3.9519 Austria steiermark 1.334 3.8820 sweden stockholm 3.503 3.8821 Finland Etela-suomi (Helsinki) 3.798 3.83
Source: Eurostat. Since Eurostat only reports data on NUTS2 regions, it has not been possible to distinguish between Scania and Blekinge since both regions are within the same NUTS2 region. This means that the absolute value of the Øresund Region's R & D expenses are a little higher.
KnoWlEDGE AnD InnovAtIon | RESEARCh AnD DEvELoPMEnT
31Øresund Trends 2012
of investment in the country4. This re-lationship is apparent for most Nordic regions.
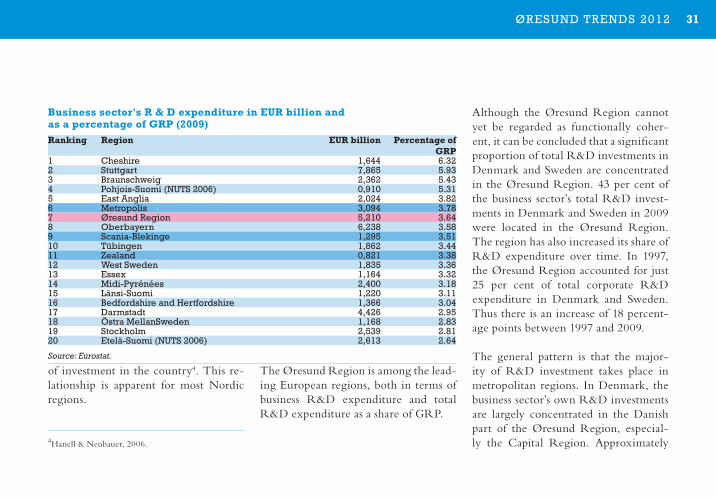
The Øresund Region is among the lead-ing European regions, both in terms of business R&D expenditure and total R&D expenditure as a share of GRP.
Although the Øresund Region cannot yet be regarded as functionally coher-ent, it can be concluded that a significant proportion of total R&D investments in Denmark and Sweden are concentrated in the Øresund Region. 43 per cent of the business sector’s total R&D invest-ments in Denmark and Sweden in 2009 were located in the Øresund Region. The region has also increased its share of R&D expenditure over time. In 1997, the Øresund Region accounted for just 25 per cent of total corporate R&D expenditure in Denmark and Sweden. Thus there is an increase of 18 percent-age points between 1997 and 2009.
The general pattern is that the major-ity of R&D investment takes place in metropolitan regions. In Denmark, the business sector’s own R&D investments are largely concentrated in the Danish part of the Øresund Region, especial-ly the Capital Region. Approximately
Business sector's R & D expenditure in EUR billion and as a percentage of GRP (2009)Ranking Region EUR billion Percentage of
GRP1 Cheshire 1,644 6.322 stuttgart 7,865 5.933 Braunschweig 2,362 5.434 Pohjois-suomi (nuts 2006) 0,910 5.315 East Anglia 2,024 3.826 Metropolis 3,094 3.787 Øresund Region 5,210 3.648 oberbayern 6,238 3.589 scania-Blekinge 1,295 3.5110 tübingen 1,862 3.4411 Zealand 0,821 3.3812 West sweden 1,835 3.3613 Essex 1,164 3.3214 Midi-Pyrénées 2,400 3.1815 länsi-suomi 1,220 3.1116 Bedfordshire and Hertfordshire 1,366 3.0417 Darmstadt 4,426 2.9518 Östra Mellansweden 1,168 2.8319 stockholm 2,539 2.8120 Etelä-suomi (nuts 2006) 2,613 2.64
Source: Eurostat.
KnoWlEDGE AnD InnovAtIon | RESEARCh AnD DEvELoPMEnT
4Hanell & Neubauer, 2006.
32 Øresund Trends 2012
84 per cent of Danish business R&D investment takes place in the Danish part of the Øresund Region: the Capital Region accounts for the majority, 66 per cent, and Region Zealand for 18 per cent.
In Sweden, the greater part of business R&D investment is also in the Capital Region, but Stockholm's role is not as dominant in Sweden as Copenhagen is in Denmark. Approximately 34 per cent of business R&D investments are made in Stockholm County, followed by 25 per cent in the Västra Götaland Region and 17 per cent in Scania and Blekinge (figures from 2009).
If we measure business R&D expend-iture as a share of GRP, the Øresund Region is also high. The Capital Region has the highest with 3.78 per cent, fol-lowed by Scania-Blekinge and Region Zealand with 3.51 per cent and 3.38 per
cent, respectively. The proportion for the total Øresund Region amounts to 3.64 per cent.
When comparing investments inter-nationally in nominal terms, it is not obvious that the same sums can finance an equal amount of R&D in different countries and regions. It depends, of course, on the different structures in terms of business, research and costs.
Another part of the explanation is the wage gap between countries and re-gions as well as between sectors. Differ- ences in purchasing power are usually adjusted to different price indices. This is not possible for R&D. As with so many other services, R&D is personnel heavy, and so the majority of R&D ex-penditure goes in salaries5.
Around two-thirds of R&D expend-iture is accounted for by salaries in the
Øresund Region. Although it is not currently possible to analyse the conse-quences in detail, it is reasonable to as-sume that investment in R&D on the Danish side probably has a lower pur-chasing power and thus finances a smaller amount of R&D than is the case in Swe-den. This becomes more important when comparing regions in western and east-ern Europe. The difference in purchas-ing power can influence the investment patterns in R&D in Europe significantly in the longer term; this is because lower costs outside western Europe may attract a much larger share of R&D investment in the future.
5Denmark and Sweden have no statistics on R&D investments, but in Germany, R&D studies include questions of this nature. The German studies show that in most industries, around two thirds of R&D ex-penditure goes to fund salaries, especially in dedicated R&D environments (Stifterverband für die Deutsche Wissenschaft: FuF-Datenreport 2007. Tabellen und Daten, s. 38 Tabelle 14).
KnoWlEDGE AnD InnovAtIon | RESEARCh AnD DEvELoPMEnT
33Øresund Trends 2012
Since 2000, wage costs in Denmark have increased by 35 per cent, while Sweden has experienced a growth of 18 per cent. In comparison, labour costs in Germany rose by just 6 per cent over the same pe-riod. In other words, it has become rela-tively expensive to conduct R&D in the Øresund Region and in the Danish part in particular.
innovative capacity
The ability to translate research, know-ledge and ideas into new commercial products and processes is essential to increasing a region's global competitive-ness. Innovative capacity is difficult to measure, in part because the concept is difficult to define, in part because there is a lack of standardised data at regional level.
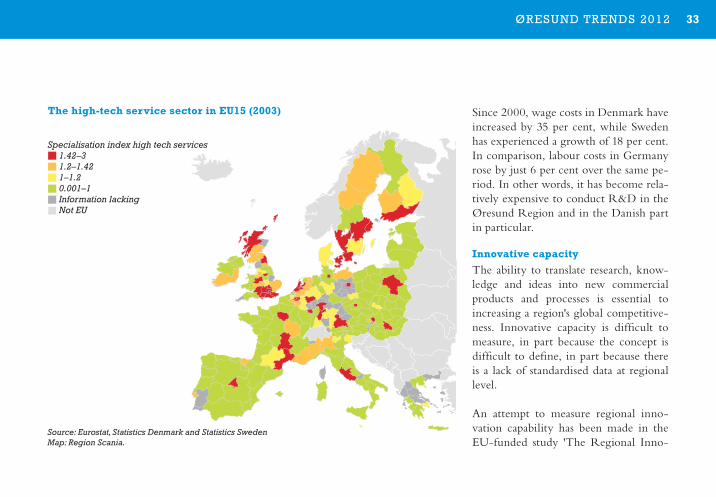
An attempt to measure regional inno-vation capability has been made in the EU-funded study 'The Regional Inno-
Source: Eurostat, Statistics Denmark and Statistics SwedenMap: Region Scania.
KnoWlEDGE AnD InnovAtIon | RESEARCh AnD DEvELoPMEnT
The high-tech service sector in EU15 (2003)
Specialisation index high tech services1.42–3 1.2–1.42 1–1.2 0.001–1 Information lackingNot EU
34 Øresund Trends 2012
vation Scoreboard'. According to the study, regions in Denmark and Sweden are among the most innovative regions in Europe. The study is based on a weighted index of 17 different indicators, which are divided into three main groups: innova-tion promoting background factors (pub-lic R&D expenditure, higher education, access to broadband, etc.) innovation activities in enterprises (R&D expendi-ture, patents, etc.) and performance fac-tors (employees in high-tech companies, sales of new products, new innovation companies, etc.). The latest survey from December 2009 contains data from 2006.
Unfortunately, the statistics in Den-mark are at national level, not regional. Denmark as a whole is considered to be among the regions with the highest capacity for innovation, while Scania is
in the next highest group, which includes much of the central and western regions (half of EEA6 countries' regions).
KnoWlEDGE AnD InnovAtIon | RESEARCh AnD DEvELoPMEnT
6EEA countries consists of 27 EU member states plus Iceland, Norway and Liechtenstein.

35Øresund Trends 2012KnoWlEDGE AnD InnovAtIon | RESEARCh AnD DEvELoPMEnT
36 Øresund Trends 2012KnoWlEDGE AnD InnovAtIon | E D U C AT i o n
EDUCATion
In addition to a large number of voca-tional university colleges, there are 11 universities and institutions of high-er education in the Øresund Region. Around 150,000 students and 10,000 graduate students study here.
According to the OECD, a highly edu-cated population is one of the most im-portant and robust indicators of urban economic performance.
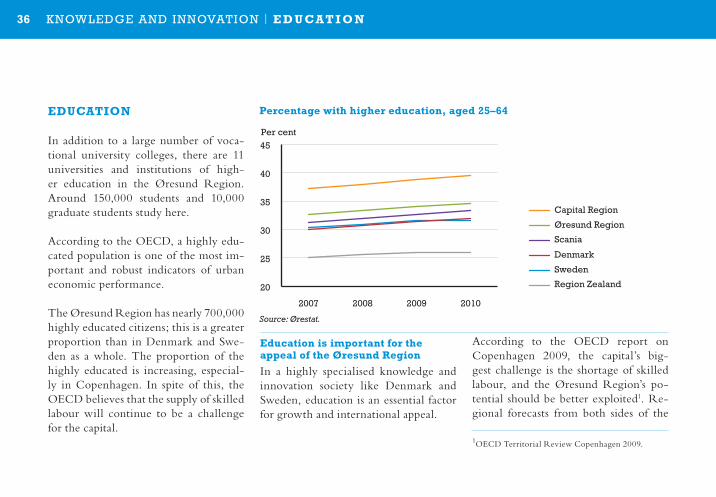
The Øresund Region has nearly 700,000 highly educated citizens; this is a greater proportion than in Denmark and Swe-den as a whole. The proportion of the highly educated is increasing, especial-ly in Copenhagen. In spite of this, the OECD believes that the supply of skilled labour will continue to be a challenge for the capital.
Education is important for the appeal of the Øresund Region
In a highly specialised knowledge and innovation society like Denmark and Sweden, education is an essential factor for growth and international appeal.
According to the OECD report on Copenhagen 2009, the capital’s big-gest challenge is the shortage of skilled labour, and the Øresund Region’s po-tential should be better exploited1. Re-gional forecasts from both sides of the
20
25
30
35
40
45
2007 2008 2009 2010
Per cent
Denmark
Capital Region
Region Zealand
Sweden
Scania
Øresund Region
0
500
1,000
1,500
2,000
2,500
1999/2000
2000/2001
2001/2002
2002/2003
2003/2004
2004/2005
2005/2006
2006/2007
2007/2008
2008/2009
2009/2010
2010/2011
Swedish students in Denmark
Danish students in Sweden
Percentage with higher education, aged 25–64
Source: Ørestat.
1OECD Territorial Review Copenhagen 2009.
37Øresund Trends 2012
sound also show a growing need for highly educated labour2. Education is a major factor in the individual’s hold on the labour market because people with low or no education are at a high risk of ending up outside it.
A highly educated population
690,500 (or 35 per cent) of the Øresund Region’s population of working age (25–64 years)3 have a higher education. With 35 per cent being highly educated, the Øresund Region has a greater share of the highly educated than Denmark and Swe-den have nationwide (32 per cent each). The Capital Region has the highest pro-portion of highly educated, followed by Scania and Region Zealand.
2Source: Region Scania (2012) Utbildnings- och ar-betsmarknadsprognos för Scania – med sikte på 2020; det tværregionale analysesamarbejde i Østdanmark (2012) Østdanmark 2010–2024 – fremskrivninger med Sam/K-Line.3 Source: Ørestat.
A growing proportion of highly educated youth
The education level among young people between the ages of 25–34 in the Øresund Region shows that more and more of the younger generation are taking up higher education. This trend is stronger in the Øresund Region than in Denmark and Sweden as a whole. Approximately 40 per cent of young people in the region now have a higher education, which is about 5 per cent more than the region’s popula-tion (up to 65) as a whole.
The highly educated are concentrated in cities
In the Øresund Region, the proportion of young people with a higher education is not developing at a uniform pace. The proportion of young people with a high-er education is growing in the Capital Region and in Scania, while it has de-clined slightly in Region Zealand.
Percentage of university graduates between the ages of 25 and 34
2007 2010Capital Region 40.3 41.9Region Zealand 24.9 24.1Scania 39.0 39.8
Source: Ørestat
In the Swedish part of the Øresund Region, over 40 per cent are highly ed-ucated in Lund, while the proportion among municipalities in the northern part of Scania is less than 25 per cent.
The tendency to concentrate in met-ropolitan areas and within commuting distance of them is a common pattern. Students and people with a higher ed-ucation move to the areas with the best education and job opportunities.
Swedish students are more mobile than Danish
There have always been many more Swedes going to Denmark to study than
KnoWlEDGE AnD InnovAtIon | E D U C AT i o n
38 Øresund Trends 2012
Danes studying in Sweden. This dispar-ity increased after the opening of the Øresund Bridge in 2000. During the academic year 2010/2011, there were 20
25
30
35
40
45
2007 2008 2009 2010
Per cent
Denmark
Capital Region
Region Zealand
Sweden
Scania
Øresund Region
0
500
1,000
1,500
2,000
2,500
1999/2000
2000/2001
2001/2002
2002/2003
2003/2004
2004/2005
2005/2006
2006/2007
2007/2008
2008/2009
2009/2010
2010/2011
Swedish students in Denmark
Danish students in Sweden
Student mobility
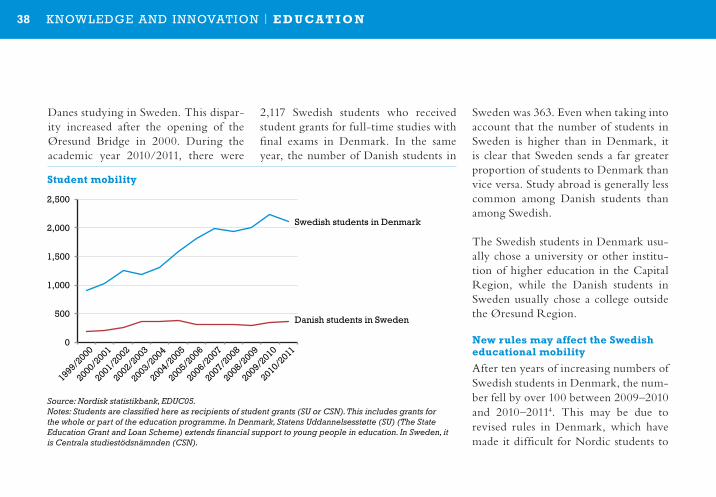
Source: Nordisk statistikbank, EDUC05.Notes: Students are classified here as recipients of student grants (SU or CSN). This includes grants for the whole or part of the education programme. In Denmark, Statens Uddannelsesstøtte (SU) (The State Education Grant and Loan Scheme) extends financial support to young people in education. In Sweden, it is Centrala studiestödsnämnden (CSN).
2,117 Swedish students who received student grants for full-time studies with final exams in Denmark. In the same year, the number of Danish students in
Sweden was 363. Even when taking into account that the number of students in Sweden is higher than in Denmark, it is clear that Sweden sends a far greater proportion of students to Denmark than vice versa. Study abroad is generally less common among Danish students than among Swedish.
The Swedish students in Denmark usu-ally chose a university or other institu-tion of higher education in the Capital Region, while the Danish students in Sweden usually chose a college outside the Øresund Region.
new rules may affect the Swedish educational mobility
After ten years of increasing numbers of Swedish students in Denmark, the num-ber fell by over 100 between 2009–2010 and 2010–20114. This may be due to revised rules in Denmark, which have made it difficult for Nordic students to
KnoWlEDGE AnD InnovAtIon | E D U C AT i o n
39Øresund Trends 2012
achieve high marks when their grades from their home country have to be val-idated in Denmark. This makes it more difficult to be admitted to the most pop-ular education programmes. At the same time, the requirement for tuition fees in 2011 was made more rigorous for single subjects in Denmark.
Mobility highest at university level5
The vast majority of those studying on the other side of the sound are studying at universities or other higher educa-tion institutions. 90 per cent of Swedish students in Denmark and 75 per cent of Danish students in Sweden studied at university or other higher education institutions in 2010–2011. This is partly due to the international grading scale of colleges and universities, ECTS (Euro-
pean Credit Transfer and Accumulation System), which makes it easy to com-pare grades and transfer credits between European college and university pro-grammes. It can be rather more difficult to validate grades between international commercial and secondary education.
Popular fields of study 2010/2011
Looking at the subjects that are popu-lar, medicine tops the list in Denmark as in previous studies among Swedes: 687 were enrolled in medical school in Denmark. This is followed by econom-ics (270) and veterinary studies (218). Training as an architect was also a very popular education among Swedes (130).
About a third of the Danish students in Sweden prefer psychology, sport and so-cial studies. This is followed by arts and crafts, journalism and media, and then the humanities and economics.
About the statisticsA number of statistics databases under-lie the figures on education in Denmark and sweden. these include: oECD, nordic statistics Bank and Ørestat. De-spite the international IsCED standard (International standard Classification of Education) for categorising levels of ed-ucation in an internationally comparable way, there are still some difficulties in making comparisons, for example, the definition of tertiary education IsCED 5a) differs in Denmark and sweden. In Denmark it includes full-time study for a minimum of three years with a final examination. In sweden it does not re-quire a degree, but at least three years of full-time study.
4The figures vary depending on the time of the sur-vey. New figures from CSN indicate 200.5DTS: KELA Students Abroad 2010–2011.
KnoWlEDGE AnD InnovAtIon | E D U C AT i o n
40 Øresund Trends 2012
1Nätverksbaserad urban innovation, Öresunds- regionen version 3.0, Underlag till IBU:s projekt om Öresundsregionens kvalitet, identitet och framtid, Oxford Research, 2009.
CULTURE
Culture and creativity are important factors for individual development, social cohesion and economic growth.
José Manuel Barroso, President of the European Commission
The Øresund Region is the largest met-ropolitan area in the Nordic countries and it also links Denmark and Sweden together. This gives a special cultural strength and diversity in the meeting between two countries’ related but dif-ferent customs and languages. It also involves a number of challenges and opportunities for culture to work across the Øresund and to create a common identity for the whole region.
Culture is identity, habits and expres-sion, and culture is part of creating and consuming activities and affects business
life and the labour market. An exciting cultural life is essential not only for cit-izens' well-being, but is also an impor-tant factor when companies choose their base, as well as when foreign knowledge workers seeking jobs abroad choose a new country in which to settle with family and children.
The Øresund Region is characterised by a rich cultural life, both in terms of the diversity that extends from the ethnicity of its urban areas to theatre, music and museums internationally, and in terms of the identity that goes right across the Øresund, and which challenges and en-riches due to differences in culture and language.
Over 50,000 – or nearly a third of all those employed in the cultural sector in Denmark and Sweden – work in the Øresund Region. Business sectors with TV, film and visual media and archi-
tecture as a focal point are strong in the Øresund Region and, unlike the general trend over the last few years, the cultural sector is currently experiencing modest progress.
Awareness of the region and the feeling of cohesion are greater on the Swed-ish side than on the Danish side of the Øresund. As many as 79 per cent of Swedes identify themselves wholly or partly with the Øresund Region, while the same applies to just 44 per cent of Danes1. However, the common identi-ty is reinforced through many differ-ent cultural collaborations across the Øresund, such as the common platform for the Øresund Region's cultural play-ers: Culture Øresund.
CultuRE AnD EXPERIEnCE | CULTURE
CultuRE AnD EXPERIEnCE
41Øresund Trends 2012
With regard to the importance of cul-ture, the priority given by citizens is admittedly not as high as for oth-er areas but, on the other hand, their satisfaction is highest here. 7 per cent of the Øresund household income is spent on culture. On average, citizens visit a museum twice, frequent a library seven times and borrow six books annually.
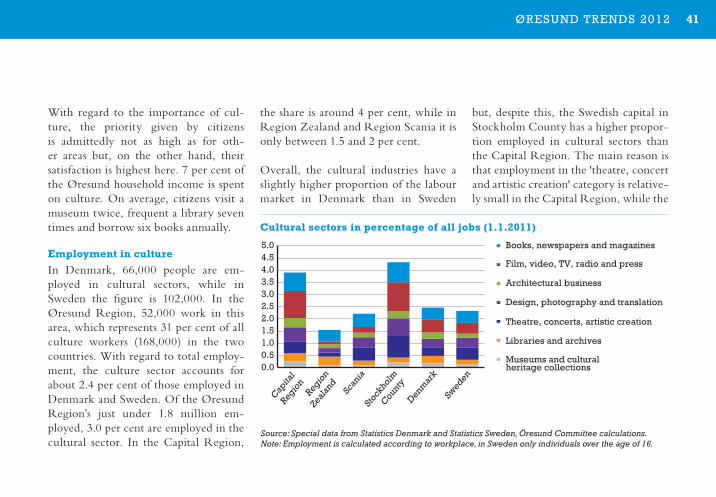
Employment in culture
In Denmark, 66,000 people are em-ployed in cultural sectors, while in Sweden the figure is 102,000. In the Øresund Region, 52,000 work in this area, which represents 31 per cent of all culture workers (168,000) in the two countries. With regard to total employ-ment, the culture sector accounts for about 2.4 per cent of those employed in Denmark and Sweden. Of the Øresund Region’s just under 1.8 million em-ployed, 3.0 per cent are employed in the cultural sector. In the Capital Region,
the share is around 4 per cent, while in Region Zealand and Region Scania it is only between 1.5 and 2 per cent.
Overall, the cultural industries have a slightly higher proportion of the labour market in Denmark than in Sweden
but, despite this, the Swedish capital in Stockholm County has a higher propor-tion employed in cultural sectors than the Capital Region. The main reason is that employment in the 'theatre, concert and artistic creation' category is relative-ly small in the Capital Region, while the
0
5,000
10,000
15,000
20,000
25,000
30,000
35,000
0 5 10 15 20 25 30 35 40 45 50 55 60 65 70 75 80 85 90 95
Number
Age
Capital Region 2011/2012
Forecast Capital Region 2031/2032
Scania 2011/2012
Forecast Scania 2031/2032
Region Zealand 2011/2012
Forecast Region Zealand2031/2032
0.0 0.5 1.0 1.5 2.0 2.5 3.0 3.5 4.0 4.5 5.0
Capita
l
Region
Region
Zeal
and
Scan
ia
Stock
holm
County
Denmar
k
Sweden
0 1 2 3 4 5 6 7 8 9
10
-90 -91 -92 -93 -94 -95 -96 -97 -98 -99 -00 -01 -02 -03 -04 -05 -06 -07 -08 -09 -10 -11
Million vehicles
Øresund Bridge Ferries Copenhagen-Malmö Ferries Elsinore-Helsingborg
0
5
10
15
20
25
30
35
40
-01 -02 -03 -04 -05 -06 -07 -08 -09 -10 -11
Million individuals
Car Train Ferries Hydrofoil
0102030405060708090
100
Car Landing Car TrainHH Ferries The Øresund Bridge
Total
Holiday
Mini-break
Leisure
Business
Commuting to place of study
Commuting to place of work
Per cent
0%
2%
4%
6%
8%
10%
12%
14%
16%
18%
20%
0
500,000
1,000,000
1,500,000
2,000,000
2,500,000
3,000,000
3,500,000
4,000,000
4,500,000
2000 2001 2002 2003 2004 2005 2006 2007 2008 2009 2010 2011
Books, newspapers and magazines
Architectural business
Design, photography and translation
Theatre, concerts, artistic creation
Libraries and archives
Museums and cultural heritage collections
Film, video, TV, radio and press
Cultural sectors in percentage of all jobs (1 .1 .2011)
Source: Special data from Statistics Denmark and Statistics Sweden, Öresund Committee calculations. Note: Employment is calculated according to workplace, in Sweden only individuals over the age of 16.
CultuRE AnD EXPERIEnCE | CULTURE
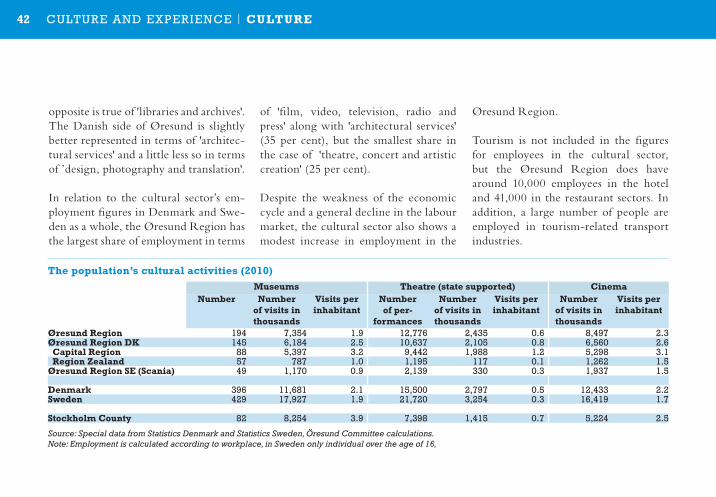
42 Øresund Trends 2012
opposite is true of 'libraries and archives'. The Danish side of Øresund is slightly better represented in terms of 'architec-tural services' and a little less so in terms of ’design, photography and translation'.
In relation to the cultural sector’s em-ployment figures in Denmark and Swe-den as a whole, the Øresund Region has the largest share of employment in terms
of 'film, video, television, radio and press' along with 'architectural services' (35 per cent), but the smallest share in the case of 'theatre, concert and artistic creation' (25 per cent).
Despite the weakness of the economic cycle and a general decline in the labour market, the cultural sector also shows a modest increase in employment in the
Øresund Region.
Tourism is not included in the figures for employees in the cultural sector, but the Øresund Region does have around 10,000 employees in the hotel and 41,000 in the restaurant sectors. In addition, a large number of people are employed in tourism-related transport industries.
The population’s cultural activities (2010) Museums Theatre (state supported) Cinema number number
of visits in thousands
visits per inhabitant
number of per-
formances
number of visits in thousands
visits per inhabitant
number of visits in thousands
visits per inhabitant
Øresund Region 194 7,354 1.9 12,776 2,435 0.6 8,497 2.3Øresund Region DK 145 6,184 2.5 10,637 2,105 0.8 6,560 2.6 Capital Region 88 5,397 3.2 9,442 1,988 1.2 5,298 3.1 Region Zealand 57 787 1.0 1,195 117 0.1 1,262 1.5Øresund Region SE (Scania) 49 1,170 0.9 2,139 330 0.3 1,937 1.5
Denmark 396 11,681 2.1 15,500 2,797 0.5 12,433 2.2Sweden 429 17,927 1.9 21,720 3,254 0.3 16,419 1.7
Stockholm County 82 8,254 3.9 7,398 1,415 0.7 5,224 2.5
Source: Special data from Statistics Denmark and Statistics Sweden, Öresund Committee calculations. Note: Employment is calculated according to workplace, in Sweden only individual over the age of 16,
CultuRE AnD EXPERIEnCE | CULTURE
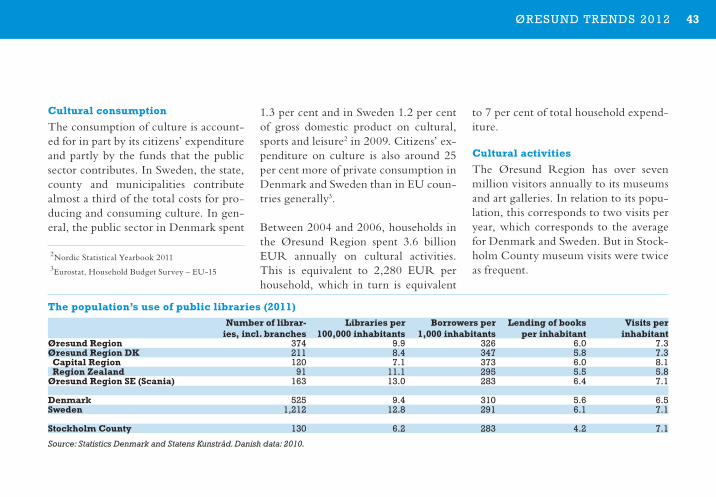
43Øresund Trends 2012
Cultural consumption
The consumption of culture is account-ed for in part by its citizens’ expenditure and partly by the funds that the public sector contributes. In Sweden, the state, county and municipalities contribute almost a third of the total costs for pro-ducing and consuming culture. In gen-eral, the public sector in Denmark spent
1.3 per cent and in Sweden 1.2 per cent of gross domestic product on cultural, sports and leisure2 in 2009. Citizens’ ex-penditure on culture is also around 25 per cent more of private consumption in Denmark and Sweden than in EU coun-tries generally3.
Between 2004 and 2006, households in the Øresund Region spent 3.6 billion EUR annually on cultural activities. This is equivalent to 2,280 EUR per household, which in turn is equivalent
2Nordic Statistical Yearbook 2011
3Eurostat, Household Budget Survey – EU-15
to 7 per cent of total household expend-iture.
Cultural activities
The Øresund Region has over seven million visitors annually to its museums and art galleries. In relation to its popu-lation, this corresponds to two visits per year, which corresponds to the average for Denmark and Sweden. But in Stock-holm County museum visits were twice as frequent.
The population’s use of public libraries (2011) number of librar-
ies, incl . branchesLibraries per
100,000 inhabitantsBorrowers per
1,000 inhabitantsLending of books
per inhabitantvisits per
inhabitantØresund Region 374 9.9 326 6.0 7.3Øresund Region DK 211 8.4 347 5.8 7.3 Capital Region 120 7.1 373 6.0 8.1 Region Zealand 91 11.1 295 5.5 5.8Øresund Region SE (Scania) 163 13.0 283 6.4 7.1
Denmark 525 9.4 310 5.6 6.5Sweden 1,212 12.8 291 6.1 7.1
Stockholm County 130 6.2 283 4.2 7.1
Source: Statistics Denmark and Statens Kunstråd. Danish data: 2010.
CultuRE AnD EXPERIEnCE | CULTURE
44 Øresund Trends 2012
About the statisticsIt is difficult statistically to define what should be considered as the cultural sector and thus cultural employment. the figures here include the production of newspapers and books, design activities, including ar-chitects, photographers and designers. In addition, there are film and television/ra-dio, creative activities (theatre, music and literature, etc.), the running of theatres, etc., museums, etc., and public libraries.
statistics Denmark (Danmarks statistik) and statistics sweden (statistiska Central-byrån) use two different trade classifica-
tions, DB07 and snI2007, respectively. At sector level, a comparison between Danish and swedish data should be reasonably reliable, but minor differences in sector ranking may occur. statistics Denmark and statistics sweden have both recently switched classifications, which means com-parisons over a period of several years are difficult. there is also a narrower definition of the cultural sectors than in the past.
Annually, there are about 2.5 million visits to the theatre in the Øresund Region. In the Capital Region, there is more than one visit per citizen, while in Scania it is only 0.3 and even fewer in Zealand. Danes go to the theatre more often than the Swedes, and the citizens of the Capital Region are more frequent theatre-goers than the citizens of Stock-holm County. The Danes also go to the
CultuRE AnD EXPERIEnCE | CULTURE
cinema more often than the Swedes, and the citizens of the Capital Region are more frequent cinema-goers than they are in Stockholm County.
There are 374 public libraries in the Øresund Region, or one library for every 10,000 citizens. Nearly every third citizen is a library user – borrowing six books – and there are seven library visits
per capita. In the metropolitan regions, more people visit each library and have a slightly higher borrowing and visit frequency. The number of libraries and visits is falling slightly in general.
45Øresund Trends 2012
iDEnTiTy
A common Øresund regional identity is developing, but it requires greater recip-rocal relations across the Øresund – both physically and mentally.
The awareness of the region and a feel-ing of cohesion is greater on the Swedish side than the Danish side of Øresund. As many as 79 per cent of Swedes identi-fy themselves wholly or partly with the Øresund Region, while the same ap-plies only to 44 per cent of Danes1. But common identity is reinforced through many different cultural collaborations across the Øresund, such as networking between the Øresund Region's muse-ums.
In this context, Scanians are more re-ceptive to the opportunities in Co-penhagen and Zealand than vice versa. A survey in 2012 among 1,500 15–64
year olds in the region showed that 59 per cent watched Danish television each week, 55 per cent visited Zealand over the past year, 53 per cent know someone who works in Zealand, and 51 per cent understand Danish well2.
Among Zealanders of the same age, only 13 per cent watch Swedish television, 40 per cent have visited Scania, 23 per cent know someone who works in Scania and 40 per cent understand Swedish well.
1Nätverksbaserad urban innovation, Öresunds- regionen version 3.0, Underlag till IBU:s projekt om Öresundsregionens kvalitet, identitet och framtid, Oxford Research, 2009.
2The survey was conducted by the Öresund Com-mittee.
CultuRE AnD EXPERIEnCE | CULTURE CultuRE AnD EXPERIEnCE | iDEnTiTy
46 Øresund Trends 2012CultuRE AnD EXPERIEnCE | ToURiSM
ToURiSM
During 2011, the Øresund Region had nearly 11 million overnight stays in ho-tels and similar1. Despite its relatively small geographical extent, this corre-sponds to the Øresund Region being responsible for 24 per cent of overnight stays in Denmark and Sweden. There were 8 million overnight stays on Zea-land compared to nearly 3 million in Scania. The growth in Sweden has been slightly more positive than in Denmark for many years and, since the downturn following the financial crisis, which be-gan in 2008, the number of overnight stays in Sweden has risen by 8 per cent, while Denmark's increase is more recent and is 5 per cent2.
Since 2007, the Øresund Region as a
whole has seen growth of around 7 per cent in the number of overnight stays in both Scania and Zealand. Growth in tourism in the Øresund Region is driven by a sharp increase of 19 per cent more overnight stays from the rest of the world than there have been from Den-mark and Sweden.
Looking at Zealand alone, there is a significant difference in the trends: the Capital Region has had 14 per cent more overnight stays, while Region Zealand has lost every fourth night over just a few years.
Overnight stays in the Øresund Region are largely based on 'domestic tourism', with just over a third from countries other than Denmark and Sweden. Tour-ism in the Capital Region is more inter-national and just under one in two stays here are from other countries.
The overall growth in the region is caused by an international trend towards big cities attracting more tourists – in-ternational ones in particular – in recent years, than the rest of the country does. The same trend is seen between Stock-holm and the rest of Sweden: the city gets more and more tourists, while the rest of the country is losing ground.
The burgeoning growth in internation-al tourism is particularly reflected in the number of cruise tourists. Cruise pas-senger numbers have quadrupled in just ten years, and Copenhagen is the largest cruise ship destination in the Baltic Sea. In 2012, the Øresund Region’s main city, Copenhagen, was visited by 376 cruise ships with 840,000 cruise pas-sengers of whom more than 60 per cent
1With at least 40 beds.2Ørestat, Statistics Denmark and Statistics Sweden.
3COO Cruise and Ferries, Copenhagen Malmö Port AB (CMP).
47Øresund Trends 2012
4Wonderful Copenhagen, Union of International Associations. The figure includes major international events and meetings.
were embarking or disembarking in Copenhagen. Cruise ship tourism gen-erates a turnover of approximately DKK 175 million EUR3.
Also, as an international conference city, Copenhagen is nicely positioned as the Nordic city with the most conferences. In 2010, Copenhagen had 102 confer-ences and thus took sixteenth place in the world ranking4 and the position as the Nordic area’s largest conference des-tination.
CultuRE AnD EXPERIEnCE | ToURiSM
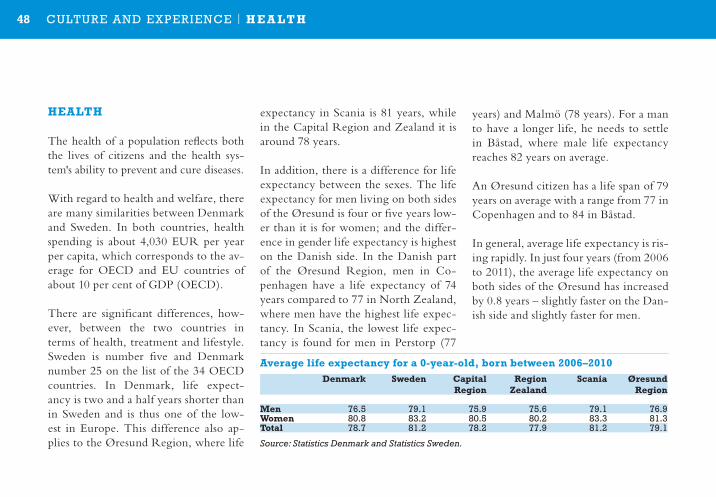
48 Øresund Trends 2012
hEALTh
The health of a population reflects both the lives of citizens and the health sys-tem's ability to prevent and cure diseases.
With regard to health and welfare, there are many similarities between Denmark and Sweden. In both countries, health spending is about 4,030 EUR per year per capita, which corresponds to the av-erage for OECD and EU countries of about 10 per cent of GDP (OECD).
There are significant differences, how-ever, between the two countries in terms of health, treatment and lifestyle. Sweden is number five and Denmark number 25 on the list of the 34 OECD countries. In Denmark, life expect- ancy is two and a half years shorter than in Sweden and is thus one of the low-est in Europe. This difference also ap-plies to the Øresund Region, where life
expectancy in Scania is 81 years, while in the Capital Region and Zealand it is around 78 years.
In addition, there is a difference for life expectancy between the sexes. The life expectancy for men living on both sides of the Øresund is four or five years low-er than it is for women; and the differ-ence in gender life expectancy is highest on the Danish side. In the Danish part of the Øresund Region, men in Co-penhagen have a life expectancy of 74 years compared to 77 in North Zealand, where men have the highest life expec-tancy. In Scania, the lowest life expec-tancy is found for men in Perstorp (77
years) and Malmö (78 years). For a man to have a longer life, he needs to settle in Båstad, where male life expectancy reaches 82 years on average.
An Øresund citizen has a life span of 79 years on average with a range from 77 in Copenhagen and to 84 in Båstad.
In general, average life expectancy is ris-ing rapidly. In just four years (from 2006 to 2011), the average life expectancy on both sides of the Øresund has increased by 0.8 years – slightly faster on the Dan-ish side and slightly faster for men.
Average life expectancy for a 0-year-old, born between 2006–2010 Denmark Sweden Capital
RegionRegion
ZealandScania Øresund
Region
Men 76.5 79.1 75.9 75.6 79.1 76.9Women 80.8 83.2 80.5 80.2 83.3 81.3Total 78.7 81.2 78.2 77.9 81.2 79.1
Source: Statistics Denmark and Statistics Sweden.
CultuRE AnD EXPERIEnCE | h E A L T h
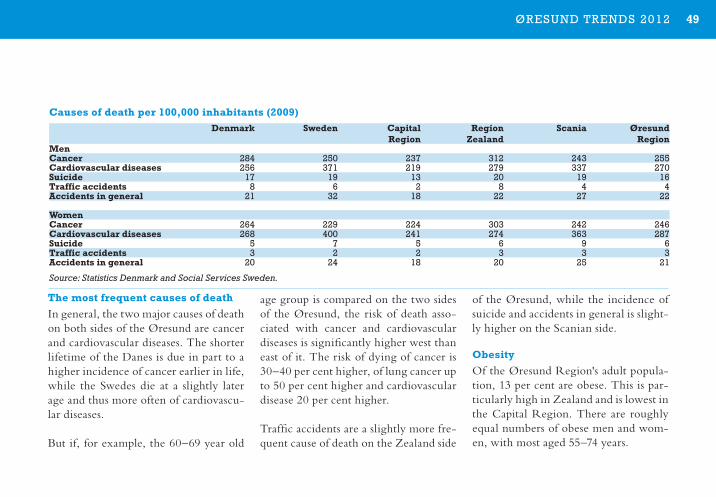
49Øresund Trends 2012
The most frequent causes of death
In general, the two major causes of death on both sides of the Øresund are cancer and cardiovascular diseases. The shorter lifetime of the Danes is due in part to a higher incidence of cancer earlier in life, while the Swedes die at a slightly later age and thus more often of cardiovascu-lar diseases.
But if, for example, the 60–69 year old
age group is compared on the two sides of the Øresund, the risk of death asso-ciated with cancer and cardiovascular diseases is significantly higher west than east of it. The risk of dying of cancer is 30–40 per cent higher, of lung cancer up to 50 per cent higher and cardiovascular disease 20 per cent higher.
Traffic accidents are a slightly more fre-quent cause of death on the Zealand side
of the Øresund, while the incidence of suicide and accidents in general is slight-ly higher on the Scanian side.
obesity
Of the Øresund Region's adult popula-tion, 13 per cent are obese. This is par-ticularly high in Zealand and is lowest in the Capital Region. There are roughly equal numbers of obese men and wom-en, with most aged 55–74 years.
Causes of death per 100,000 inhabitants (2009) Denmark Sweden Capital
RegionRegion
ZealandScania Øresund
RegionMenCancer 284 250 237 312 243 255Cardiovascular diseases 256 371 219 279 337 270Suicide 17 19 13 20 19 16Traffic accidents 8 6 2 8 4 4Accidents in general 21 32 18 22 27 22
WomenCancer 264 229 224 303 242 246Cardiovascular diseases 268 400 241 274 363 287Suicide 5 7 5 6 9 6Traffic accidents 3 2 2 3 3 3Accidents in general 20 24 18 20 25 21
Source: Statistics Denmark and Social Services Sweden.
Average life expectancy for a 0-year-old, born between 2006–2010 Denmark Sweden Capital
RegionRegion
ZealandScania Øresund
Region
Men 76.5 79.1 75.9 75.6 79.1 76.9Women 80.8 83.2 80.5 80.2 83.3 81.3Total 78.7 81.2 78.2 77.9 81.2 79.1
Source: Statistics Denmark and Statistics Sweden.
CultuRE AnD EXPERIEnCE | h E A L T h
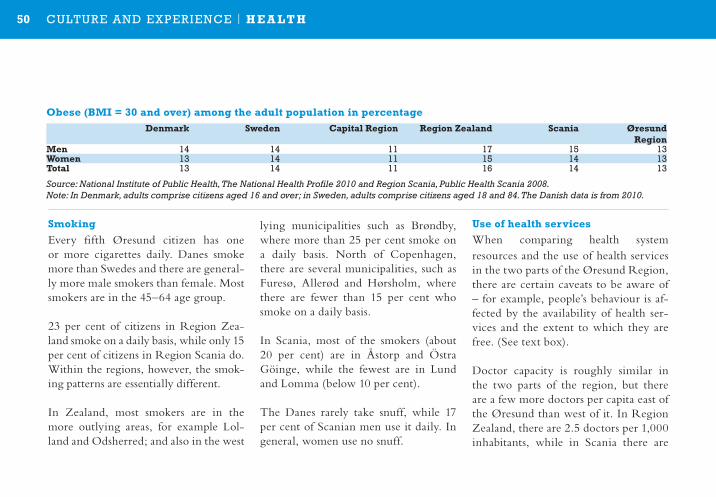
50 Øresund Trends 2012
obese (BMi = 30 and over) among the adult population in percentage Denmark Sweden Capital Region Region Zealand Scania Øresund
RegionMen 14 14 11 17 15 13Women 13 14 11 15 14 13Total 13 14 11 16 14 13
Source: National Institute of Public Health, The National Health Profile 2010 and Region Scania, Public Health Scania 2008.Note: In Denmark, adults comprise citizens aged 16 and over; in Sweden, adults comprise citizens aged 18 and 84. The Danish data is from 2010.
CultuRE AnD EXPERIEnCE | h E A L T h
Smoking
Every fifth Øresund citizen has one or more cigarettes daily. Danes smoke more than Swedes and there are general-ly more male smokers than female. Most smokers are in the 45–64 age group.
23 per cent of citizens in Region Zea-land smoke on a daily basis, while only 15 per cent of citizens in Region Scania do. Within the regions, however, the smok-ing patterns are essentially different.
In Zealand, most smokers are in the more outlying areas, for example Lol-land and Odsherred; and also in the west
Use of health servicesWhen comparing health system resources and the use of health services in the two parts of the Øresund Region, there are certain caveats to be aware of – for example, people’s behaviour is af-fected by the availability of health ser-vices and the extent to which they are free. (See text box).
Doctor capacity is roughly similar in the two parts of the region, but there are a few more doctors per capita east of the Øresund than west of it. In Region Zealand, there are 2.5 doctors per 1,000 inhabitants, while in Scania there are
lying municipalities such as Brøndby, where more than 25 per cent smoke on a daily basis. North of Copenhagen, there are several municipalities, such as Furesø, Allerød and Hørsholm, where there are fewer than 15 per cent who smoke on a daily basis.
In Scania, most of the smokers (about 20 per cent) are in Åstorp and Östra Göinge, while the fewest are in Lund and Lomma (below 10 per cent).
The Danes rarely take snuff, while 17 per cent of Scanian men use it daily. In general, women use no snuff.
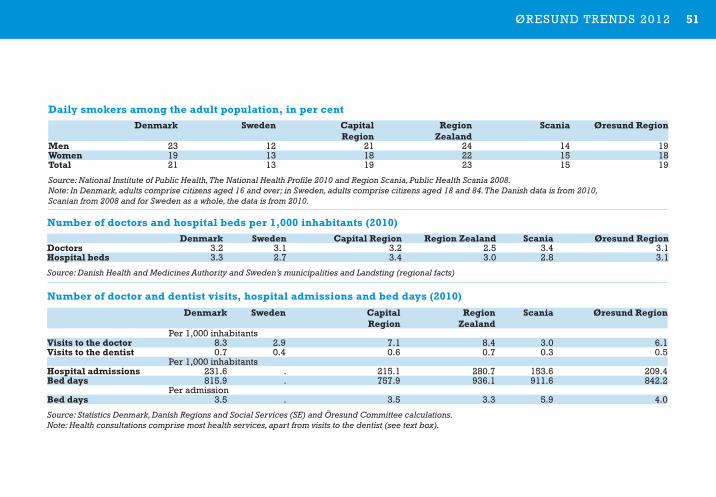
51Øresund Trends 2012
Daily smokers among the adult population, in per cent Denmark Sweden Capital
RegionRegion
Zealand Scania Øresund Region
Men 23 12 21 24 14 19Women 19 13 18 22 15 18Total 21 13 19 23 15 19
Source: National Institute of Public Health, The National Health Profile 2010 and Region Scania, Public Health Scania 2008. Note: In Denmark, adults comprise citizens aged 16 and over; in Sweden, adults comprise citizens aged 18 and 84. The Danish data is from 2010, Scanian from 2008 and for Sweden as a whole, the data is from 2010.
number of doctors and hospital beds per 1,000 inhabitants (2010) Denmark Sweden Capital Region Region Zealand Scania Øresund RegionDoctors 3.2 3.1 3.2 2.5 3.4 3.1hospital beds 3.3 2.7 3.4 3.0 2.8 3.1
Source: Danish Health and Medicines Authority and Sweden’s municipalities and Landsting (regional facts)
number of doctor and dentist visits, hospital admissions and bed days (2010) Denmark Sweden Capital
RegionRegion
ZealandScania Øresund Region
Per 1,000 inhabitants visits to the doctor 8.3 2.9 7.1 8.4 3.0 6.1visits to the dentist 0.7 0.4 0.6 0.7 0.3 0.5
Per 1,000 inhabitants hospital admissions 231.6 . 215.1 280.7 153.6 209.4Bed days 815.9 . 757.9 936.1 911.6 842.2
Per admissionBed days 3.5 . 3.5 3.3 5.9 4.0
Source: Statistics Denmark, Danish Regions and Social Services (SE) and Öresund Committee calculations.Note: Health consultations comprise most health services, apart from visits to the dentist (see text box).
CultuRE AnD EXPERIEnCE | h E A L T h
52 Øresund Trends 2012
3.4. The opposite is true for the number of hospital beds. In the Capital Region, there are 3.4 beds per 1,000 inhabit-ants, compared to 2.8 in Region Scania, which is slightly higher than the national average in Sweden.
On average, the inhabitants of the Øresund Region visit the doctor 6.1 times per year. This figure conceals, however, a marked difference in fre-quency when the two parts of the Øresund Region are compared. Danes go to the doctor more than twice as of-ten as the Swedes, although the compar-ison is associated with some uncertainty; see text box. The comparison suffers from the fact that the Swedish figures for visits to the doctor are not as com-prehensive as the Danish. Data for health consultations is therefore more compre-hensive and comparable. Overall, there are 7.3 health consultations annually per capita in the Øresund Region, with
CultuRE AnD EXPERIEnCE | h E A L T h
most on the Danish side.
Visits to the dentist are also a more fre-quent occurrence on the Danish side than on the Swedish, with the Danish Øresund citizens going to the dentist twice as often as the Scanians. In both countries, citizens pay a significant pro-portion of their dental costs themselves. All in all, dental care is significantly more expensive in Denmark than it is in Sweden. (See text box).
The number of hospital admissions is much higher in Denmark than in Swe-den. In the Øresund Region, the inhab-itants of Region Zealand accounted for the most admissions: there were 287 ad-missions per 1,000 inhabitants in 2010, compared with only 158 in Scania. By contrast, admissions were of a short-er duration in the Capital Region and Region Zealand than in Scania: on av-erage these were 4.4, 3.9 and 5.6 days,
respectively. In terms of bed days per capita, use of hospitals was a little higher west of the Øresund.
53Øresund Trends 2012
About health systemstreatment resources, structure and registration are very different in Denmark and sweden. therefore, there are a number of difficul-ties and caveats about comparisons across the Øresund in terms of number of doctors and hospital beds, consultations and admissions to hospital. see also nomesco:http://nomesco-da.nom-nos.dk/
Both countries' health systems are essentially built around the same welfare ideals and have many similarities. In Denmark, how-ever, a system of private practitioners and medical centres is used, while doctors in sweden are usually associated with hospitals and health centres.
nearly all contacts with the public health system in Denmark are registered as doctor consultations because of the billing system. In sweden, some consultations are recorded as contacts with other health professionals other than a doctor; this is the case, for exam-ple, for health care.
A better comparison is for health consultations, which include registration for all types of health services, including psychiatric treatment (but excluding dentists).
In the Danish health system, there is much outpatient care and patients are discharged very quickly. Hospital breakdown by spe-ciality affects how patients are treated. A number of patients are admitted to a local hospital for diagnosis, then sent to a larger hos-pital for treatment and finally back to the local hospital. this allows multiple admissions of a relatively short duration. In addition,
rapid discharges in Denmark can mean slightly more short-term readmissions.
In sweden, there is a tendency for patients to have slightly longer courses of treatment at the same hospital.
the figures for the Capital Region include patients from the rest of the country admitted for specialist treatments at Rigshospitalet, the national hospital of Denmark.
Medical care in Denmark is free, while in sweden patients pay for medical consultations and hospitalisation. Payment in sweden is determined regionally and is typically a few hundred kroner.
In both Denmark and sweden, citizens pay in general for dentistry. In Denmark, standard treatment such as dental examinations, are supported by a small subsidy, while the more expensive treatments are not subsidised. on the other hand, many citizens have private health insurance, which reduces the cost of dental treatment to some extent. In sweden, citizens have a lower basic subsidy but also 50 per cent or more in subsidies for expensive treatments. In addition, dental care is generally cheaper on the swedish side than the Danish.
on both sides of the Øresund, health and lifestyle are comprehen-sively and continuously surveyed. For a number of parameters, data is not directly comparable – for example, alcohol habits.
CultuRE AnD EXPERIEnCE | h E A L T h
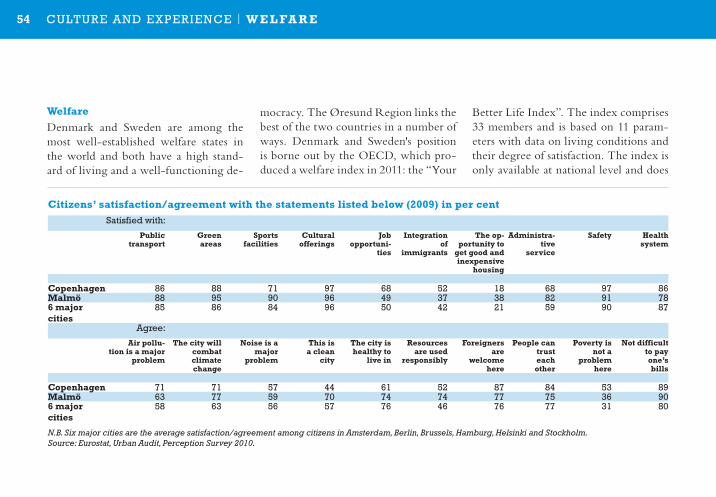
54 Øresund Trends 2012
Welfare
Denmark and Sweden are among the most well-established welfare states in the world and both have a high stand-ard of living and a well-functioning de-
mocracy. The Øresund Region links the best of the two countries in a number of ways. Denmark and Sweden's position is borne out by the OECD, which pro-duced a welfare index in 2011: the “Your
Better Life Index”. The index comprises 33 members and is based on 11 param-eters with data on living conditions and their degree of satisfaction. The index is only available at national level and does
CultuRE AnD EXPERIEnCE | W E L FA R E
Citizens’ satisfaction/agreement with the statements listed below (2009) in per centsatisfied with:
Public transport
Green areas
Sports facilities
Cultural offerings
Job opportuni-
ties
integration of
immigrants
The op-portunity to
get good and inexpensive
housing
Administra-tive
service
Safety health system
Copenhagen 86 88 71 97 68 52 18 68 97 86Malmö 88 95 90 96 49 37 38 82 91 786 major cities
85 86 84 96 50 42 21 59 90 87
Agree:
Air pollu-tion is a major
problem
The city will combat climate change
noise is a major
problem
This is a clean
city
The city is healthy to
live in
Resources are used
responsibly
Foreigners are
welcome here
People can trust each other
Poverty is not a
problem here
not difficult to pay one’s bills
Copenhagen 71 71 57 44 61 52 87 84 53 89Malmö 63 77 59 70 74 74 77 75 36 906 major cities
58 63 56 57 76 46 76 77 31 80
N.B. Six major cities are the average satisfaction/agreement among citizens in Amsterdam, Berlin, Brussels, Hamburg, Helsinki and Stockholm.Source: Eurostat, Urban Audit, Perception Survey 2010.
55Øresund Trends 2012
not cover regions. However, one can with some reasonable accuracy conclude that what applies to Denmark and Swe-den, also applies to the Øresund Region.
The index shows that Denmark and Sweden are among the highest ranking countries in terms of experiencing qual-ity of life, a good balance between work and family life, a healthy democracy with a high turnout and a good social network. On health, education and in-come (adjusted for purchasing power), however, the two countries are further down the rankings, especially Denmark.
As part of Eurostat's regional statistics project, Urban Audit, the recurring Per-ception Survey was conducted in 2009 when citizens of 75 European cities were asked about their perceived satis-faction with their cities. Inhabitants of the Øresund Region’s two
major cities, Copenhagen and Malmö, were measured on 20 welfare indicators and were generally more satisfied with their cities than the average citizen in six comparable northern European cities.
When compared to Malmö and the six northern European comparison cities, Copenhagen scored highest in terms of job opportunities, integration of immi-grants, hospitality towards foreigners and the absence of poverty. The lack of sports facilities, air pollution, the city's sanitation and health were Copenha-gen's biggest problems.
Malmö, on the other hand, was in front in terms of green areas, sports facilities, accommodation, efficient administra-tive services, combating climate change and the ability of citizens to pay their bills. Malmö fell behind with regard to a better integration of immigrants and a better functioning health system.
CultuRE AnD EXPERIEnCE | W E L FA R E
Citizens’ satisfaction/agreement with the statements listed below (2009) in per centsatisfied with:
Public transport
Green areas
Sports facilities
Cultural offerings
Job opportuni-
ties
integration of
immigrants
The op-portunity to
get good and inexpensive
housing
Administra-tive
service
Safety health system
Copenhagen 86 88 71 97 68 52 18 68 97 86Malmö 88 95 90 96 49 37 38 82 91 786 major cities
85 86 84 96 50 42 21 59 90 87
Agree:
Air pollu-tion is a major
problem
The city will combat climate change
noise is a major
problem
This is a clean
city
The city is healthy to
live in
Resources are used
responsibly
Foreigners are
welcome here
People can trust each other
Poverty is not a
problem here
not difficult to pay one’s bills
Copenhagen 71 71 57 44 61 52 87 84 53 89Malmö 63 77 59 70 74 74 77 75 36 906 major cities
58 63 56 57 76 46 76 77 31 80
N.B. Six major cities are the average satisfaction/agreement among citizens in Amsterdam, Berlin, Brussels, Hamburg, Helsinki and Stockholm.Source: Eurostat, Urban Audit, Perception Survey 2010.
As in other cities, there is great satisfac-tion with cultural offerings and safety in both Copenhagen and Malmö.
56 Øresund Trends 2012A CoHEREnt AnD DIvERsE lABouR MARKEt | T h E L A B o U R M A R K E T
A CoHEREnt AnD DIvERsE lABouR MARKEtThE LABoUR MARKET
Summary
The economic crisis that began in 2008 is in decline and has been replaced by stagnation. The process is not entire-ly identical on the Danish and Swedish sides of the Øresund Region, however.
In Scania, employment rose slightly in 2010, but has fallen slightly since the be-ginning of 2011, which has resulted in an emerging rise in unemployment in Scania.Since the beginning of 2010, employ-
ment has fallen slightly in Zealand, while the unemployment rate, according to the official unemployment statistics, has been relatively stable and increasing slightly according to the Labour Force Survey, (LFS)1.
Zealand has been worst affected by the crisis. Before it began, the unemploy-ment level in Scania was almost twice as high as in Zealand. Now in Scania, the unemployment rate – expressed as a percentage of the workforce – is not much higher than in Zealand according
About the labour market statisticsØrestat’s register-based labour market statistics are built on the two national register-based labour market statistics: RAs from statistics Denmark and RAMs from statistics sweden.
RAs (Denmark) is based on the number of inhabitants at 1 January and RAMs (sweden) at 31 December each year, which give differ-ent annual data for the two countries. the latest information from Ørestat is RAs 2011 and RAMs 2010. In the Øresund statistics, RAs is adjusted for RAMs, which means that the figures for the Danish part of the Øresund Region are reported with a one-year delay in relation to the official Denmark-only statistics.
therefore, the latest version of Ørestat’s labour market statistics fails to take account of current developments in the labour market. the analysis is supplemented with current information from the labour Force survey1. lFs is a survey carried out in both the Danish and the swedish parts of the Øresund Region, and is only measured to a limited extent both at different age groups and regional level. 1The International Labour Organisation (ILO) conducted the survey 'Labour Force Survey' (LFS) – known as AKU in Denmark and Sweden. In Denmark and Sweden, the LFS survey was conducted through Statistics Denmark and Statistics Sweden and in the EU the task was undertaken by Eurostat.
to LFS statistics.
In 2010, there were nearly 1,690,000 employees in the 16–64 year age group in the Øresund Region. In addition, ap-proximately 18,500 commuted across the Øresund, who are not included in the register-based labour market statistics. 17,700 commuted daily from Scania to Zealand and 700 in the opposite direc-tion.
Nearly 70 per cent of the region's em-ployees – equivalent to 1,161,600 people
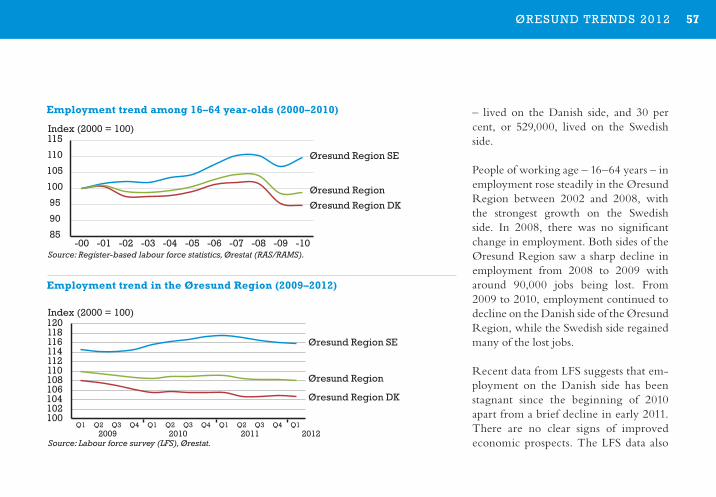
57Øresund Trends 2012
85
90
95
100
105
110
115
-00 -01 -02 -03 -04 -05 -06 -07 -08 -09 -10
Index (2000 = 100)
Øresund Region DK
Øresund Region DK
Øresund Region SE
Øresund Region SE
Øresund Region SE
Øresund Region
Øresund Region
100 102 104 106 108 110 112 114 116 118 120 Index (2000 = 100)
Age
Age
-20 -10 0 10 20 30 40 50 Per cent
Per cent
-19 20-24 25-29 30-34 35-39 40-44 45-49 50-54 55-59 60-64
Øresund Region SE Øresund Region DK
Øresund Region SE Øresund Region DK
586062646668707274 76 78 80
Per cent
Øresund Region DK Øresund Region
0 10 20 30 40 50 60 70 80 90
-1920-2425-2930-3435-3940-4445-4950-5455-5960-64
-00 -01 -02 -03 -04 -05 -06 -07 -08 -09 -10 Year
0 1 2 3 4 5 6 7 8 9
10 Per cent
Øresund Region DK
Øresund Region SE
2009 2010 2011 2012Q1 Q2 Q3 Q4 Q1 Q2 Q3 Q4 Q1 Q1Q2 Q3 Q4
2006 2007 2008 2009 2010 2011 2012Q1 Q3 Q1 Q3 Q1 Q3 Q1 Q3 Q1 Q3 Q1 Q1Q3
Employment trend among 16–64 year-olds (2000–2010)
Source: Register-based labour force statistics, Ørestat (RAS/RAMS).
– lived on the Danish side, and 30 per cent, or 529,000, lived on the Swedish side.
People of working age – 16–64 years – in employment rose steadily in the Øresund Region between 2002 and 2008, with the strongest growth on the Swedish side. In 2008, there was no significant change in employment. Both sides of the Øresund Region saw a sharp decline in employment from 2008 to 2009 with around 90,000 jobs being lost. From 2009 to 2010, employment continued to decline on the Danish side of the Øresund Region, while the Swedish side regained many of the lost jobs.
Recent data from LFS suggests that em-ployment on the Danish side has been stagnant since the beginning of 2010 apart from a brief decline in early 2011. There are no clear signs of improved economic prospects. The LFS data also
Employment trend in the Øresund Region (2009–2012)
Source: Labour force survey (LFS), Ørestat.
A CoHEREnt AnD DIvERsE lABouR MARKEt | T h E L A B o U R M A R K E T
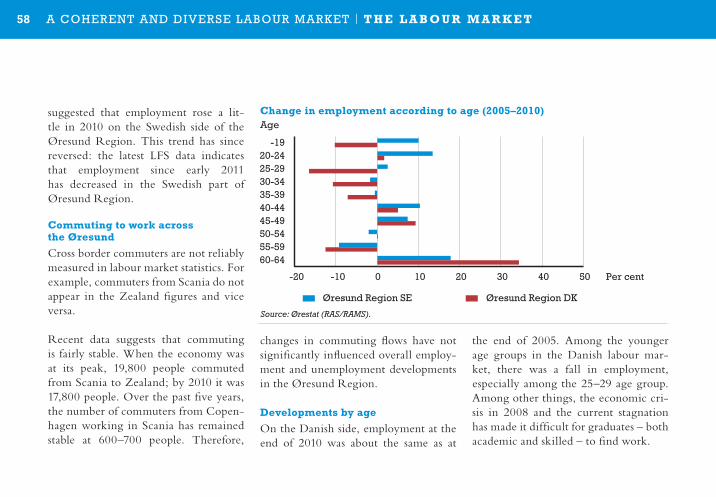
58 Øresund Trends 2012
suggested that employment rose a lit-tle in 2010 on the Swedish side of the Øresund Region. This trend has since reversed: the latest LFS data indicates that employment since early 2011 has decreased in the Swedish part of Øresund Region.
Commuting to work across the Øresund
Cross border commuters are not reliably measured in labour market statistics. For example, commuters from Scania do not appear in the Zealand figures and vice versa.
Recent data suggests that commuting is fairly stable. When the economy was at its peak, 19,800 people commuted from Scania to Zealand; by 2010 it was 17,800 people. Over the past five years, the number of commuters from Copen-hagen working in Scania has remained stable at 600–700 people. Therefore,
changes in commuting flows have not significantly influenced overall employ-ment and unemployment developments in the Øresund Region.
Developments by age
On the Danish side, employment at the end of 2010 was about the same as at
the end of 2005. Among the younger age groups in the Danish labour mar-ket, there was a fall in employment, especially among the 25–29 age group. Among other things, the economic cri-sis in 2008 and the current stagnation has made it difficult for graduates – both academic and skilled – to find work.
85
90
95
100
105
110
115
-00 -01 -02 -03 -04 -05 -06 -07 -08 -09 -10
Index (2000 = 100)
Øresund Region DK
Øresund Region DK
Øresund Region SE
Øresund Region SE
Øresund Region SE
Øresund Region
Øresund Region
100 102 104 106 108 110 112 114 116 118 120 Index (2000 = 100)
Age
Age
-20 -10 0 10 20 30 40 50 Per cent
Per cent
-19 20-24 25-29 30-34 35-39 40-44 45-49 50-54 55-59 60-64
Øresund Region SE Øresund Region DK
Øresund Region SE Øresund Region DK
586062646668707274 76 78 80
Per cent
Øresund Region DK Øresund Region
0 10 20 30 40 50 60 70 80 90
-1920-2425-2930-3435-3940-4445-4950-5455-5960-64
-00 -01 -02 -03 -04 -05 -06 -07 -08 -09 -10 Year
0 1 2 3 4 5 6 7 8 9
10 Per cent
Øresund Region DK
Øresund Region SE
2009 2010 2011 2012Q1 Q2 Q3 Q4 Q1 Q2 Q3 Q4 Q1 Q1Q2 Q3 Q4
2006 2007 2008 2009 2010 2011 2012Q1 Q3 Q1 Q3 Q1 Q3 Q1 Q3 Q1 Q3 Q1 Q1Q3
Source: Ørestat (RAS/RAMS).
Change in employment according to age (2005–2010)
A CoHEREnt AnD DIvERsE lABouR MARKEt | T h E L A B o U R M A R K E T
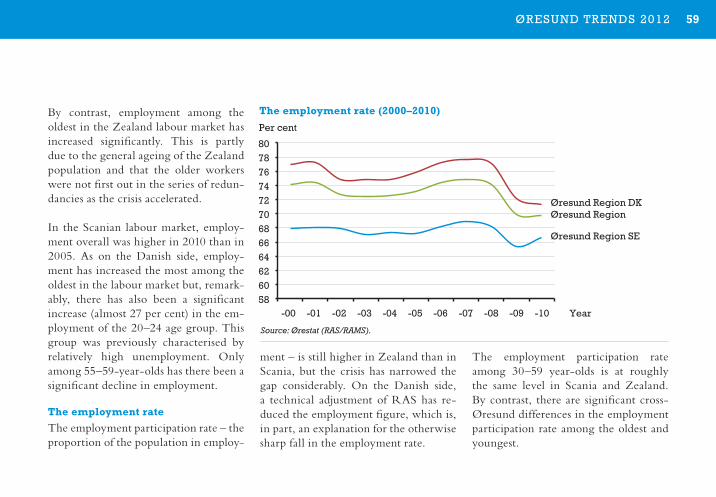
59Øresund Trends 2012
By contrast, employment among the oldest in the Zealand labour market has increased significantly. This is partly due to the general ageing of the Zealand population and that the older workers were not first out in the series of redun-dancies as the crisis accelerated.
In the Scanian labour market, employ-ment overall was higher in 2010 than in 2005. As on the Danish side, employ-ment has increased the most among the oldest in the labour market but, remark-ably, there has also been a significant increase (almost 27 per cent) in the em-ployment of the 20–24 age group. This group was previously characterised by relatively high unemployment. Only among 55–59-year-olds has there been a significant decline in employment.
The employment rate
The employment participation rate – the proportion of the population in employ-
ment – is still higher in Zealand than in Scania, but the crisis has narrowed the gap considerably. On the Danish side, a technical adjustment of RAS has re-duced the employment figure, which is, in part, an explanation for the otherwise sharp fall in the employment rate.
The employment participation rate among 30–59 year-olds is at roughly the same level in Scania and Zealand. By contrast, there are significant cross-Øresund differences in the employment participation rate among the oldest and youngest.
85
90
95
100
105
110
115
-00 -01 -02 -03 -04 -05 -06 -07 -08 -09 -10
Index (2000 = 100)
Øresund Region DK
Øresund Region DK
Øresund Region SE
Øresund Region SE
Øresund Region SE
Øresund Region
Øresund Region
100 102 104 106 108 110 112 114 116 118 120 Index (2000 = 100)
Age
Age
-20 -10 0 10 20 30 40 50 Per cent
Per cent
-19 20-24 25-29 30-34 35-39 40-44 45-49 50-54 55-59 60-64
Øresund Region SE Øresund Region DK
Øresund Region SE Øresund Region DK
586062646668707274 76 78 80
Per cent
Øresund Region DK Øresund Region
0 10 20 30 40 50 60 70 80 90
-1920-2425-2930-3435-3940-4445-4950-5455-5960-64
-00 -01 -02 -03 -04 -05 -06 -07 -08 -09 -10 Year
0 1 2 3 4 5 6 7 8 9
10 Per cent
Øresund Region DK
Øresund Region SE
2009 2010 2011 2012Q1 Q2 Q3 Q4 Q1 Q2 Q3 Q4 Q1 Q1Q2 Q3 Q4
2006 2007 2008 2009 2010 2011 2012Q1 Q3 Q1 Q3 Q1 Q3 Q1 Q3 Q1 Q3 Q1 Q1Q3
The employment rate (2000–2010)
Source: Ørestat (RAS/RAMS).
A CoHEREnt AnD DIvERsE lABouR MARKEt | T h E L A B o U R M A R K E T
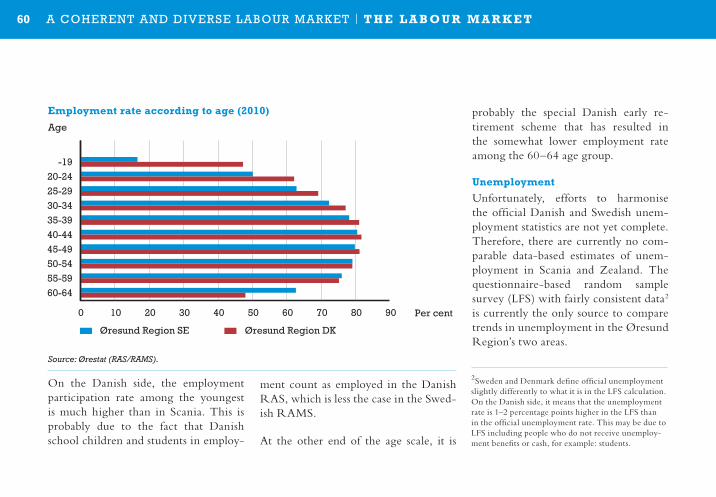
60 Øresund Trends 2012
On the Danish side, the employment participation rate among the youngest is much higher than in Scania. This is probably due to the fact that Danish school children and students in employ-
ment count as employed in the Danish RAS, which is less the case in the Swed-ish RAMS.
At the other end of the age scale, it is
probably the special Danish early re-tirement scheme that has resulted in the somewhat lower employment rate among the 60–64 age group.
Unemployment
Unfortunately, efforts to harmonise the official Danish and Swedish unem-ployment statistics are not yet complete. Therefore, there are currently no com-parable data-based estimates of unem-ployment in Scania and Zealand. The questionnaire-based random sample survey (LFS) with fairly consistent data2
is currently the only source to compare trends in unemployment in the Øresund Region’s two areas.
2Sweden and Denmark define official unemployment slightly differently to what it is in the LFS calculation. On the Danish side, it means that the unemployment rate is 1–2 percentage points higher in the LFS than in the official unemployment rate. This may be due to LFS including people who do not receive unemploy-ment benefits or cash, for example: students.
85
90
95
100
105
110
115
-00 -01 -02 -03 -04 -05 -06 -07 -08 -09 -10
Index (2000 = 100)
Øresund Region DK
Øresund Region DK
Øresund Region SE
Øresund Region SE
Øresund Region SE
Øresund Region
Øresund Region
100 102 104 106 108 110 112 114 116 118 120 Index (2000 = 100)
Age
Age
-20 -10 0 10 20 30 40 50 Per cent
Per cent
-19 20-24 25-29 30-34 35-39 40-44 45-49 50-54 55-59 60-64
Øresund Region SE Øresund Region DK
Øresund Region SE Øresund Region DK
586062646668707274 76 78 80
Per cent
Øresund Region DK Øresund Region
0 10 20 30 40 50 60 70 80 90
-1920-2425-2930-3435-3940-4445-4950-5455-5960-64
-00 -01 -02 -03 -04 -05 -06 -07 -08 -09 -10 Year
0 1 2 3 4 5 6 7 8 9
10 Per cent
Øresund Region DK
Øresund Region SE
2009 2010 2011 2012Q1 Q2 Q3 Q4 Q1 Q2 Q3 Q4 Q1 Q1Q2 Q3 Q4
2006 2007 2008 2009 2010 2011 2012Q1 Q3 Q1 Q3 Q1 Q3 Q1 Q3 Q1 Q3 Q1 Q1Q3
Employment rate according to age (2010)
Source: Ørestat (RAS/RAMS).
A CoHEREnt AnD DIvERsE lABouR MARKEt | T h E L A B o U R M A R K E T
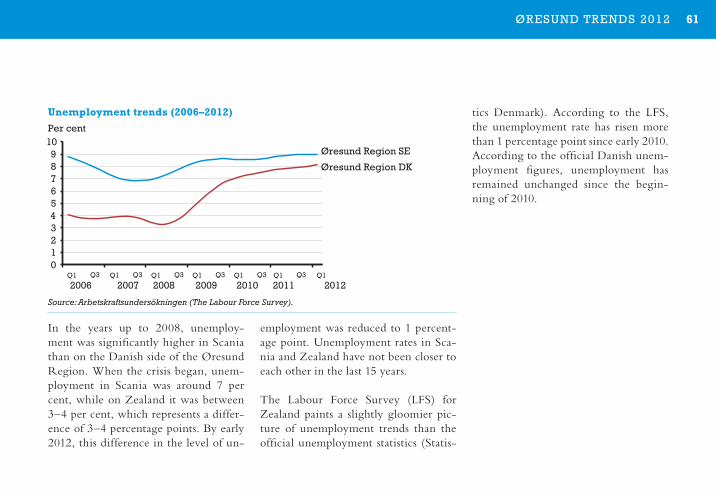
61Øresund Trends 2012
85
90
95
100
105
110
115
-00 -01 -02 -03 -04 -05 -06 -07 -08 -09 -10
Index (2000 = 100)
Øresund Region DK
Øresund Region DK
Øresund Region SE
Øresund Region SE
Øresund Region SE
Øresund Region
Øresund Region
100 102 104 106 108 110 112 114 116 118 120 Index (2000 = 100)
Age
Age
-20 -10 0 10 20 30 40 50 Per cent
Per cent
-19 20-24 25-29 30-34 35-39 40-44 45-49 50-54 55-59 60-64
Øresund Region SE Øresund Region DK
Øresund Region SE Øresund Region DK
586062646668707274 76 78 80
Per cent
Øresund Region DK Øresund Region
0 10 20 30 40 50 60 70 80 90
-1920-2425-2930-3435-3940-4445-4950-5455-5960-64
-00 -01 -02 -03 -04 -05 -06 -07 -08 -09 -10 Year
0 1 2 3 4 5 6 7 8 9
10 Per cent
Øresund Region DK
Øresund Region SE
2009 2010 2011 2012Q1 Q2 Q3 Q4 Q1 Q2 Q3 Q4 Q1 Q1Q2 Q3 Q4
2006 2007 2008 2009 2010 2011 2012Q1 Q3 Q1 Q3 Q1 Q3 Q1 Q3 Q1 Q3 Q1 Q1Q3
Unemployment trends (2006–2012)
In the years up to 2008, unemploy-ment was significantly higher in Scania than on the Danish side of the Øresund Region. When the crisis began, unem-ployment in Scania was around 7 per cent, while on Zealand it was between 3–4 per cent, which represents a differ-ence of 3–4 percentage points. By early 2012, this difference in the level of un-
Source: Arbetskraftsundersökningen (The Labour Force Survey).
employment was reduced to 1 percent-age point. Unemployment rates in Sca-nia and Zealand have not been closer to each other in the last 15 years.
The Labour Force Survey (LFS) for Zealand paints a slightly gloomier pic-ture of unemployment trends than the official unemployment statistics (Statis-
tics Denmark). According to the LFS, the unemployment rate has risen more than 1 percentage point since early 2010. According to the official Danish unem-ployment figures, unemployment has remained unchanged since the begin-ning of 2010.
A CoHEREnt AnD DIvERsE lABouR MARKEt | T h E L A B o U R M A R K E T
62 Øresund Trends 2012
CoMMUTinG ACRoSS ØRESUnD
Commuting developments across Øre-sund have primarily taken place bet-ween southwest Scania and the Danish part of the Øresund Region. This ac-counted for 55 per cent of all commu-ting across Øresund in 1999, while in 2010 it amounted to 81 per cent.
Øresund commuters lift the Danish economy by 740 million EUR a year
In 2010, Øresund commuters contrib- uted 740 million EUR in added value to the Danish economy. Since the Øresund Bridge opened in 2000, the Danish economy has received a substantial finan-cial injection totalling 4.4 billion EUR through Øresund commuters. For that money it would be possible to build one and one-third Øresund Bridges. In other words, the social gain from the Øresund Bridge exceeds what it cost to build it.
While the Danish economy gets an eco-nomic boost from the Øresund com-muting, the Swedish economy saves expenditure on unemployment benefits because Swedish employees get jobs in Denmark instead of becoming unem-ployed. In 2010, this saving was nearly 175 million EUR.
The calculations show only a part of the regional economic impact that the Øresund Bridge has and has had. For example, the shorter travel time across the Øresund to and from Kastrup (Co-penhagen Airport) had a positive effect on the number of business start-ups in and around Malmö and also the number of Swedish air passengers travelling from Kastrup. The value of these and many other effects have not been calculated.
The Øresund Bridge is the single most important reason that many have given for taking the opportunity to commute
to a job on the other side of the sound, since both journey time and travel costs have been reduced significantly as a re-sult of the opening of the fixed link.
Effects on the economy
The many Swedes who have entered the Danish labour market have solved a labour shortage problem since, and had the Danish employers not been able to recruit Swedes, the Danish economy would have lost production and hence the added value.
The social value of a person in employ-ment amounts to around 73,900 EUR. Social value is measured as a company's added value per employee.
Added value is calculated by subtracting the value of the raw materials, consuma-bles and services that the company uses in production from the company's turnover. The added value goes to the remunera-
A CoHEREnt AnD DIvERsE lABouR MARKEt | C o M M U T i n G A C Ro S S Ø R E S U n D
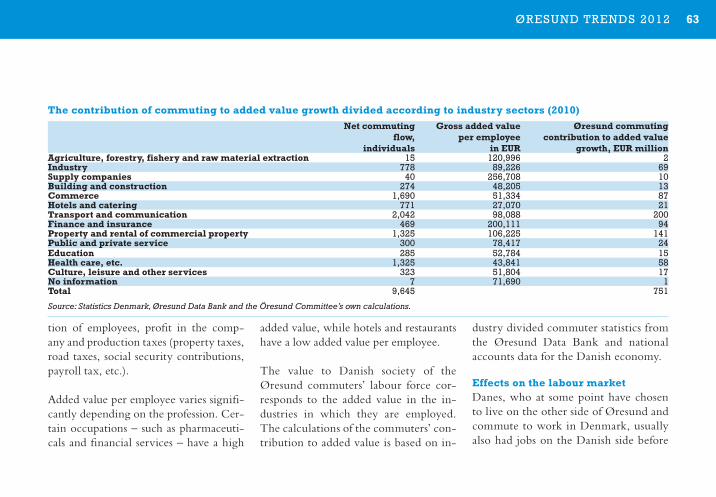
63Øresund Trends 2012
tion of employees, profit in the comp- any and production taxes (property taxes, road taxes, social security contributions, payroll tax, etc.).
Added value per employee varies signifi-cantly depending on the profession. Cer-tain occupations – such as pharmaceuti-cals and financial services – have a high
added value, while hotels and restaurants have a low added value per employee.
The value to Danish society of the Øresund commuters’ labour force cor-responds to the added value in the in-dustries in which they are employed. The calculations of the commuters’ con-tribution to added value is based on in-
dustry divided commuter statistics from the Øresund Data Bank and national accounts data for the Danish economy.
Effects on the labour marketDanes, who at some point have chosen to live on the other side of Øresund and commute to work in Denmark, usually also had jobs on the Danish side before
A CoHEREnt AnD DIvERsE lABouR MARKEt | C o M M U T i n G A C Ro S S Ø R E S U n D
The contribution of commuting to added value growth divided according to industry sectors (2010)net commuting
flow, individuals
Gross added value per employee
in EUR
Øresund commuting contribution to added value
growth, EUR millionAgriculture, forestry, fishery and raw material extraction 15 120,996 2industry 778 89,226 69Supply companies 40 256,708 10Building and construction 274 48,205 13Commerce 1,690 51,334 87hotels and catering 771 27,070 21Transport and communication 2,042 98,088 200Finance and insurance 469 200,111 94Property and rental of commercial property 1,325 106,225 141Public and private service 300 78,417 24Education 285 52,784 15health care, etc . 1,325 43,841 58Culture, leisure and other services 323 51,804 17no information 7 71,690 1Total 9,645 751
Source: Statistics Denmark, Øresund Data Bank and the Öresund Committee’s own calculations.
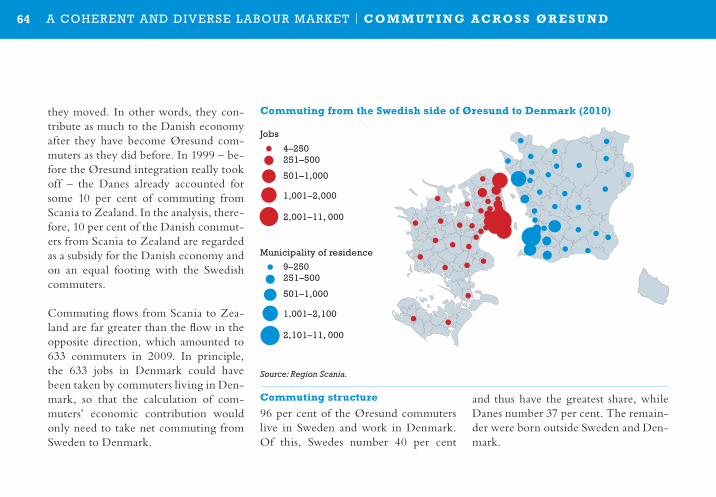
64 Øresund Trends 2012
they moved. In other words, they con-tribute as much to the Danish economy after they have become Øresund com-muters as they did before. In 1999 – be-fore the Øresund integration really took off – the Danes already accounted for some 10 per cent of commuting from Scania to Zealand. In the analysis, there-fore, 10 per cent of the Danish commut-ers from Scania to Zealand are regarded as a subsidy for the Danish economy and on an equal footing with the Swedish commuters.
Commuting flows from Scania to Zea-land are far greater than the flow in the opposite direction, which amounted to 633 commuters in 2009. In principle, the 633 jobs in Denmark could have been taken by commuters living in Den-mark, so that the calculation of com-muters’ economic contribution would only need to take net commuting from Sweden to Denmark.
Commuting structure
96 per cent of the Øresund commuters live in Sweden and work in Denmark. Of this, Swedes number 40 per cent
and thus have the greatest share, while Danes number 37 per cent. The remain-der were born outside Sweden and Den-mark.
Jobs
Municipality of residence
Source: Region Scania.
4–250251–500
501–1,000
1,001–2,000
2,001–11, 000
9–250251–500
501–1,000
1,001–2,100
2,101–11, 000
A CoHEREnt AnD DIvERsE lABouR MARKEt | C o M M U T i n G A C Ro S S Ø R E S U n D
Commuting from the Swedish side of Øresund to Denmark (2010)
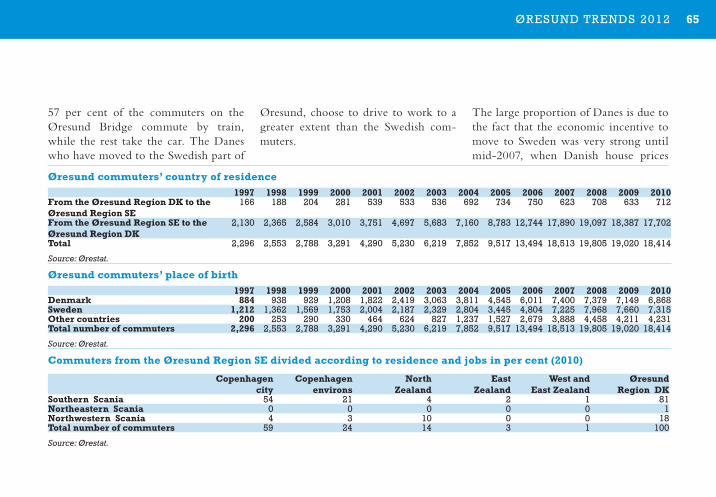
65Øresund Trends 2012
57 per cent of the commuters on the Øresund Bridge commute by train, while the rest take the car. The Danes who have moved to the Swedish part of
Øresund, choose to drive to work to a greater extent than the Swedish com-muters.
The large proportion of Danes is due to the fact that the economic incentive to move to Sweden was very strong until mid-2007, when Danish house prices
Øresund commuters’ country of residence1997 1998 1999 2000 2001 2002 2003 2004 2005 2006 2007 2008 2009 2010
From the Øresund Region DK to the Øresund Region SE
166 188 204 281 539 533 536 692 734 750 623 708 633 712
From the Øresund Region SE to the Øresund Region DK
2,130 2,365 2,584 3,010 3,751 4,697 5,683 7,160 8,783 12,744 17,890 19,097 18,387 17,702
Total 2,296 2,553 2,788 3,291 4,290 5,230 6,219 7,852 9,517 13,494 18,513 19,805 19,020 18,414
Source: Ørestat.
Øresund commuters’ place of birth1997 1998 1999 2000 2001 2002 2003 2004 2005 2006 2007 2008 2009 2010
Denmark 884 938 929 1,208 1,822 2,419 3,063 3,811 4,545 6,011 7,400 7,379 7,149 6,868Sweden 1,212 1,362 1,569 1,753 2,004 2,187 2,329 2,804 3,445 4,804 7,225 7,968 7,660 7,315other countries 200 253 290 330 464 624 827 1,237 1,527 2,679 3,888 4,458 4,211 4,231Total number of commuters 2,296 2,553 2,788 3,291 4,290 5,230 6,219 7,852 9,517 13,494 18,513 19,805 19,020 18,414
Source: Ørestat.
Commuters from the Øresund Region SE divided according to residence and jobs in per cent (2010)
Copenhagen city
Copenhagen environs
north Zealand
East Zealand
West and East Zealand
Øresund Region DK
Southern Scania 54 21 4 2 1 81northeastern Scania 0 0 0 0 0 1northwestern Scania 4 3 10 0 0 18Total number of commuters 59 24 14 3 1 100
Source: Ørestat.
A CoHEREnt AnD DIvERsE lABouR MARKEt | C o M M U T i n G A C Ro S S Ø R E S U n D
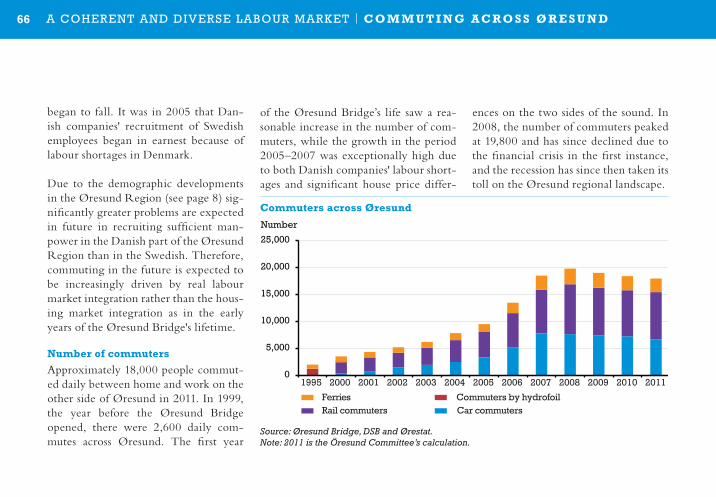
66 Øresund Trends 2012
began to fall. It was in 2005 that Dan-ish companies' recruitment of Swedish employees began in earnest because of labour shortages in Denmark.
Due to the demographic developments in the Øresund Region (see page 8) sig-nificantly greater problems are expected in future in recruiting sufficient man-power in the Danish part of the Øresund Region than in the Swedish. Therefore, commuting in the future is expected to be increasingly driven by real labour market integration rather than the hous-ing market integration as in the early years of the Øresund Bridge's lifetime.
number of commuters
Approximately 18,000 people commut-ed daily between home and work on the other side of Øresund in 2011. In 1999, the year before the Øresund Bridge opened, there were 2,600 daily com-mutes across Øresund. The first year
of the Øresund Bridge’s life saw a rea-sonable increase in the number of com-muters, while the growth in the period 2005–2007 was exceptionally high due to both Danish companies' labour short-ages and significant house price differ-
ences on the two sides of the sound. In 2008, the number of commuters peaked at 19,800 and has since declined due to the financial crisis in the first instance, and the recession has since then taken its toll on the Øresund regional landscape.
1995 0
5,000
10,000
15,000
20,000
25,000
Number
Ferries Commuters by hydrofoilRail commuters Car commuters
2000 2001 2002 2003 2004 2005 2006 2007 2008 2009 2010 2011
Source: Øresund Bridge, DSB and Ørestat.Note: 2011 is the Öresund Committee’s calculation.
Commuters across Øresund
A CoHEREnt AnD DIvERsE lABouR MARKEt | C o M M U T i n G A C Ro S S Ø R E S U n D
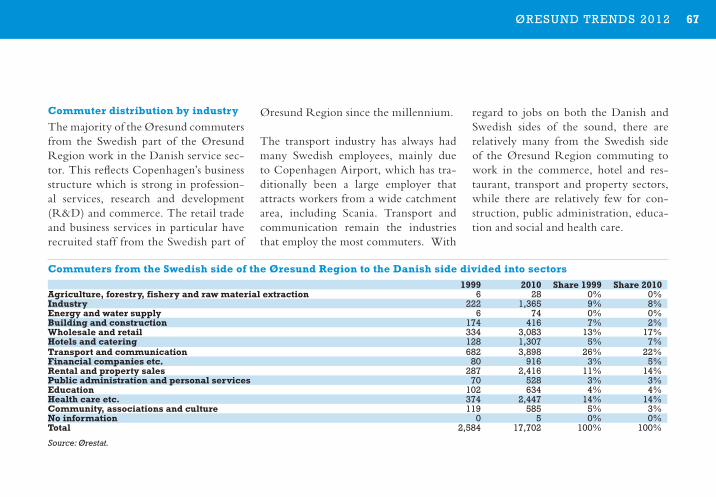
67Øresund Trends 2012
Commuter distribution by industry
The majority of the Øresund commuters from the Swedish part of the Øresund Region work in the Danish service sec-tor. This reflects Copenhagen’s business structure which is strong in profession-al services, research and development (R&D) and commerce. The retail trade and business services in particular have recruited staff from the Swedish part of
Øresund Region since the millennium.
The transport industry has always had many Swedish employees, mainly due to Copenhagen Airport, which has tra-ditionally been a large employer that attracts workers from a wide catchment area, including Scania. Transport and communication remain the industries that employ the most commuters. With
regard to jobs on both the Danish and Swedish sides of the sound, there are relatively many from the Swedish side of the Øresund Region commuting to work in the commerce, hotel and res-taurant, transport and property sectors, while there are relatively few for con-struction, public administration, educa-tion and social and health care.
Commuters from the Swedish side of the Øresund Region to the Danish side divided into sectors1999 2010 Share 1999 Share 2010
Agriculture, forestry, fishery and raw material extraction 6 28 0% 0%industry 222 1,365 9% 8%Energy and water supply 6 74 0% 0%Building and construction 174 416 7% 2%Wholesale and retail 334 3,083 13% 17%hotels and catering 128 1,307 5% 7%Transport and communication 682 3,898 26% 22%Financial companies etc . 80 916 3% 5%Rental and property sales 287 2,416 11% 14%Public administration and personal services 70 528 3% 3%Education 102 634 4% 4%health care etc . 374 2,447 14% 14%Community, associations and culture 119 585 5% 3%no information 0 5 0% 0%Total 2,584 17,702 100% 100%
Source: Ørestat.
A CoHEREnt AnD DIvERsE lABouR MARKEt | C o M M U T i n G A C Ro S S Ø R E S U n D
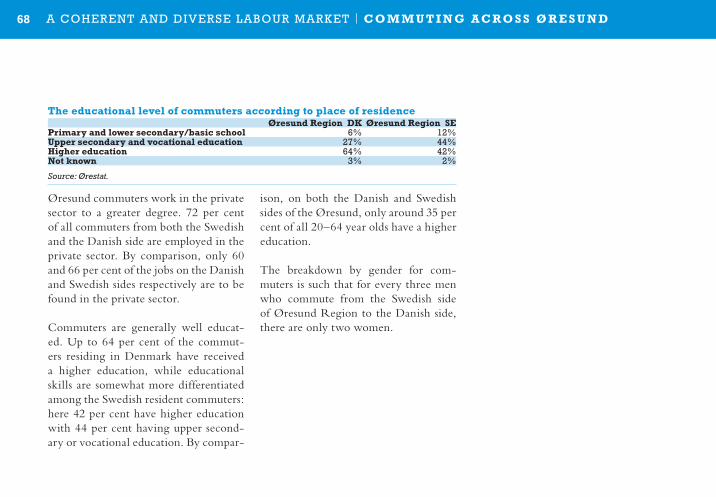
68 Øresund Trends 2012
Øresund commuters work in the private sector to a greater degree. 72 per cent of all commuters from both the Swedish and the Danish side are employed in the private sector. By comparison, only 60 and 66 per cent of the jobs on the Danish and Swedish sides respectively are to be found in the private sector.
Commuters are generally well educat-ed. Up to 64 per cent of the commut-ers residing in Denmark have received a higher education, while educational skills are somewhat more differentiated among the Swedish resident commuters: here 42 per cent have higher education with 44 per cent having upper second-ary or vocational education. By compar-
ison, on both the Danish and Swedish sides of the Øresund, only around 35 per cent of all 20–64 year olds have a higher education.
The breakdown by gender for com-muters is such that for every three men who commute from the Swedish side of Øresund Region to the Danish side, there are only two women.
The educational level of commuters according to place of residenceØresund Region DK Øresund Region SE
Primary and lower secondary/basic school 6% 12%Upper secondary and vocational education 27% 44%higher education 64% 42%not known 3% 2%
Source: Ørestat.
A CoHEREnt AnD DIvERsE lABouR MARKEt | C o M M U T i n G A C Ro S S Ø R E S U n D

69Øresund Trends 2012A CoHEREnt AnD DIvERsE lABouR MARKEt | C o M M U T i n G A C Ro S S Ø R E S U n D
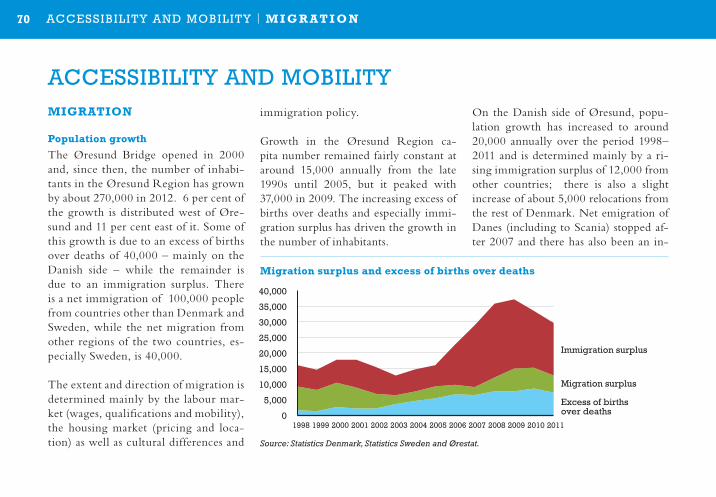
70 Øresund Trends 2012
MiGRATion
Population growth
The Øresund Bridge opened in 2000 and, since then, the number of inhabi-tants in the Øresund Region has grown by about 270,000 in 2012. 6 per cent of the growth is distributed west of Øre-sund and 11 per cent east of it. Some of this growth is due to an excess of births over deaths of 40,000 – mainly on the Danish side – while the remainder is due to an immigration surplus. There is a net immigration of 100,000 people from countries other than Denmark and Sweden, while the net migration from other regions of the two countries, es-pecially Sweden, is 40,000.
The extent and direction of migration is determined mainly by the labour mar-ket (wages, qualifications and mobility), the housing market (pricing and loca-tion) as well as cultural differences and
immigration policy.
Growth in the Øresund Region ca-pita number remained fairly constant at around 15,000 annually from the late 1990s until 2005, but it peaked with 37,000 in 2009. The increasing excess of births over deaths and especially immi-gration surplus has driven the growth in the number of inhabitants.
0
5,000
10,000
15,000
20,000
25,000
30,000
35,000
40,000
Immigration surplus
Migration surplus
Excess of births over deaths
1998 1999 2000 2001 2002 2003 2004 2005 2006 2007 2008 2009 2010 2011
0
5,000
10,000
15,000
20,000
25,000
00-04 05-09 10-11 00-04 05-09 10-11 Øresund Region DK Øresund Region SE
Immigration surplus Migration surplus Excess of births over deaths
0
500
1,000
1,500
2,000
2,500
3,000
3,500
4,000
4,500
5,000
From Scania to Zealand
From Zealand to Scania
NumberEUR
Additional cost
Migration (net)
19991998 2000 2001 2002 2003 2004 2005 2006 2007 2008 2009 2010 2011
0 500
1,000 1,500 2,000 2,500 3,000 3,500 4,000 4,500 5,000
0 500
1,000 1,500 2,000 2,500 3,000 3,500 4,000 4,500 5,000
OtherSwedish
Danish
OtherSwedish
Danish
0
10
20
30
40
50
0-5 6-15 16-24 25-34 35-54 55-64 +65
Per cent Number
Age group Age group0-5 6-15 16-24 25-34 35-54 55-64 +65
Migration to and fromGreater Copenhagen and Malmö
Migration between Greater Copenhagen and Malmö
From Zealand to Scania
From Scania to Zealand
0
200
400
600
800
1,000
1,200
2001 2002 2003 2004 2005 2006 2007 2008 2009 2010 2011
2001 2002 2003 2004 2005 2006 2007 2008 2009 2010 2011
-1,000
-500
-
500
1,000
1,500
2,000
2,500
3,000
-
200
400
600
800
1,000
1,200
1,400
1,600
1,800
1998
19
99
2000
20
01
2002
20
03
2004
20
05
2006
20
07
2008
20
09
2010
20
11
Migration surplus and excess of births over deaths
Source: Statistics Denmark, Statistics Sweden and Ørestat.
On the Danish side of Øresund, popu-lation growth has increased to around 20,000 annually over the period 1998–2011 and is determined mainly by a ri-sing immigration surplus of 12,000 from other countries; there is also a slight increase of about 5,000 relocations from the rest of Denmark. Net emigration of Danes (including to Scania) stopped af-ter 2007 and there has also been an in-
ACCEssIBIlItY AnD MoBIlItY | M i G R AT i o n
ACCEssIBIlItY AnD MoBIlItY
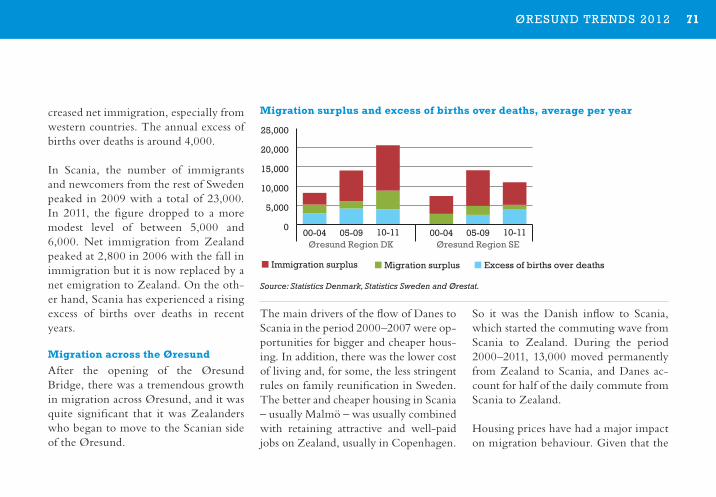
71Øresund Trends 2012
creased net immigration, especially from western countries. The annual excess of births over deaths is around 4,000.
In Scania, the number of immigrants and newcomers from the rest of Sweden peaked in 2009 with a total of 23,000. In 2011, the figure dropped to a more modest level of between 5,000 and 6,000. Net immigration from Zealand peaked at 2,800 in 2006 with the fall in immigration but it is now replaced by a net emigration to Zealand. On the oth-er hand, Scania has experienced a rising excess of births over deaths in recent years.
Migration across the Øresund
After the opening of the Øresund Bridge, there was a tremendous growth in migration across Øresund, and it was quite significant that it was Zealanders who began to move to the Scanian side of the Øresund.
The main drivers of the flow of Danes to Scania in the period 2000–2007 were op-portunities for bigger and cheaper hous-ing. In addition, there was the lower cost of living and, for some, the less stringent rules on family reunification in Sweden. The better and cheaper housing in Scania – usually Malmö – was usually combined with retaining attractive and well-paid jobs on Zealand, usually in Copenhagen.
So it was the Danish inflow to Scania, which started the commuting wave from Scania to Zealand. During the period 2000–2011, 13,000 moved permanently from Zealand to Scania, and Danes ac-count for half of the daily commute from Scania to Zealand.
Housing prices have had a major impact on migration behaviour. Given that the
0
5,000
10,000
15,000
20,000
25,000
30,000
35,000
40,000
Immigration surplus
Migration surplus
Excess of births over deaths
1998 1999 2000 2001 2002 2003 2004 2005 2006 2007 2008 2009 2010 2011
0
5,000
10,000
15,000
20,000
25,000
00-04 05-09 10-11 00-04 05-09 10-11 Øresund Region DK Øresund Region SE
Immigration surplus Migration surplus Excess of births over deaths
0
500
1,000
1,500
2,000
2,500
3,000
3,500
4,000
4,500
5,000
From Scania to Zealand
From Zealand to Scania
NumberEUR
Additional cost
Migration (net)
19991998 2000 2001 2002 2003 2004 2005 2006 2007 2008 2009 2010 2011
0 500
1,000 1,500 2,000 2,500 3,000 3,500 4,000 4,500 5,000
0 500
1,000 1,500 2,000 2,500 3,000 3,500 4,000 4,500 5,000
OtherSwedish
Danish
OtherSwedish
Danish
0
10
20
30
40
50
0-5 6-15 16-24 25-34 35-54 55-64 +65
Per cent Number
Age group Age group0-5 6-15 16-24 25-34 35-54 55-64 +65
Migration to and fromGreater Copenhagen and Malmö
Migration between Greater Copenhagen and Malmö
From Zealand to Scania
From Scania to Zealand
0
200
400
600
800
1,000
1,200
2001 2002 2003 2004 2005 2006 2007 2008 2009 2010 2011
2001 2002 2003 2004 2005 2006 2007 2008 2009 2010 2011
-1,000
-500
-
500
1,000
1,500
2,000
2,500
3,000
-
200
400
600
800
1,000
1,200
1,400
1,600
1,800
1998
19
99
2000
20
01
2002
20
03
2004
20
05
2006
20
07
2008
20
09
2010
20
11
Migration surplus and excess of births over deaths, average per year
Source: Statistics Denmark, Statistics Sweden and Ørestat.
ACCEssIBIlItY AnD MoBIlItY | M i G R AT i o n
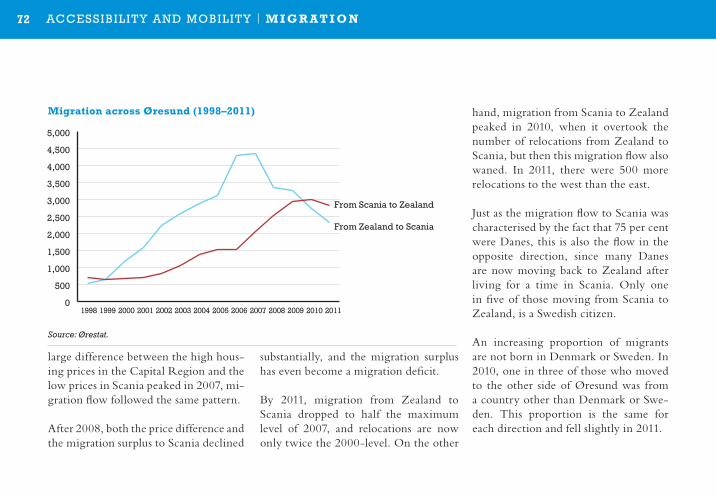
72 Øresund Trends 2012
large difference between the high hous-ing prices in the Capital Region and the low prices in Scania peaked in 2007, mi-gration flow followed the same pattern.
After 2008, both the price difference and the migration surplus to Scania declined
substantially, and the migration surplus has even become a migration deficit.
By 2011, migration from Zealand to Scania dropped to half the maximum level of 2007, and relocations are now only twice the 2000-level. On the other
hand, migration from Scania to Zealand peaked in 2010, when it overtook the number of relocations from Zealand to Scania, but then this migration flow also waned. In 2011, there were 500 more relocations to the west than the east.
Just as the migration flow to Scania was characterised by the fact that 75 per cent were Danes, this is also the flow in the opposite direction, since many Danes are now moving back to Zealand after living for a time in Scania. Only one in five of those moving from Scania to Zealand, is a Swedish citizen.
An increasing proportion of migrants are not born in Denmark or Sweden. In 2010, one in three of those who moved to the other side of Øresund was from a country other than Denmark or Swe-den. This proportion is the same for each direction and fell slightly in 2011.
0
5,000
10,000
15,000
20,000
25,000
30,000
35,000
40,000
Immigration surplus
Migration surplus
Excess of births over deaths
1998 1999 2000 2001 2002 2003 2004 2005 2006 2007 2008 2009 2010 2011
0
5,000
10,000
15,000
20,000
25,000
00-04 05-09 10-11 00-04 05-09 10-11 Øresund Region DK Øresund Region SE
Immigration surplus Migration surplus Excess of births over deaths
0
500
1,000
1,500
2,000
2,500
3,000
3,500
4,000
4,500
5,000
From Scania to Zealand
From Zealand to Scania
NumberEUR
Additional cost
Migration (net)
19991998 2000 2001 2002 2003 2004 2005 2006 2007 2008 2009 2010 2011
0 500
1,000 1,500 2,000 2,500 3,000 3,500 4,000 4,500 5,000
0 500
1,000 1,500 2,000 2,500 3,000 3,500 4,000 4,500 5,000
OtherSwedish
Danish
OtherSwedish
Danish
0
10
20
30
40
50
0-5 6-15 16-24 25-34 35-54 55-64 +65
Per cent Number
Age group Age group0-5 6-15 16-24 25-34 35-54 55-64 +65
Migration to and fromGreater Copenhagen and Malmö
Migration between Greater Copenhagen and Malmö
From Zealand to Scania
From Scania to Zealand
0
200
400
600
800
1,000
1,200
2001 2002 2003 2004 2005 2006 2007 2008 2009 2010 2011
2001 2002 2003 2004 2005 2006 2007 2008 2009 2010 2011
-1,000
-500
-
500
1,000
1,500
2,000
2,500
3,000
-
200
400
600
800
1,000
1,200
1,400
1,600
1,800
1998
19
99
2000
20
01
2002
20
03
2004
20
05
2006
20
07
2008
20
09
2010
20
11
Migration across Øresund (1998–2011)
Source: Ørestat.
ACCEssIBIlItY AnD MoBIlItY | M i G R AT i o n
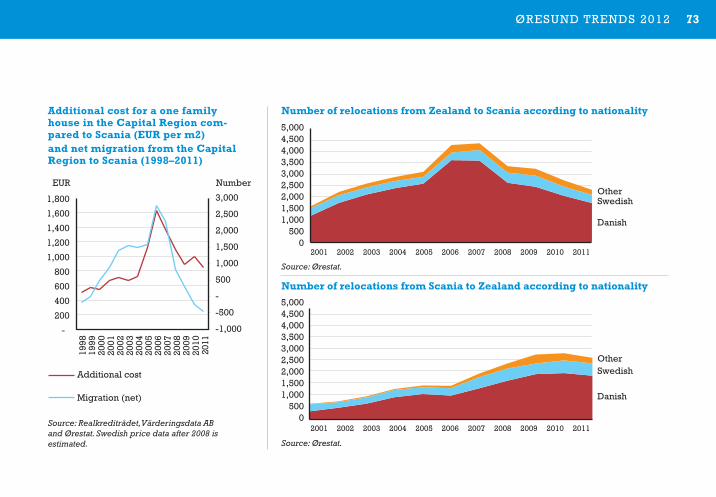
73Øresund Trends 2012
0
5,000
10,000
15,000
20,000
25,000
30,000
35,000
40,000
Immigration surplus
Migration surplus
Excess of births over deaths
1998 1999 2000 2001 2002 2003 2004 2005 2006 2007 2008 2009 2010 2011
0
5,000
10,000
15,000
20,000
25,000
00-04 05-09 10-11 00-04 05-09 10-11 Øresund Region DK Øresund Region SE
Immigration surplus Migration surplus Excess of births over deaths
0
500
1,000
1,500
2,000
2,500
3,000
3,500
4,000
4,500
5,000
From Scania to Zealand
From Zealand to Scania
NumberEUR
Additional cost
Migration (net)
19991998 2000 2001 2002 2003 2004 2005 2006 2007 2008 2009 2010 2011
0 500
1,000 1,500 2,000 2,500 3,000 3,500 4,000 4,500 5,000
0 500
1,000 1,500 2,000 2,500 3,000 3,500 4,000 4,500 5,000
OtherSwedish
Danish
OtherSwedish
Danish
0
10
20
30
40
50
0-5 6-15 16-24 25-34 35-54 55-64 +65
Per cent Number
Age group Age group0-5 6-15 16-24 25-34 35-54 55-64 +65
Migration to and fromGreater Copenhagen and Malmö
Migration between Greater Copenhagen and Malmö
From Zealand to Scania
From Scania to Zealand
0
200
400
600
800
1,000
1,200
2001 2002 2003 2004 2005 2006 2007 2008 2009 2010 2011
2001 2002 2003 2004 2005 2006 2007 2008 2009 2010 2011
-1,000
-500
-
500
1,000
1,500
2,000
2,500
3,000
-
200
400
600
800
1,000
1,200
1,400
1,600
1,800
1998
19
99
2000
20
01
2002
20
03
2004
20
05
2006
20
07
2008
20
09
2010
20
11
0
5,000
10,000
15,000
20,000
25,000
30,000
35,000
40,000
Immigration surplus
Migration surplus
Excess of births over deaths
1998 1999 2000 2001 2002 2003 2004 2005 2006 2007 2008 2009 2010 2011
0
5,000
10,000
15,000
20,000
25,000
00-04 05-09 10-11 00-04 05-09 10-11 Øresund Region DK Øresund Region SE
Immigration surplus Migration surplus Excess of births over deaths
0
500
1,000
1,500
2,000
2,500
3,000
3,500
4,000
4,500
5,000
From Scania to Zealand
From Zealand to Scania
NumberEUR
Additional cost
Migration (net)
19991998 2000 2001 2002 2003 2004 2005 2006 2007 2008 2009 2010 2011
0 500
1,000 1,500 2,000 2,500 3,000 3,500 4,000 4,500 5,000
0 500
1,000 1,500 2,000 2,500 3,000 3,500 4,000 4,500 5,000
OtherSwedish
Danish
OtherSwedish
Danish
0
10
20
30
40
50
0-5 6-15 16-24 25-34 35-54 55-64 +65
Per cent Number
Age group Age group0-5 6-15 16-24 25-34 35-54 55-64 +65
Migration to and fromGreater Copenhagen and Malmö
Migration between Greater Copenhagen and Malmö
From Zealand to Scania
From Scania to Zealand
0
200
400
600
800
1,000
1,200
2001 2002 2003 2004 2005 2006 2007 2008 2009 2010 2011
2001 2002 2003 2004 2005 2006 2007 2008 2009 2010 2011
-1,000
-500
-
500
1,000
1,500
2,000
2,500
3,000
-
200
400
600
800
1,000
1,200
1,400
1,600
1,800
1998
19
99
2000
20
01
2002
20
03
2004
20
05
2006
20
07
2008
20
09
2010
20
11
Additional cost for a one family house in the Capital Region com-pared to Scania (EUR per m2)and net migration from the Capital Region to Scania (1998–2011)
number of relocations from Zealand to Scania according to nationality
number of relocations from Scania to Zealand according to nationality
Source: Realkreditrådet, Värderingsdata ABand Ørestat. Swedish price data after 2008 is estimated.
0
5,000
10,000
15,000
20,000
25,000
30,000
35,000
40,000
Immigration surplus
Migration surplus
Excess of births over deaths
1998 1999 2000 2001 2002 2003 2004 2005 2006 2007 2008 2009 2010 2011
0
5,000
10,000
15,000
20,000
25,000
00-04 05-09 10-11 00-04 05-09 10-11 Øresund Region DK Øresund Region SE
Immigration surplus Migration surplus Excess of births over deaths
0
500
1,000
1,500
2,000
2,500
3,000
3,500
4,000
4,500
5,000
From Scania to Zealand
From Zealand to Scania
NumberEUR
Additional cost
Migration (net)
19991998 2000 2001 2002 2003 2004 2005 2006 2007 2008 2009 2010 2011
0 500
1,000 1,500 2,000 2,500 3,000 3,500 4,000 4,500 5,000
0 500
1,000 1,500 2,000 2,500 3,000 3,500 4,000 4,500 5,000
OtherSwedish
Danish
OtherSwedish
Danish
0
10
20
30
40
50
0-5 6-15 16-24 25-34 35-54 55-64 +65
Per cent Number
Age group Age group0-5 6-15 16-24 25-34 35-54 55-64 +65
Migration to and fromGreater Copenhagen and Malmö
Migration between Greater Copenhagen and Malmö
From Zealand to Scania
From Scania to Zealand
0
200
400
600
800
1,000
1,200
2001 2002 2003 2004 2005 2006 2007 2008 2009 2010 2011
2001 2002 2003 2004 2005 2006 2007 2008 2009 2010 2011
-1,000
-500
-
500
1,000
1,500
2,000
2,500
3,000
-
200
400
600
800
1,000
1,200
1,400
1,600
1,800
1998
19
99
2000
20
01
2002
20
03
2004
20
05
2006
20
07
2008
20
09
2010
20
11
Source: Ørestat.
Source: Ørestat.
ACCEssIBIlItY AnD MoBIlItY | M i G R AT i o n
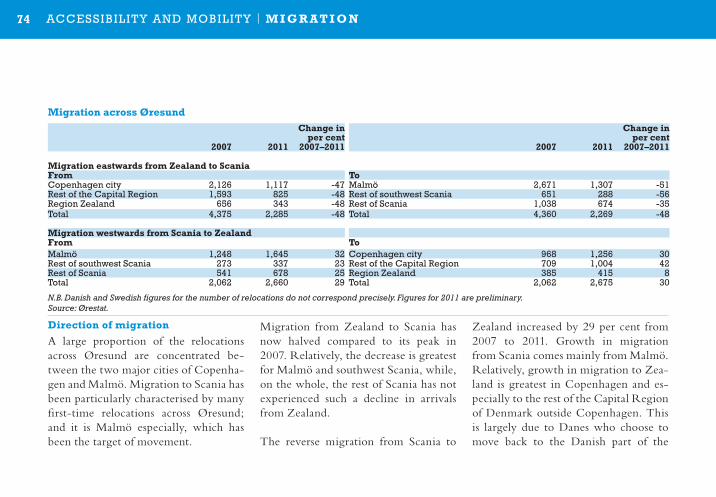
74 Øresund Trends 2012
Migration from Zealand to Scania has now halved compared to its peak in 2007. Relatively, the decrease is greatest for Malmö and southwest Scania, while, on the whole, the rest of Scania has not experienced such a decline in arrivals from Zealand.
The reverse migration from Scania to
Zealand increased by 29 per cent from 2007 to 2011. Growth in migration from Scania comes mainly from Malmö. Relatively, growth in migration to Zea-land is greatest in Copenhagen and es-pecially to the rest of the Capital Region of Denmark outside Copenhagen. This is largely due to Danes who choose to move back to the Danish part of the
Direction of migration
A large proportion of the relocations across Øresund are concentrated be-tween the two major cities of Copenha-gen and Malmö. Migration to Scania has been particularly characterised by many first-time relocations across Øresund; and it is Malmö especially, which has been the target of movement.
Migration across ØresundChange in
per centChange in
per cent2007 2011 2007–2011 2007 2011 2007–2011
Migration eastwards from Zealand to ScaniaFrom ToCopenhagen city 2,126 1,117 -47 Malmö 2,671 1,307 -51Rest of the Capital Region 1,593 825 -48 Rest of southwest scania 651 288 -56Region Zealand 656 343 -48 Rest of scania 1,038 674 -35total 4,375 2,285 -48 total 4,360 2,269 -48
Migration westwards from Scania to ZealandFrom ToMalmö 1,248 1,645 32 Copenhagen city 968 1,256 30Rest of southwest scania 273 337 23 Rest of the Capital Region 709 1,004 42Rest of scania 541 678 25 Region Zealand 385 415 8total 2,062 2,660 29 total 2,062 2,675 30
N.B. Danish and Swedish figures for the number of relocations do not correspond precisely. Figures for 2011 are preliminary.Source: Ørestat.
ACCEssIBIlItY AnD MoBIlItY | M i G R AT i o n
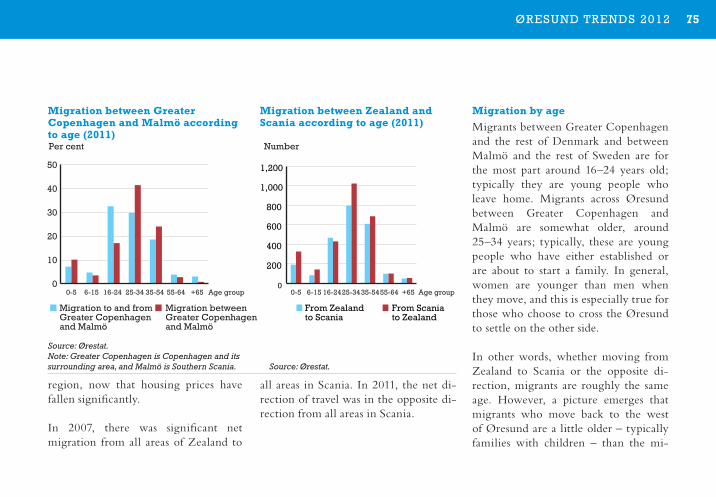
75Øresund Trends 2012
all areas in Scania. In 2011, the net di-rection of travel was in the opposite di-rection from all areas in Scania.
Migration by age
Migrants between Greater Copenhagen and the rest of Denmark and between Malmö and the rest of Sweden are for the most part around 16–24 years old; typically they are young people who leave home. Migrants across Øresund between Greater Copenhagen and Malmö are somewhat older, around 25–34 years; typically, these are young people who have either established or are about to start a family. In general, women are younger than men when they move, and this is especially true for those who choose to cross the Øresund to settle on the other side.
In other words, whether moving from Zealand to Scania or the opposite di-rection, migrants are roughly the same age. However, a picture emerges that migrants who move back to the west of Øresund are a little older – typically families with children – than the mi-
0
5,000
10,000
15,000
20,000
25,000
30,000
35,000
40,000
Immigration surplus
Migration surplus
Excess of births over deaths
1998 1999 2000 2001 2002 2003 2004 2005 2006 2007 2008 2009 2010 2011
0
5,000
10,000
15,000
20,000
25,000
00-04 05-09 10-11 00-04 05-09 10-11 Øresund Region DK Øresund Region SE
Immigration surplus Migration surplus Excess of births over deaths
0
500
1,000
1,500
2,000
2,500
3,000
3,500
4,000
4,500
5,000
From Scania to Zealand
From Zealand to Scania
NumberEUR
Additional cost
Migration (net)
19991998 2000 2001 2002 2003 2004 2005 2006 2007 2008 2009 2010 2011
0 500
1,000 1,500 2,000 2,500 3,000 3,500 4,000 4,500 5,000
0 500
1,000 1,500 2,000 2,500 3,000 3,500 4,000 4,500 5,000
OtherSwedish
Danish
OtherSwedish
Danish
0
10
20
30
40
50
0-5 6-15 16-24 25-34 35-54 55-64 +65
Per cent Number
Age group Age group0-5 6-15 16-24 25-34 35-54 55-64 +65
Migration to and fromGreater Copenhagen and Malmö
Migration between Greater Copenhagen and Malmö
From Zealand to Scania
From Scania to Zealand
0
200
400
600
800
1,000
1,200
2001 2002 2003 2004 2005 2006 2007 2008 2009 2010 2011
2001 2002 2003 2004 2005 2006 2007 2008 2009 2010 2011
-1,000
-500
-
500
1,000
1,500
2,000
2,500
3,000
-
200
400
600
800
1,000
1,200
1,400
1,600
1,800
1998
19
99
2000
20
01
2002
20
03
2004
20
05
2006
20
07
2008
20
09
2010
20
11
Migration between Greater Copenhagen and Malmö according to age (2011)
Migration between Zealand and Scania according to age (2011)
Source: Ørestat. Note: Greater Copenhagen is Copenhagen and its surrounding area, and Malmö is Southern Scania. Source: Ørestat.
region, now that housing prices have fallen significantly.
In 2007, there was significant net migration from all areas of Zealand to
ACCEssIBIlItY AnD MoBIlItY | M i G R AT i o n
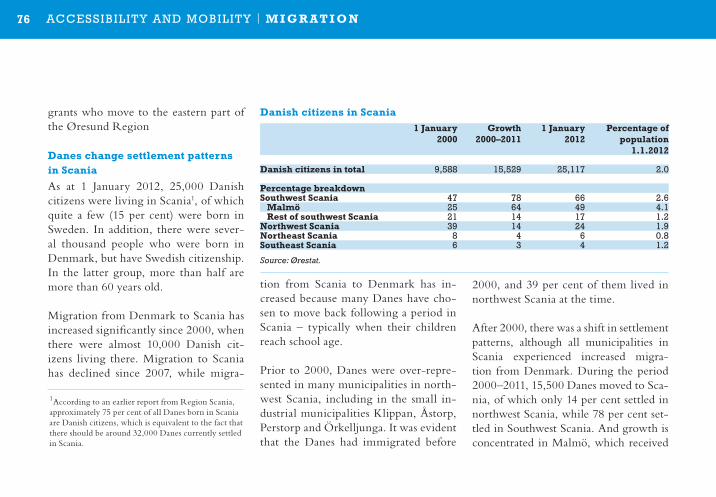
76 Øresund Trends 2012
grants who move to the eastern part of the Øresund Region
Danes change settlement patterns in Scania
As at 1 January 2012, 25,000 Danish citizens were living in Scania1, of which quite a few (15 per cent) were born in Sweden. In addition, there were sever-al thousand people who were born in Denmark, but have Swedish citizenship. In the latter group, more than half are more than 60 years old.
Migration from Denmark to Scania has increased significantly since 2000, when there were almost 10,000 Danish cit-izens living there. Migration to Scania has declined since 2007, while migra-
tion from Scania to Denmark has in-creased because many Danes have cho-sen to move back following a period in Scania – typically when their children reach school age.
Prior to 2000, Danes were over-repre-sented in many municipalities in north-west Scania, including in the small in-dustrial municipalities Klippan, Åstorp, Perstorp and Örkelljunga. It was evident that the Danes had immigrated before
2000, and 39 per cent of them lived in northwest Scania at the time.
After 2000, there was a shift in settlement patterns, although all municipalities in Scania experienced increased migra-tion from Denmark. During the period 2000–2011, 15,500 Danes moved to Sca-nia, of which only 14 per cent settled in northwest Scania, while 78 per cent set-tled in Southwest Scania. And growth is concentrated in Malmö, which received
Danish citizens in Scania1 January
2000Growth
2000–20111 January
2012Percentage of
population 1 .1 .2012
Danish citizens in total 9,588 15,529 25,117 2.0
Percentage breakdownSouthwest Scania 47 78 66 2.6 Malmö 25 64 49 4.1 Rest of southwest Scania 21 14 17 1.2northwest Scania 39 14 24 1.9northeast Scania 8 4 6 0.8Southeast Scania 6 3 4 1.2
Source: Ørestat.
1According to an earlier report from Region Scania, approximately 75 per cent of all Danes born in Scania are Danish citizens, which is equivalent to the fact that there should be around 32,000 Danes currently settled in Scania.
ACCEssIBIlItY AnD MoBIlItY | M i G R AT i o n
77Øresund Trends 2012
64 per cent of Scania's net increase of Danes. The rest of southwest Scania has had a relatively small increase in Danes. Also, in northeast and southeast Scania, where Danish settlement was already modest, the growth in Danish settlers has been even more limited. In 2012, half of Scania’s 25,000 Danish citizens were in Malmö and represented 4 per cent of the population. Other municipalities in Scania with 3–4 per cent Danes are Bjuv, Örkelljunga and Klippan, while Kris-tianstad with only 0.3 per cent Danish nationals is the city that has the smallest population of Danes.
Future migration patterns
When the Øresund Bridge opened in 2000, the increasing number of migra-tions across the Øresund was an expres-sion of emerging integration of Dan-ish and Swedish parts of the Øresund Region. Relocations, particularly in re-spect of Copenhageners, were part of a
pattern that started with movement away from rapidly rising house prices, where there was good and affordable housing and at a distance, which meant that they could keep their attractive and high-ly paid jobs on the Danish side of the Øresund.
Moving to another country can be an ex-citing challenge, but it can also be costly in terms of cultural and linguistic hurdles and barriers to establishing new networks – perhaps at the expense of old networks and family. After a few years, many Danes decide, therefore, to move back to where they came from, partly because the children have reached school age. Others move back because the Danish housing market has become more accessible after the years of high prices, or because many lost their jobs in Denmark after the fi-nancial crisis and have been unemployed.
Future migration patterns will be influ-enced by developments in an uncertain housing market, a labour market with high unemployment, and by the fact that the economic situation, all things be-ing equal, has been more favourable to the Swedish than the Danish side of the Øresund. Will it still be advantageous to settle in Malmö in terms of housing prices, travel costs and travel distance? Will relocations still be linked closely to commuting back to a well-paid job in Copenhagen, or will more Danes move both home and work to Scania and thus become more and permanently integrat-ed in the Scania side?
Likewise, the future will show whether any of the over 7,000 Scanians, who cur-rently commute to a job on the Danish side, will settle closer to their work. Will they be able to come to adjust to the Dan-ish housing market after the house price falls in Copenhagen and Zealand?
ACCEssIBIlItY AnD MoBIlItY | M i G R AT i o n
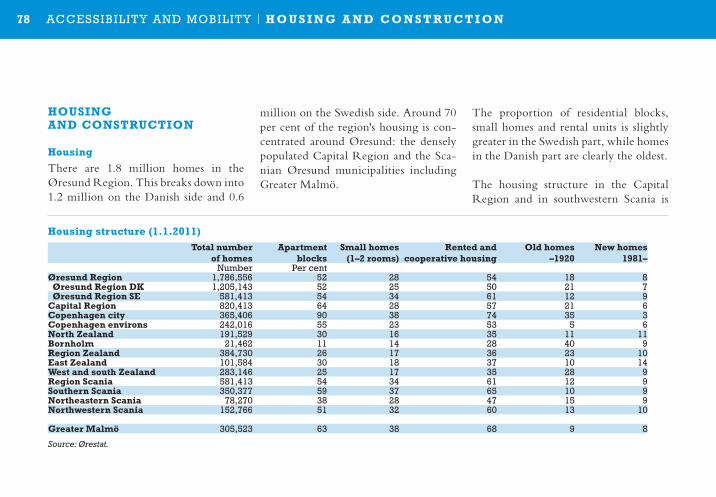
78 Øresund Trends 2012
hoUSinG AnD ConSTRUCTion
housing
There are 1.8 million homes in the Øresund Region. This breaks down into 1.2 million on the Danish side and 0.6
million on the Swedish side. Around 70 per cent of the region's housing is con-centrated around Øresund: the densely populated Capital Region and the Sca-nian Øresund municipalities including Greater Malmö.
The proportion of residential blocks, small homes and rental units is slightly greater in the Swedish part, while homes in the Danish part are clearly the oldest.
The housing structure in the Capital Region and in southwestern Scania is
ACCEssIBIlItY AnD MoBIlItY | h o U S i n G A n D C o n S T R U C T i o n
housing structure (1 .1 .2011)Total number
of homesApartment
blocksSmall homes
(1–2 rooms)Rented and
cooperative housingold homes
–1920 new homes
1981–number Per cent
Øresund Region 1,786,556 52 28 54 18 8 Øresund Region DK 1,205,143 52 25 50 21 7 Øresund Region SE 581,413 54 34 61 12 9Capital Region 820,413 64 28 57 21 6Copenhagen city 365,406 90 38 74 35 3Copenhagen environs 242,016 55 23 53 5 6north Zealand 191,529 30 16 35 11 11Bornholm 21,462 11 14 28 40 9Region Zealand 384,730 26 17 36 23 10East Zealand 101,584 30 18 37 10 14West and south Zealand 283,146 25 17 35 28 9Region Scania 581,413 54 34 61 12 9Southern Scania 350,377 59 37 65 10 9northeastern Scania 78,270 38 28 47 15 9northwestern Scania 152,766 51 32 60 13 10
Greater Malmö 305,523 63 38 68 9 8
Source: Ørestat.
79Øresund Trends 2012
similar with a large proportion of small apartment blocks. This is particular-ly apparent in the centre municipali-ties, Copenhagen and Greater Malmö. Both cities are dominated by apartment blocks, where 38 per cent of the homes have 1–2 rooms, and the vast majority are rental units. More than half of the Øresund Region’s small dwellings are located in Copenhagen and Greater Malmö.
The houses in the centres of the region are also old, especially in Copenhagen, where more than 126,000, or one in three was built before 1921. The vast majority of these homes have been refurbished of course but, despite extensive urban reno-vation and improvements, there are many older homes in Copenhagen that are still in a poor condition. 35,000 – or 12 per cent – are missing at least one of the mod-ern amenities such as shower, toilet, dis-trict or central heating.
The other parts of Zealand and Scan-ia outside of Copenhagen and Greater Malmö are characterised by the oppo-site of the inner cities: not multi-sto-rey buildings, but a large proportion of homes with gardens (individual fami-ly houses, terraced houses, etc.). This is especially true of Region Zealand, north Zealand, Bornholm and north-east Scania. These have larger homes in the main, with three bedrooms or more, and owner-occupied housing is far more prevalent. Outside the densely populated areas, there are relatively few apartment buildings, small homes and rental units, but they do occur slightly more often in Scania than in Zealand and the islands. The old houses are mostly found in the centre of the region and the periphery.
Residential construction
In the early 1990s, there was a large in-crease in the number of homes in Sca-nia, while it was extremely low on the
Danish side of the Øresund. For a long period from the mid-1990s until 2003, there was an increase of only around 5,000–8,000 homes (including dem-olitions) becoming available annually across the Øresund Region. The Danish situation was partly the result of many groupings of very small homes in and around Copenhagen, the demolition of outdated housing and a very low level of activity for new housing. The same trend characterised the 1980s.
In 2004, there was an almost explosive growth in residential construction not only in and around Copenhagen, but also in the Capital Region and Region Zealand. This development should be seen in conjunction with the improved economic conditions in Denmark, as the capital in particular was boosted by the expansion of port areas and the construction of a new district, Ørestad. The new-build escalation should also be
ACCEssIBIlItY AnD MoBIlItY | h o U S i n G A n D C o n S T R U C T i o n
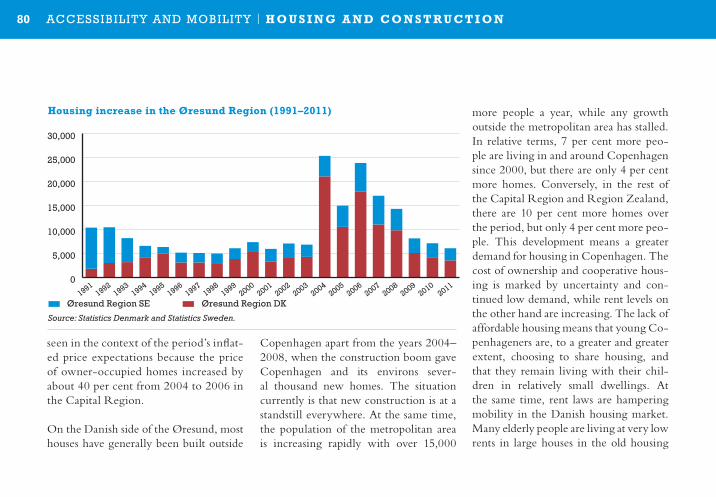
80 Øresund Trends 2012
seen in the context of the period’s inflat-ed price expectations because the price of owner-occupied homes increased by about 40 per cent from 2004 to 2006 in the Capital Region.
On the Danish side of the Øresund, most houses have generally been built outside
Copenhagen apart from the years 2004–2008, when the construction boom gave Copenhagen and its environs sever-al thousand new homes. The situation currently is that new construction is at a standstill everywhere. At the same time, the population of the metropolitan area is increasing rapidly with over 15,000
more people a year, while any growth outside the metropolitan area has stalled. In relative terms, 7 per cent more peo-ple are living in and around Copenhagen since 2000, but there are only 4 per cent more homes. Conversely, in the rest of the Capital Region and Region Zealand, there are 10 per cent more homes over the period, but only 4 per cent more peo-ple. This development means a greater demand for housing in Copenhagen. The cost of ownership and cooperative hous-ing is marked by uncertainty and con-tinued low demand, while rent levels on the other hand are increasing. The lack of affordable housing means that young Co-penhageners are, to a greater and greater extent, choosing to share housing, and that they remain living with their chil-dren in relatively small dwellings. At the same time, rent laws are hampering mobility in the Danish housing market. Many elderly people are living at very low rents in large houses in the old housing
Øresund Region SE Øresund Region DK
Øresund Region SE Øresund Region DK
Rest of Capital RegionRegion Zealand Southwestern Scania Rest of Scania
0
5,000
10,000
15,000
20,000
25,000
30,000
2000 2001
2002 2003
2004 2005
2006 2007
2008 2009
2010 2011
1991 1992
1993 1994
1995 1996
1997 1998
1999
-5,000
0
5,000
10,000
15,000
20,000
-5,000
0
5,000
10,000
15,000
20,000
Increase in the number of homes
Number Number
Growth in population Increase in the number of homes
Growth in population
1990-
19941995
-1999
2000-
20042005
-2009
2010 1990-
19941995
-1999
2000-
20042005
-2009
2010 2011
0
5
10
15
20
25
30
1 room 2 rooms 3 rooms 4 rooms 5 rooms
1990-
19941995
-1999
2000-
20042005
-2009
2010 1990-
19941995
-1999
2000-
20042005
-2009
2010 2011
Copenhagen city and its environs
housing increase in the Øresund Region (1991–2011)
Source: Statistics Denmark and Statistics Sweden.
ACCEssIBIlItY AnD MoBIlItY | h o U S i n G A n D C o n S T R U C T i o n
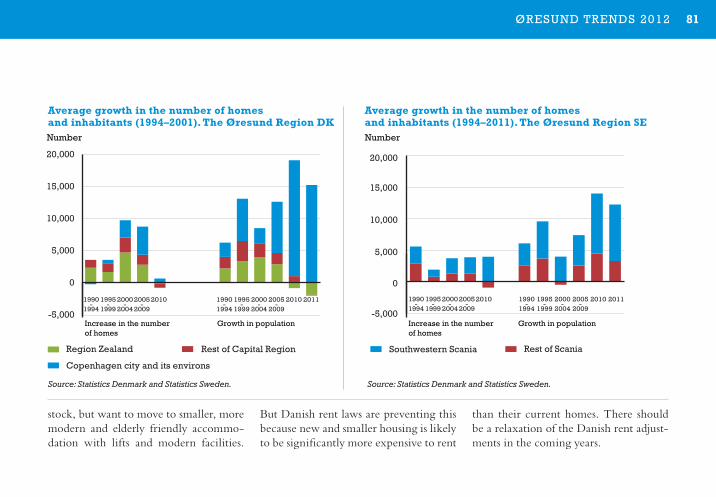
81Øresund Trends 2012
than their current homes. There should be a relaxation of the Danish rent adjust-ments in the coming years.
stock, but want to move to smaller, more modern and elderly friendly accommo-dation with lifts and modern facilities.
Øresund Region SE Øresund Region DK
Øresund Region SE Øresund Region DK
Rest of Capital RegionRegion Zealand Southwestern Scania Rest of Scania
0
5,000
10,000
15,000
20,000
25,000
30,000
2000 2001
2002 2003
2004 2005
2006 2007
2008 2009
2010 2011
1991 1992
1993 1994
1995 1996
1997 1998
1999
-5,000
0
5,000
10,000
15,000
20,000
-5,000
0
5,000
10,000
15,000
20,000
Increase in the number of homes
Number Number
Growth in population Increase in the number of homes
Growth in population
1990-
19941995
-1999
2000-
20042005
-2009
2010 1990-
19941995
-1999
2000-
20042005
-2009
2010 2011
0
5
10
15
20
25
30
1 room 2 rooms 3 rooms 4 rooms 5 rooms
1990-
19941995
-1999
2000-
20042005
-2009
2010 1990-
19941995
-1999
2000-
20042005
-2009
2010 2011
Copenhagen city and its environs
But Danish rent laws are preventing this because new and smaller housing is likely to be significantly more expensive to rent
Average growth in the number of homes and inhabitants (1994–2011) . The Øresund Region SE
Average growth in the number of homes and inhabitants (1994–2001) . The Øresund Region DK
Source: Statistics Denmark and Statistics Sweden. Source: Statistics Denmark and Statistics Sweden.
ACCEssIBIlItY AnD MoBIlItY | h o U S i n G A n D C o n S T R U C T i o n
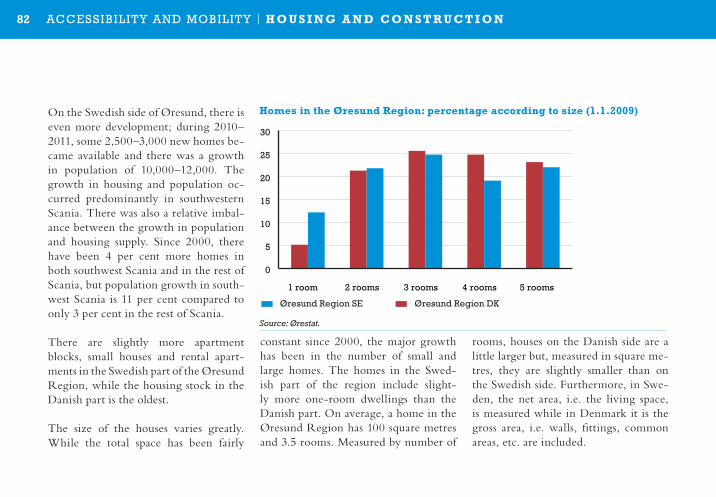
82 Øresund Trends 2012
On the Swedish side of Øresund, there is even more development; during 2010–2011, some 2,500–3,000 new homes be-came available and there was a growth in population of 10,000–12,000. The growth in housing and population oc-curred predominantly in southwestern Scania. There was also a relative imbal-ance between the growth in population and housing supply. Since 2000, there have been 4 per cent more homes in both southwest Scania and in the rest of Scania, but population growth in south-west Scania is 11 per cent compared to only 3 per cent in the rest of Scania.
There are slightly more apartment blocks, small houses and rental apart-ments in the Swedish part of the Øresund Region, while the housing stock in the Danish part is the oldest.
The size of the houses varies greatly. While the total space has been fairly
constant since 2000, the major growth has been in the number of small and large homes. The homes in the Swed-ish part of the region include slight-ly more one-room dwellings than the Danish part. On average, a home in the Øresund Region has 100 square metres and 3.5 rooms. Measured by number of
figur: Gennemsnitlig vækst i antal boliger og indbyggere Øresund Region DK (1994-2011)
fil: boliger i Øresund Region.pdf
80x67
rooms, houses on the Danish side are a little larger but, measured in square me-tres, they are slightly smaller than on the Swedish side. Furthermore, in Swe-den, the net area, i.e. the living space, is measured while in Denmark it is the gross area, i.e. walls, fittings, common areas, etc. are included.
Øresund Region SE Øresund Region DK
Øresund Region SE Øresund Region DK
Rest of Capital RegionRegion Zealand Southwestern Scania Rest of Scania
0
5,000
10,000
15,000
20,000
25,000
30,000
2000 2001
2002 2003
2004 2005
2006 2007
2008 2009
2010 2011
1991 1992
1993 1994
1995 1996
1997 1998
1999
-5,000
0
5,000
10,000
15,000
20,000
-5,000
0
5,000
10,000
15,000
20,000
Increase in the number of homes
Number Number
Growth in population Increase in the number of homes
Growth in population
1990-
19941995
-1999
2000-
20042005
-2009
2010 1990-
19941995
-1999
2000-
20042005
-2009
2010 2011
0
5
10
15
20
25
30
1 room 2 rooms 3 rooms 4 rooms 5 rooms
1990-
19941995
-1999
2000-
20042005
-2009
2010 1990-
19941995
-1999
2000-
20042005
-2009
2010 2011
Copenhagen city and its environs
homes in the Øresund Region: percentage according to size (1 .1 .2009)
Source: Ørestat.
ACCEssIBIlItY AnD MoBIlItY | h o U S i n G A n D C o n S T R U C T i o n
83Øresund Trends 2012
In relation to the population size, the number of homes available is roughly equal on both sides of the sound
Future housing needsA number of questions can arise for future developments in the housing market. However, the major challenge is the prevailing shortage of accommo-dation at a reasonable price, whether it is owned or rented. The public servants for large conurbations, such as teachers, police officers, medical secretaries and
Property calculationsHousing figures include only homes that are purpose-built as all-year-round dwellings. Dormitories, residential institutions, as well as holiday homes and second homes used for year-round hab-itation, are not included in the calculation. Housing figures include all dwellings, whether occupied or not. the Danish housing data is based on regular reports to the Building and Housing Register, while the swedish data is based on a more uncertain annual update from the Population and Housing Census 1990 (FoB90).
Different forms of ownership in the two countries impede a direct comparison of the ownership structure across Øresund.
In Denmark, cooperative housing in private cooperative housing associations is considered as rented accommodation, while own-er-occupied apartments are counted as owned housing (although they may be sublet). the breakdown by housing structure and number of rooms is based on inhabited dwellings for the Danish data.
In sweden, homes with 'hyresrätt' (a form of cooperative housing) are included as rented accommodation, while apartments with 'bostadsrätt' are considered as owner-occupied housing.
Property availability includes housing calculated as net growth in housing stock, i.e. the reported completed constructions less demolitions and housing mergers.
nurses, must be able to stay close to town and at a reasonable price. At the same time, urban densification and new hous-ing close to workplaces contribute to a lower environmental and CO2 impact1. Also, flexibility in purpose and design of dwellings contributes to flexible supply relative to demand from various popu-lation groups, such as young people and
1See both Assessment and Recommendations, OECD Copenhagen Review, 2009, and Bostadsläget i Öresundsregionen, Slutrapport, Skåne Län, 2009.
retirees, and their mobility. The social cohesion of neighbourhoods can be strengthened through joint ownership and housing design. Finally, future cli-mate initiatives are that new buildings must be energy neutral and that the ex-isting housing stock must be insulated and increasingly supplied with energy from renewable sources.
ACCEssIBIlItY AnD MoBIlItY | h o U S i n G A n D C o n S T R U C T i o n
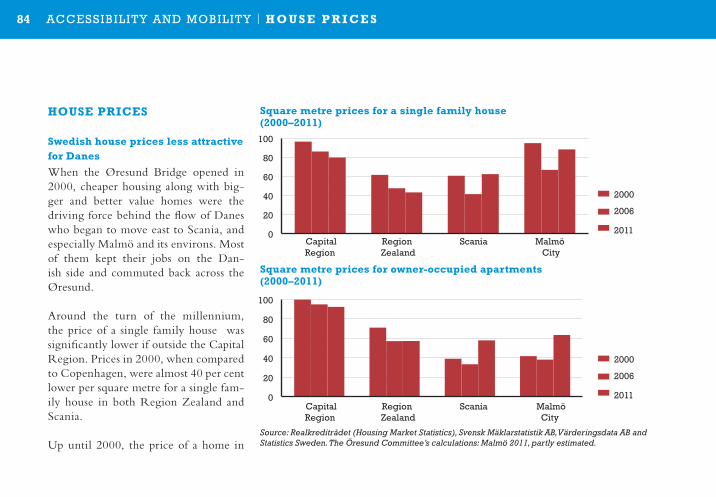
84 Øresund Trends 2012
hoUSE PRiCES
Swedish house prices less attractive for Danes
When the Øresund Bridge opened in 2000, cheaper housing along with big-ger and better value homes were the driving force behind the flow of Danes who began to move east to Scania, and especially Malmö and its environs. Most of them kept their jobs on the Dan-ish side and commuted back across the Øresund.
Around the turn of the millennium, the price of a single family house was significantly lower if outside the Capital Region. Prices in 2000, when compared to Copenhagen, were almost 40 per cent lower per square metre for a single fam-ily house in both Region Zealand and Scania.
Up until 2000, the price of a home in
0
20
40
60
80
100
Capital Region
Region Zealand
Scania Malmö City
2000
2006
2011
Capital Region
Region Zealand
Scania MalmöCity
2000
2006
2011 0
20
40
60
80
100
60
70
80
90
100
1996 1998 2000 2002 2004 2006 2008 2010
Copenhagen City Capital Region Region Zealand Malmö City Region Scania
-96 -98 -00 -02 -04 -06 -08 -10 -11 -96 -98 -00 -02 -04 -06 -08 -10 -11
0 500
1,000 1,500 2,000 2,500 3,000 3,500 4,000 4,500 5,000
0 500
1,000 1,500 2,000 2,500 3,000 3,500 4,000 4,500
ACCEssIBIlItY AnD MoBIlItY | h o U S E P R i C E S
Square metre prices for a single family house (2000–2011)
Source: Realkreditrådet (Housing Market Statistics), Svensk Mäklarstatistik AB, Värderingsdata AB and Statistics Sweden. The Öresund Committee’s calculations: Malmö 2011, partly estimated.
Square metre prices for owner-occupied apartments (2000–2011)
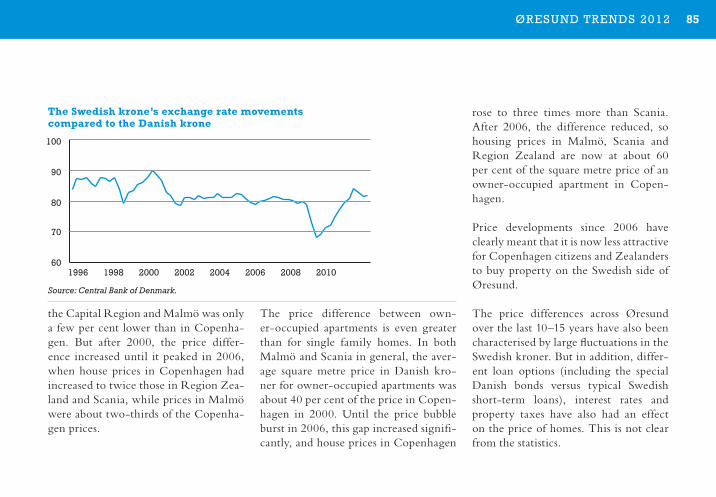
85Øresund Trends 2012
the Capital Region and Malmö was only a few per cent lower than in Copenha-gen. But after 2000, the price differ-ence increased until it peaked in 2006, when house prices in Copenhagen had increased to twice those in Region Zea-land and Scania, while prices in Malmö were about two-thirds of the Copenha-gen prices.
The price difference between own-er-occupied apartments is even greater than for single family homes. In both Malmö and Scania in general, the aver-age square metre price in Danish kro-ner for owner-occupied apartments was about 40 per cent of the price in Copen-hagen in 2000. Until the price bubble burst in 2006, this gap increased signifi-cantly, and house prices in Copenhagen
rose to three times more than Scania. After 2006, the difference reduced, so housing prices in Malmö, Scania and Region Zealand are now at about 60 per cent of the square metre price of an owner-occupied apartment in Copen-hagen.
Price developments since 2006 have clearly meant that it is now less attractive for Copenhagen citizens and Zealanders to buy property on the Swedish side of Øresund.
The price differences across Øresund over the last 10–15 years have also been characterised by large fluctuations in the Swedish kroner. But in addition, differ-ent loan options (including the special Danish bonds versus typical Swedish short-term loans), interest rates and property taxes have also had an effect on the price of homes. This is not clear from the statistics.
0
20
40
60
80
100
Capital Region
Region Zealand
Scania Malmö City
2000
2006
2011
Capital Region
Region Zealand
Scania MalmöCity
2000
2006
2011 0
20
40
60
80
100
60
70
80
90
100
1996 1998 2000 2002 2004 2006 2008 2010
Copenhagen City Capital Region Region Zealand Malmö City Region Scania
-96 -98 -00 -02 -04 -06 -08 -10 -11 -96 -98 -00 -02 -04 -06 -08 -10 -11
0 500
1,000 1,500 2,000 2,500 3,000 3,500 4,000 4,500 5,000
0 500
1,000 1,500 2,000 2,500 3,000 3,500 4,000 4,500
The Swedish krone’s exchange rate movements compared to the Danish krone
Source: Central Bank of Denmark.
ACCEssIBIlItY AnD MoBIlItY | h o U S E P R i C E S
86 Øresund Trends 2012
Price increases after the housing price bubble
The property price bubble was a Danish phenomenon with an overheated hous-ing market, which peaked in 2006 and was particularly marked in Copenhagen and the Capital Region. For instance, the square metre price for owner-occu-pied apartments in Copenhagen grew by 40 per cent in 2005 alone. One contrib-utor in particular to the significant in-creases in house prices was the introduc-tion of the interest-only mortgage with a flexible interest rate adjustment, which was introduced in 2003, when short-term interest rates were historically low.
After the price bubble burst, Danish house prices declined significantly, es-pecially in the metropolitan area and during the years 2006–2008. This was until 2010–2011 when prices stabilised in general and the price of an owner-oc-cupied home slightly increased; but then
there was another fall through 2011. The negative growth has hit Region Zealand hard but, in general, Danish prices are back to the level of 2004–2005. Com-pared to 2000, the price rises have been highest in Copenhagen, where single family homes increased by 81 per cent and owner-occupied apartments by 70 per cent. Both types of housing in-creased by only 35 per cent in Region Zealand over the same period.
In Scania, the average square metre price for housing has more than dou-bled compared to 2000, and the price of owner-occupied apartments especially has caught up with the Danish prices. In Malmö, there has been a tripling of the price of owner-occupied apartments alone. Prices in Sweden have increased steadily, have avoided the price bubble that hit Denmark and have only been interrupted by a temporary fall in late 2008. In Scania, however, prices stag-
nated to some extent over the last few years in relation to the general contin-ued price increases in Sweden.
Residential property turnover
The level of property supply and home sales give a good indicator of price lev-els.
In Scania, the volume of home sales has been stable for several years, and there has been a substantial turnover of own-er-occupied apartments over the period 2009–2011.
Although prices on the Danish side of Øresund are back at 2004–2005 lev-els, the stagnant housing market is in a completely different situation to that in Sweden. In 2004, 30,000 owner-oc-cupied homes were sold, but there were only 10,000 homes for sale at any one time. In contrast, only 17,000 homes were sold in 2011 but 21,000 were
ACCEssIBIlItY AnD MoBIlItY | h o U S E P R i C E S
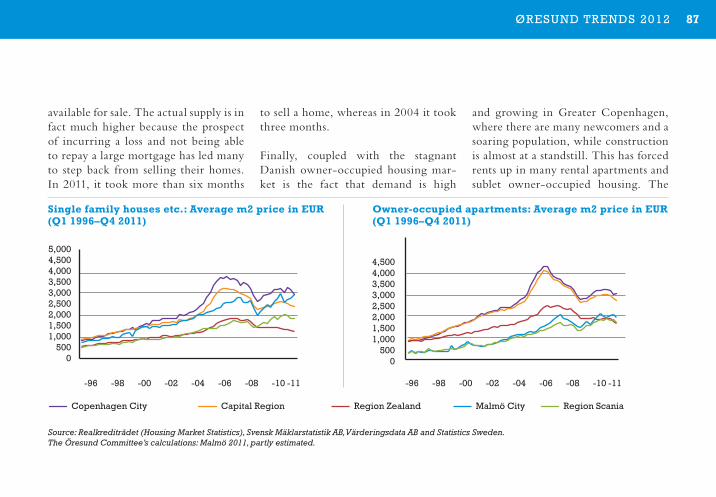
87Øresund Trends 2012
0
20
40
60
80
100
Capital Region
Region Zealand
Scania Malmö City
2000
2006
2011
Capital Region
Region Zealand
Scania MalmöCity
2000
2006
2011 0
20
40
60
80
100
60
70
80
90
100
1996 1998 2000 2002 2004 2006 2008 2010
Copenhagen City Capital Region Region Zealand Malmö City Region Scania
-96 -98 -00 -02 -04 -06 -08 -10 -11 -96 -98 -00 -02 -04 -06 -08 -10 -11
0 500
1,000 1,500 2,000 2,500 3,000 3,500 4,000 4,500 5,000
0 500
1,000 1,500 2,000 2,500 3,000 3,500 4,000 4,500
available for sale. The actual supply is in fact much higher because the prospect of incurring a loss and not being able to repay a large mortgage has led many to step back from selling their homes. In 2011, it took more than six months
to sell a home, whereas in 2004 it took three months.
Finally, coupled with the stagnant Danish owner-occupied housing mar-ket is the fact that demand is high
and growing in Greater Copenhagen, where there are many newcomers and a soaring population, while construction is almost at a standstill. This has forced rents up in many rental apartments and sublet owner-occupied housing. The
Source: Realkreditrådet (Housing Market Statistics), Svensk Mäklarstatistik AB, Värderingsdata AB and Statistics Sweden. The Öresund Committee’s calculations: Malmö 2011, partly estimated.
Single family houses etc .: Average m2 price in EUR (Q1 1996–Q4 2011)
owner-occupied apartments: Average m2 price in EUR (Q1 1996–Q4 2011)
ACCEssIBIlItY AnD MoBIlItY | h o U S E P R i C E S
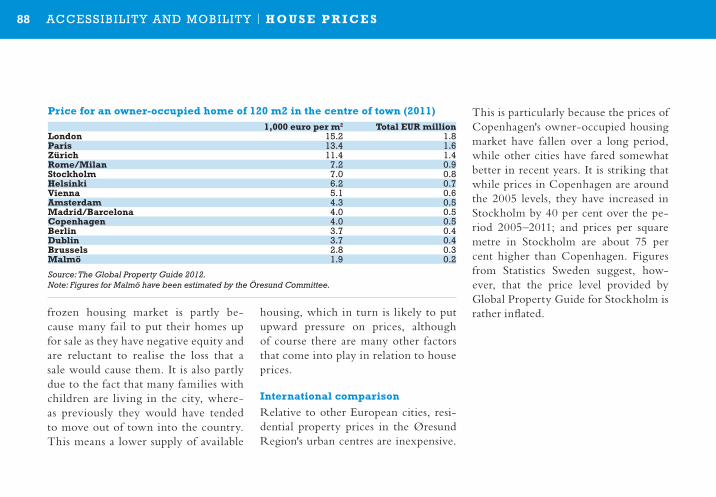
88 Øresund Trends 2012
frozen housing market is partly be-cause many fail to put their homes up for sale as they have negative equity and are reluctant to realise the loss that a sale would cause them. It is also partly due to the fact that many families with children are living in the city, where-as previously they would have tended to move out of town into the country. This means a lower supply of available
housing, which in turn is likely to put upward pressure on prices, although of course there are many other factors that come into play in relation to house prices.
international comparison
Relative to other European cities, resi-dential property prices in the Øresund Region's urban centres are inexpensive.
This is particularly because the prices of Copenhagen's owner-occupied housing market have fallen over a long period, while other cities have fared somewhat better in recent years. It is striking that while prices in Copenhagen are around the 2005 levels, they have increased in Stockholm by 40 per cent over the pe-riod 2005–2011; and prices per square metre in Stockholm are about 75 per cent higher than Copenhagen. Figures from Statistics Sweden suggest, how-ever, that the price level provided by Global Property Guide for Stockholm is rather inflated.
Price for an owner-occupied home of 120 m2 in the centre of town (2011) 1,000 euro per m2 Total EUR millionLondon 15.2 1.8Paris 13.4 1.6Zürich 11.4 1.4Rome/Milan 7.2 0.9Stockholm 7.0 0.8helsinki 6.2 0.7vienna 5.1 0.6Amsterdam 4.3 0.5Madrid/Barcelona 4.0 0.5Copenhagen 4.0 0.5Berlin 3.7 0.4Dublin 3.7 0.4Brussels 2.8 0.3Malmö 1.9 0.2
Source: The Global Property Guide 2012.Note: Figures for Malmö have been estimated by the Öresund Committee.
ACCEssIBIlItY AnD MoBIlItY | h o U S E P R i C E S
89Øresund Trends 2012
owner-occupied housing
• Singlefamilyhouses:inDenmarktheseinclude: patrician villas, detached houses, semi-detached houses and terraced-family homes and farmhouses. In sweden these include småhus (small houses).
• Owner-occupiedapartments:inDenmark, these homes are typically found in an apartment building that is subdivided into individual ownerships. In sweden, it includes homes with a bostadsrätt, which is in some ways similar to a Danish owner-occupied apartment, but not quite. An apartment with bostadsrätt means shared owner-ship in an apartment building through an owners’ association.
Cooperative housing / hyresrätt
Cooperative housing in Denmark and homes with hyresrätt in sweden mean a joint ownership with the right to occupy a dwelling in a housing association, but these types of housing are regarded as rental units and are not covered by sys-tematic price statistics.
ACCEssIBIlItY AnD MoBIlItY | h o U S E P R i C E S
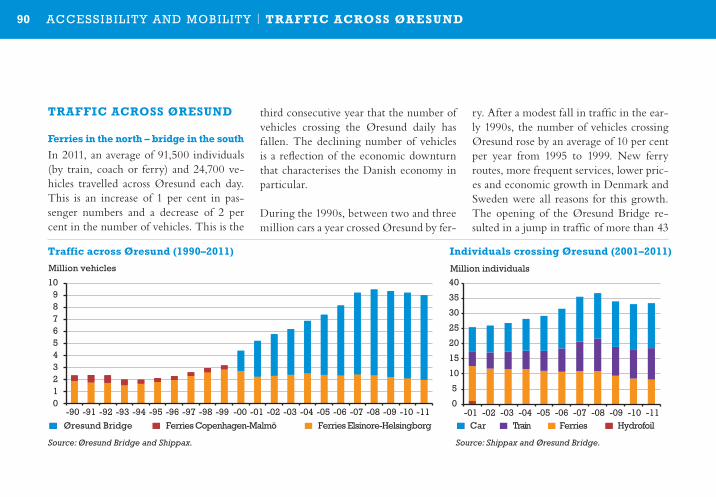
90 Øresund Trends 2012ACCEssIBIlItY AnD MoBIlItY | TRAFFiC ACRoSS ØRESUnD
TRAFFiC ACRoSS ØRESUnD
Ferries in the north – bridge in the south
In 2011, an average of 91,500 individuals (by train, coach or ferry) and 24,700 ve-hicles travelled across Øresund each day. This is an increase of 1 per cent in pas-senger numbers and a decrease of 2 per cent in the number of vehicles. This is the
third consecutive year that the number of vehicles crossing the Øresund daily has fallen. The declining number of vehicles is a reflection of the economic downturn that characterises the Danish economy in particular.
During the 1990s, between two and three million cars a year crossed Øresund by fer-
ry. After a modest fall in traffic in the ear-ly 1990s, the number of vehicles crossing Øresund rose by an average of 10 per cent per year from 1995 to 1999. New ferry routes, more frequent services, lower pric-es and economic growth in Denmark and Sweden were all reasons for this growth. The opening of the Øresund Bridge re-sulted in a jump in traffic of more than 43
0
5,000
10,000
15,000
20,000
25,000
30,000
35,000
0 5 10 15 20 25 30 35 40 45 50 55 60 65 70 75 80 85 90 95
Number
Age
Capital Region 2011/2012
Forecast Capital Region 2031/2032
Scania 2011/2012
Forecast Scania 2031/2032
Region Zealand 2011/2012
Forecast Region Zealand2031/2032
0.0 0.5 1.0 1.5 2.0 2.5 3.0 3.5 4.0 4.5 5.0
Capita
l
Region
Region
Zeal
and
Scan
ia
Stock
holm
County
Denmar
k
Sweden
0 1 2 3 4 5 6 7 8 9
10
-90 -91 -92 -93 -94 -95 -96 -97 -98 -99 -00 -01 -02 -03 -04 -05 -06 -07 -08 -09 -10 -11
Million vehicles
Øresund Bridge Ferries Copenhagen-Malmö Ferries Elsinore-Helsingborg
0
5
10
15
20
25
30
35
40
-01 -02 -03 -04 -05 -06 -07 -08 -09 -10 -11
Million individuals
Car Train Ferries Hydrofoil
0102030405060708090
100
Car Landing Car TrainHH Ferries The Øresund Bridge
Total
Holiday
Mini-break
Leisure
Business
Commuting to place of study
Commuting to place of work
Per cent
0%
2%
4%
6%
8%
10%
12%
14%
16%
18%
20%
0
500,000
1,000,000
1,500,000
2,000,000
2,500,000
3,000,000
3,500,000
4,000,000
4,500,000
2000 2001 2002 2003 2004 2005 2006 2007 2008 2009 2010 2011
Books, newspapers and magazines
Architectural business
Design, photography and translation
Theatre, concerts, artistic creation
Libraries and archives
Museums and cultural heritage collections
Film, video, TV, radio and press
Source: Øresund Bridge and Shippax. Source: Shippax and Øresund Bridge.
Traffic across Øresund (1990–2011) individuals crossing Øresund (2001–2011)
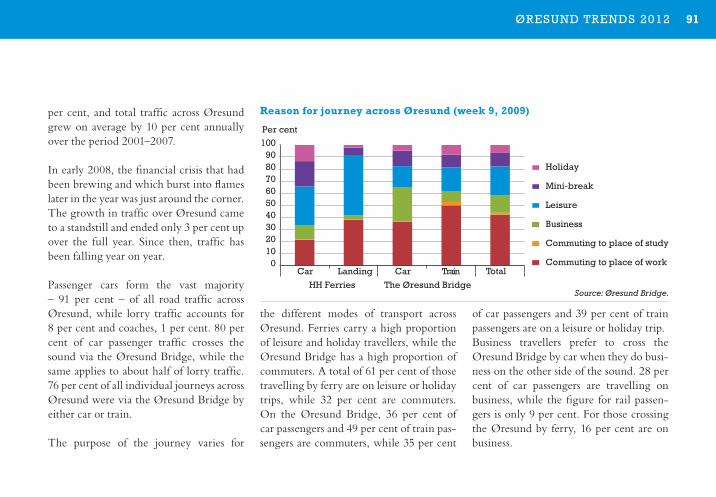
91Øresund Trends 2012
per cent, and total traffic across Øresund grew on average by 10 per cent annually over the period 2001–2007.
In early 2008, the financial crisis that had been brewing and which burst into flames later in the year was just around the corner. The growth in traffic over Øresund came to a standstill and ended only 3 per cent up over the full year. Since then, traffic has been falling year on year.
Passenger cars form the vast majority – 91 per cent – of all road traffic across Øresund, while lorry traffic accounts for 8 per cent and coaches, 1 per cent. 80 per cent of car passenger traffic crosses the sound via the Øresund Bridge, while the same applies to about half of lorry traffic. 76 per cent of all individual journeys across Øresund were via the Øresund Bridge by either car or train.
The purpose of the journey varies for
the different modes of transport across Øresund. Ferries carry a high proportion of leisure and holiday travellers, while the Øresund Bridge has a high proportion of commuters. A total of 61 per cent of those travelling by ferry are on leisure or holiday trips, while 32 per cent are commuters. On the Øresund Bridge, 36 per cent of car passengers and 49 per cent of train pas-sengers are commuters, while 35 per cent
of car passengers and 39 per cent of train passengers are on a leisure or holiday trip.Business travellers prefer to cross the Øresund Bridge by car when they do busi-ness on the other side of the sound. 28 per cent of car passengers are travelling on business, while the figure for rail passen-gers is only 9 per cent. For those crossing the Øresund by ferry, 16 per cent are on business.
0
5,000
10,000
15,000
20,000
25,000
30,000
35,000
0 5 10 15 20 25 30 35 40 45 50 55 60 65 70 75 80 85 90 95
Number
Age
Capital Region 2011/2012
Forecast Capital Region 2031/2032
Scania 2011/2012
Forecast Scania 2031/2032
Region Zealand 2011/2012
Forecast Region Zealand2031/2032
0.0 0.5 1.0 1.5 2.0 2.5 3.0 3.5 4.0 4.5 5.0
Capita
l
Region
Region
Zeal
and
Scan
ia
Stock
holm
County
Denmar
k
Sweden
0 1 2 3 4 5 6 7 8 9
10
-90 -91 -92 -93 -94 -95 -96 -97 -98 -99 -00 -01 -02 -03 -04 -05 -06 -07 -08 -09 -10 -11
Million vehicles
Øresund Bridge Ferries Copenhagen-Malmö Ferries Elsinore-Helsingborg
0
5
10
15
20
25
30
35
40
-01 -02 -03 -04 -05 -06 -07 -08 -09 -10 -11
Million individuals
Car Train Ferries Hydrofoil
0102030405060708090
100
Car Landing Car TrainHH Ferries The Øresund Bridge
Total
Holiday
Mini-break
Leisure
Business
Commuting to place of study
Commuting to place of work
Per cent
0%
2%
4%
6%
8%
10%
12%
14%
16%
18%
20%
0
500,000
1,000,000
1,500,000
2,000,000
2,500,000
3,000,000
3,500,000
4,000,000
4,500,000
2000 2001 2002 2003 2004 2005 2006 2007 2008 2009 2010 2011
Books, newspapers and magazines
Architectural business
Design, photography and translation
Theatre, concerts, artistic creation
Libraries and archives
Museums and cultural heritage collections
Film, video, TV, radio and press
Reason for journey across Øresund (week 9, 2009)
Source: Øresund Bridge.
ACCEssIBIlItY AnD MoBIlItY | TRAFFiC ACRoSS ØRESUnD
Source: Shippax and Øresund Bridge.
92 Øresund Trends 2012
Traffic across the Øresund Bridge
230 million people have crossed the Øresund Bridge either by train or car since it opened in 2000 –141 million by car and the remaining 89 million by train. The 141 million travelling by car were distrib-uted over 62 million vehicles in the period 2000–2011.
Rail traffic
Between 2001 and 2011, the number of train passengers more than doubled from 4.9 million to 11.1 million. Over the same period, the number of passenger trains rose by 10 per cent. In 2011, 59,500 pas-senger trains crossed the fixed link.
The volume of goods transported by train across the Øresund Bridge increased by 114 per cent between 2001 to 2011, while the number of freight trains rose by 46 per cent. In total, 9,700 freight trains crossed the bridge in 2011.
The opening of the City Tunnel on the Swedish side of Øresund in December 2010, with two new stations in Malmö, Hyllie and Trianglen, has shortened travel time between Copenhagen and Scania by five minutes. It has also strengthened the competitiveness of the train in relation to the car as a means of transport. In 2011, the number of train passengers increased by 8 per cent, while car traffic across the bridge fell by 1 per cent.
Most of the journeys by Øresund trains are within the Øresund Region, where 90 per cent of passenger travel is regional. Four out of five train passengers live in Sweden, and only one in five in Denmark. Only a very small proportion is foreign.
Commuters dominate among the train passengers. Approximately 60 per cent of the travellers on the Øresund trains are work or study commuters. Of the
remaining 40 per cent, most are leisure travellers, while a small proportion are business and holiday travellers.
Car traffic across the Øresund Bridge
Car traffic across the Øresund Bridge fell by 1 per cent in 2011; this was primarily due to a decrease in commuter traffic. On average, a total of 19,146 vehicles per day crossed the Øresund Bridge in 2011.
Developments in car traffic across the bridge can be divided into different phas-es, which follow economic developments in the surrounding communities. From its opening in 2000 until and including 2007, the annual growth in traffic was between 10 and 17 per cent. In 2007, success was fully established in that, for the first time, traffic levels were higher than the original traffic forecasts had predicted. In 2008, the financial crisis hit, and there was an imme-diate slowdown in the growth of car traf-fic. Car traffic rose 5 per cent that year. In
ACCEssIBIlItY AnD MoBIlItY | TRAFFiC ACRoSS ØRESUnD
93Øresund Trends 2012
2009, there was zero growth in traffic and, in both 2010 and 2011, traffic decreased.All types of traffic have increased over the life of the Øresund Bridge, but particular-ly noteworthy is the development in com-muting. Commuting today constitutes 40 per cent of all passenger traffic compared with 5 per cent in 2001.
In addition to commuter traffic, car pas-senger traffic across the Øresund Bridge consists of regional business traffic, which accounts for 18 per cent of passenger car traffic, as well as holiday and leisure traf-fic, which accounts for the remaining 40 per cent of passenger car traffic on the Øresund Bridge.
The exchange rate has also left its mark on traffic across the Øresund Bridge. In 2009, when the Swedish krone fell in value as a result of the turmoil in the financial mar-kets, many Danes travelled to Scania for the low prices. Now, the trend has been
reversed, and the Swedish krone is strong-er than it ever has been over the life of the Øresund Bridge. This makes it advanta-geous for citizens residing on the Swedish side of the Øresund to cross over to Den-mark to shop.
For the second consecutive year, lorry traffic increased sharply in 2011. It grew by 9 per cent that year.
Øresund Bridge capacity
The Øresund Bridge motorway has a ca-pacity of about 4,000 cars per hour in each direction. This comes down to the capac-ity of the tunnel, which limits the number of cars on the bridge. But before any crit-ical congestion on the link occurs, there will already be congestion on access roads.
Rail traffic across the Øresund Bridge al-ternates between high frequency passenger traffic and international freight evenly dis-tributed over the day as well as occasional
passenger and equipment trains. Because of traffic diversity, scheduled traffic during rush hour is mainly restricted to about 10 trains per hour in each direction.
In Sweden, Norway and Denmark, there has been discussion on the need to focus on high-speed trains. These should, where appropriate, run to Kastrup (Copenha-gen Airport). At the same time, there is a growing need to carry freight by rail; and future population developments in the Øresund Region indicate that the Dan-ish side will have a greater need to recruit staff from the Swedish side. Overall, this will put pressure on the capacity of the Øresund Bridge rail service, and there is a need to focus on initiatives to increase capacity across Øresund. Already today, there are capacity constraints at Copenha-gen Airport, southern mainline in Scania and on the network in central Copenha-gen; and these are expected to worsen in the coming years.
ACCEssIBIlItY AnD MoBIlItY | TRAFFiC ACRoSS ØRESUnD
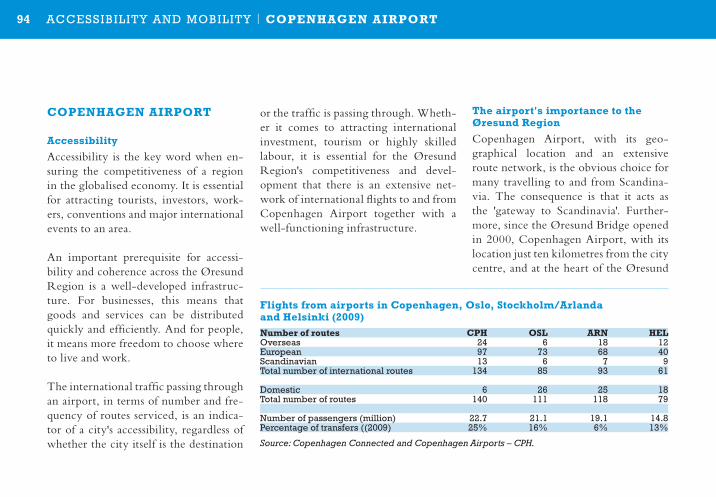
94 Øresund Trends 2012
CoPEnhAGEn AiRPoRT
Accessibility
Accessibility is the key word when en-suring the competitiveness of a region in the globalised economy. It is essential for attracting tourists, investors, work-ers, conventions and major international events to an area.
An important prerequisite for accessi-bility and coherence across the Øresund Region is a well-developed infrastruc-ture. For businesses, this means that goods and services can be distributed quickly and efficiently. And for people, it means more freedom to choose where to live and work.
The international traffic passing through an airport, in terms of number and fre-quency of routes serviced, is an indica-tor of a city's accessibility, regardless of whether the city itself is the destination
or the traffic is passing through. Wheth-er it comes to attracting international investment, tourism or highly skilled labour, it is essential for the Øresund Region's competitiveness and devel-opment that there is an extensive net-work of international flights to and from Copenhagen Airport together with a well-functioning infrastructure.
The airport's importance to the Øresund Region
Copenhagen Airport, with its geo-graphical location and an extensive route network, is the obvious choice for many travelling to and from Scandina-via. The consequence is that it acts as the 'gateway to Scandinavia'. Further-more, since the Øresund Bridge opened in 2000, Copenhagen Airport, with its location just ten kilometres from the city centre, and at the heart of the Øresund
Flights from airports in Copenhagen, oslo, Stockholm/Arlanda and helsinki (2009)number of routes CPh oSL ARn hELoverseas 24 6 18 12European 97 73 68 40scandinavian 13 6 7 9total number of international routes 134 85 93 61
Domestic 6 26 25 18total number of routes 140 111 118 79
number of passengers (million) 22.7 21.1 19.1 14.8Percentage of transfers ((2009) 25% 16% 6% 13%
Source: Copenhagen Connected and Copenhagen Airports – CPH.
ACCEssIBIlItY AnD MoBIlItY | CoPEnhAGEn AiRPoRT
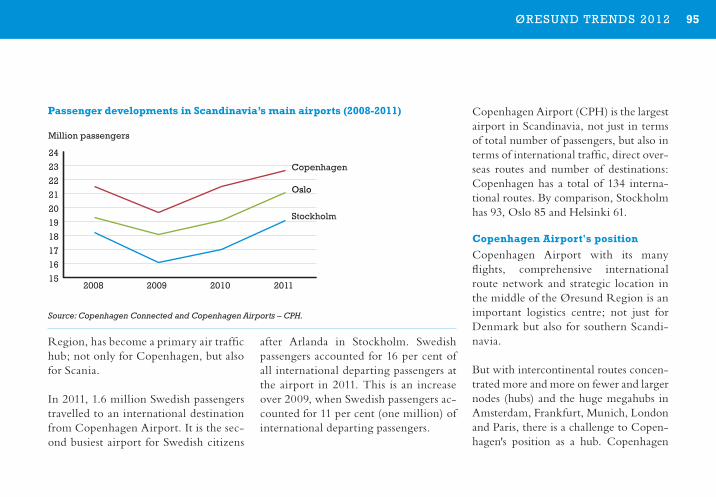
95Øresund Trends 2012
Region, has become a primary air traffic hub; not only for Copenhagen, but also for Scania.
In 2011, 1.6 million Swedish passengers travelled to an international destination from Copenhagen Airport. It is the sec-ond busiest airport for Swedish citizens
after Arlanda in Stockholm. Swedish passengers accounted for 16 per cent of all international departing passengers at the airport in 2011. This is an increase over 2009, when Swedish passengers ac-counted for 11 per cent (one million) of international departing passengers.
Copenhagen Airport (CPH) is the largest airport in Scandinavia, not just in terms of total number of passengers, but also in terms of international traffic, direct over-seas routes and number of destinations: Copenhagen has a total of 134 interna-tional routes. By comparison, Stockholm has 93, Oslo 85 and Helsinki 61.
Copenhagen Airport's position
Copenhagen Airport with its many flights, comprehensive international route network and strategic location in the middle of the Øresund Region is an important logistics centre; not just for Denmark but also for southern Scandi-navia.
But with intercontinental routes concen-trated more and more on fewer and larger nodes (hubs) and the huge megahubs in Amsterdam, Frankfurt, Munich, London and Paris, there is a challenge to Copen-hagen's position as a hub. Copenhagen
0%
2%
4%
6%
8%
10%
12%
14%
16%
18%
20%
0
500,000
1,000,000
1,500,000
2,000,000
2,500,000
3,000,000
3,500,000
4,000,000
4,500,000
Number of passengers Proportion of LCC
2000 2001 2002 2003 2004 2005 2006 2007 2008 2009 2010 2011
15
16
17
18
19
20
21
22
23
24
2008 2009 2010 2011
Million passengers
Copenhagen
Oslo
Stockholm
Passenger developments in Scandinavia’s main airports (2008-2011)
Source: Copenhagen Connected and Copenhagen Airports – CPH.
ACCEssIBIlItY AnD MoBIlItY | CoPEnhAGEn AiRPoRT
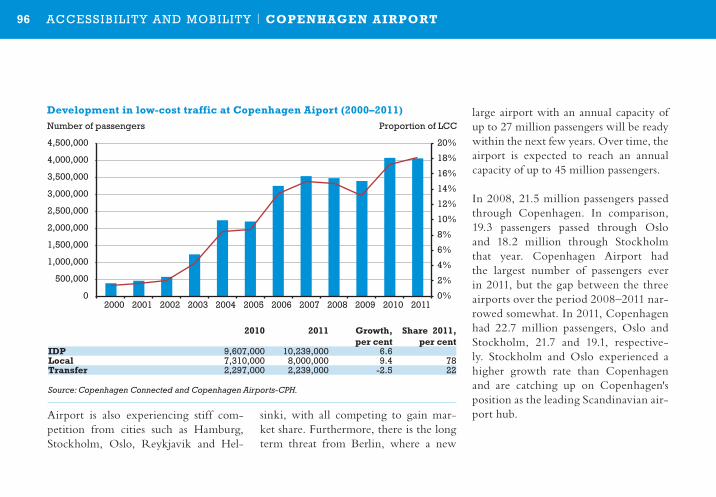
96 Øresund Trends 2012
Airport is also experiencing stiff com-petition from cities such as Hamburg, Stockholm, Oslo, Reykjavik and Hel-
sinki, with all competing to gain mar-ket share. Furthermore, there is the long term threat from Berlin, where a new
large airport with an annual capacity of up to 27 million passengers will be ready within the next few years. Over time, the airport is expected to reach an annual capacity of up to 45 million passengers.
In 2008, 21.5 million passengers passed through Copenhagen. In comparison, 19.3 passengers passed through Oslo and 18.2 million through Stockholm that year. Copenhagen Airport had the largest number of passengers ever in 2011, but the gap between the three airports over the period 2008–2011 nar-rowed somewhat. In 2011, Copenhagen had 22.7 million passengers, Oslo and Stockholm, 21.7 and 19.1, respective-ly. Stockholm and Oslo experienced a higher growth rate than Copenhagen and are catching up on Copenhagen's position as the leading Scandinavian air-port hub.
0%
2%
4%
6%
8%
10%
12%
14%
16%
18%
20%
0
500,000
1,000,000
1,500,000
2,000,000
2,500,000
3,000,000
3,500,000
4,000,000
4,500,000
Number of passengers Proportion of LCC
2000 2001 2002 2003 2004 2005 2006 2007 2008 2009 2010 2011
15
16
17
18
19
20
21
22
23
24
2008 2009 2010 2011
Million passengers
Copenhagen
Oslo
Stockholm
Development in low-cost traffic at Copenhagen Aiport (2000–2011)
Source: Copenhagen Connected and Copenhagen Airports-CPH.
2010 2011 Growth, per cent
Share 2011, per cent
iDP 9,607,000 10,239,000 6.6Local 7,310,000 8,000,000 9.4 78Transfer 2,297,000 2,239,000 -2.5 22
ACCEssIBIlItY AnD MoBIlItY | CoPEnhAGEn AiRPoRT
97Øresund Trends 2012
The proportion of low-cost traffic (LCC) is growing rapidly. In 2000, it amounted to about 3 per cent of the to-tal traffic and, by 2011, it had grown to represent about 18 per cent, equivalent to just over four million passengers an-nually. The low-cost airline EasyJet is the airport's third largest airline today.
Budget airlines are helping to create the essential accessibility, primarily from European markets, because many busi-ness people choose the cheapest alterna-tive when travelling within Europe. At the same time, low-cost carriers increase competition among airlines significantly because they have a different cost base to the traditional carriers.
More LCC routes mean that there are cheaper and more alternatives for pas-sengers travelling point-to-point in Eu-rope. In other words, traditional airlines will find it difficult to fill their planes
on the so-called feeder routes1 when flying in direct competition with low-cost carriers, because they risk losing the point-to-point traffic2, which helps to anchor a route. Thus, they risk having to reduce the number of departures on these routes. Copenhagen's position as an aviation hub thus risks being eroded if the feeder traffic to the intercontinen-tal routes is eroded further.
Along with the increasing number of LCC routes, the proportion of transfer traffic (passengers flying to an airport in
order to change flights to another desti-nation) is in decline. In 2005, the total transfer traffic was 33.4 per cent of the to-tal number of international departing pas-sengers (IDP). In 2011 this had dropped to 22 per cent, an 11.4 per cent fall.
international routes are essential
In addition to being the central traffic hub in the Øresund Region, Copen-hagen Airport is also a major northern European traffic hub. The airport has so far performed well compared to the rest of Europe's big cities when measured by international traffic and the number of passengers – 2011 was a record year with 22.7 million passengers.
But the struggle to attract new routes is tough, and Copenhagen risks losing ground. Amsterdam, for example, is targeting Scandinavian routes outside Copenhagen, Helsinki is targeting traf-fic to emerging markets in Asia, and
1Feeder traffic is defined as traffic from Norway, Sweden, the Baltic countries, Poland and northern Germany to the Copenhagen hub, where passengers change planes to continue on to other destinations in Europe or overseas destinations.
2Point-to-point-traffic is that between two cities, without the possibility of stopovers and transfers. Point-to-point traffic refers to the fact that travellers only use a flight to get from A to B and not from A to C via B.
ACCEssIBIlItY AnD MoBIlItY | CoPEnhAGEn AiRPoRT
98 Øresund Trends 2012
Berlin is expanding its airport capacity significantly. Therefore, Copenhagen Airport needs to strengthen its hold on international traffic and launch an of-fensive strategy to secure its position as the most important transport hub for the Øresund Region and northern Eu-rope. Copenhagen Airport has, for example, formulated an ambitious strategy to maintain the airport's status as an effi-cient hub and ensure growth potential under the title 'World Class Hub'. Also, Wonderful Copenhagen has launched the project 'Copenhagen Connected'. Both projects aim to strengthen and expand the accessibility of Denmark and the Øresund Region. This goal is achieved through targeted marketing to attract and secure international flights to the region.
It is important to keep in mind, how-ever, that it is not just about main-taining existing services and attracting new routes to the airport. It is very much about attracting the right routes. Whether it is international investment, tourism or highly skilled labour, it is essential that there is a wide network of international flights to and from Copenhagen Airport. This connects Copenhagen and the Øresund Region with emerging markets. Accessibility is a prerequisite for Denmark to be seen as an attractive destination for tourists, international conferences as well as for companies and organisations to estab-lish new headquarters.
ACCEssIBIlItY AnD MoBIlItY | CoPEnhAGEn AiRPoRT
99Øresund Trends 2012
Case studyIn 2011 and 2012, Copenhagen Connected helped to establish direct flights between Copenhagen Airport and a large number of destinations of importance to Danish industry. this is particularly the case for routes to toronto, shanghai, Dubai and san Francisco, Bahrain and several others.
A good example is the direct route between Dubai and Copenha-gen with the Middle East's largest airline, Emirates. the route will improve access not only to the Middle East but also to key markets
in south and southeast Asia, Australia and oceania. the new route became a reality after Copenhagen Connected, in partnership with Copenhagen Airport, had been in dialogue with Emirates about developing the route.
the agreement with Emirates makes it possible to market Copen-hagen, Denmark and the Øresund Region heavily in Australia and India in order to increase the demand for travel to Copenhagen.
Copenhagen ConnectedCopenhagen Connected is a Wonderful Copenhagen initiative. the project falls under the Global Connected umbrella and, through targeted marketing, aims to stimulate demand and thus the accessibility of Copenhagen, Denmark and the Øresund Region.
Copenhagen Connected is supported by a wide range of public and private partners:
Wonderful Copenhagen the City of MalmövisitDenmark lund Municipalitythe City of Copenhagen scaniathe Capital RegionRegion ZealandFoundation for the Promotion of DenmarkCopenhagen Airport and others
In addition, a number of prominent companies and organisations expressed their support for the project, including:lo, Danish Metal, DI, Danish Chamber of Commerce, A.P. Moller-Maersk, Carlsberg, Flsmidth, university of Copenhagen and others
ACCEssIBIlItY AnD MoBIlItY | CoPEnhAGEn AiRPoRT
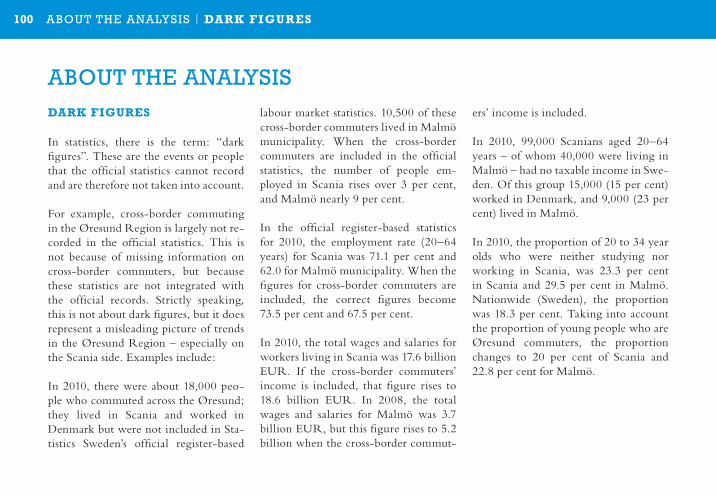
100 Øresund Trends 2012
ABout tHE AnAlYsIsDARK FiGURES
In statistics, there is the term: “dark figures”. These are the events or people that the official statistics cannot record and are therefore not taken into account.
For example, cross-border commuting in the Øresund Region is largely not re-corded in the official statistics. This is not because of missing information on cross-border commuters, but because these statistics are not integrated with the official records. Strictly speaking, this is not about dark figures, but it does represent a misleading picture of trends in the Øresund Region – especially on the Scania side. Examples include:
In 2010, there were about 18,000 peo-ple who commuted across the Øresund; they lived in Scania and worked in Denmark but were not included in Sta-tistics Sweden’s official register-based
labour market statistics. 10,500 of these cross-border commuters lived in Malmö municipality. When the cross-border commuters are included in the official statistics, the number of people em-ployed in Scania rises over 3 per cent, and Malmö nearly 9 per cent.
In the official register-based statistics for 2010, the employment rate (20–64 years) for Scania was 71.1 per cent and 62.0 for Malmö municipality. When the figures for cross-border commuters are included, the correct figures become 73.5 per cent and 67.5 per cent.
In 2010, the total wages and salaries for workers living in Scania was 17.6 billion EUR. If the cross-border commuters’ income is included, that figure rises to 18.6 billion EUR. In 2008, the total wages and salaries for Malmö was 3.7 billion EUR, but this figure rises to 5.2 billion when the cross-border commut-
ers’ income is included.
In 2010, 99,000 Scanians aged 20–64 years – of whom 40,000 were living in Malmö – had no taxable income in Swe-den. Of this group 15,000 (15 per cent) worked in Denmark, and 9,000 (23 per cent) lived in Malmö.
In 2010, the proportion of 20 to 34 year olds who were neither studying nor working in Scania, was 23.3 per cent in Scania and 29.5 per cent in Malmö. Nationwide (Sweden), the proportion was 18.3 per cent. Taking into account the proportion of young people who are Øresund commuters, the proportion changes to 20 per cent of Scania and 22.8 per cent for Malmö.
ABout tHE AnAlYsIs | DARK FiGURES
101Øresund Trends 2012
ABoUT ØRESTAT
Currently, there are statistics available for the Øresund Region, which describe the development of:
• Commuting• MigrationacrosstheØresund• Business• Population• Housing• Thelabourmarket
Much of this information comes from the Øresund Database, which is unique in that it contains statistics on both the Danish and the Swedish parts of the Øresund Region. The information has been harmonised, so that figures from both sides are comparable.
Border statistics have been produced in collaboration between Statistics Den-mark and Statistics Sweden and the pur-
pose is to shed light on Øresund regional development and integration.
The Øresund Database is being devel-oped continuously. In 2011, a new pro-ject was launched: 'Ørestat III'. This is an EU-funded project, which aims to strengthen the knowledge base about social issues in the Øresund Region in order to support the Øresund regional development strategy 'Ørus'. The pro-ject focuses upon:
• Knowledgeandinnovation• Cultureandexperiences• Cohesivestrength and the changing labour market• Accessibilityandmobility• Climateandsustainability• Healthandlifestyle
The project, to be completed in 2014, is run by Region Scania in coopera-tion with the Capital Region, Region
Zealand, Helsingborg city, Landskrona city, Malmö, Arbetsförmedlingen (The Swedish Public Employment Service), the Öresund Committee and the Em-ployment Region Copenhagen & Zea-land and has a budget of approximately 1.3 million euros.
www.orestat.dk www.orestat.se
ABout tHE AnAlYsIs | ABoUT ØRESTATABout tHE AnAlYsIs | DARK FiGURES
102 Øresund Trends 2012
ABoUT ØRESUnD TREnDS
Øresund Trends is the result of collabo-ration between statisticians and analysts from 12 organisations in the Øresund Region:
Arbetsförmedlingen ( Job Centre) in Scania, Employment Region Copenha-gen & Zealand, the Interreg Project Jobs and Education, Malmö City, Landskro-na City, Lund Municipality, Helsing-borg City, Capital Region, Region Zealand, Region Sania, Wonderful Co-penhagen and the Öresund Committee.
ABout tHE AnAlYsIs | ABoUT ØRESUnD TREnDS
103Øresund Trends 2012ABout tHE AnAlYsIs | ABoUT ØRESUnD TREnDS
ØRESUnD REGion DEnMARK
Employment Region Copenhagen & Zealand Gert Jørgensen+45 72 22 34 [email protected]
Copenhagen MunicipalityMai [email protected]
Capital Region of Denmark Birgit Petersen+45 20 56 12 [email protected]
Region ZealandPer Anders Foss +45 57 87 59 59 [email protected]
ØRESUnD REGion SWEDEn
The Swedish Employment Service Thomas Behrens +46 (0)10 486 11 20 [email protected]
Helsingborg municipality Marianne Toreblad +46 (0)42 10 50 68 [email protected]
Landskrona Municipality Eivor Johansson +46 (0)41 847 38 30 [email protected]
Lund Municipality Jens Nilson +46 (0)46 35 82 69 [email protected]
Malmö Municipality Necmi Incegül+ 46 (0)40 34 12 [email protected]
ContACt lIst
The Öresund CommitteeBritt Andresen +45 31 31 38 [email protected]
Birgitte Steenstrup +45 20 52 05 35 [email protected]
Peter [email protected]
Region Skåne Christina Ripa +46 (0)44 309 32 73 [email protected]
Anders Axelsson +46 (0)40 623 97 26 [email protected]
Christian Lindell+46 (0)40 675 34 [email protected]
104 Øresund Trends 2012
beskæftigelsesregion hovedstaden & sjælland
Øresund Trends 2012