Embed Size (px)
Citation preview
Osward M ChandaDirector –Nwasco21st November, 2007
Zambezi Sun Hotel, Victoria Falls, Zambia
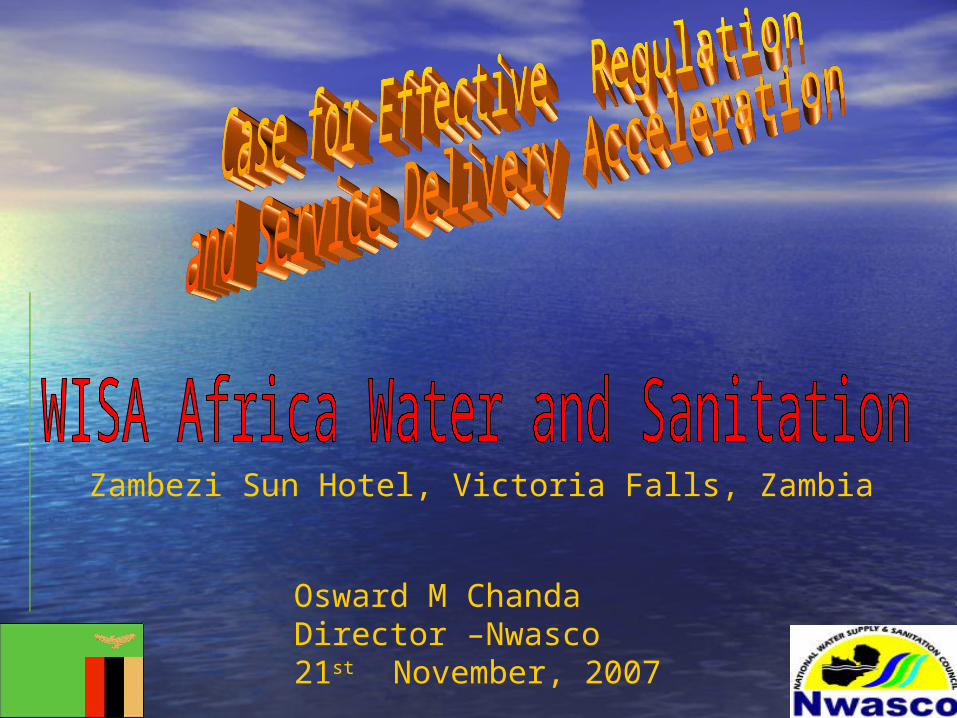
EXTENT OF URBAN POOR IN ZAMBIAEXTENT OF URBAN POOR IN ZAMBIA
11.5 Million
Leverage support to areas with maximum impact –PU
46%
Urban54%
Rural
70% in low 70% in low income/ Peri-income/ Peri-urban areaurban area
3.7 Million
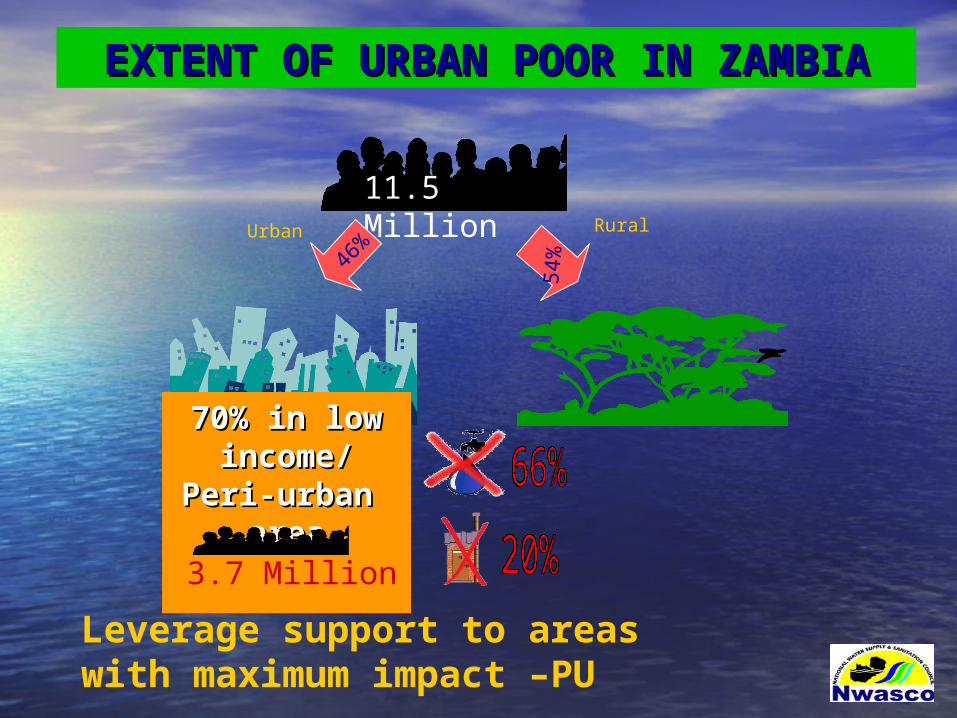
Separation
Water Resources/
Water Supply and
Sanitation
(WSS)
Devolution toLocal authorityAnd privateenterprises
SeparationRegulation/Executive
Functions WSS
EffectiveInstitutions
through HRD
AppropriateTechnology
for localconditions
Full cost
Recovery
through user
charges
Increased GRZSpendingon WSS
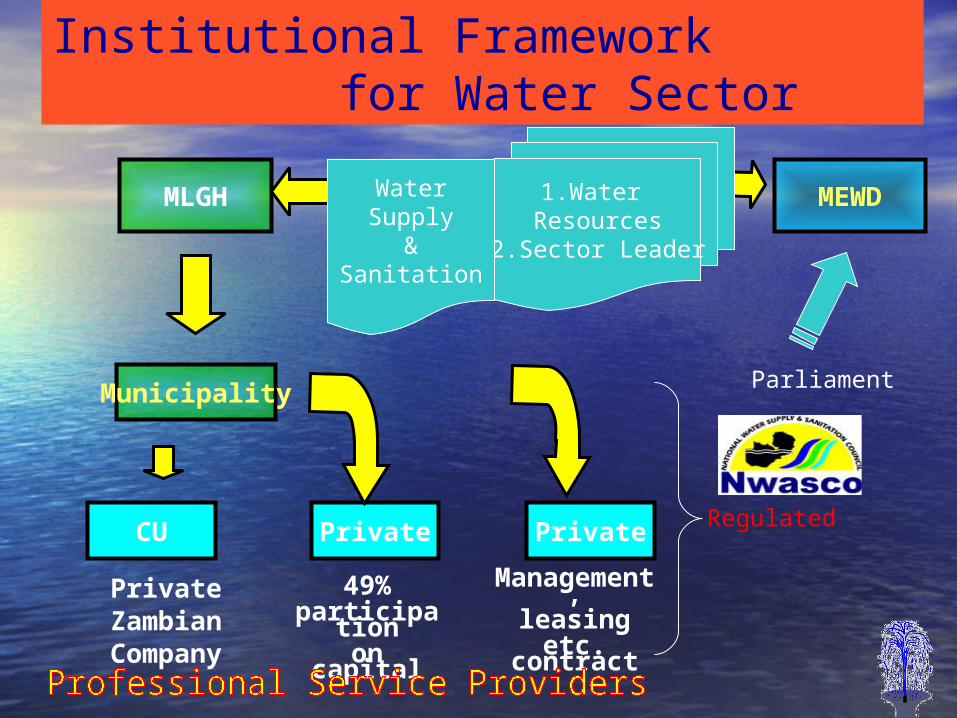
Municipality
CU Private Private
PrivateZambianCompany
49%participation
on capital
Management,leasing
etc. contract
Institutional Framework for Water Sector
MEWD1.Water Resources
2.Sector Leader
MLGH WaterSupply
&Sanitation
Parliament
Regulated
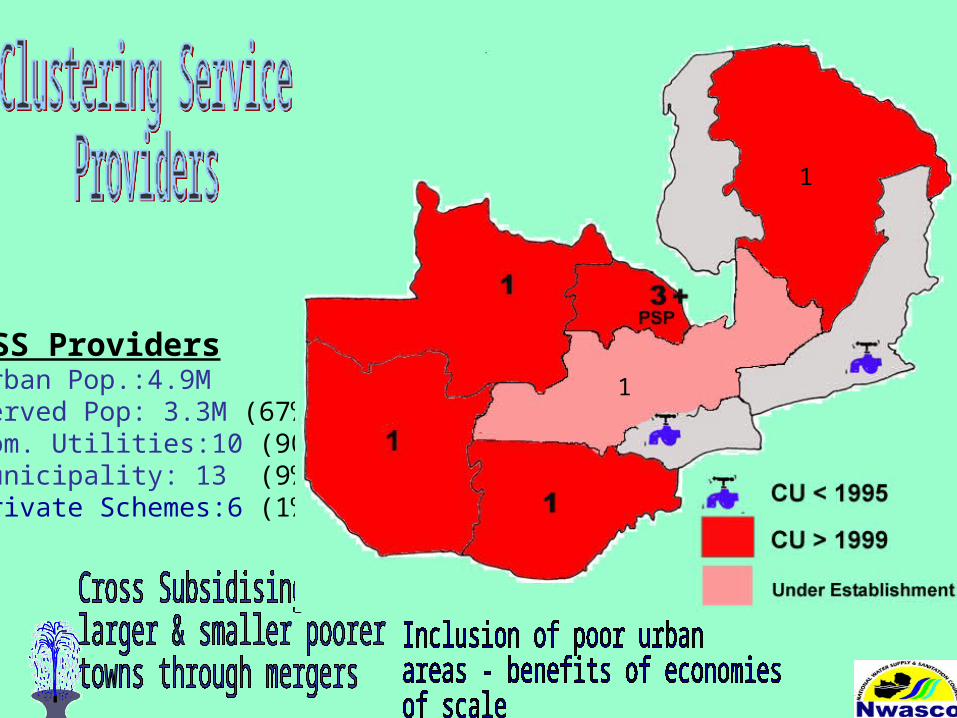
WSS ProvidersUrban Pop.:4.9MServed Pop: 3.3M (67%)Com. Utilities:10 (90%)Municipality: 13 (9%)Private Schemes:6 (1%)
1
1

MunicipalityMunicipalityDelegate
Operations
ProfessionalProfessionalProvidersProviders
Commercialised/PSPCommercialised/PSP
ENABLING ENVIRONMENT THROUGH REGULATIONGradual tariff adjustment to cost covering levels
Clear Minimum Service Level Requirements with Targets
Support: performance management systems & Recruitment of Magt
Good Management Information System from Utility to Regulator
Institutional Setup
Gives sufficient Independence & Promote Professionalism
Several Commercial Units Allows for Competition
Independent Professional Regulatory Agency
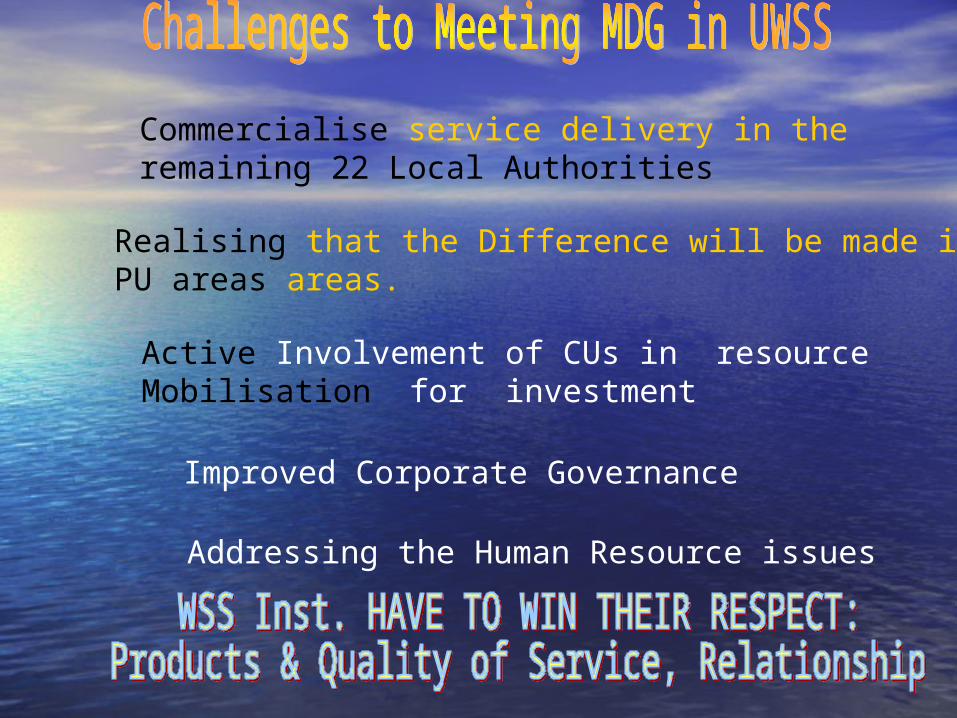
Active Involvement of CUs in resource Mobilisation for investment
Realising that the Difference will be made in PU areas areas.
Commercialise service delivery in the remaining 22 Local Authorities
Improved Corporate Governance
Addressing the Human Resource issues
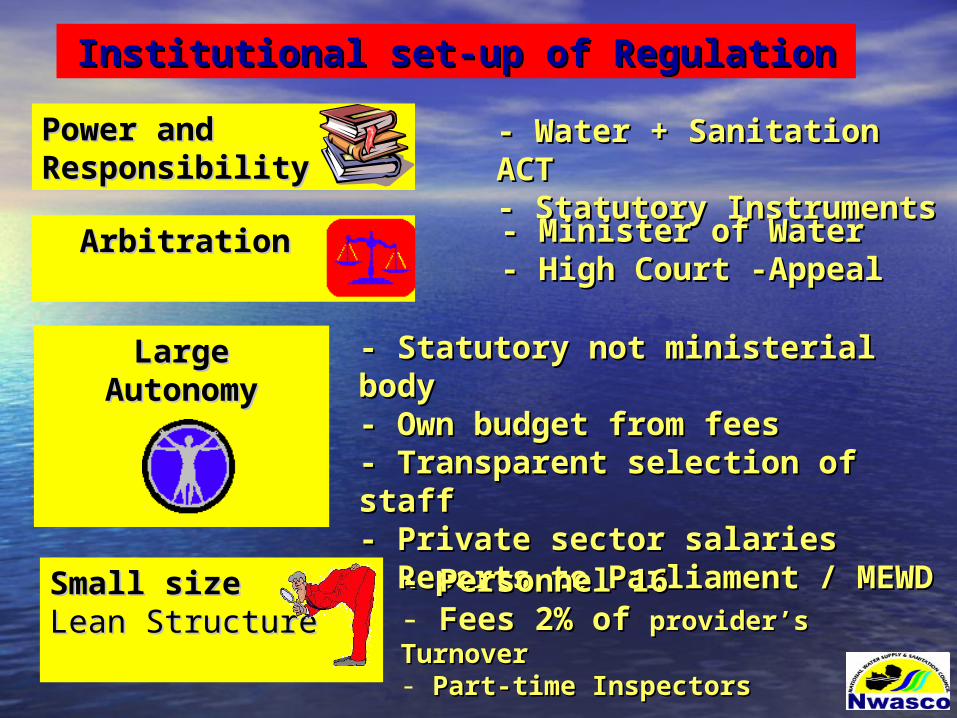
Institutional set-up of RegulationInstitutional set-up of Regulation
- Water + Sanitation ACT- Water + Sanitation ACT- Statutory Instruments- Statutory Instruments
Power and Power and ResponsibilityResponsibility
ArbitrationArbitration - Minister of Water- Minister of Water- High Court -Appeal- High Court -Appeal
LargeLargeAutonomyAutonomy
- Statutory not ministerial body- Statutory not ministerial body- Own budget from fees- Own budget from fees- Transparent selection of staff- Transparent selection of staff- Private sector salaries- Private sector salaries- Reports to Parliament / MEWD- Reports to Parliament / MEWD
Small sizeSmall sizeLean StructureLean Structure
- Personnel 16- Personnel 16- Fees 2% of Fees 2% of provider’s Turnoverprovider’s Turnover- Part-time InspectorsPart-time Inspectors
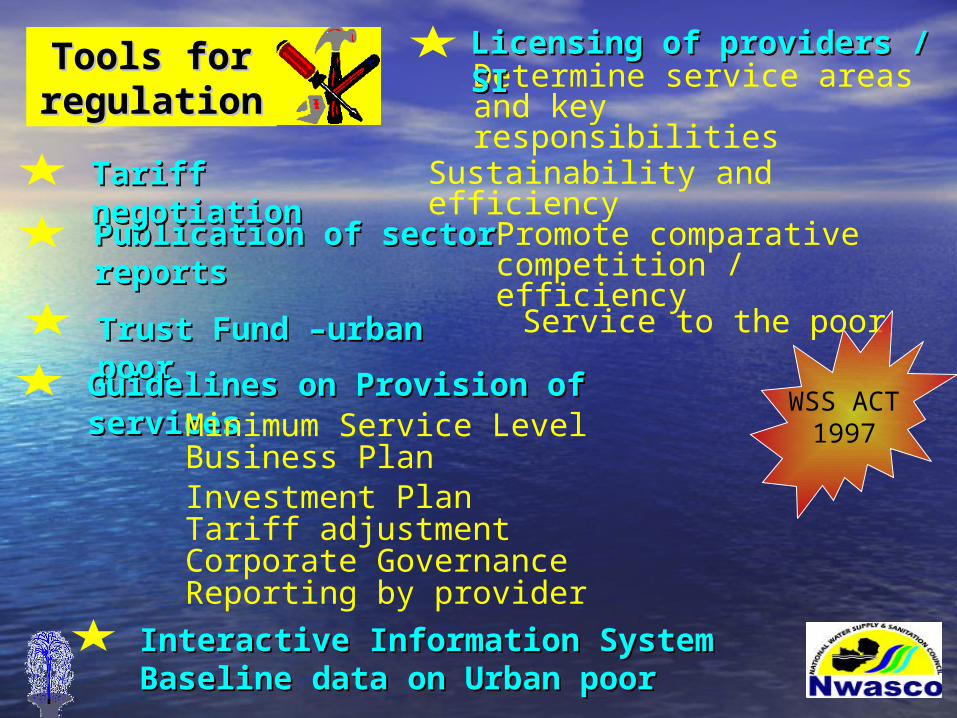
Tools for Tools for regulationregulation
Trust Fund –urban Trust Fund –urban poorpoor
Service to the poor
Guidelines on Provision of servicesGuidelines on Provision of services
Publication of sector Publication of sector reportsreports
Promote comparative competition / efficiency
Tariff negotiationTariff negotiation Sustainability and efficiency
Determine service areasand key responsibilities
Licensing of providers / SILicensing of providers / SI
Minimum Service LevelBusiness Plan Investment PlanTariff adjustmentCorporate GovernanceReporting by provider
Interactive Information System Interactive Information System Baseline data on Urban poorBaseline data on Urban poor
WSS ACT1997
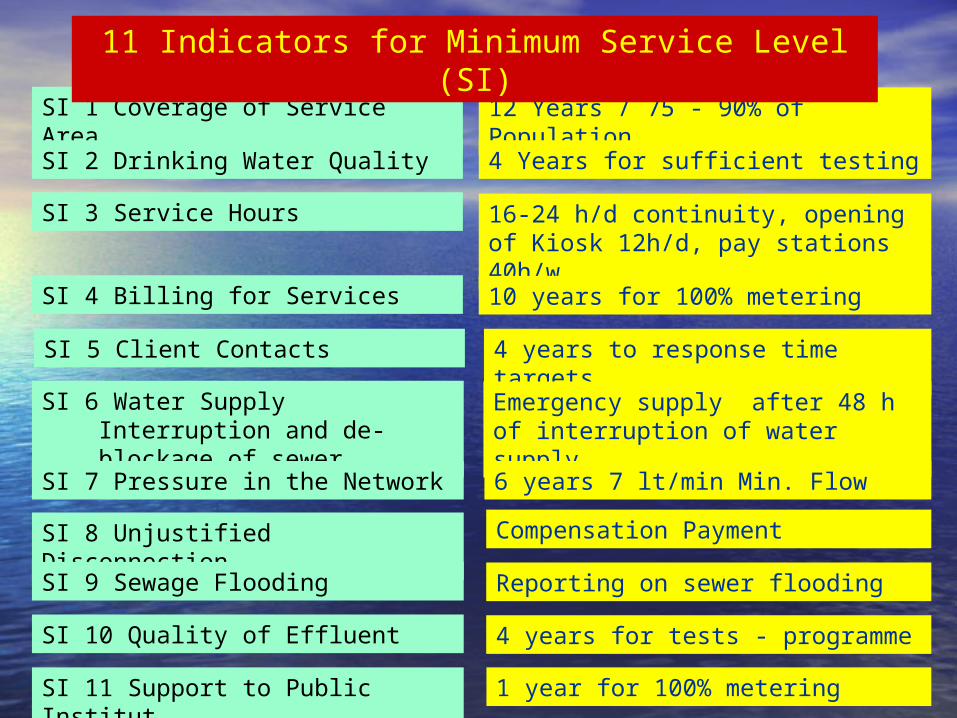
SI 1 Coverage of Service Area 12 Years / 75 - 90% of Population
SI 2 Drinking Water Quality 4 Years for sufficient testing
11 Indicators for Minimum Service Level (SI)
SI 3 Service Hours 16-24 h/d continuity, opening of Kiosk 12h/d, pay stations 40h/w
SI 4 Billing for Services 10 years for 100% metering
SI 5 Client Contacts 4 years to response time targets
SI 6 Water Supply Interruption and de-blockage of sewer
Emergency supply after 48 h of interruption of water supply
SI 7 Pressure in the Network 6 years 7 lt/min Min. Flow
SI 8 Unjustified Disconnection Compensation Payment
SI 9 Sewage Flooding Reporting on sewer flooding
SI 10 Quality of Effluent 4 years for tests - programme
SI 11 Support to Public Institut. 1 year for 100% metering
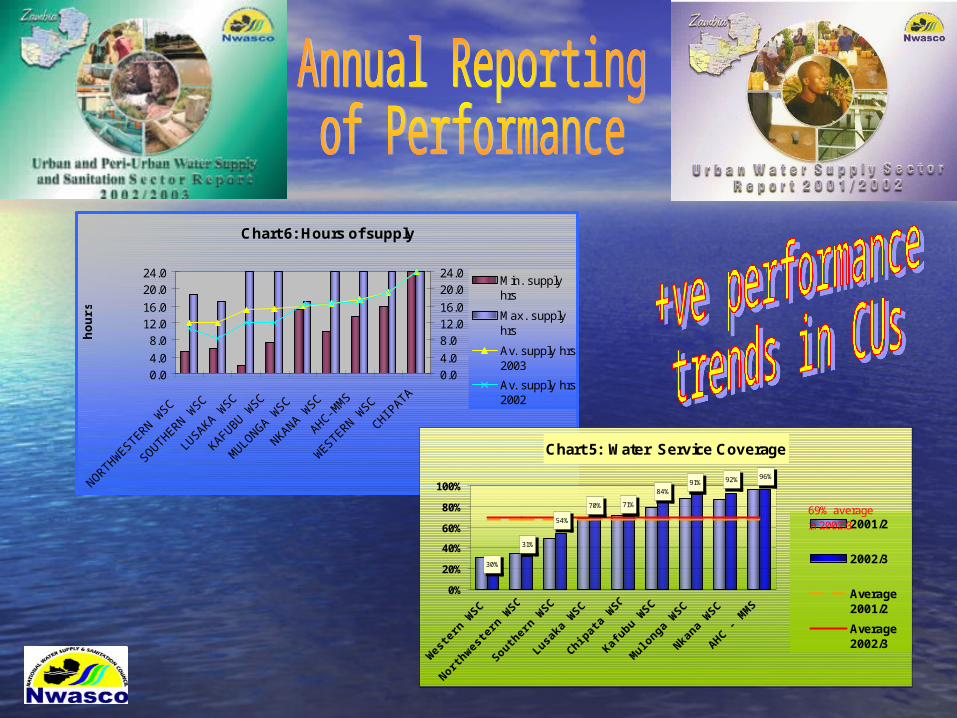
Chart 6: Hours of supply
0.04.0
8.012.016.0
20.024.0
NORTHWESTERN W
SC
SOUTHERN WSC
LUSAKA W
SC
KAFUBU WSC
MULO
NGA WSC
NKANA WSC
AHC-MM
S
WESTERN W
SC
CHIPATA
ho
urs
0.04.0
8.012.016.0
20.024.0
Min. supplyhrs
Max. supplyhrs
Av. supply hrs2003
Av. supply hrs2002
Chart 5: Water Service Coverage
30%
31%
54%
70% 71%
84%91% 92% 96%
0%
20%
40%
60%
80%
100%
Wes
tern
WSC
Northw
este
rn W
SC
Souther
n WSC
Lusaka
WSC
Chipat
a W
SC
Kafubu W
SC
Mulo
nga W
SC
Nkana
WSC
AHC - M
MS
2001/2
2002/3
Average2001/2
Average2002/3
69% average in 2002/3
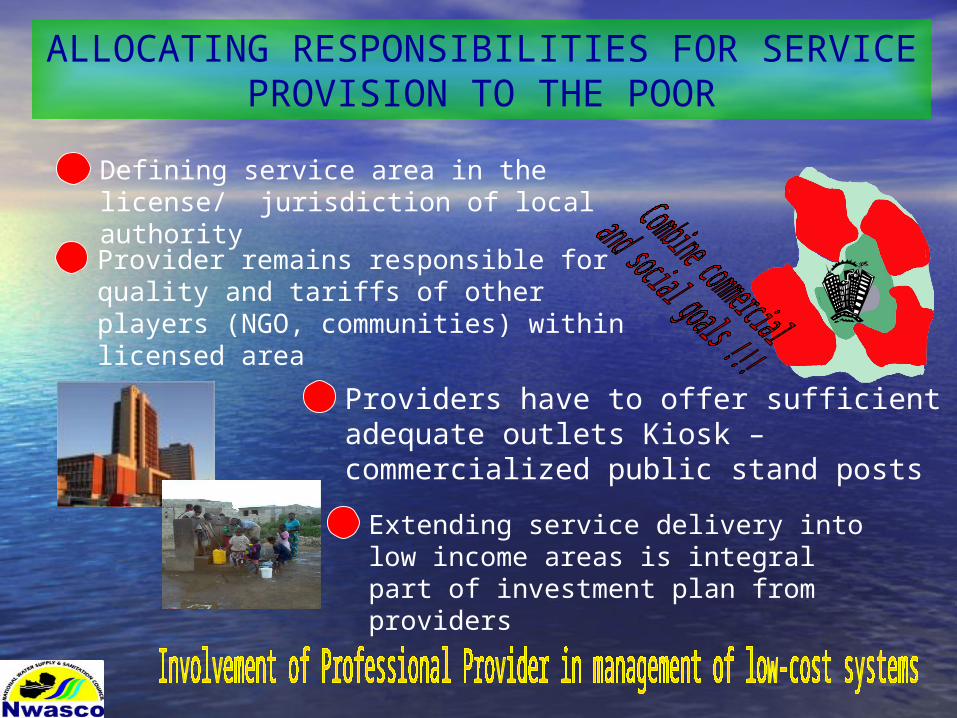
ALLOCATING RESPONSIBILITIES FOR SERVICE PROVISION TO THE POOR
Providers have to offer sufficient adequate outlets Kiosk – commercialized public stand posts
Defining service area in the license/ jurisdiction of local authority
Extending service delivery into low income areas is integral part of investment plan from providers
Provider remains responsible for quality and tariffs of other players (NGO, communities) within licensed area
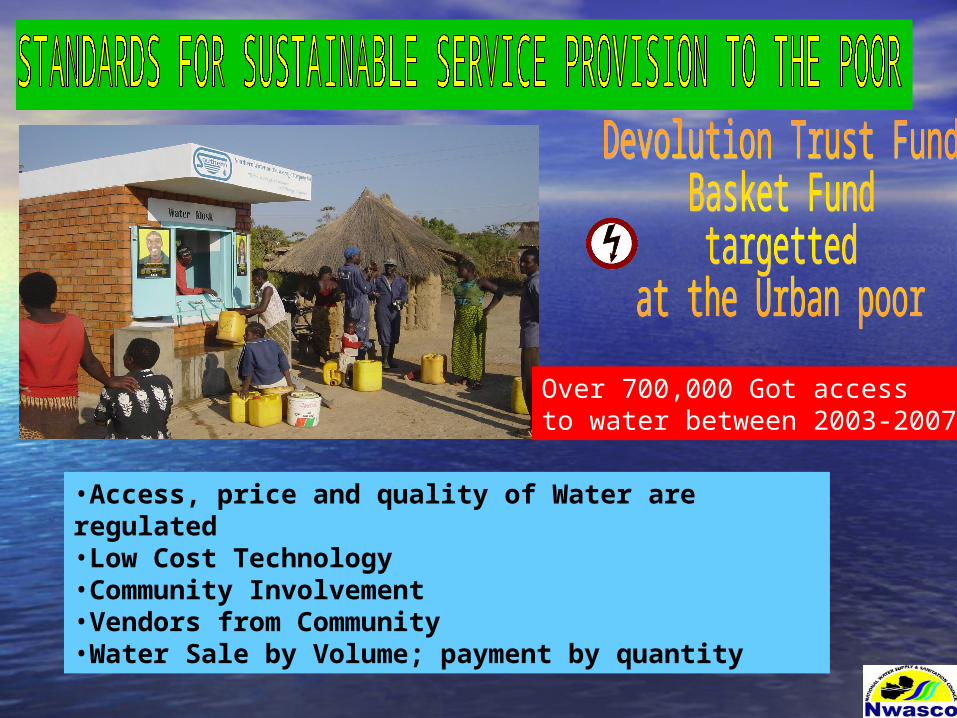
•Access, price and quality of Water are regulated•Low Cost Technology•Community Involvement•Vendors from Community•Water Sale by Volume; payment by quantity
Over 700,000 Got access to water between 2003-2007

![Meaco DD8L Zambezi Dehumidifier - Climatronics · Meaco DD8L Zambezi Dehumidifier Thank you for choosing Meaco, we really do appreciate it INSTRUCTION MANUAL [EN] DD8L Zambezi](https://img.pdfslide.net/doc/110x75/5b5b40477f8b9a01748da729/meaco-dd8l-zambezi-dehumidifier-climatronics-meaco-dd8l-zambezi-dehumidifier.jpg)