Embed Size (px)
Citation preview
Otolith elemental signatures reflect residency in coastalwater masses
Mary M. Nishimoto & Libe Washburn &
Robert R. Warner & Milton S. Love &
Georges L. Paradis
Received: 13 October 2009 /Accepted: 20 July 2010 /Published online: 11 August 2010# The Author(s) 2010. This article is published with open access at Springerlink.com
Abstract We examined variability in otolith chemis-try of wild caught fish in relation to in situtemperature and salinity within the California CurrentSystem. Barium, magnesium, and iron from the mostrecent growth zone in otoliths differentiated pelagicjuvenile shortbelly rockfish (Sebastes jordani) resid-ing in water masses with distinct temperatureand salinity properties from central and southernCalifornia spanning nearly 500 km of coastline. The3-element signature also discriminated fish thatresided in different water masses that were associatedwith mesoscale cyclonic eddy circulation in the SantaBarbara Channel. Variability in otolith chemistryreflected the spatial patterns of both horizontalgradients and vertical gradients in water mass prop-erties related to circulation. Although we found thatthe concentrations of particular elements in otolithswere correlated to ambient temperature or salinity, we
suggest that these parameters are more useful as anidentifying signature of distinct water masses associ-ated with unique otolith signatures rather than asfactors directly affecting otolith chemistry. Otherfactors varying among the water masses or amongthe fish populations residing in the water masses mayalso affect otolith chemistry. We discuss how ocean-ographic phenomena associated with the 1997–1998El Niño and the persistent, recirculating eddy in theChannel may have affected coastal ocean conditionsand variation in otolith chemistry of fish in the studyarea.
Keywords Otolith microchemistry . Coastalcirculation .Water masses . Early life history
Introduction
Elemental and isotopic assays of fish otoliths havebeen directed at questions concerning the tracking andmixing of marine and freshwater populations. Infer-ences about fish homing behavior (Secor et al. 1995;Thorrold et al. 2001), connectivity estimates (Millerand Shanks 2004; Standish et al. 2008), and larvaldispersal histories (Swearer et al. 1999; FitzGerald etal. 2004; Hamilton et al. 2008) have been based onotolith chemistry as geographic tags. These applica-tions of otolith chemistry do not necessarily requirethe determination of how element concentrations,salinity, and temperature in the environment are
Environ Biol Fish (2010) 89:341–356DOI 10.1007/s10641-010-9698-6
M. M. Nishimoto (*) :M. S. Love :G. L. ParadisMarine Science Institute, University of California,Santa Barbara, CA 93106, USAe-mail: [email protected]
L. WashburnInstitute for Computational Earth System Scienceand Department of Geography, University of California,Santa Barbara, CA 93106, USA
R. R. WarnerEcology, Evolution, and Marine Biology,University of California,Santa Barbara, CA 93106, USA
related to element concentrations in the otolith; whatis required is that the chemical assays of fish otolithsdiscriminate individuals from different locations.However, at least two important limitations inutilizing otolith chemistry to assess the movement ofindividuals and the mixing of populations amonglocations stem from not knowing how environmentalvariability relates to the spatial and temporal variabil-ity in otolith chemistry.
The first limitation is the reliability of site-specificotolith elemental signatures over time. Sufficientconsistency in the spatial variability of otolithelemental signatures allows discrimination amonghabitat sites within a year; however, many studiesthat have compared otolith chemical compositionamong locations over two or more years have foundsignificant interannual variability (Milton et al. 1997;Dove and Kingsford 1998; Patterson et al. 1999;Campana et al. 2000; Gillanders 2002; Hamer et al.2003; Miller and Shanks 2004; Brown 2006). Thistemporal inconsistency is especially problematic if thegoal, for example, is to examine a population overtime to estimate connectivity via migration or larvaldispersal among spatially distinct habitats.
The second limitation is that individuals ofunknown residency can only be assigned to the setof sampled locations that define the spatial variabilityof the signatures. There is an unknown degree of errorin assigning fish of unknown residency to a specificsite of a set of sampled locations, because fishresiding in unsampled locations might share the sameelemental signature as fish from the set of sampledlocations. This can occur even if the spatial variabilityof the otolith elemental signatures defined by a set ofsampled locations is consistent over time and theelemental signatures are good discriminators of thesites sampled.
Presently, inferences are limited to the geographicscale of sampling, the localities sampled, and the timeof sampling within individual studies, because of theuncertainty of changing environmental conditions thataffect the variability in otolith chemistry over timeand space. We turn our attention from the utility ofusing otolith chemistry as a location-based discrimi-nator, and focus on the prospect of utilizing otolithchemistry to identify water mass residency. Amotivation for this study is that if unique elementalsignatures are associated with distinct water masses,then a reference or atlas identifying these relation-
ships might be developed. Otolith chemistry andoceanography might prove useful for reconstructingthe transport histories of individuals and estimatingthe connectivity of populations across broad regionsand over time.
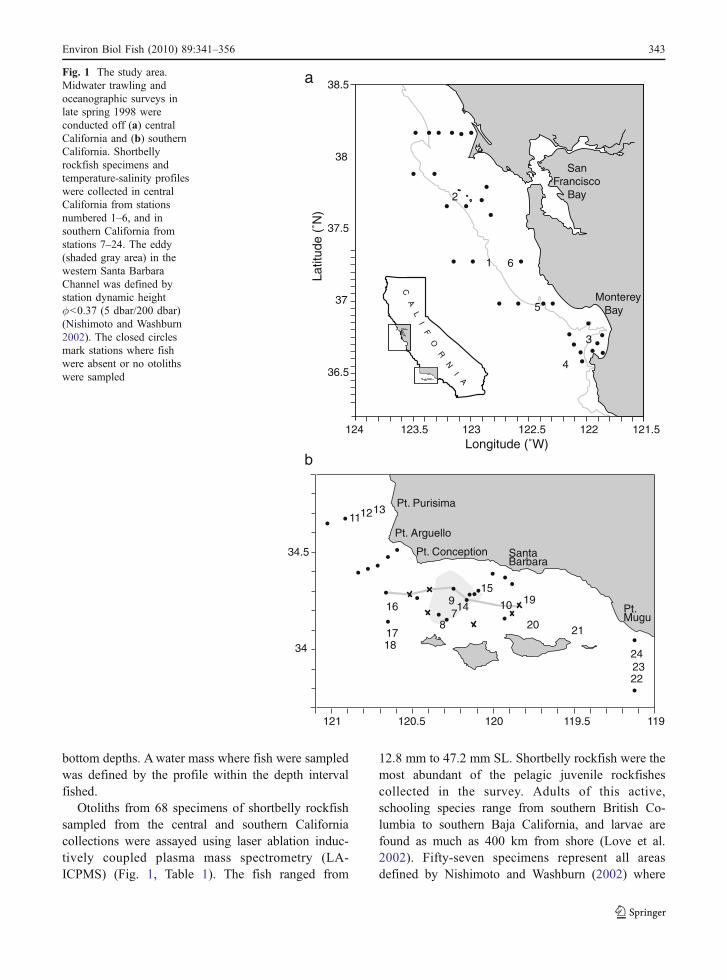
The central goal of this study was to test thehypothesis that variability among otolith trace ele-ment signatures of wild-caught fish was associatedwith in situ water masses. To identify distinct watermasses, we examined temperature and salinity mea-sured during pelagic juvenile fish sampling off centralCalifornia in May 1998 (Sakuma et al. 2000) and offthe southern California coast in June 1998 (Nishimotoand Washburn 2002) spanning a distance of nearly500 km (Fig. 1). The otolith signatures of shortbellyrockfish (Sebastes jordani) from these surveys weredefined by a suite of elements assayed from the outerotolith material grown in the recent days precedingcapture. Otolith sampling included fish found con-centrated in a persistent cyclonic eddy in the westernSanta Barbara Channel (Nishimoto and Washburn2002; Figs. 1b and 2). We examined the variability inotolith chemistry in relation to temperature andsalinity across the study area and the three-dimensional circulation of the eddy.
Materials and methods
Water mass sampling and otolith chemistry
Similar methods were used in the central and southernCalifornia surveys (detailed in Wyllie Echeverria et al.1990; Nishimoto and Washburn 2002; Sakuma et al.2000) to collect the otoliths and oceanographic datafor this study. Fish were collected at night with amodified Cobb mid-water trawl with a 9 mm codendtowed at depth for 15 min at ~5 kmh−1 covering~1.5 km (Nishimoto and Washburn 2002). Theopening of the net used in both surveys wasapproximately 10 m wide and 14 m high whentrawling at a headrope depth of 20 m. The depthinterval for each haul was estimated as the distancefrom the mean depth, d0, of the headrope (rope acrossthe top of the net opening) to 14 m below d0 (Table 1).Vertical profiles of potential temperature T andsalinity S (averaged into 1-m depth bins) wereobtained either immediately before or after each haulto at least 200 m or a few meters above shallower
342 Environ Biol Fish (2010) 89:341–356
bottom depths. Awater mass where fish were sampledwas defined by the profile within the depth intervalfished.
Otoliths from 68 specimens of shortbelly rockfishsampled from the central and southern Californiacollections were assayed using laser ablation induc-tively coupled plasma mass spectrometry (LA-ICPMS) (Fig. 1, Table 1). The fish ranged from
12.8 mm to 47.2 mm SL. Shortbelly rockfish were themost abundant of the pelagic juvenile rockfishescollected in the survey. Adults of this active,schooling species range from southern British Co-lumbia to southern Baja California, and larvae arefound as much as 400 km from shore (Love et al.2002). Fifty-seven specimens represent all areasdefined by Nishimoto and Washburn (2002) where
11Pt. Purisima
Longitude (˚W)
Latit
ude
(˚N
)
SanFrancisco
Bay
Monterey Bay
Pt. Arguello
Pt. Conception SantaBarbara
Pt.Mugu
16
1718
8
9714
15
10 19
20 21
242322
1213
b
a
34.5
36.5
37
124 123 122
38
123.5 122.5 121.5
37.5
38.5
34
121 120.5 120 119.5 119
1
2
3
4
5
6
C A
L I F
O R
N I A
Fig. 1 The study area.Midwater trawling andoceanographic surveys inlate spring 1998 wereconducted off (a) centralCalifornia and (b) southernCalifornia. Shortbellyrockfish specimens andtemperature-salinity profileswere collected in centralCalifornia from stationsnumbered 1–6, and insouthern California fromstations 7–24. The eddy(shaded gray area) in thewestern Santa BarbaraChannel was defined bystation dynamic height�<0.37 (5 dbar/200 dbar)(Nishimoto and Washburn2002). The closed circlesmark stations where fishwere absent or no otolithswere sampled
Environ Biol Fish (2010) 89:341–356 343
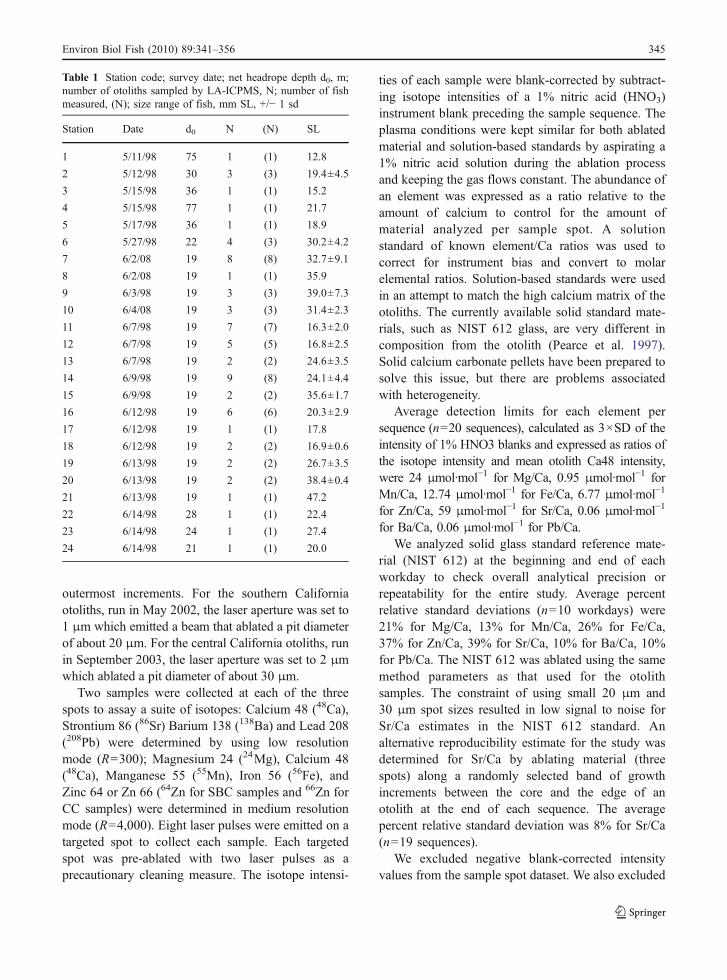
shortbelly rockfish were collected during 3–15 June1998 in southern California (Fig. 1b, Table 1). Elevenotolith samples from central California were collectedduring 11–27 May 1998 from the Farallon Islandswest of San Francisco to Cypress Point, Monterey(stations 1–6 in Fig. 1a and Table 1). The otoliths ofone to four specimens per station were assayed(Table 1).
The otolith samples from the two surveys werehandled somewhat differently. Specimens from the1998 southern California survey were subsampled in2000 from an ETOH-preserved archive, measured,and the sagittae extracted. The fish had been frozen atsea, then thawed and archived within several monthsafter collection. The otoliths were rinsed in deionizedwater, air dried and stored in plastic bags for severalmonths until the time when each otolith was affixedto a plastic slide using epoxy resin (Epo-Thin,Buehler). The fish collected in the central Californiasurvey were frozen at sea. Within several months, thespecimens were thawed and measured, and theotoliths extracted, rinsed, dried and affixed to glass
slides using a clear nail polish epoxy (Sally Hansen’sHard-as-Nails brand).
All otoliths were polished down to about 15 μmabove the center of otolith nucleus using a lappingwheel and 9, 3, and 1 μm 3 M diamond polishingfilms. After polishing, decontamination steps de-scribed by Ruttenberg et al. (2005) and Warner et al.(2005) were performed in a clean laboratory onindividually isolated otoliths.
Otolith material produced within 1 week precedingcapture was analyzed on a Finnigan MAT Element2-sector field ICPMS as described in Warner et al.(2005) and Ruttenberg et al. (2005). A VG UVmicroprobe Nd:YAG (Neodymium-doped YttriumAluminum Garnet) 266 nm laser ablation systemwas outfitted with a helium aerosol carrier system totransfer the sample from the enclosed sample chamberto the ICPMS as described in Zacherl et al. (2003).The laser was set at 0.1 mJ at 3 Hz. The laser was usedto ablate three sample spots in the same growth zonenear the edge of the anterior rostrum of each otolithwith care taken to avoid epoxy that overlaid one or two
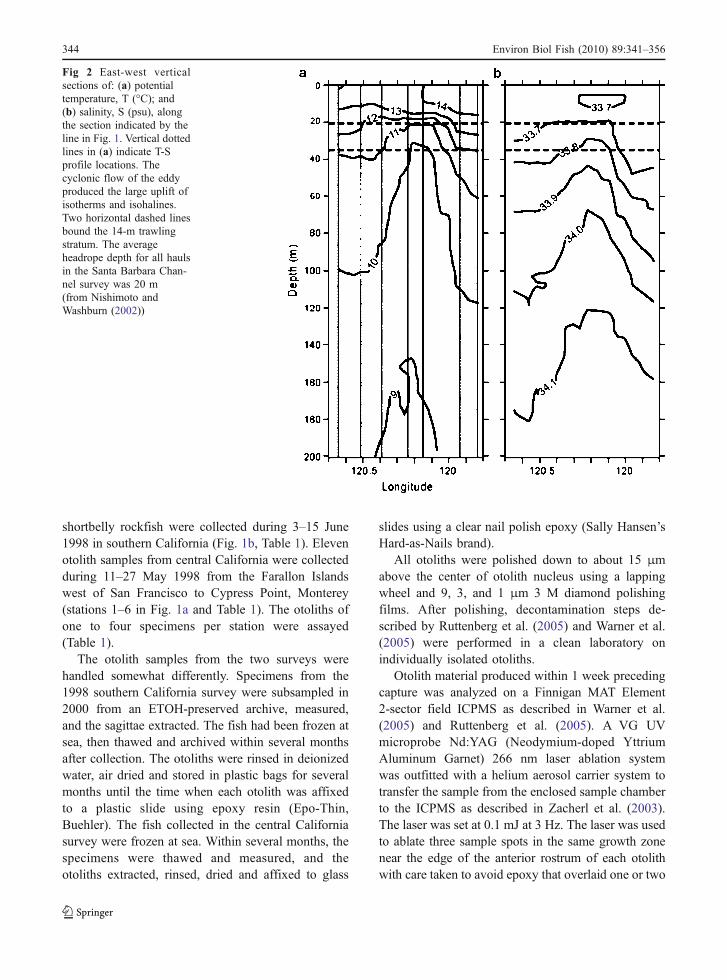
Fig 2 East-west verticalsections of: (a) potentialtemperature, T (°C); and(b) salinity, S (psu), alongthe section indicated by theline in Fig. 1. Vertical dottedlines in (a) indicate T-Sprofile locations. Thecyclonic flow of the eddyproduced the large uplift ofisotherms and isohalines.Two horizontal dashed linesbound the 14-m trawlingstratum. The averageheadrope depth for all haulsin the Santa Barbara Chan-nel survey was 20 m(from Nishimoto andWashburn (2002))
344 Environ Biol Fish (2010) 89:341–356
outermost increments. For the southern Californiaotoliths, run in May 2002, the laser aperture was set to1 μm which emitted a beam that ablated a pit diameterof about 20 μm. For the central California otoliths, runin September 2003, the laser aperture was set to 2 μmwhich ablated a pit diameter of about 30 μm.
Two samples were collected at each of the threespots to assay a suite of isotopes: Calcium 48 (48Ca),Strontium 86 (86Sr) Barium 138 (138Ba) and Lead 208(208Pb) were determined by using low resolutionmode (R=300); Magnesium 24 (24Mg), Calcium 48(48Ca), Manganese 55 (55Mn), Iron 56 (56Fe), andZinc 64 or Zn 66 (64Zn for SBC samples and 66Zn forCC samples) were determined in medium resolutionmode (R=4,000). Eight laser pulses were emitted on atargeted spot to collect each sample. Each targetedspot was pre-ablated with two laser pulses as aprecautionary cleaning measure. The isotope intensi-
ties of each sample were blank-corrected by subtract-ing isotope intensities of a 1% nitric acid (HNO3)instrument blank preceding the sample sequence. Theplasma conditions were kept similar for both ablatedmaterial and solution-based standards by aspirating a1% nitric acid solution during the ablation processand keeping the gas flows constant. The abundance ofan element was expressed as a ratio relative to theamount of calcium to control for the amount ofmaterial analyzed per sample spot. A solutionstandard of known element/Ca ratios was used tocorrect for instrument bias and convert to molarelemental ratios. Solution-based standards were usedin an attempt to match the high calcium matrix of theotoliths. The currently available solid standard mate-rials, such as NIST 612 glass, are very different incomposition from the otolith (Pearce et al. 1997).Solid calcium carbonate pellets have been prepared tosolve this issue, but there are problems associatedwith heterogeneity.
Average detection limits for each element persequence (n=20 sequences), calculated as 3×SD of theintensity of 1% HNO3 blanks and expressed as ratios ofthe isotope intensity and mean otolith Ca48 intensity,were 24 μmol·mol−1 for Mg/Ca, 0.95 μmol·mol−1 forMn/Ca, 12.74 μmol·mol−1 for Fe/Ca, 6.77 μmol·mol−1
for Zn/Ca, 59 μmol·mol−1 for Sr/Ca, 0.06 μmol·mol−1
for Ba/Ca, 0.06 μmol·mol−1 for Pb/Ca.We analyzed solid glass standard reference mate-
rial (NIST 612) at the beginning and end of eachworkday to check overall analytical precision orrepeatability for the entire study. Average percentrelative standard deviations (n=10 workdays) were21% for Mg/Ca, 13% for Mn/Ca, 26% for Fe/Ca,37% for Zn/Ca, 39% for Sr/Ca, 10% for Ba/Ca, 10%for Pb/Ca. The NIST 612 was ablated using the samemethod parameters as that used for the otolithsamples. The constraint of using small 20 μm and30 μm spot sizes resulted in low signal to noise forSr/Ca estimates in the NIST 612 standard. Analternative reproducibility estimate for the study wasdetermined for Sr/Ca by ablating material (threespots) along a randomly selected band of growthincrements between the core and the edge of anotolith at the end of each sequence. The averagepercent relative standard deviation was 8% for Sr/Ca(n=19 sequences).
We excluded negative blank-corrected intensityvalues from the sample spot dataset. We also excluded
Table 1 Station code; survey date; net headrope depth d0, m;number of otoliths sampled by LA-ICPMS, N; number of fishmeasured, (N); size range of fish, mm SL, +/− 1 sd
Station Date d0 N (N) SL
1 5/11/98 75 1 (1) 12.8
2 5/12/98 30 3 (3) 19.4±4.5
3 5/15/98 36 1 (1) 15.2
4 5/15/98 77 1 (1) 21.7
5 5/17/98 36 1 (1) 18.9
6 5/27/98 22 4 (3) 30.2±4.2
7 6/2/08 19 8 (8) 32.7±9.1
8 6/2/08 19 1 (1) 35.9
9 6/3/98 19 3 (3) 39.0±7.3
10 6/4/08 19 3 (3) 31.4±2.3
11 6/7/98 19 7 (7) 16.3±2.0
12 6/7/98 19 5 (5) 16.8±2.5
13 6/7/98 19 2 (2) 24.6±3.5
14 6/9/98 19 9 (8) 24.1±4.4
15 6/9/98 19 2 (2) 35.6±1.7
16 6/12/98 19 6 (6) 20.3±2.9
17 6/12/98 19 1 (1) 17.8
18 6/12/98 19 2 (2) 16.9±0.6
19 6/13/98 19 2 (2) 26.7±3.5
20 6/13/98 19 2 (2) 38.4±0.4
21 6/13/98 19 1 (1) 47.2
22 6/14/98 28 1 (1) 22.4
23 6/14/98 24 1 (1) 27.4
24 6/14/98 21 1 (1) 20.0
Environ Biol Fish (2010) 89:341–356 345
outliers from the sample spot dataset. Outliers wereidentified by examining frequency distribution andnormal probability plots of the log-transformedelement/Ca sample spot data. The outlier values wereat least 1.5 times the interquartile range from themedian of the log-transformed data (SPSS, Inc 2002).The exclusions reduced the original dataset of threesamples of seven isotopes per otolith to 0–3 samplesof each isotope per otolith. The abundance of eachelement from the otolith edge was estimated fromeither a single sample spot or the mean of two or threesample spots after the molar ratio dataset was log-transformed (i.e., log(μmol element/mol Ca)). Aspecimen lacked an abundance estimate for a givenelement if the readings from all three sample spots atthe otolith edge were excluded.
Relating otolith chemistry to in situ water masses
We examined the T-S distribution within the trawlingdepth ranges to resolve water mass groups. Principalcomponent analysis (PCA) of T (15 1-m bin averagedvariables, Td=0, 1, 2, …, 14) and S (15 variables, Sd=0,1, 2, ..., 14) profile data over the depth interval of eachhaul was used to confirm the water mass groups. T andS values from each profile were normalized bysubtracting the mean of all profiles and dividing bythe standard deviation of all profiles.
Otoliths were assigned to the water mass groups bypairing hauls with vertical T-S profiles. All analyseswere performed on log-transformed otolith elementratio data. Prior to the analyses, we assessed thenormality and homoscedacity of the otolith dataamong water mass groups (SPSS, Inc 2002). Weevaluated whether fish size was a confounding factorinfluencing the effect of water mass type on otolithelement concentration. Rather than use log(element/Ca) in our analyses when the relationship between anelement and fish size was significant (Pearsoncorrelation coefficient r, α=0.01), we used theresidual values from the least squares regression oflog(element/Ca) as a function of log(SL) to removethe fish size effect on the concentration of an elementin otoliths (Systat Software Inc 2006).
We performed one-way analysis of variance(ANOVA) to test for the effect of the water massgroup on individual log-transformed element ratios inotoliths (α=0.01) (SPSS, Inc 2002). Although wewould have preferred to use a nested ANOVA to
account for within-group variability in individualelemental abundances due to station (i.e., water massdefined by the CTD cast data at an individual station)differences, the dataset was unsuitable because 10 ofthe 24 stations were represented by only one otolith,including all but one of the stations from centralCalifornia. The Tukey’s honestly significant differ-ence (HSD) test was used to detect a posterioridifferences among means (α=0.01).
We used PCA to examine whether variabilityamong the 7-element signatures of otoliths showednatural groupings by water mass. Otoliths withexcluded data from all three sample spots for at leastone of the seven elements were not included in thePCA.
To test whether the elemental signature of otolithsidentified water mass membership, we used canonicaldiscriminant function analysis (DFA) (SPSS Inc2002). The DFA included only the elements thatshowed significant differences among water massesas determined in the ANOVA. In comparison to thePCA, the DFA was run on an expanded subset ofotoliths that had readings of the elements whichshowed a water mass grouping effect regardless ofwhether abundances of the other elements could beestimated.
The classification accuracy of each DFA wasevaluated by leave-one-out cross-validation, alsocalled jack-knife reclassification (SPSS Inc 2002;White and Ruttenberg 2007). The prior probabilitiesof group membership were assumed to be uniform.We used the randomization test ofWhite and Ruttenberg(2007) to estimate the probability (p-value) that theobserved jack-knife reclassification success rate wasdrawn from a null distribution of jack-knife values(n=5,000 randomizations) given no difference amonggroups of samples.
We examined relationships between element abun-dances in the otolith and relationships between otolithelemental properties and T and S. We used thePearson correlation coefficient, r, to determine wheth-er otolith element abundances that were identified asthe best discriminators of the water mass groupingsco-varied (SPSS, Inc 2002). We estimated thecorrelation between the average otolith elementabundance at a station and the average T or S. If thecorrelation was significant, we used least squaresregression to model the relationship between T or S,the environmental predictor, and otolith log[element/
346 Environ Biol Fish (2010) 89:341–356
Ca], the dependent variable, by fitting a linearequation to the observed data (Systat SoftwareInc 2006).
Results
Water masses
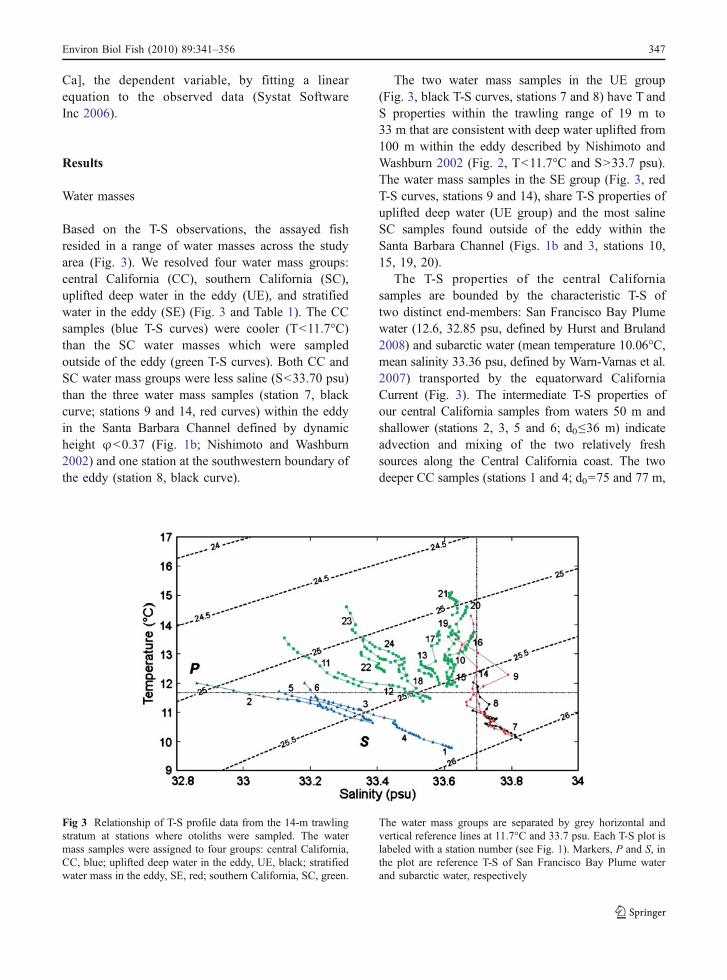
Based on the T-S observations, the assayed fishresided in a range of water masses across the studyarea (Fig. 3). We resolved four water mass groups:central California (CC), southern California (SC),uplifted deep water in the eddy (UE), and stratifiedwater in the eddy (SE) (Fig. 3 and Table 1). The CCsamples (blue T-S curves) were cooler (T<11.7°C)than the SC water masses which were sampledoutside of the eddy (green T-S curves). Both CC andSC water mass groups were less saline (S<33.70 psu)than the three water mass samples (station 7, blackcurve; stations 9 and 14, red curves) within the eddyin the Santa Barbara Channel defined by dynamicheight ϕ<0.37 (Fig. 1b; Nishimoto and Washburn2002) and one station at the southwestern boundary ofthe eddy (station 8, black curve).
The two water mass samples in the UE group(Fig. 3, black T-S curves, stations 7 and 8) have T andS properties within the trawling range of 19 m to33 m that are consistent with deep water uplifted from100 m within the eddy described by Nishimoto andWashburn 2002 (Fig. 2, T<11.7°C and S>33.7 psu).The water mass samples in the SE group (Fig. 3, redT-S curves, stations 9 and 14), share T-S properties ofuplifted deep water (UE group) and the most salineSC samples found outside of the eddy within theSanta Barbara Channel (Figs. 1b and 3, stations 10,15, 19, 20).
The T-S properties of the central Californiasamples are bounded by the characteristic T-S oftwo distinct end-members: San Francisco Bay Plumewater (12.6, 32.85 psu, defined by Hurst and Bruland2008) and subarctic water (mean temperature 10.06°C,mean salinity 33.36 psu, defined by Warn-Varnas et al.2007) transported by the equatorward CaliforniaCurrent (Fig. 3). The intermediate T-S properties ofour central California samples from waters 50 m andshallower (stations 2, 3, 5 and 6; d0≤36 m) indicateadvection and mixing of the two relatively freshsources along the Central California coast. The twodeeper CC samples (stations 1 and 4; d0=75 and 77 m,
Fig 3 Relationship of T-S profile data from the 14-m trawlingstratum at stations where otoliths were sampled. The watermass samples were assigned to four groups: central California,CC, blue; uplifted deep water in the eddy, UE, black; stratifiedwater mass in the eddy, SE, red; southern California, SC, green.
The water mass groups are separated by grey horizontal andvertical reference lines at 11.7°C and 33.7 psu. Each T-S plot islabeled with a station number (see Fig. 1). Markers, P and S, inthe plot are reference T-S of San Francisco Bay Plume waterand subarctic water, respectively
Environ Biol Fish (2010) 89:341–356 347
respectively) and UE group are different “deep” watermasses; although similar in temperature, the two CCsamples are less saline than the UE group.
PCA of the T-S profile data was consistent with thedistribution of water masses (i.e., T-S curves in Fig 3).The first two principal components, PC1 and PC2,explained 97% of the variance among the water masssamples (data not shown). PC1 separated CC samplesfrom the southern California samples (SC, UE, and
SE). PC2 separated the eddy samples, UE and SE,from SC. PC 3, which explained 2% of the variance,separated SE from UE, SC, and CC.
Relationships between otolith signaturesand water masses
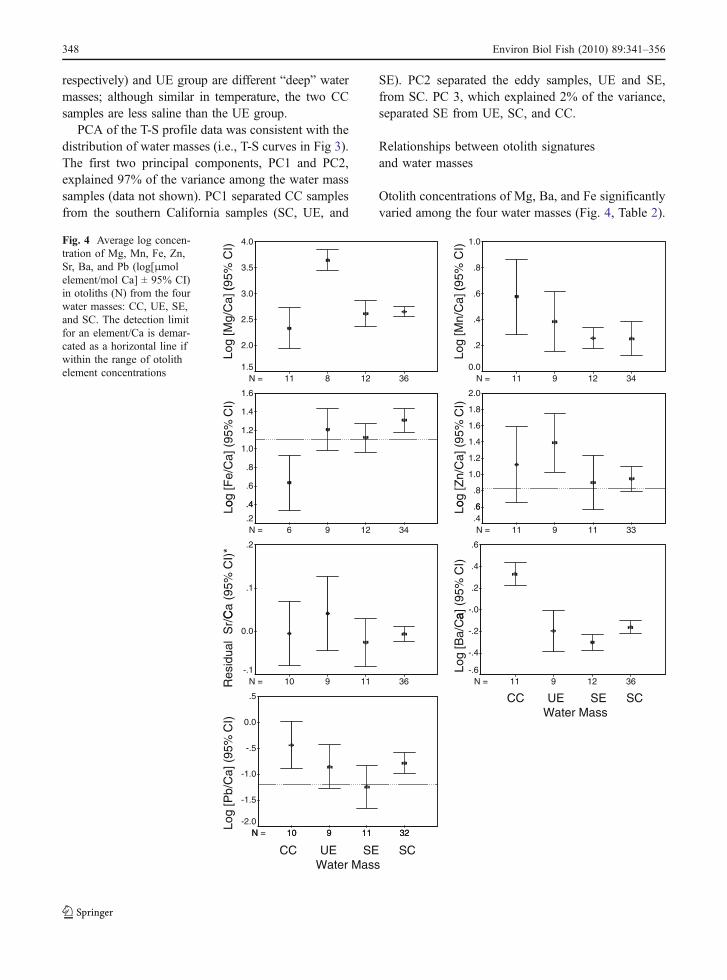
Otolith concentrations of Mg, Ba, and Fe significantlyvaried among the four water masses (Fig. 4, Table 2).
1.0
.8
4.0
3.5
(95%
CI)
(95%
CI)
3412911N =
.6
.4
.2
0.03612811N =
3.0
2.5
2.0
1.5
2.01.6
Log
[Mn/
Ca]
(
Log
[Mg/
Ca]
(
1.8
1.6
1.4
1.2
1.0
.8
6
1.4
1.2
1.0
.8
.6
.4og [F
e/C
a] (
95%
CI)
og [Z
n/C
a] (
95%
CI)
3311911N =
.6
.4341296N =
.4
.2
.6
.4
.2
-.0
.2
.1
a] (
95%
CI)
Lo Lo
Ca
(95%
CI)
*
3612911N =
-.2
-.4
-.63611910N =
0.0
-.1
.5
I)
Log
[Ba/
Ca
Res
idua
l S
r/C
CC UE SE SCWater Mass
3211910N
0.0
-.5
-1.0
-1.5
-2.0Log
[Pb/
Ca]
(95
% C
3211910N =
CC UE SE SCWater Mass
Fig. 4 Average log concen-tration of Mg, Mn, Fe, Zn,Sr, Ba, and Pb (log[μmolelement/mol Ca] ± 95% CI)in otoliths (N) from the fourwater masses: CC, UE, SE,and SC. The detection limitfor an element/Ca is demar-cated as a horizontal line ifwithin the range of otolithelement concentrations
348 Environ Biol Fish (2010) 89:341–356
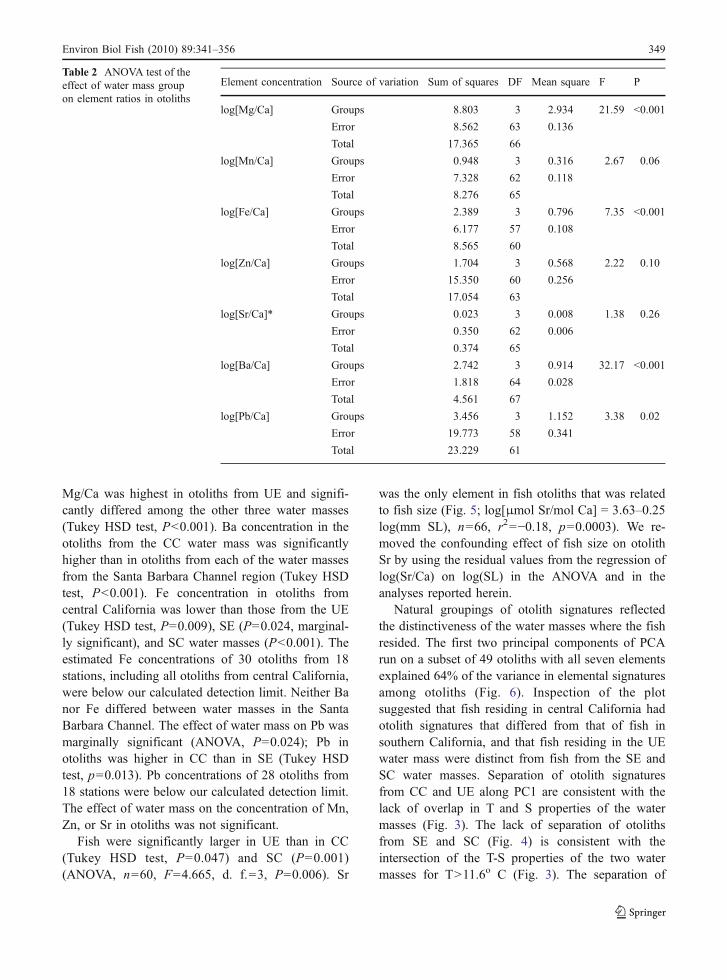
Mg/Ca was highest in otoliths from UE and signifi-cantly differed among the other three water masses(Tukey HSD test, P<0.001). Ba concentration in theotoliths from the CC water mass was significantlyhigher than in otoliths from each of the water massesfrom the Santa Barbara Channel region (Tukey HSDtest, P<0.001). Fe concentration in otoliths fromcentral California was lower than those from the UE(Tukey HSD test, P=0.009), SE (P=0.024, marginal-ly significant), and SC water masses (P<0.001). Theestimated Fe concentrations of 30 otoliths from 18stations, including all otoliths from central California,were below our calculated detection limit. Neither Banor Fe differed between water masses in the SantaBarbara Channel. The effect of water mass on Pb wasmarginally significant (ANOVA, P=0.024); Pb inotoliths was higher in CC than in SE (Tukey HSDtest, p=0.013). Pb concentrations of 28 otoliths from18 stations were below our calculated detection limit.The effect of water mass on the concentration of Mn,Zn, or Sr in otoliths was not significant.
Fish were significantly larger in UE than in CC(Tukey HSD test, P=0.047) and SC (P=0.001)(ANOVA, n=60, F=4.665, d. f.=3, P=0.006). Sr
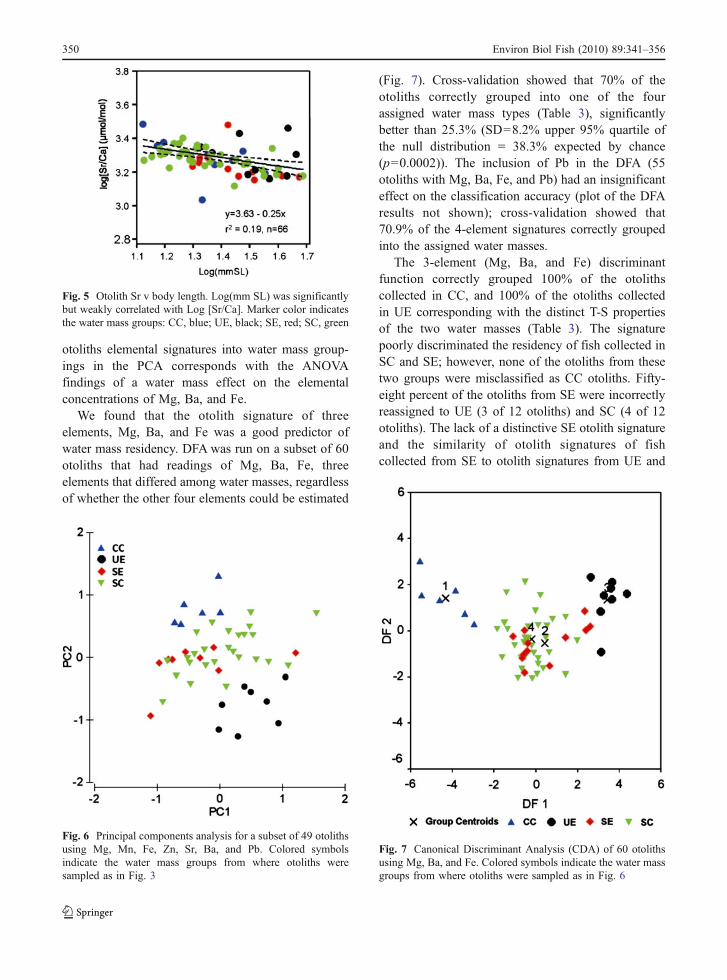
was the only element in fish otoliths that was relatedto fish size (Fig. 5; log[μmol Sr/mol Ca] = 3.63–0.25log(mm SL), n=66, r2=−0.18, p=0.0003). We re-moved the confounding effect of fish size on otolithSr by using the residual values from the regression oflog(Sr/Ca) on log(SL) in the ANOVA and in theanalyses reported herein.
Natural groupings of otolith signatures reflectedthe distinctiveness of the water masses where the fishresided. The first two principal components of PCArun on a subset of 49 otoliths with all seven elementsexplained 64% of the variance in elemental signaturesamong otoliths (Fig. 6). Inspection of the plotsuggested that fish residing in central California hadotolith signatures that differed from that of fish insouthern California, and that fish residing in the UEwater mass were distinct from fish from the SE andSC water masses. Separation of otolith signaturesfrom CC and UE along PC1 are consistent with thelack of overlap in T and S properties of the watermasses (Fig. 3). The lack of separation of otolithsfrom SE and SC (Fig. 4) is consistent with theintersection of the T-S properties of the two watermasses for T>11.6o C (Fig. 3). The separation of
Element concentration Source of variation Sum of squares DF Mean square F P
log[Mg/Ca] Groups 8.803 3 2.934 21.59 <0.001
Error 8.562 63 0.136
Total 17.365 66
log[Mn/Ca] Groups 0.948 3 0.316 2.67 0.06
Error 7.328 62 0.118
Total 8.276 65
log[Fe/Ca] Groups 2.389 3 0.796 7.35 <0.001
Error 6.177 57 0.108
Total 8.565 60
log[Zn/Ca] Groups 1.704 3 0.568 2.22 0.10
Error 15.350 60 0.256
Total 17.054 63
log[Sr/Ca]* Groups 0.023 3 0.008 1.38 0.26
Error 0.350 62 0.006
Total 0.374 65
log[Ba/Ca] Groups 2.742 3 0.914 32.17 <0.001
Error 1.818 64 0.028
Total 4.561 67
log[Pb/Ca] Groups 3.456 3 1.152 3.38 0.02
Error 19.773 58 0.341
Total 23.229 61
Table 2 ANOVA test of theeffect of water mass groupon element ratios in otoliths
Environ Biol Fish (2010) 89:341–356 349
otoliths elemental signatures into water mass group-ings in the PCA corresponds with the ANOVAfindings of a water mass effect on the elementalconcentrations of Mg, Ba, and Fe.
We found that the otolith signature of threeelements, Mg, Ba, and Fe was a good predictor ofwater mass residency. DFA was run on a subset of 60otoliths that had readings of Mg, Ba, Fe, threeelements that differed among water masses, regardlessof whether the other four elements could be estimated
(Fig. 7). Cross-validation showed that 70% of theotoliths correctly grouped into one of the fourassigned water mass types (Table 3), significantlybetter than 25.3% (SD=8.2% upper 95% quartile ofthe null distribution = 38.3% expected by chance(p=0.0002)). The inclusion of Pb in the DFA (55otoliths with Mg, Ba, Fe, and Pb) had an insignificanteffect on the classification accuracy (plot of the DFAresults not shown); cross-validation showed that70.9% of the 4-element signatures correctly groupedinto the assigned water masses.
The 3-element (Mg, Ba, and Fe) discriminantfunction correctly grouped 100% of the otolithscollected in CC, and 100% of the otoliths collectedin UE corresponding with the distinct T-S propertiesof the two water masses (Table 3). The signaturepoorly discriminated the residency of fish collected inSC and SE; however, none of the otoliths from thesetwo groups were misclassified as CC otoliths. Fifty-eight percent of the otoliths from SE were incorrectlyreassigned to UE (3 of 12 otoliths) and SC (4 of 12otoliths). The lack of a distinctive SE otolith signatureand the similarity of otolith signatures of fishcollected from SE to otolith signatures from UE and
Fig. 6 Principal components analysis for a subset of 49 otolithsusing Mg, Mn, Fe, Zn, Sr, Ba, and Pb. Colored symbolsindicate the water mass groups from where otoliths weresampled as in Fig. 3
Fig. 5 Otolith Sr v body length. Log(mm SL) was significantlybut weakly correlated with Log [Sr/Ca]. Marker color indicatesthe water mass groups: CC, blue; UE, black; SE, red; SC, green
Fig. 7 Canonical Discriminant Analysis (CDA) of 60 otolithsusing Mg, Ba, and Fe. Colored symbols indicate the water massgroups from where otoliths were sampled as in Fig. 6
350 Environ Biol Fish (2010) 89:341–356
SC (Figs. 4, 6 and 7) are consistent with the mixedwater mass properties of SE (Fig. 3).
The strength in discriminating otoliths from thedifferent water masses was associated with trends of
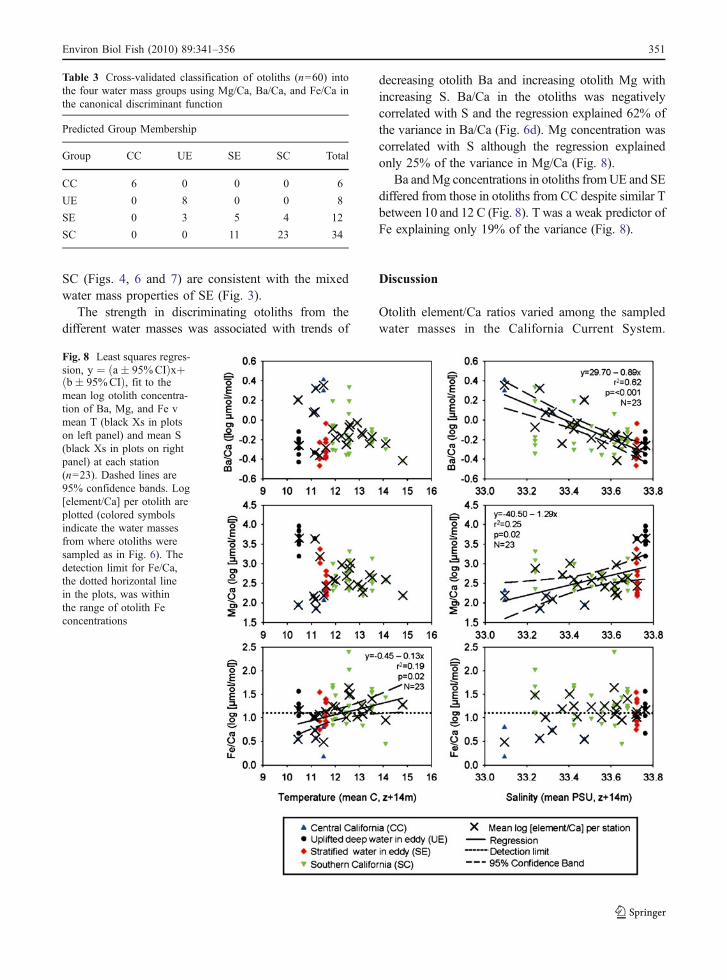
decreasing otolith Ba and increasing otolith Mg withincreasing S. Ba/Ca in the otoliths was negativelycorrelated with S and the regression explained 62% ofthe variance in Ba/Ca (Fig. 6d). Mg concentration wascorrelated with S although the regression explainedonly 25% of the variance in Mg/Ca (Fig. 8).
Ba andMg concentrations in otoliths fromUE and SEdiffered from those in otoliths from CC despite similar Tbetween 10 and 12 C (Fig. 8). T was a weak predictor ofFe explaining only 19% of the variance (Fig. 8).
Discussion
Otolith element/Ca ratios varied among the sampledwater masses in the California Current System.
Table 3 Cross-validated classification of otoliths (n=60) intothe four water mass groups using Mg/Ca, Ba/Ca, and Fe/Ca inthe canonical discriminant function
Predicted Group Membership
Group CC UE SE SC Total
CC 6 0 0 0 6
UE 0 8 0 0 8
SE 0 3 5 4 12
SC 0 0 11 23 34
Fig. 8 Least squares regres-sion, y ¼ a� 95%CIð Þxþb� 95%CIð Þ, fit to themean log otolith concentra-tion of Ba, Mg, and Fe vmean T (black Xs in plotson left panel) and mean S(black Xs in plots on rightpanel) at each station(n=23). Dashed lines are95% confidence bands. Log[element/Ca] per otolith areplotted (colored symbolsindicate the water massesfrom where otoliths weresampled as in Fig. 6). Thedetection limit for Fe/Ca,the dotted horizontal linein the plots, was withinthe range of otolith Feconcentrations
Environ Biol Fish (2010) 89:341–356 351
Examining the variability in otolith chemistry inrelation to temperature and salinity allowed us to notonly distinguish fish from geographically distantregions with contrasting oceanographic conditionsbut also to discriminate fish that resided in differentwater mass environments that were associated with alocal, physical phenomenon —cyclonic eddy circula-tion in the Santa Barbara Channel. We found that Ba,Mg, and Fe varied significantly among the distin-guishable water masses that we sampled. Fish fromcentral California had elevated otolith Ba/Ca com-pared with fish from southern California. In contrast,otolith Fe/Ca was elevated in fish from southernCalifornia compared to fish from central California.Otolith Mg/Ca was highest in fish collected from deepwater uplifted to shallow depths by cyclonic eddycirculation in the Santa Barbara Channel and lowestin fish from central California. The 3-elementsignature correctly predicted the residency of 100%of the fish collected in the cold core of the eddy in theSanta Barbara Channel and separated 100% of thefish collected in the Channel region from fishcollected from Central California.
Two of the three elements, Ba/Ca and Mg/Ca, havebeen useful for distinguishing fish from differentcoastal and oceanic locations of other studies. Fe/Cais typically excluded from otolith microchemistryanalyses, because uncertainty in element abundanceestimates is assumed to be high for signals belowdetection limits (Campana 1999). However, Ben-Tzviet al. (2007) found that LA-ICPMS element/Cameasurements that would be discarded as noise usingconventional DL standards (e.g., 3×SD) often formedsequences that were symmetrical about the otolithcore (palindrome). Considering their argument thatthese sub-DL signals can contain valuable informa-tion, we included sub-DL signals of Fe/Ca and otherelements in our analyses.
We found that otolith Ba/Ca was negatively correlat-ed with salinity of the water mass occupied by the wild-caught fish (Fig. 8). We did not measure elementalconcentrations in water mass samples; however, wesurmise that ambient Ba/Ca was negatively associatedwith salinity and that otolith Ba/Ca reflected theavailability of Ba/Ca. Laboratory and field studieshave determined that otolith Ba/Ca correlates withambient Ba/Ca (Bath et al. 2000; Elsdon and Gillanders2003, 2005b). Compared to the influence of ambientBa/Ca, the effect of ambient temperature and salinity
on otolith Ba/Ca has been shown to be minimal (Bathet al. 2000; Elsdon and Gillanders 2004, 2005b).Elsdon and Gillanders (2005a) attributed the inverserelationship between otolith Ba/Ca of black bream andambient salinity in estuarine and coastal environmentsof southern Australia to the input of Ba from fluvialsediments in freshwater runoff. In the SouthernCalifornia Bight, ambient Ba/Ca in estuarine waters(about 6 μmol·mol−1) were higher than coastal waters(about 3 to 5 μmol·mol−1) among several studies thatwere not conducted during our survey year (Forrester2005; Warner et al. 2005; Lloyd et al. 2008). In a three-year study off central California, Brown (2006) foundthat whole otolith Ba/Ca of two flatfish species alongcentral California was highest in 1998 (the year of ourcollections) and lowest in 1999, in correspondencewith runoff levels.
River runoff is the major source of Ba to coastalwaters (Chan et al. 1977) and may have contributedsubstantially to the Ba load off Central Californiaduring our study. Increased precipitation in Californiaand coastal runoff are frequently associated withstrong El Niño events, and the winter of 1997–1998,when an exceptionally strong El Niño was fullydeveloped, was one of the wettest seasons on record.The impact of sediment and freshwater transport innearshore waters from coastal watersheds was spatial-ly extensive in satellite imagery during the winter andspring of 1998 (Mertes and Warrick 2001). Oceano-graphic surveying with the collection of the centralCalifornia specimens indicate that outflow from theSan Francisco Bay, draining the largest watershed ofCalifornia, generated a markedly low salinity signalthat extended 100 km down the central Californiacoast to Monterey Bay (Sakuma et al. 2000). Highturbidity and elevated nutrient levels were correlatedwith low salinity in Monterey Bay providing evidencethat low salinity in the upper 15–20 m was the resultof local and remote runoff and river outflow in 1998(Friederich et al. 2002). The concentrations of sometrace elements, Ba was not among the elementsmeasured, have been found to be higher in the SanFrancisco Bay plume than in coastal and upwelledwaters (Hurst and Bruland 2008).
Elevated Ba/Ca in otoliths and invertebrate hardparts has been associated with upwelling (Lea et al.1989; Patterson et al. 1999; Zacherl 2005; Brown2006) and deep water (Zumholz et al. 2007).Dissolved Ba in oceanic waters shows a nutrient-like
352 Environ Biol Fish (2010) 89:341–356
distribution with very low concentrations in surfacewaters and higher values in deep water (Chan et al.1977). In the Santa Barbara Channel, upwellingwithin the cyclonic eddy is a mechanism that candraw up nutrient-rich waters from below the thermo-cline into shallower depths where the juvenile fishwere sampled; however, otolith Ba/Ca within thecyclonic eddy was not significantly higher than thatoutside of the eddy (Fig. 7). Bograd and Lynn (2001)regarded the depth of the 12°C isotherm a reliableproxy for the nutricline depth in the SouthernCalifornia Bight and Santa Barbara Channel. Figure 3suggests that the nutricline was uplifted within thecore of the eddy; however, it is plausible that variationin ambient Ba did not significantly affect otolith Baamong the three water masses in southern California.Warner et al. (2005) found no correspondencebetween the concentrations of Ba in seawater andBa in otoliths of adult or embryonic larval kelprockfish (Sebastes atrovirens) from nearshore reefswithin our southern California study region.
An alternate, plausible mechanism that would limitotolith Ba/Ca in the fish from the core of the eddy islocalized Ba depletion from rapid plankton productionin the euphotic zone where the fish were residing.Lochte and Pfannkuche (1987) observed nutrientdepletion in the upper 50 m within the center of acyclonic eddy. They proposed that the physicalisolation of eddy surface waters due to the formationof a shallow thermocline lead to rapid utilization ofnutrients. Off the Baja California coast, the waningstages of an upwelling-induced phytoplankton bloomwere associated with Ba depletion in surface waters(Esser and Volpe 2002). The relationship between Baremoval from surface seawater, uptake by differentorganisms, and biological productivity are poorlyunderstood and beyond the scope of this discussion.
In contrast to otolith Ba/Ca, Mg/Ca was relativelylow in otoliths of fish from central California, wherethe waters were freshest in our study area, and highestin otoliths of fish residing in the core of the eddy,where waters were the most saline (Figs. 4 and 8).Unlike Ba which has a nutrient-like vertical distribu-tion in the ocean, Mg, like Ca, has generally aconservative distribution and is present at relativelyhigh concentration levels in constant proportion tosalinity (Nozaki 1997). Ratios of conservative ele-ments, Mg/Ca for example, are not expected to varysignificantly in seawater (Lea et al. 1999). Rivers
contribute Mg to coastal areas (Tipper et al. 2006);however, it is likely that the input of Mg fromfreshwater runoff would be swamped out by theconcentration of Mg in seawater, which is about fivetimes higher than Ca in seawater. Substantial differ-ences in ambient Mg/Ca among the water masses wesampled seem unlikely, so variation in otolith Mg/Caprobably is due to other factors.
A large body of studies shows that Mg/Ca is usefulfor discriminating fish from different open coastal andoceanic locations exposed to water masses. For exam-ple, in nearshore coastal waters along Washington andOregon, Miller and Shanks (2004) found that Mg/Cawas the most important discriminator among a suite ofelements for assigning juvenile rockfish to theircollection locations. Mg is one of the most importantelements in otoliths separating fish from deepwaterareas. Swan et al. (2006) found that Mg along withPb were important for differentiating deep waterfish stocks of the European hake, Merlucciusmerluccius, in the northeastern Atlantic. The otolithchemistry results were consistent with the treatmentof a northern stock west of Norway and a southernstock off Portugal that were separated by anoceanographic and bathymetric feature, the Bay ofBiscay. Ashford et al. (2005) used Mg along withBa, Mn, and Sr in otoliths of deep-water Patagoniantoothfish to successfully distinguish fish collectedoff South America from fish collected south of thesubantarctic front in the Atlantic, Indian, and Pacificregions of the Southern Ocean.
The effects of ambient Mg/Ca on otolith Mg/Caand the effects of salinity and temperature on Mguptake are unclear. We found that otolith Mg/Ca wasweakly correlated with S and not related to T. Most ofthe experimental studies have found no effect ofsalinity on otolith Mg/Ca (Fowler et al. 1995b; Hoffand Fuiman 1995; Martin and Thorrold 2005). Fowleret al. (1995a) found that Mg and Ca were moreabundant in the whole otoliths of fish in low-temperature treatments. In contrast, in experimentalmanipulations of salinity and temperature, Martin andThorrold (2005) observed that the uptake rate of Mgin otoliths increased with increasing temperature(although the relationship was not statistically signif-icant) while ambient Mg/Ca did not vary among thetreatments. With exception of Martin and Thorrold(2005), the limitation of most of the experimentalstudies was that dilution of a single natural water
Environ Biol Fish (2010) 89:341–356 353
mass or artificial seawater was used to manipulatesalinity, and neither ambient Mg/Ca nor the effect ofdilution on ambient Mg/Ca were measured in themajority of studies. The effect of ambient Mg/Ca onotolith Mg/Ca and possible interactions with ambienttemperature and salinity is yet to be rigorouslytested.
It is arguable whether ambient Mg/Ca actually has aneffect on otolith Mg/Ca, because Mg is under strictosmoregulatory control (Campana 1999). Elsdon andGillanders (2002) found that Mg/Ca showed little or noeffects due to temperature or salinity and variedconsiderably among individuals within temperatureand salinity treatments. Endogenous controls wouldvary among individuals due to genetics, ontogeny,condition, metabolism, and somatic growth. Mg/Cawas highest in otoliths from UE where fish were largerthan fish from CC or SC; however, Mg/Ca tended tobe relatively low in otoliths from CC where fish werenot the smallest among water masses. Ontogeneticdifferences may account for some of the variance inMg/Ca observed among water masses. Fowler et al.(1995a, b) found that Mg in whole otoliths varied withontogeny. Martin and Thorrold (2005) showed thatuptake rate of Mg in otoliths and otolith Mg/Ca wasrelated to otolith precipitation and somatic growth,which is often highly correlated with temperature in thefield. If endogenous control of otolith Mg/Ca is notmeasurably mediated by ambient Mg, temperature, and/or salinity from the environment, then otolith Mg/Camay not be a reliable indicator of water mass residency,but rather a useful discriminator for the separation ofpopulations that have unique physiological traits med-itated by genetics, growth, and condition.
It is tempting to speculate that otolith Mg/Ca was agood discriminator of the fish residing in the differentwater masses that we sampled, because the populationof young-of-year fish within each water mass pos-sessed unique intrinsic characteristics. Oceanographicprocesses that determined circulation patterns alongwith behaviors such as swimming capability, temper-ature or depth preferences, and schooling may havecontributed to the isolation of these pelagic juvenilefish populations.
In conclusion, we found that otolith chemistry wasa good predictor of water mass residency. Variabilityin otolith chemistry reflected the spatial patterns ofboth horizontal gradients and vertical gradients inwater mass properties related to circulation. Neither
ambient temperature nor salinity must necessarilyrelate to otolith chemistry in order to be useful fordiscriminating fish from different water masses;rather, we suggest that temperature and salinity areuseful as identifiers of distinct water masses that areassociated with unique otolith elemental signature inthe residing fish. We found it sufficient to use onlytemperature and salinity to discriminate among watermasses; however, utilizing other parameters such as02 and nutrients (often measured in oceanographicsurveys) will likely improve our ability to identifywater masses and refine future investigations of thiskind. If shown to be reliable (i.e., temporallyconsistent), then the development of a reference oratlas of water mass-specific otolith elemental signa-tures is promising. Potentially, the use of an atlas ofwater mass-specific otolith signatures with water massmonitoring and current mapping could greatly reducethe uncertainty surrounding reconstructions of larvaland adult movements and connectivity estimatesamong locations such as spawning and nursery areasand marine reserves.
Acknowledgements This work was funded by NOAA Grant# NA06RG0142, California Sea Grant College ProgramProject # R/CZ-178, through NOAA’s National Sea GrantCollege Program, U.S. Dept. of Commerce. The micro-chemistry facility was supported in part by the Partnershipfor the Interdisciplinary Study of Coastal Oceans funded bythe David and Lucile Packard Foundation. California ArtificialReef Enhancement Foundation provided additional matchingfunds. MMN received support from the U.S. MineralsManagement Service. We thank D. Lea for providing ICPMSlaboratory resources, and M. Sheehy for guidance on otolithmicrochemistry procedures. We thank K. Sakuma for otolithsamples and the catch and oceanographic data from NOAA’scentral California surveys (NMFS/SWFSC, Santa Cruz, CA).Funding for the southern California trawling survey wasprovided by the Biological Resources Division of the U.S.Geological Survey under cooperative agreement 1445-CA09-95-0836. The California Department of Fish and Gameprovided the midwater trawl net. E. Cheng and A. Muto,high school interns in the UCSB Research MentorshipSummer Program, assisted in the laboratory. We thank S.Ralston, M. Carr, and anonymous reviewers for their usefulcomments on the manuscript. The statements, findings,conclusions and recommendations are those of the authorsand do not necessarily reflect the views of California Sea Grantor the U.S. Dept. of Commerce.
Open Access This article is distributed under the terms of theCreative Commons Attribution Noncommercial License whichpermits any noncommercial use, distribution, and reproductionin any medium, provided the original author(s) and source arecredited.
354 Environ Biol Fish (2010) 89:341–356
References
Ashford JR, Jones CM, Hofmann E, Everson I, Moreno C,Duhamel G, Williams R (2005) Can otolith elementalsignatures record the capture site of Patagonian toothfish(Dissostichus eleginoides), a fully marine fish in theSouthern Ocean? Can J Fish Aquat Sci 62:2832–2840
Bath G, Thorrold SR, Jones CM, Campana SE, McLaren JW,Lam JWH (2000) Strontium and barium uptake inaragonitic otoliths of marine fish. Geochim CosmochimActa 64:1705–1714
Ben-Tzvi O, Abelson A, Gaines SD, Sheehy MS, Paradis GL,Kiflawi M (2007) The inclusion of sub-detection limitLAICPMS data, in the analysis of otolith microchemistry,by use of a palindrome sequence analysis (PaSA). LimnolOceanogr Methods 5:97–105
Bograd SJ, Lynn RJ (2001) Physical-biological coupling in theCalifornia current during the 1997–99 El Niño-La Niñacycle. Geophys Res Lett 28:275–278
Brown JA (2006) Classification of juvenile flatfishes to estuarineand coastal habitats based on the elemental composition ofotoliths. Estuar Coast Shelf Sci 66:594–611
Campana SE (1999) Chemistry and composition of fishotoliths: pathways, mechanisms and applications. MarEcol Prog Ser 188:263–297
Campana SE, Chouinard GA, Hanson JM, Frechet A, Brattey J(2000) Otolith elemental fingerprints as biological tracersof fish stocks. Fish Res 46:343–357
Chan LH, Drummond D, Edmond JM, Grant B (1977) On thebarium data from the Atlantic GEOSECS expedition.Deep Sea Res 24(7):613–649
Dove SG, Kingsford MJ (1998) Use of otoliths and eye lensesfor measuring trace-metal incorporation in fishes: abiogeographic study. Mar Biol 130:377–387
Elsdon TS, Gillanders BM (2002) Interactive effects oftemperature and salinity on otolith chemistry: challengesfor determining environmental histories of fish. Can J FishAquat Sci 59:1796–1808
Elsdon TS, Gillanders BM (2003) Relationship between water andotolith elemental concentrations in juvenile black breamAcanthopagrus butcheri. Mar Ecol Prog Ser 260:263–272
Elsdon TS, Gillanders BM (2004) Fish otolith chemistryinfluenced by exposure to multiple environmental varia-bles. J Exp Mar Biol Ecol 313:269–284
Elsdon TS, Gillanders BM (2005a) Alternative life-historypatterns of estuarine fish: barium in otoliths elucidatesfreshwater residency. Can J Fish Aquat Sci 62:1143–1152
Elsdon TS, Gillanders BM (2005b) Consistency of patternsbetween laboratory experiments and field collected fish inotolith chemistry: an example and applications for salinityreconstructions. Mar Freshw Res 56:609–617
Esser BK, Volpe AM (2002) At-sea high-resolution chemicalmapping: extreme barium depletion in North Pacificsurface water. Mar Chem 79:67–79
FitzGerald JL, Thorrold SR, Bailey KM, Brown AL, SeverinKP (2004) Elemental signatures in otoliths of larvalwalleye pollock (Theragra chalcogramma) from thenortheast Pacific Ocean. Fish Bull 102:604–616
Forrester GE (2005) A field experiment testing for correspon-dence between trace elements in otoliths and the environ-
ment and for evidence of adaptation to prior habitats.Estuaries 28:974–981
Fowler AJ, Campana SE, Jones CM, Thorrold SR (1995a)Experimental assessment of the effect of temperature andsalinity on the elemental composition of otoliths usingsolution-based ICPMS. Can J Fish Aquat Sci 52:1421–1430
Fowler AJ, Campana SE, Jones CM, Thorrold SR (1995b)Experimental assessment of the effect of temperature andsalinity on the elemental composition of fish otoliths usinglaser ablation ICPMS. Can J Fish Aquat Sci 52:1431–1441
Friederich G, Walz P, Burczynski M, Chavez FP (2002)Inorganic carbon in the central California upwellingsystem during the 1997–1999 El Nino-La Nina event.Prog Oceanogr 54:185–203
Gillanders BM (2002) Temporal and spatial variability inelemental composition of otoliths: implications for deter-mining stock identity and connectivity of populations. CanJ Fish Aquat Sci 59(4):669–679
Hamer PA, Jenkins GP, Gillanders BM (2003) Otolith chem-istry of juvenile snapper Pagrus auratus in Victorianwaters: natural chemical tags and their temporal variation.Mar Ecol Prog Ser 263:261–273
Hamilton SL, Regetz J, Warner RR (2008) Postsettlementsurvival linked to larval life in a marine fish. Proc NatAcad Sci USA 105:1561–1566
Hoff GR, Fuiman LA (1995) Environmentally induced varia-tion in elemental composition of red drum (Scianopsocellatus) otoliths. Bull Mar Sci 56:578–591
Hurst MP, Bruland KW (2008) The effects of the San Francisco Bayplume on trace metal and nutrient distributions in the Gulf ofthe Farallones. Geochim Cosmochim Acta 72:395–411
Lea DW, Shen GT, Boyle EA (1989) Coralline barium recordstemporal variability in equatorial Pacific upwelling. Nature340:373–376
Lea DW, Mashiotta TA, Spero HJ (1999) Controls onmagnesium and strontium uptake in planktonic foraminif-era determined by live culturing. Geochim CosmochimActa 63:2369–2379
Lloyd DC, Zacherl DC, Walker S, Paradis G, Sheehy M,Warner RR (2008) Egg source, temperature and cultureseawater affect elemental signatures in Kelletia kelletiilarval statoliths. Mar Ecol Prog Ser 353:115–130
Lochte K, Pfannkuche O (1987) Cyclonic cold-core eddy in theeastern North Atlantic. II. Nutrients, phytoplankton andbacterioplankton. Mar Ecol Prog Ser 39:153–164
Love MS, Yoklavich M, Thorsteinson L (2002) The rockfishesof the northeast Pacific. University of California Press,Berkeley, p 404
Martin GB, Thorrold SR (2005) Temperature and salinityeffects on magnesium, manganese, and barium incorpora-tion in otoliths of larval and early juvenile spot Leiostomusxanthurus. Mar Ecol Prog Ser 293:223–232
Mertes LAK, Warrick JA (2001) Measuring flood output from110 coastal watersheds in California with field measure-ments and SeaWiFS. Geology 29:659–662
Miller JA, Shanks AL (2004) Evidence for limited larvaldispersal in black rockfish (Sebastes melanops): implica-tions for population structure and marine reserve design.Can J Fish Aquat Sci 61:1723–1735
Milton DA, Chenery SR, Farmer MJ, Blaber SJM (1997)Identifying the spawning estuaries of the tropical shad,
Environ Biol Fish (2010) 89:341–356 355
terubok Tenualosa toli, using otolith microchemistry. MarEcol Prog Ser 153:283–291
Nishimoto MM, Washburn L (2002) Patterns of coastal eddycirculation and abundance of pelagic juvenile fish in theSanta Barbara Channel, California, USA. Mar Ecol ProgSer 241:183–199
Nozaki Y (1997) A fresh look at element distribution in the NorthPacific Ocean. EOS Trans Am Geophys Union 78(21):221
Patterson HM, Thorrold SR, Shenker JM (1999) Analysis ofotolith chemistry in Nassau grouper (Epinephelus striatus)from the Bahamas and Belize using solution-basedICP-MS. Coral Reefs 18:171–178
Pearce NJG, Perkins WT, Westgate JA, Gorton MJ, JacksonSE, Neal CR, Chenery SP (1997) A compilation of newand published major and trace element data for NIST SRM610 and NIST SRM 612 glass reference materials. Geo-standard Newslett 21:115–144
Ruttenberg BI, Hamilton SL, Hickford MJH, Paradis GL et al(2005) Elevated levels of trace elements in cores ofotoliths and their potential for use as natural tags. MarEcol Prog Ser 297:273–281
Sakuma KM, Schwing FB, Pickett MH, Roberts D, Ralston S(2000) The physical oceanography off the central Californiacoast during May–June 1998: a summary of CTD data frompelagic juvenile rockfish surveys. US Dep Commer NOAATech Memo, NOAA-TM-NMFS-SWFSC 297:1–77
Secor DH, Henderson-Arzapalo A, Piccoli PM (1995) Canotolith microchemistry chart patterns of migration andhabitat utilization in anadromous fishes? J Exp Mar BiolEcol 192:15–33
SPSS Inc (2002) SPSS for Windows. Release 11.5.0Standish JD, Sheehy M, Warner RR (2008) Use of otolith natal
elemental signatures as natural tags to evaluate connectiv-ity among open-coast fish populations. Mar Ecol Prog Ser356:259–268
Swan SC, Geffen AJ, Morales-Nin B, Gordon JDM, ShimmieldT, Sawyer T, Massutı E (2006) Otolith chemistry: an aid tostock separation of Helicolenus dactylopterus (bluemouth)
and Merluccius merluccius (European hake) in theNortheast Atlantic and Mediterranean. ICES J Mar Sci63:504–513
Swearer SE, Caselle JE, Lea DW, Warner RR (1999) Larvalretention and recruitment in an island population of a coralreef fish. Nature 402:799–802
Systat Software Inc (2006) SigmaPlot for Windows Version 10.0Thorrold SR, Latkoczy C, Swart PK, Jones CM (2001) Natal
homing in a marine fish metapopulation. Science291:297–299
Tipper ET, Galy A, Gaillardet J, Bickle MJ, Elderfield H,Carder EA (2006) The magnesium isotope budget of themodern ocean: constraints from riverine magnesiumisotope ratios. Earth Planet Sci Lett 250:241–253
Warner RR, Swearer SE, Caselle JE, Sheehy M, Paradis G(2005) Natal trace-elemental signatures in the otoliths ofan open-coast fish. Limnol Oceanogr 50:1529–1542
Warn-Varnas A, Gangopadhyay A, Hawkins JA (2007) Watermasses in the Monterey Bay during the summer of 2000.Cont Shelf Res 27:1379–1398
White JW, Ruttenberg BI (2007) Discriminant function analysisin marine ecology: some common oversights and theirsolutions. Mar Ecol Prog Ser 329:301–305
Wyllie Echeverria T, Lenarz WH, Reilly CA (1990) Survey ofthe abundance and distribution of pelagic young-of-the-year rockfishes, Sebastes, off central California. US DepCommer NOAATech Memo, NOAA-TM-NMFS-SWFSC147:1–125
Zacherl DC (2005) Spatial and temporal variation in statolithand protoconch trace elements as natural tags to tracklarval dispersal. Mar Ecol Prog Ser 290:145–163
Zacherl DC, Paradis G, Lea D (2003) Ba and Sr uptake into larvalprotoconchs and statoliths of the marine neogastropodKelletia kelletii. Geochim Cosmochim Acta 67:4091–4099
Zumholz K, Klugel A, Hansteen T, Piatkowski U (2007)Statolith microchemistry traces the environmental historyof the boreoatlantic armhook squid Gonatus fabricii. MarEcol Prog Ser 333:195–204
356 Environ Biol Fish (2010) 89:341–356