Embed Size (px)
Citation preview
Our Abstinence-Based Curriculum and other Stories from Statistical Education
Nov 10, 2010
2010KaplanASA-Mn6up.pdf 1
Our Abstinence-Based Curriculum and other Stories
from Statistics Education
Daniel Kaplan Macalester College St. Paul,
Minnesota, USA November 10, 2010
Abstract:
The subtitle might have been, “How religious fervor has shaped the way we teach statistics.” But this would mislead you into thinking about actual religion and contemporary disputes about evolution, sex education, and so on.
No, the talk will be about plain, old, everyday introductory statistics and the familiar topics that are studied: the t-test, one-and two-tailed tests, association vs. causation, etc.
The conventional choice of topics and approaches, it will be claimed, is based largely on honoring the faith of our statistical fathers and the quasi-theological disputes of old, and not on extracting useful information from the sorts of data commonly encountered today. With an eye toward curricular reformation, a few theses will be offered.
Austin Bradford Hill, Presidential AddressMeeting of the Royal Statistical Society, Section on Medicine on January 14, 1965
The Environment and Disease: Association or Causation
Hill on Association and Causation
“In what circumstances can we pass from this observed association to a verdict of causation? Upon what basis should we proceed to do so?” Provides nine (not ten!) “aspects of that association [that we should] especially consider before deciding that the most likely interpretation of it is causation.”
The number shows the amount he wrote on each aspect, in column inches.
5. Biological gradient – 5
9. Analogy -- 14. Temporality -- 28. Experiment – 23. Specificity -- 97. Coherence – 72. Consistency -- 20
6. Plausibility -- 51. Strength -- 16
Hill on Experiment
“Occasionally, it is possible to appeal to experimental, or semi-experimental, evidence. For example, because of an observed association some preventive action is taken. Does it in fact prevent? The dust in the workshop is reduced, lubricating oils are changed, persons stop smoking cigarettes. Is the frequency of the associated events affected? Here the strongest support for the causation hypothesis may be revealed.”
Hill on Tests of Significance
“… the litter of the t table diverts attention from the inadequacies of the fare. Only a tithe, and an unknown tithe, of the factory personnel volunteer for some procedure or interview. 20% of the patients treated in some particular way are lost to sight. 30% of a randomly-drawn sample are never contacted. The sample may, indeed, be akin to that of the man who, according to Swift, ‘had a mind to sell his house and carried a piece of brick in his pocket, which he showed as a pattern to encourage purchasers.’ ”
Our Abstinence-Based Curriculum and other Stories from Statistical Education
Nov 10, 2010
2010KaplanASA-Mn6up.pdf 2
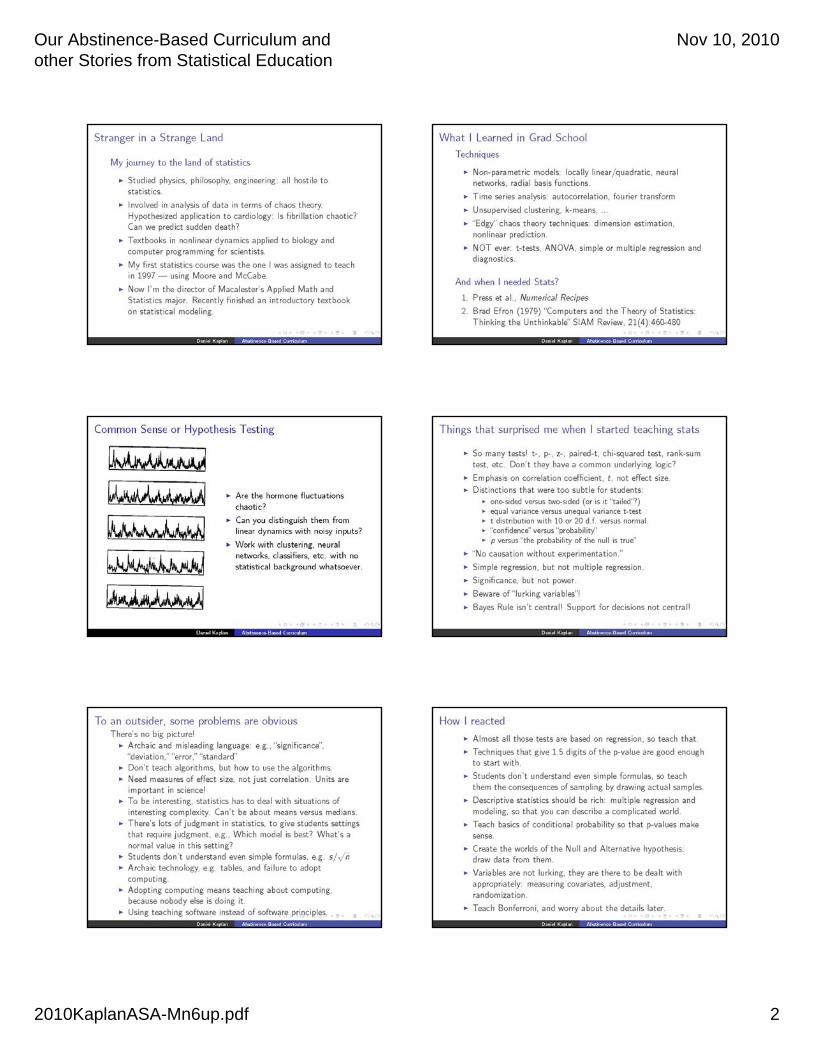
Stranger in a Strange Land
My journey to the land of statistics
Studied physics, philosophy, engineering: all hostile to statistics.
Involved in analysis of data in terms of chaos theory. Hypothesized application to cardiology: Is fibrillation chaotic? Can we predict sudden death?
Textbooks in nonlinear dynamics applied to biology and computer programming for scientists.
My first statistics course was the one I was assigned to teach in 1997 – using Moore and McCabe.
Now I'm the director of Macalester's Applied Math and Statistics major. Recently finished an introductory textbook on statistical modeling.
What I Learned in Grad School
Techniques
Non-parametric models: locally linear (quadratic neuralnetworks, radial basis functions.
Time series analysis: autocorrelation, Fourier transform
Unsupervised clustering, k-means
“Edgy” chaos theory techniques: dimension estimation, nonlinear prediction.
NOT EVER: t-test, ANOVA or multiple regression or diagnostics.
And when I needed Stats?
1. Press et al., Numerical Recipes
2. Brad Efron (1979) “Computers and the Theory of Statistics: Thinking the Unthinkable” SIAM Review 21(4)
Are the hormone fluctuationschaotic?
Can you distinguish them fromlinear dynamics with noisy inputs?
Work with clustering, neuralnetworks, classifiers, etc, with nostatistics background whatsoever.
Common Sense or Hypothesis TestingSo many tests! t-, p-, z-, paired-t, chi-squared, rank-sum.
Don’t they have a common underlying logic? Emphasis on correlation coefficient, t. Not effect size. Distinctions were too subtle for students
One-sided versus two-sided (or is it “tailed”?)Equal variance versus unequal variance t-distribution with 10 or 20 d.f. versus normal“confidence” versus “probability” p-value versus “probability that the null is true.”
“No causation without experimentation” Simple regression, but not multiple regression Significance, but not power Beware of “lurking variables”! Bayes Rule isn’t central!
Support for decisions not central!
Things that surprised me when I started teaching stats
Archaic and misleading language: e.g., “significance”,“deviation”, “error, “standard”
Don’t teach algorithms, but to use the algorithms.
Need measures of effect size, not just correlations.Units are important in science!
To be interesting, statistics has to deal with situations ofinteresting complexity. Can’t be about means vs. medians.
There’s lots of judgment in statistics, Need to givestudents settings that require judgment, e.g. Which modelis best? What’s a normal value in this setting?
Students don’t understand even simple formulas: s/sqrt(n)
Archaic technology, e.g., tables, failure to adopt computing
Adopting computing means teaching about computing, because nobody else is doing it
Using teaching software instead of software principles
To an outsider, some problems are obvious:
There’s no big picture! Almost all those tests are based on regression, so teach that.
Techniques that give 1.5 digits of the p-values are good enough to start with.
Students don’t understand even simple formulas, so teach them the consequences of sampling by drawing actual samples.
Descriptive statistics should be rich: multiple regression andmodeling, so that you can describe a complicated world.
Teach basics of conditional probability so that p-values make sense.
Create the worlds of the Null and Alternative hypothesis: draw data from them.
Variables are not lurking, they are there to be dealt with appropriately: measuring covariates, adjustment, randomization.
Teach Bonferroni, and worry about the details later.
How I reacted
Our Abstinence-Based Curriculum and other Stories from Statistical Education
Nov 10, 2010
2010KaplanASA-Mn6up.pdf 3
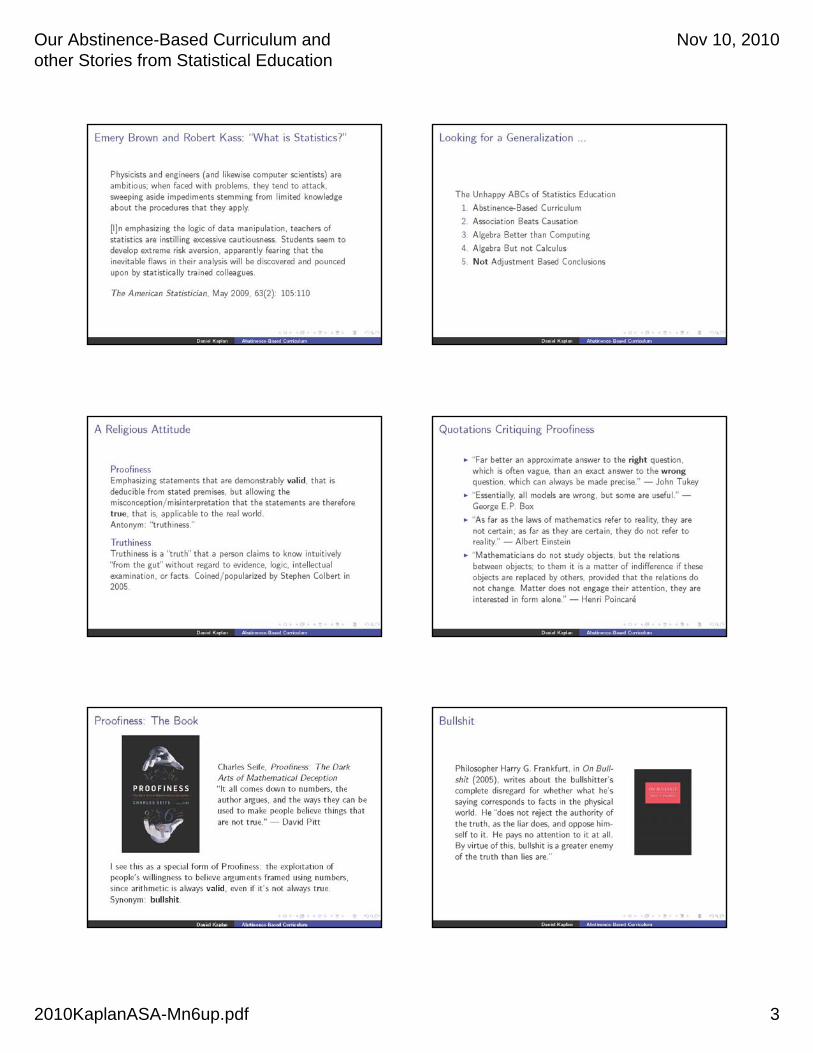
Physicists and engineers (and likewise computer scientists) are ambitious; when faced with problems, they tend to attack, sweeping aside impediments stemming from limited knowledge about the procedures that they apply.
[I]n emphasizing the logic of data manipulation, teachers of statistics are instilling excessive cautiousness. Students seem to develop extreme risk aversion, apparently fearing that the inevitable flaws in their analysis will be discovered and pounced upon by statistically trained colleagues.
The American Statistician, May 2009, 63(2): 105:110
Emery Brown and Robert Kass: "What is Statistics?"
The Unhappy ABCs of Statistics Education
1. Abstinence-Based Curriculum
2. Association Beats Causation
3. Algebra Better than Computing
4. Algebra but not Calculus
5. Not Adjustment Based Conclusions
Looking for a Generalization …
ProofinessEmphasizing statements that are demonstrably valid, that is deductible from stated premises but allowing the misconception/misinterpretation that the statements are therefore true, that is applicable to the real world. Antonym: “truthiness”
TruthinessTruthiness is a “truth” that a person claims to know intuitively “from the gut” with regard to evidence, logic, intellectual examination or facts.Coined/popularized by Stephen Colbert in 2005.
A Religious Attitude
"Far better an approximate answer to the right question, which is often vague, than an exact answer to the wrongquestion, which can always be made precise." John Tukey
"Essentially, all models are wrong, but some are useful. " George E.P. Box
"As far as the laws of mathematics refer to reality, they are not certain; as far as they are certain, they do not refer to reality." Albert Einstein
"Mathematicians do not study objects, but the relations between objects; to them it is a matter of indifference if these objects are replaced by others, provided that the relations do not change. Matter does not engage their attention, they are interested in form alone." Henri Poincare
Quotations Critiquing Proofiness
Charles Seife, Proofiness: The Dark Arts of Mathematical Deception
It all comes down to numbers, the author argues, and the ways they can be used to make people believe things that are not true. – David Pitt
I see this as a special form of Proofiness: the exploitation of people's willingness to believe arguments framed using numbers, since arithmetic is always valid, even if it's not always true.
Synonym: bullshit.
Proofiness: The Book
Philosopher Harry G. Frankfurt, in On Bullshit (2005), writes about the bullshitter's complete disregard for whether what he's saying corresponds to facts in the physical world. He does not reject the authority of the truth, as the liar does, and oppose himself to it. He pays no attention to it at all. By virtue of this, bullshit is a greater enemy of the truth than lies are."
Bullshit
Our Abstinence-Based Curriculum and other Stories from Statistical Education
Nov 10, 2010
2010KaplanASA-Mn6up.pdf 4
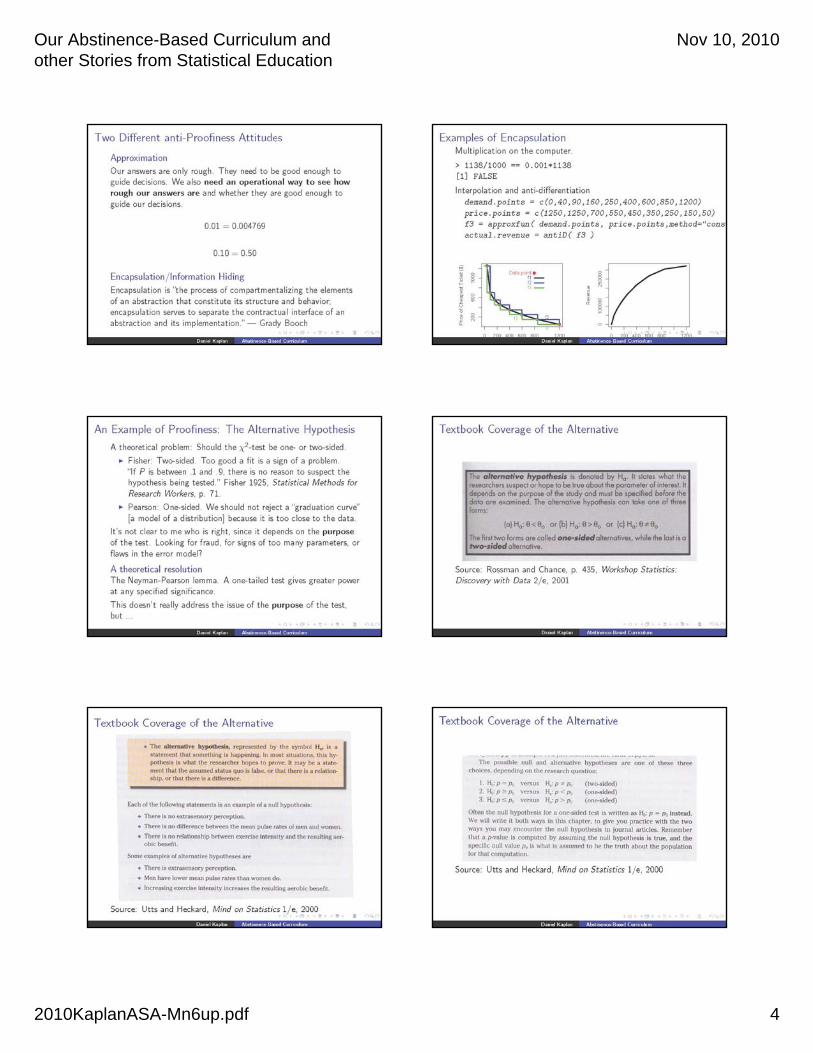
ApproximationOur answers are only rough. They need to be good enough to guide decisions. We also need an operational way to see how rough our answers are and whether they are good enough to guide our decisions.
0:01 = 0:0047690:10 = 0:50
Encapsulation/Information HidingEncapsulation is "the process of compartmentalizing the elements of an abstraction that constitute its structure and behavior; encapsulation serves to separate the contractual interface of an abstraction and its implementation.“ – Grady Booch
Two Different anti-Proofiness Attitudes
Multiplication on the computer.> 1138/1000 == 0.001*1138[1] FALSEInterpolation and anti-differentiation
demand.points = c(0,40,90,160,250,400,600,850,1200)price.points = c(1250,1250,700,550,450,350,250,150,50)f3 = approxfun( demand.points, price.points, method="const ???***actual.revenue = antiD( f3 )
Examples of Encapsulation
A theoretical problem: Should the 2-test be one or two-sided.• Fisher: Two-sided. Too good a t is a sign of a problem. "If P
is between .1 and .9, there is no reason to suspect the hypothesis being tested." Fisher 1925, Statistical Methods for Research Workers, p. 71.
• Pearson: One-sided. We should not reject a\graduation curve“ [a model of a distribution] because it is too close to the data.
It's not clear to me who is right, since it depends on the purpose of the test. Looking for fraud, for signs of too many parameters, or flaws in the error model?
A theoretical resolutionThe Neyman-Pearson lemma. A one-tailed test gives greater
power at any specified significance.This doesn't really address the issue of the purpose of the
test, but ...
An Example of Proofiness: The Alternative Hypothesis
Source: Rossman and Chance, p. 435, Workshop Statistics:Discovery with Data 2/e, 2001
Textbook Coverage of the Alternative
Source: Utts and Heckard, Mind on Statistics 1/e, 2000
Textbook Coverage of the Alternative
Source: Utts and Heckard, Mind on Statistics 1/e, 2000
Textbook Coverage of the Alternative
Our Abstinence-Based Curriculum and other Stories from Statistical Education
Nov 10, 2010
2010KaplanASA-Mn6up.pdf 5
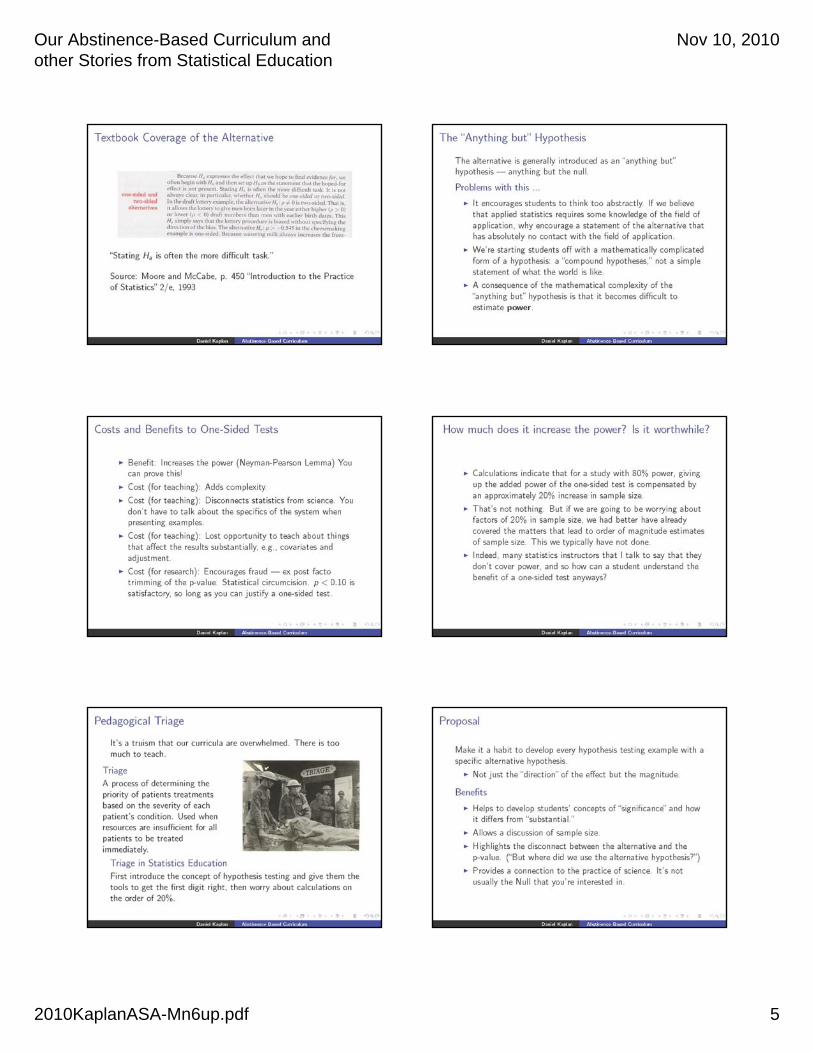
"Stating Ha is often the more difficult task."Source: Moore and McCabe, p. 450 \Introduction to the Practiceof Statistics" 2/e, 1993
Textbook Coverage of the Alternative
The alternative is generally introduced as an "anything but“hypothesis – anything but the null.
Problems with this ...
It encourages students to think too abstractly. If we believe that applied statistics requires some knowledge of the field of application, why encourage a statement of the alternative that has absolutely no contact with the field of application.
We're starting students o with a mathematically complicated form of a hypothesis: a\compound hypotheses," not a simple statement of what the world is like.
A consequence of the mathematical complexity of the "anything but" hypothesis is that it becomes difficult to estimate power.
The "Anything but" Hypothesis
Benefit: Increases the power (Neyman-Pearson Lemma) You can prove this!
Cost (for teaching): Adds complexity.
Cost (for teaching): Disconnects statistics from science. You don't have to talk about the specifics of the system when presenting examples.
Cost (for teaching): Lost opportunity to teach about things that affect the results substantially, e.g., covariates and adjustment.
Cost (for research): Encourages fraud – ex post facto trimming of the p-value. Statistical circumcision. p < 0.10 is satisfactory, so long as you can justify a one-sided test.
Costs and Benefits to One-Sided Tests
• Calculations indicate that for a study with 80% power, giving up the added power of the one-sided test is compensated by an approximately 20% increase in sample size.
• That's not nothing. But if we are going to be worrying about factors of 20% in sample size, we had better have already covered the matters that lead to order of magnitude estimates of sample size. This we typically have not done.
• Indeed, many statistics instructors that I talk to say that they don't cover power, and so how can a student understand the benefit of a one-sided test anyways?
How much does it increase the power? Is it worthwhile?
It's a truism that our curricula are overwhelmed. There is too much to teach.
TriageA process of determining thepriority of patients treatmentsbased on the severity of eachpatient's condition. Used whenresources are insufficient for allpatients to be treatedimmediately.
Triage in Statistics Education
First introduce the concept of hypothesis testing and give them the tools to get the first digit right, then worry about calculations on the order of 20%.
Pedagogical Triage
Make it a habit to develop every hypothesis testing example with a specific alternative hypothesis.
• Not just the "direction" of the effect but the magnitude.
Benefits• Helps to develop students' concepts of "significance" and
how it differs from "substantial."• Allows a discussion of sample size.• Highlights the disconnect between the alternative and the
p-value. ("But where did we use the alternative hypothesis?")
• Provides a connection to the practice of science. It's not usually the Null that you're interested in.
Proposal
Our Abstinence-Based Curriculum and other Stories from Statistical Education
Nov 10, 2010
2010KaplanASA-Mn6up.pdf 6
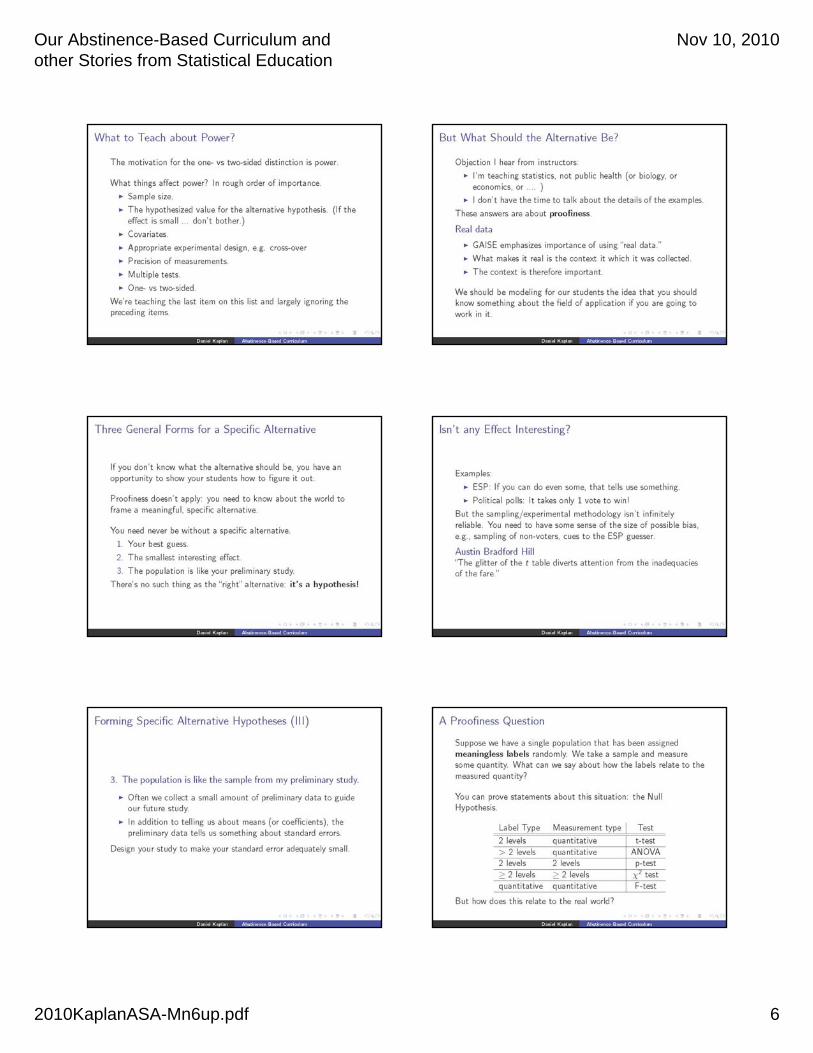
The motivation for the one- vs two-sided distinction is power.
What things affect power? In rough order of importance.
Sample size.
The hypothesized value for the alternative hypothesis. (If the effect is small ... don't bother.)
Covariates.
Appropriate experimental design, e.g. cross-over
Precision of measurements.
Multiple tests.
One- vs two-sided.
We're teaching the last item on this list and largely ignoring the preceding items.
What to Teach about Power?
Objection I hear from instructors:• I'm teaching statistics, not public health (or biology, or
economics, or .... )• I don't have the time to talk about the details of the
examples.These answers are about proofiness.
Real data• GAISE emphasizes importance of using "real data."• What makes it real is the context it which it was collected.• The context is therefore important.
We should be modeling for our students the idea that you should know something about the field of application if you are going to work in it.
But What Should the Alternative Be?
If you don't know what the alternative should be, you have an opportunity to show your students how to figure it out.
Proofiness doesn't apply: you need to know about the world to frame a meaningful, specific alternative.
You need never be without a specific alternative.1. Your best guess.2. The smallest interesting effect.3. The population is like your preliminary study.
There's no such thing as the "right" alternative: it's a hypothesis!
Three General Forms for a Specific Alternative
Examples: ESP: If you can do even some, that tells use something. Political polls: It takes only 1 vote to win!But the sampling/experimental methodology isn't infinitely reliable. You need to have some sense of the size of possible bias, e.g., sampling of non-voters, cues to the ESP guesser.
Austin Bradford Hill"The glitter of the t table diverts attention from the inadequacies of the fare."
Isn't any Effect Interesting?
3. The population is like the sample from my preliminary study.
Often we collect a small amount of preliminary data to guide our future study.
In addition to telling us about means (or coefficients), the preliminary data tells us something about standard errors.
Design your study to make your standard error adequately small.
Forming Specific Alternative Hypotheses (III)
Suppose we have a single population that has been assigned meaningless labels randomly. We take a sample and measure some quantity. What can we say about how the labels relate to the measured quantity?
You can prove statements about this situation: the Null Hypothesis.• Label Type Measurement type Test• 2 levels quantitative t-test• > 2 levels quantitative ANOVA• 2 levels 2 levels p-test• 2 levels 2 levels 2 test• quantitative quantitative F-testBut how does this relate to the real world?
A Proofiness Question
Our Abstinence-Based Curriculum and other Stories from Statistical Education
Nov 10, 2010
2010KaplanASA-Mn6up.pdf 7
.
.
.
.
.
.
.
.
.
.
.
.
Our Abstinence-Based Curriculum and other Stories from Statistical Education
Nov 10, 2010
2010KaplanASA-Mn6up.pdf 8
.
.
.
.
.
.
.
.
.
.
.
.
Our Abstinence-Based Curriculum and other Stories from Statistical Education
Nov 10, 2010
2010KaplanASA-Mn6up.pdf 9
.
.
.
.
.
.
.
.
.
.
.
.
Our Abstinence-Based Curriculum and other Stories from Statistical Education
Nov 10, 2010
2010KaplanASA-Mn6up.pdf 10
.
.
.
.
.
.
.
.
.
.