Embed Size (px)
DESCRIPTION
Outcome Assessment: Practical Realities and Lessons Learned. Session S3G Paper 1626. David G. Meyer Electrical & Computer Engineering Purdue University West Lafayette, Indiana. 2004 Frontiers in Education Conference. Outline. Introduction Major Issues - PowerPoint PPT Presentation
Citation preview
Outcome Assessment: Practical Realities and Lessons
Learned
David G. Meyer Electrical & Computer Engineering
Purdue UniversityWest Lafayette, Indiana
2004 Frontiers in Education Conference
Session S3G
Paper 1626
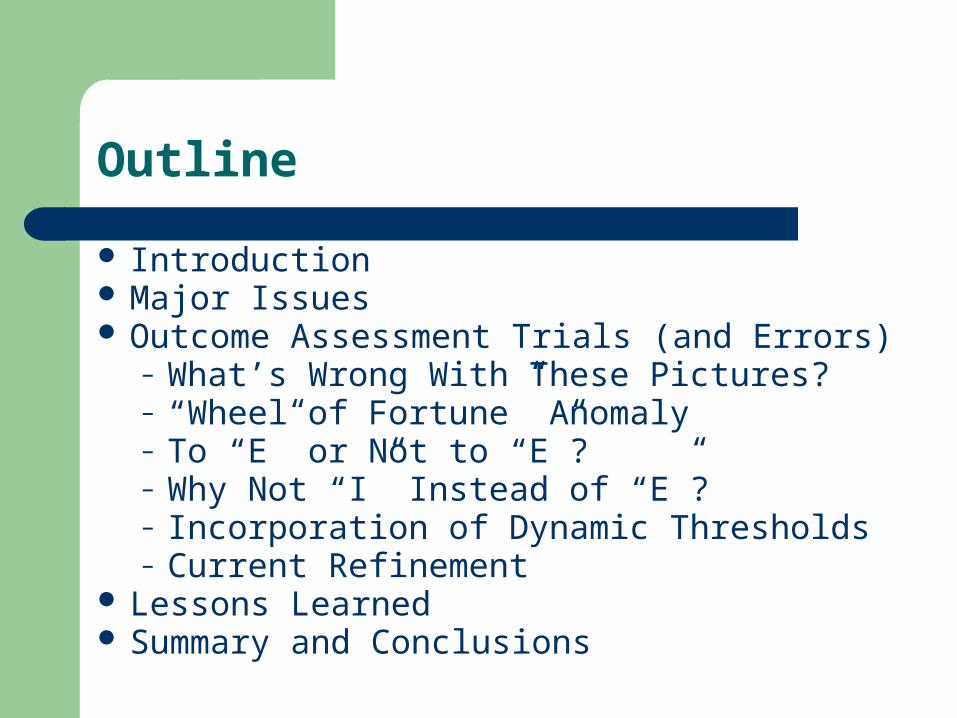
Outline
Introduction Major Issues Outcome Assessment Trials (and Errors)
– What’s Wrong With These Pictures?– “Wheel of Fortune” Anomaly– To “E” or Not to “E”?– Why Not “I” Instead of “E”?– Incorporation of Dynamic Thresholds– Current Refinement
Lessons Learned Summary and Conclusions
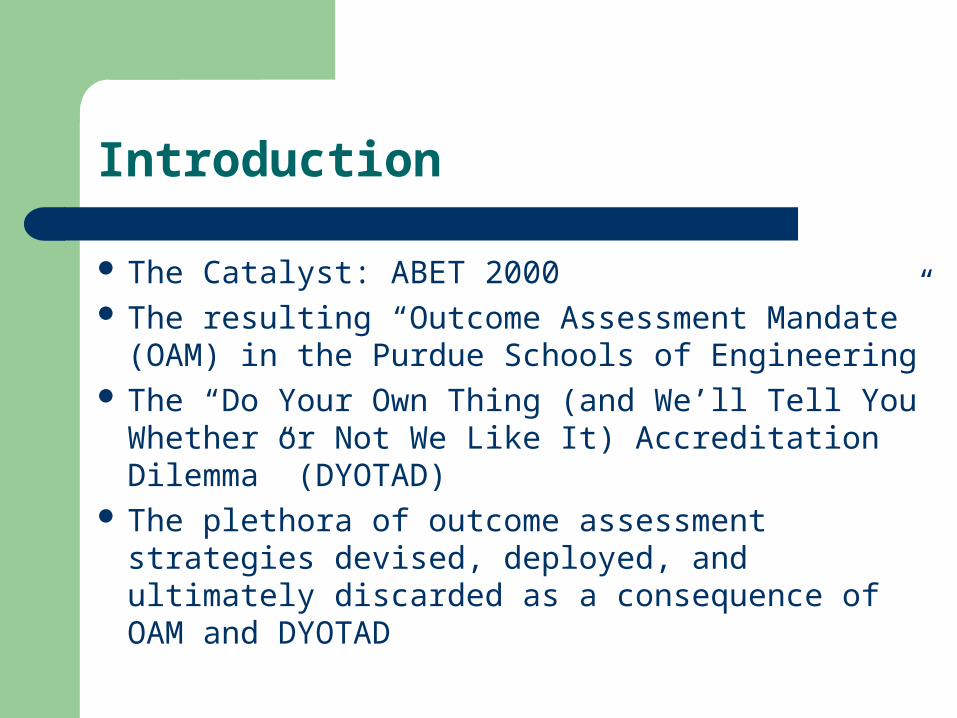
Introduction
The Catalyst: ABET 2000 The resulting “Outcome Assessment Mandate”
(OAM) in the Purdue Schools of Engineering The “Do Your Own Thing (and We’ll Tell You
Whether or Not We Like It) Accreditation Dilemma” (DYOTAD)
The plethora of outcome assessment strategies devised, deployed, and ultimately discarded as a consequence of OAM and DYOTAD
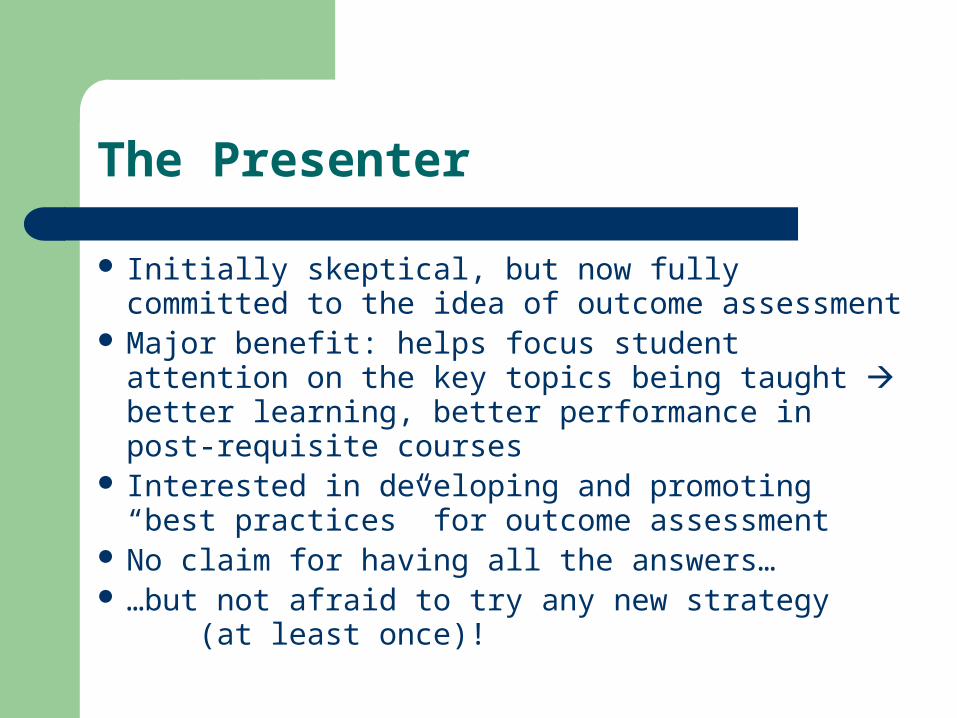
The Presenter
Initially skeptical, but now fully committed to the idea of outcome assessment
Major benefit: helps focus student attention on the key topics being taught better learning, better performance in post-requisite courses
Interested in developing and promoting “best practices” for outcome assessment
No claim for having all the answers… …but not afraid to try any new strategy (at
least once)!

The Courses
ECE 270 – Intro to Digital System Design (a sophomore lecture/lab course on digital logic and system design)
ECE 362 – Microprocessor System Design and Interfacing (a junior lecture/lab course on embedded microcontrollers)
ECE 477 – Digital Systems Design Project (a senior course that involves a semester-long, team-oriented, multidisciplinary design project)
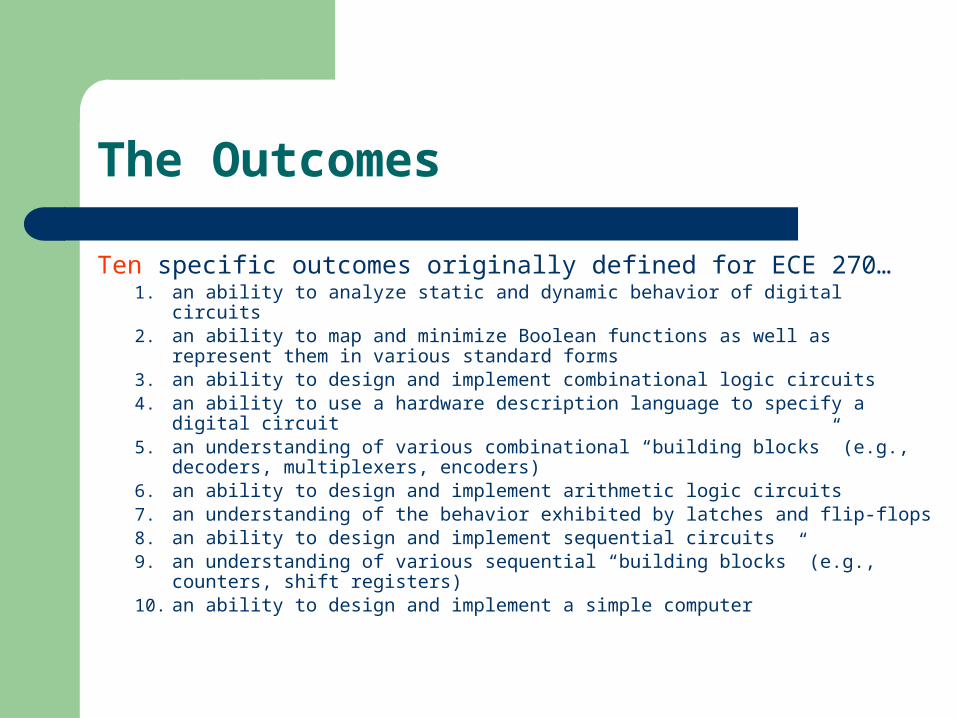
The Outcomes
Ten specific outcomes originally defined for ECE 270…1. an ability to analyze static and dynamic behavior of digital circuits2. an ability to map and minimize Boolean functions as well as represent them
in various standard forms3. an ability to design and implement combinational logic circuits4. an ability to use a hardware description language to specify a digital circuit5. an understanding of various combinational “building blocks” (e.g., decoders,
multiplexers, encoders)6. an ability to design and implement arithmetic logic circuits7. an understanding of the behavior exhibited by latches and flip-flops8. an ability to design and implement sequential circuits9. an understanding of various sequential “building blocks” (e.g., counters,
shift registers)10. an ability to design and implement a simple computer

The Outcomes
…were ultimately compacted to the following six:1. an ability to analyze static and dynamic behavior of digital circuits2. an ability to represent Boolean functions in standard forms, to map
and minimize them, and to implement them as combinational logic circuits
3. an ability to use a hardware description language to specify combinational logic circuits, including various “building blocks” such as decoders, multiplexers, encoders, and tri-state buffers
4. an ability to design and implement arithmetic logic circuits5. an ability to analyze, design, and implement sequential circuits and
use a hardware description language to specify them 6. an ability to design and implement a simple computer based on
combinational and sequential building blocks
The Outcomes
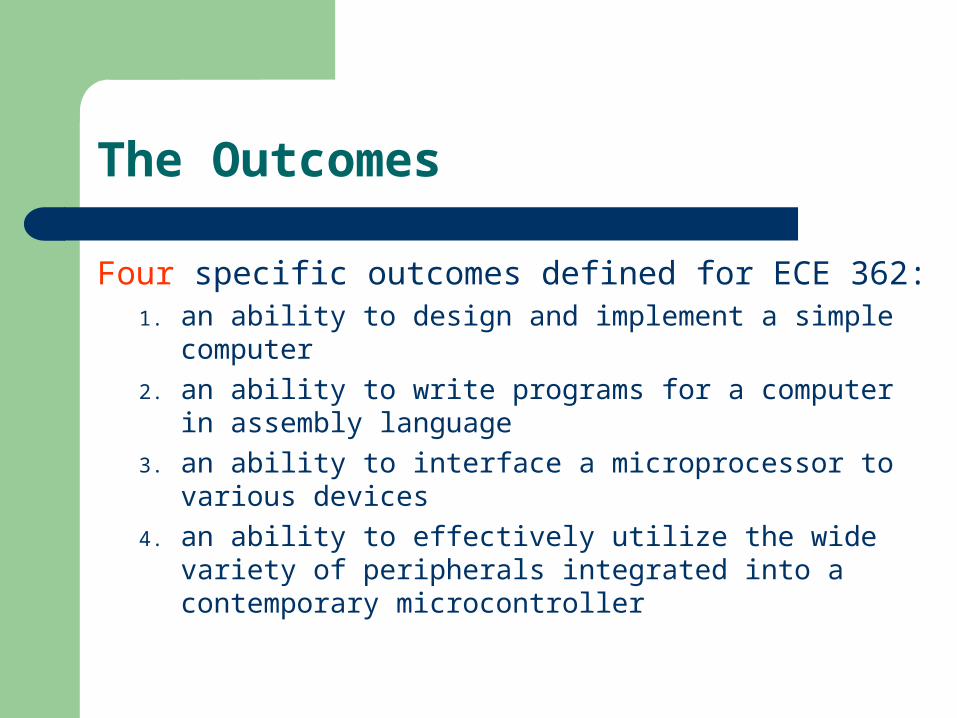
Four specific outcomes defined for ECE 362:1. an ability to design and implement a simple computer
2. an ability to write programs for a computer in assembly language
3. an ability to interface a microprocessor to various devices
4. an ability to effectively utilize the wide variety of peripherals integrated into a contemporary microcontroller
The Visitors
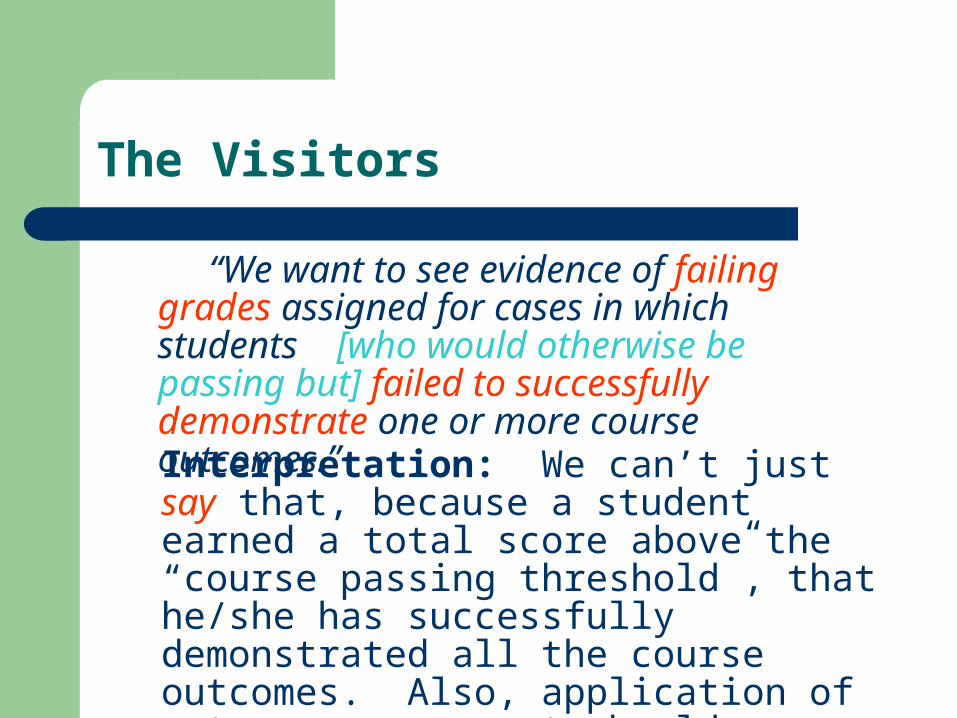
“We want to see evidence of failing grades assigned for cases in which students [who would otherwise be passing but] failed to successfully demonstrate one or more course outcomes.”Interpretation: We can’t just say that, because a student earned a total score above the “course passing threshold”, that he/she has successfully demonstrated all the course outcomes. Also, application of outcome assessment should produce some form of meaningful/measurable difference.
Major Issues
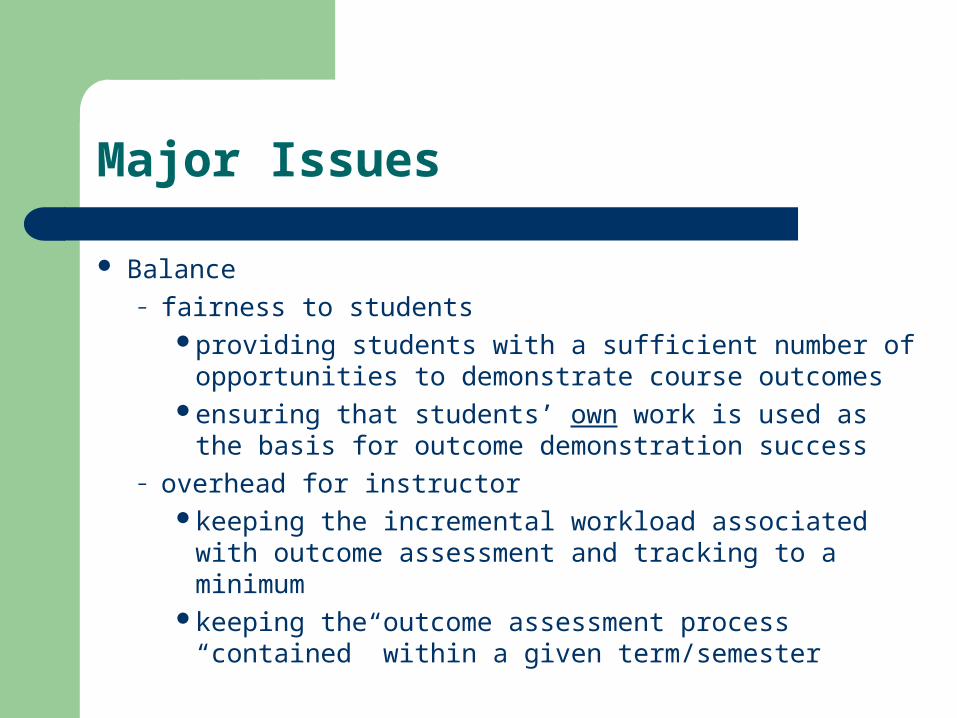
Balance– fairness to students
providing students with a sufficient number of opportunities to demonstrate course outcomes
ensuring that students’ own work is used as the basis for outcome demonstration success
– overhead for instructorkeeping the incremental workload associated with
outcome assessment and tracking to a minimumkeeping the outcome assessment process
“contained” within a given term/semester
Major Issues
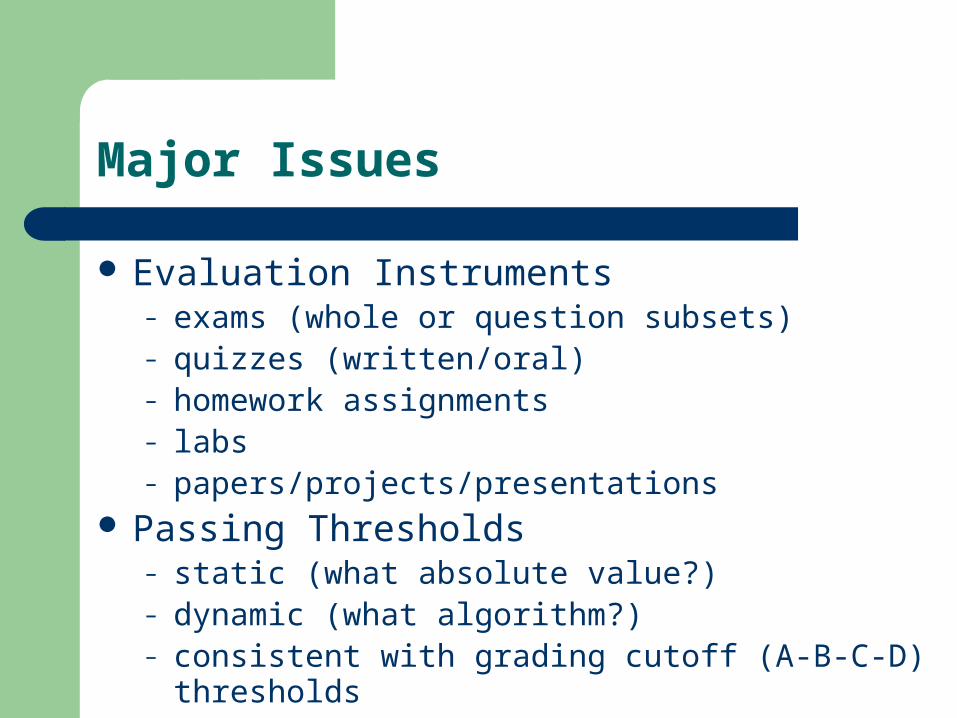
Evaluation Instruments– exams (whole or question subsets)– quizzes (written/oral)– homework assignments– labs– papers/projects/presentations
Passing Thresholds– static (what absolute value?)– dynamic (what algorithm?)– consistent with grading cutoff (A-B-C-D) thresholds
Major Issues
Assigning course grades consistent with proven prior practice, yet reflecting meaningful application of outcome assessment thresholds
Achieving consistency– semester-to-semester– professor-to-professor– course-to-course– school-to-school– institution-to-institution
Outcome Assessment Trials (and Errors)
Four prior (discarded) attempts– fixed passing threshold (60%) on weighted sum of
(selected) lab, homework, and exam scores– fixed passing threshold (60%) on primary assessment,
remediation homework, and final assessment– fixed passing threshold (60%) on primary assessment,
final assessment, and remediation homework– fixed passing threshold (60%) on primary and final
assessments; use of “E” (conditional failure) grade for those who were otherwise passing, with opportunity to take remediation assessment the following semester
What’s Wrong With These Pictures?
fixed threshold (60%) on weighted sum of (selected) lab, homework, and exam scores– basically everyone “passed” – strategy did not prove
to be effective– impossible to ensure that students’ own work was
being evaluated on labs and homework– remediation strategy was ill-defined (had to be done
on a one-on-one basis)
What’s Wrong With These Pictures?
fixed threshold (60%) on primary assessment, final assessment, and remediation homework– remediation homework delayed until after the final
assessment (theory: there should be less of it, given the opportunity to demonstrate a previously failed outcome on the final)
– major limitation: only works if final (happens to be) scheduled early during finals week; also, requires students to stay in town after final to do remediation
– excessive finals week overhead in grading exams and processing remediation homework
– impossible to ensure that students’ own work was being evaluated on remediation homework
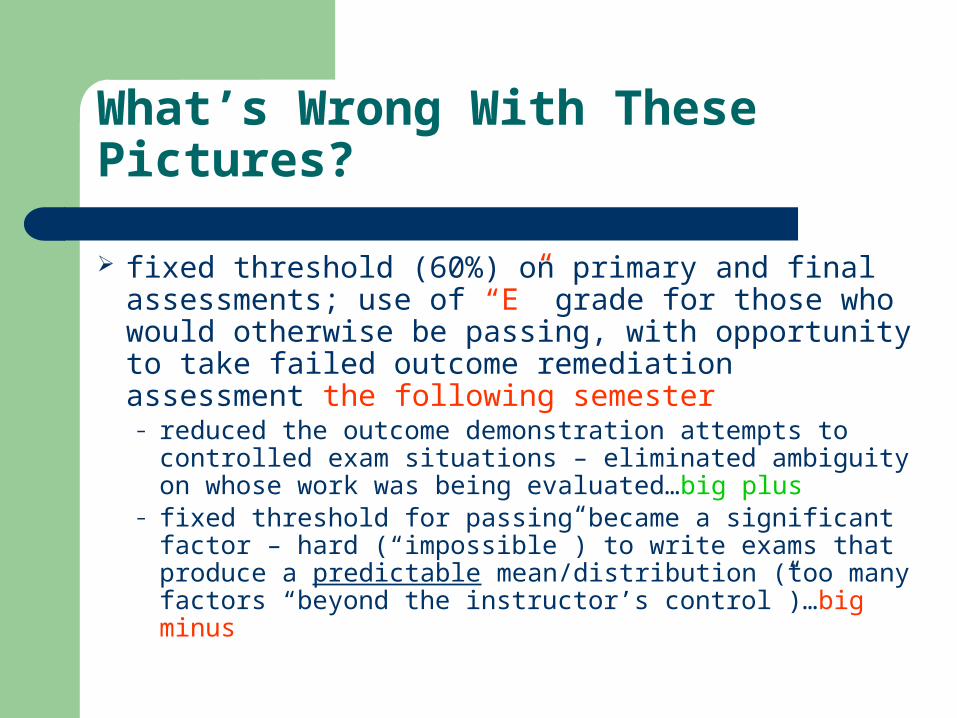
What’s Wrong With These Pictures?
fixed threshold (60%) on primary and final assessments; use of “E” grade for those who would otherwise be passing, with opportunity to take failed outcome remediation assessment the following semester– reduced the outcome demonstration attempts to
controlled exam situations – eliminated ambiguity on whose work was being evaluated…big plus
– fixed threshold for passing became a significant factor – hard (“impossible”) to write exams that produce a predictable mean/distribution (too many factors “beyond the instructor’s control”)…big minus
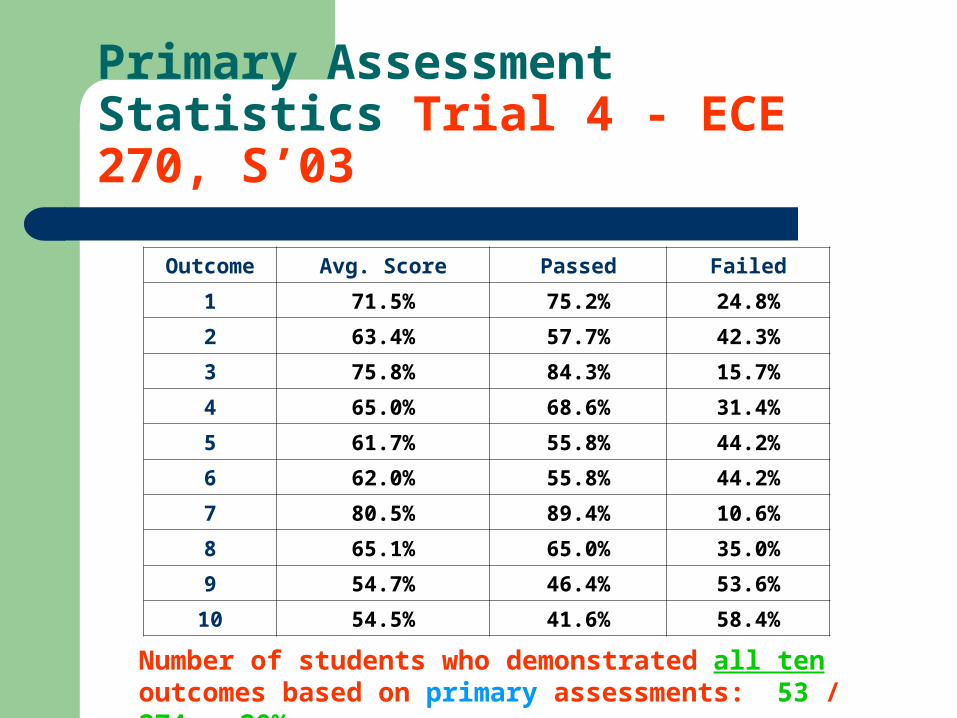
Primary Assessment Statistics Trial 4 - ECE 270, S’03
Number of students who demonstrated all ten outcomes based on primary assessments: 53 / 274 20%
Outcome Avg. Score Passed Failed
1 71.5% 75.2% 24.8%
2 63.4% 57.7% 42.3%
3 75.8% 84.3% 15.7%
4 65.0% 68.6% 31.4%
5 61.7% 55.8% 44.2%
6 62.0% 55.8% 44.2%
7 80.5% 89.4% 10.6%
8 65.1% 65.0% 35.0%
9 54.7% 46.4% 53.6%
10 54.5% 41.6% 58.4%
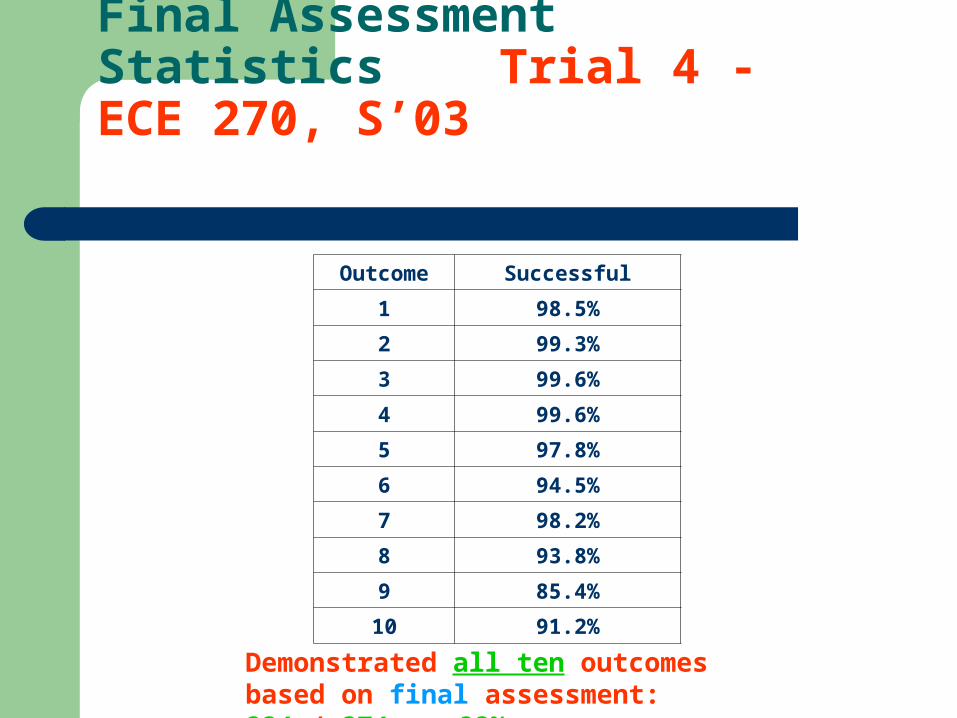
Demonstrated all ten outcomes based on final assessment: 224 / 274 82%
Final Assessment Statistics Trial 4 - ECE 270, S’03
Outcome Successful
1 98.5%
2 99.3%
3 99.6%
4 99.6%
5 97.8%
6 94.5%
7 98.2%
8 93.8%
9 85.4%
10 91.2%
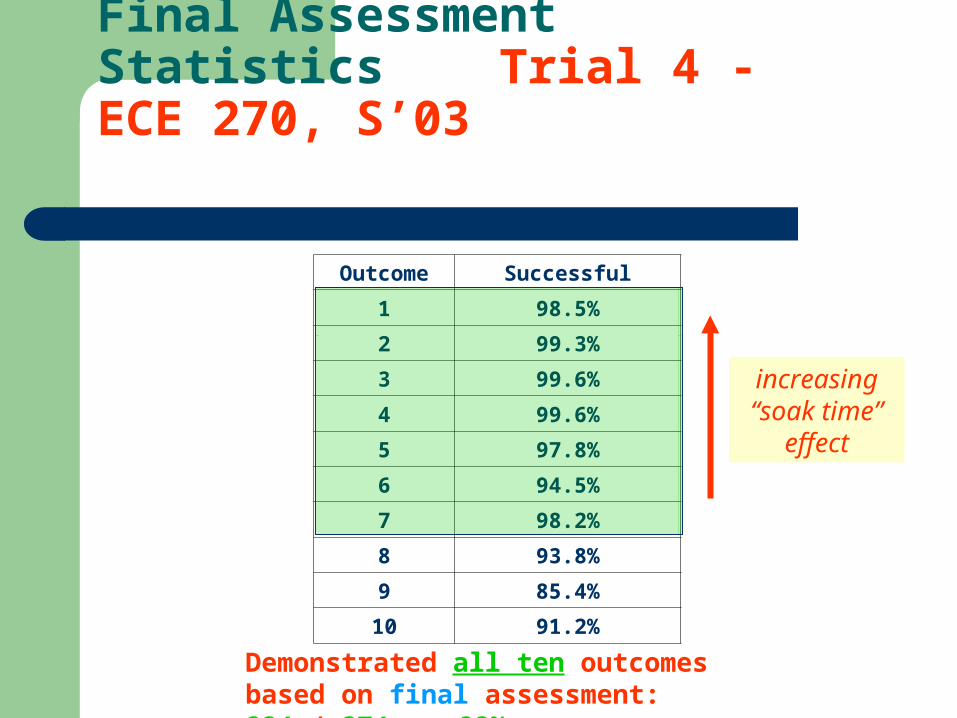
Outcome Successful
1 98.5%
2 99.3%
3 99.6%
4 99.6%
5 97.8%
6 94.5%
7 98.2%
8 93.8%
9 85.4%
10 91.2%
Demonstrated all ten outcomes based on final assessment: 224 / 274 82%
Final Assessment Statistics Trial 4 - ECE 270, S’03
increasing “soak time”
effect
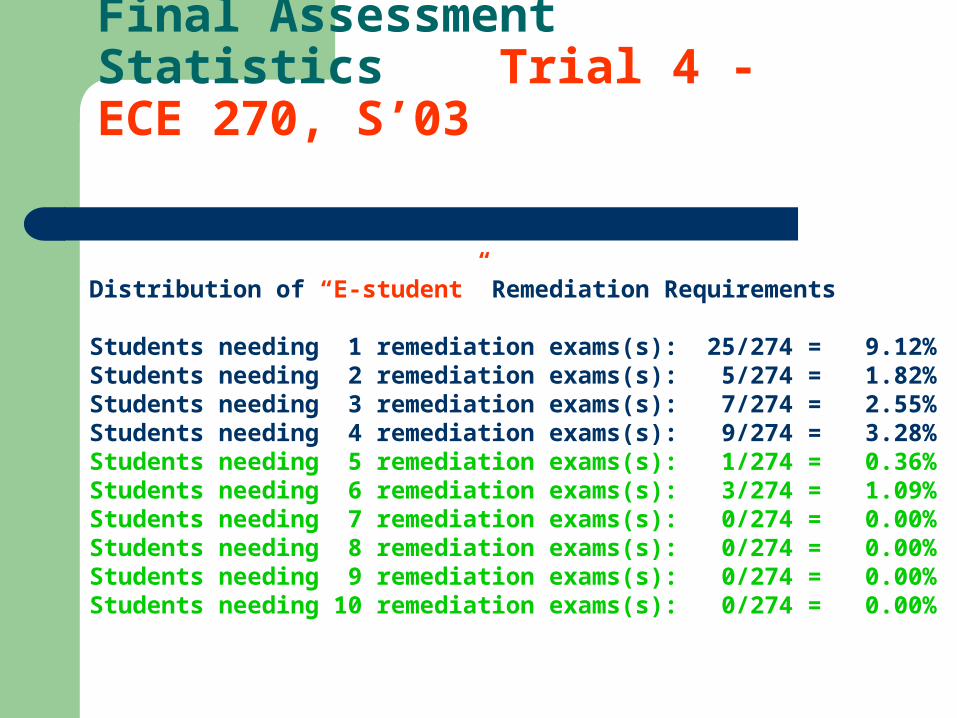
Distribution of “E-student” Remediation Requirements
Students needing 1 remediation exams(s): 25/274 = 9.12%Students needing 2 remediation exams(s): 5/274 = 1.82%Students needing 3 remediation exams(s): 7/274 = 2.55%Students needing 4 remediation exams(s): 9/274 = 3.28%Students needing 5 remediation exams(s): 1/274 = 0.36%Students needing 6 remediation exams(s): 3/274 = 1.09%Students needing 7 remediation exams(s): 0/274 = 0.00%Students needing 8 remediation exams(s): 0/274 = 0.00%Students needing 9 remediation exams(s): 0/274 = 0.00%Students needing 10 remediation exams(s): 0/274 = 0.00%
Final Assessment Statistics Trial 4 - ECE 270, S’03
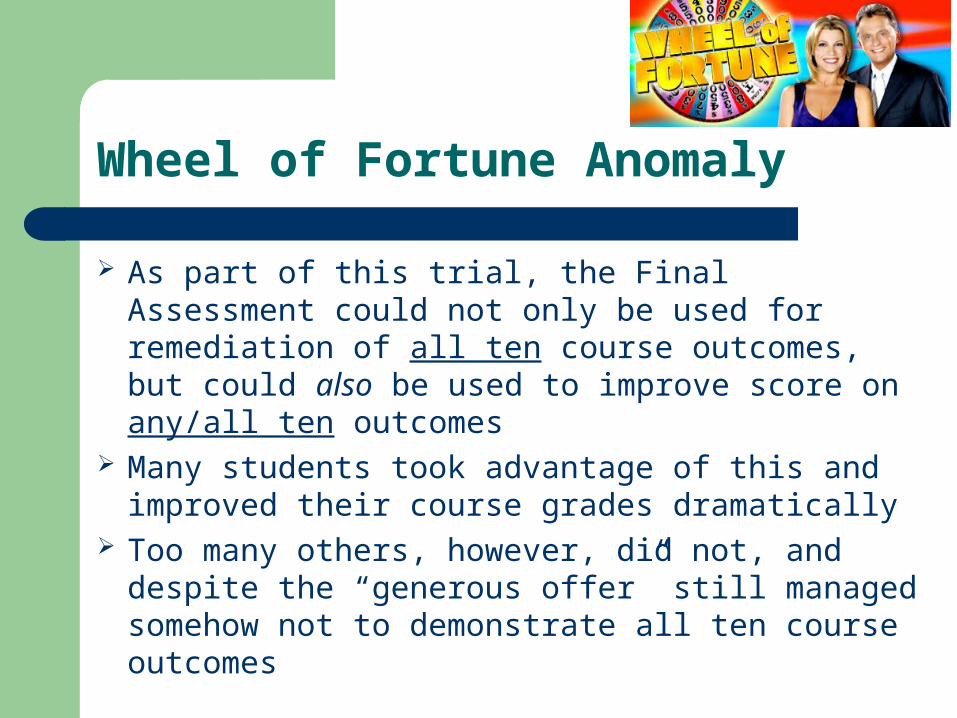
Wheel of Fortune Anomaly
As part of this trial, the Final Assessment could not only be used for remediation of all ten course outcomes, but could also be used to improve score on any/all ten outcomes
Many students took advantage of this and improved their course grades dramatically
Too many others, however, did not, and despite the “generous offer” still managed somehow not to demonstrate all ten course outcomes

Wheel of Fortune Anomaly
If Bilbo had been the instructor, he might have expressed the following sentiment: “I helped the students in the top half of the class more than I anticipated, and helped the students in the bottom half of the class less than I had hoped”
GRADE CUTOFFS: A > 88.00 > B > 76.00 > C > 64.00 > D > 52.00 > F
DISTRIBUTION: (A) (B) (C) (D) (E) (F) 129 91 5 0 42 7
COURSE GRADE POINT AVERAGE BASED ON LETTER GRADES: 3.44/4.00 Prior to final, course GPA was approximately 1 point lower!
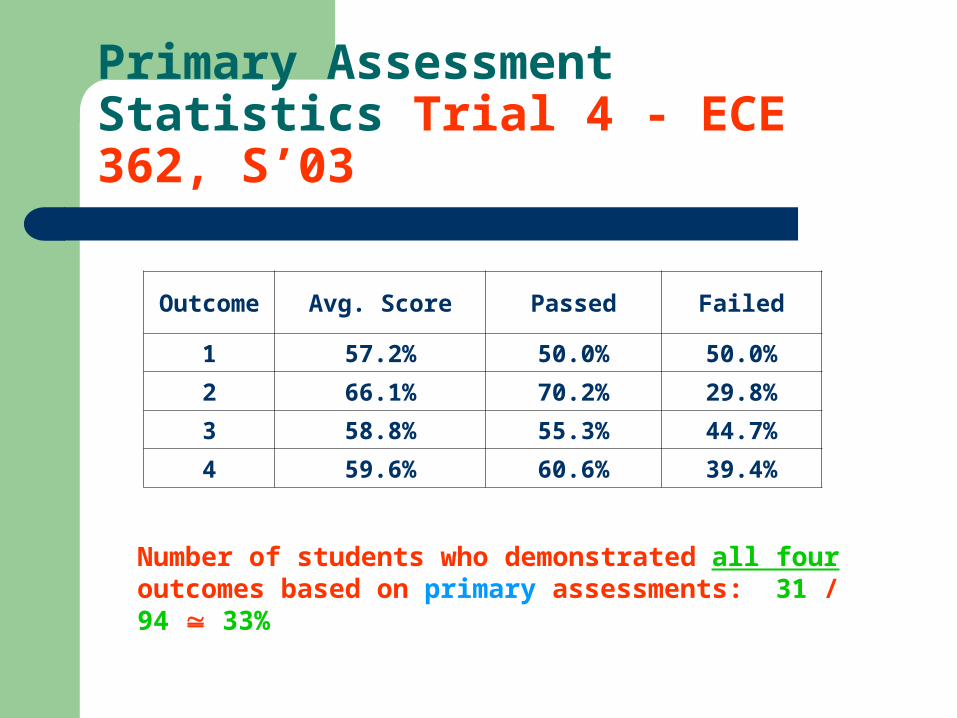
Primary Assessment Statistics Trial 4 - ECE 362, S’03
Number of students who demonstrated all four outcomes based on primary assessments: 31 / 94 33%
Outcome Avg. Score Passed Failed
1 57.2% 50.0% 50.0%
2 66.1% 70.2% 29.8%
3 58.8% 55.3% 44.7%
4 59.6% 60.6% 39.4%
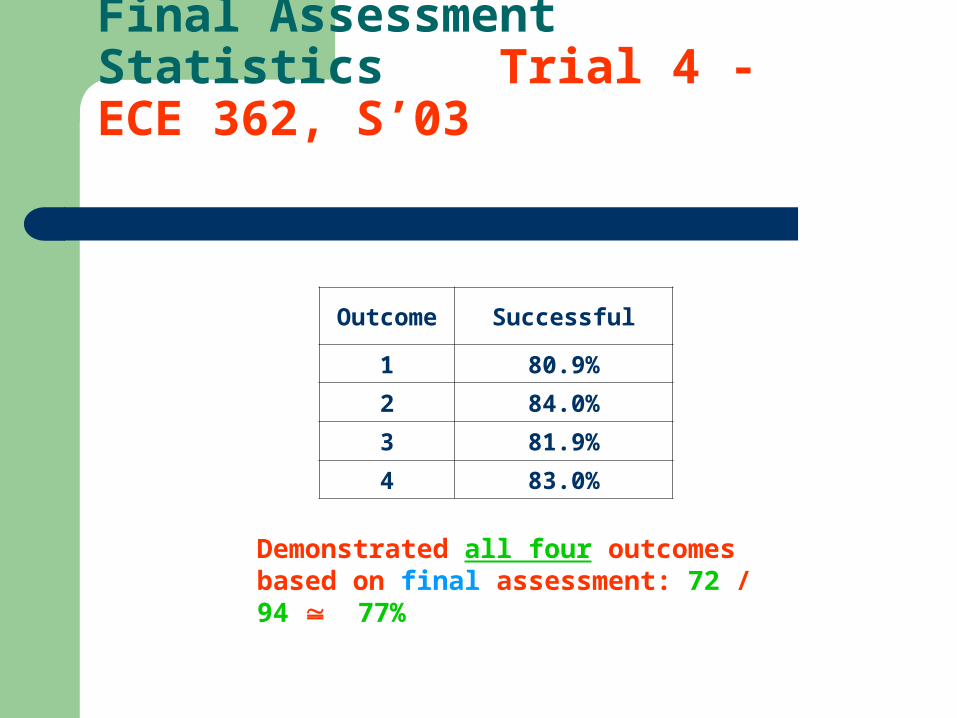
Demonstrated all four outcomes based on final assessment: 72 / 94 77%
Final Assessment Statistics Trial 4 - ECE 362, S’03
Outcome Successful
1 80.9%
2 84.0%
3 81.9%
4 83.0%
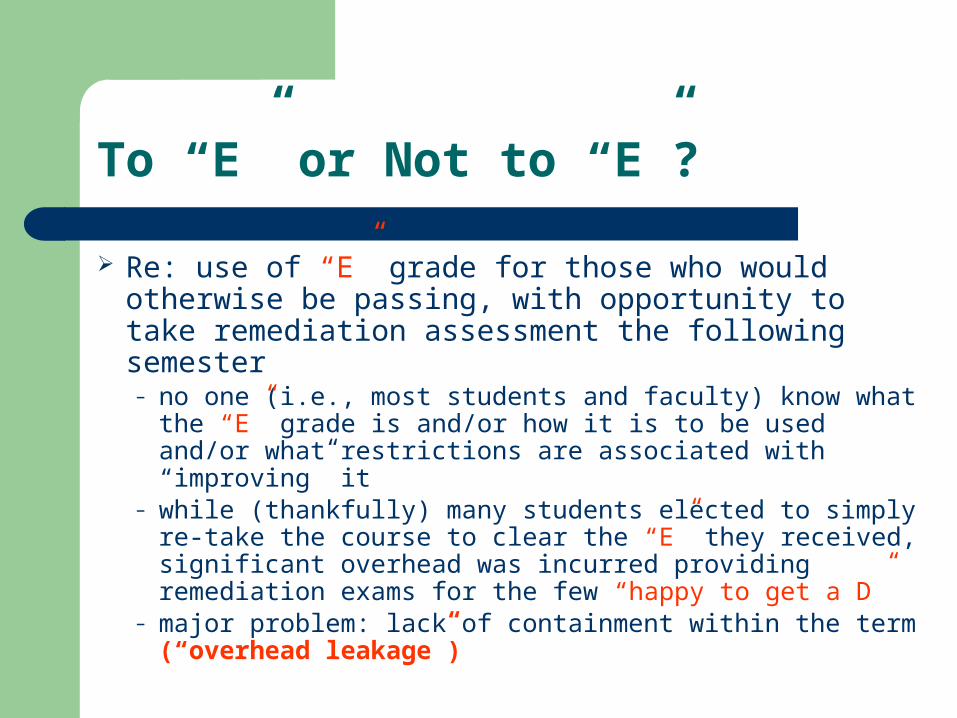
To “E” or Not to “E”?
Re: use of “E” grade for those who would otherwise be passing, with opportunity to take remediation assessment the following semester– no one (i.e., most students and faculty) know what the
“E” grade is and/or how it is to be used and/or what restrictions are associated with “improving” it
– while (thankfully) many students elected to simply re-take the course to clear the “E” they received, significant overhead was incurred providing remediation exams for the few “happy to get a D”
– major problem: lack of containment within the term (“overhead leakage”)
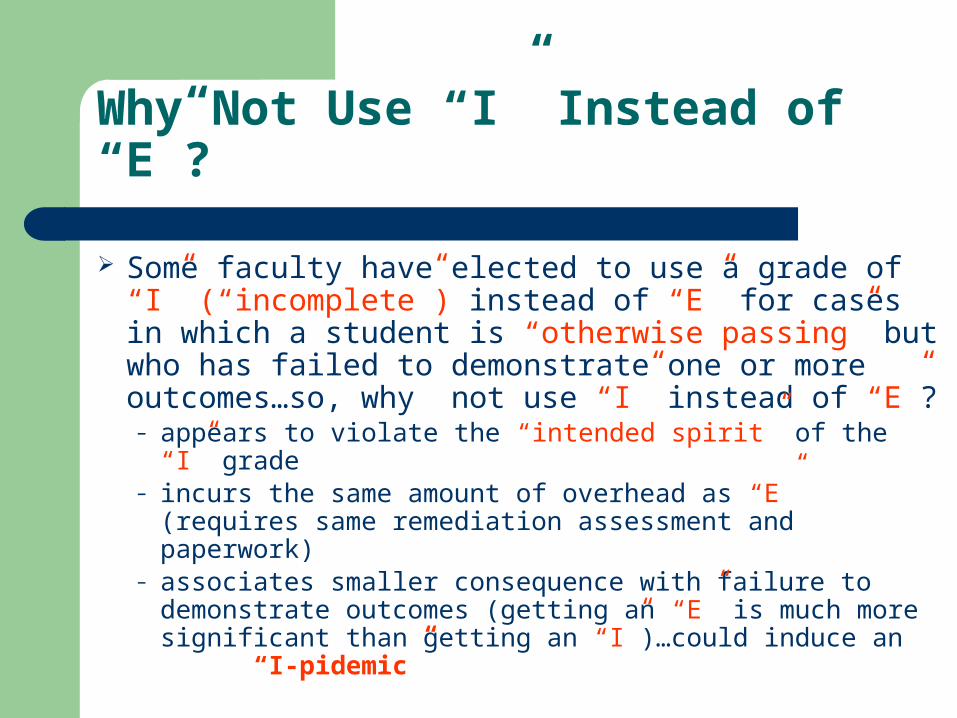
Why Not Use “I” Instead of “E”?
Some faculty have elected to use a grade of “I” (“incomplete”) instead of “E” for cases in which a student is “otherwise passing” but who has failed to demonstrate one or more outcomes…so, why not use “I” instead of “E”?– appears to violate the “intended spirit” of the “I” grade– incurs the same amount of overhead as “E” (requires
same remediation assessment and paperwork)– associates smaller consequence with failure to
demonstrate outcomes (getting an “E” is much more significant than getting an “I”)…could induce an “I-pidemic”
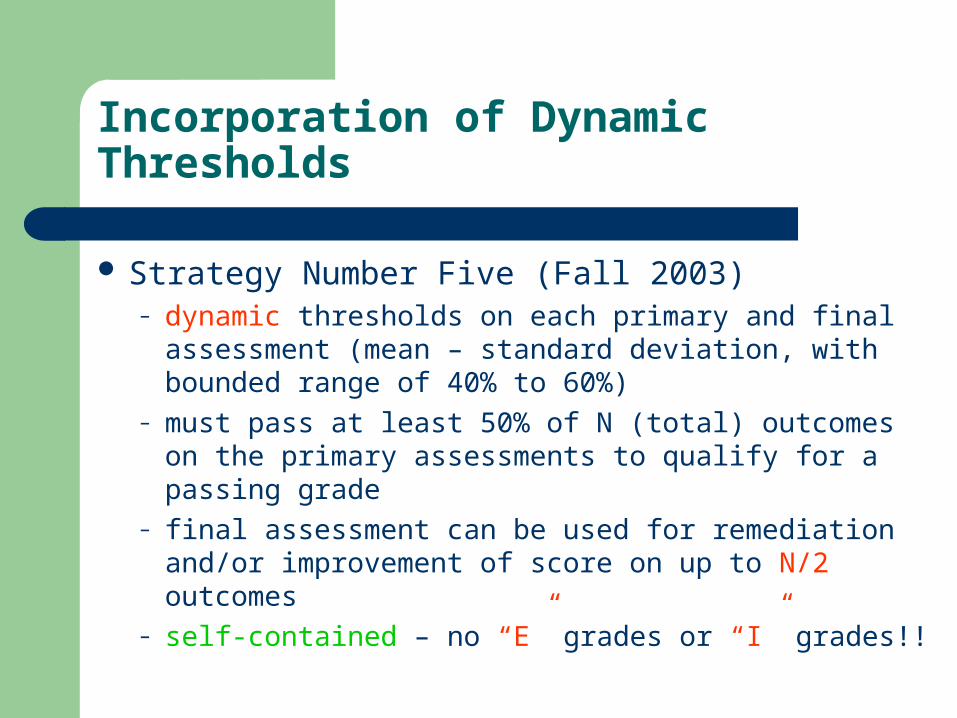
Incorporation of Dynamic Thresholds
Strategy Number Five (Fall 2003)– dynamic thresholds on each primary and final
assessment (mean – standard deviation, with bounded range of 40% to 60%)
– must pass at least 50% of N (total) outcomes on the primary assessments to qualify for a passing grade
– final assessment can be used for remediation and/or improvement of score on up to N/2 outcomes
– self-contained – no “E” grades or “I” grades!!
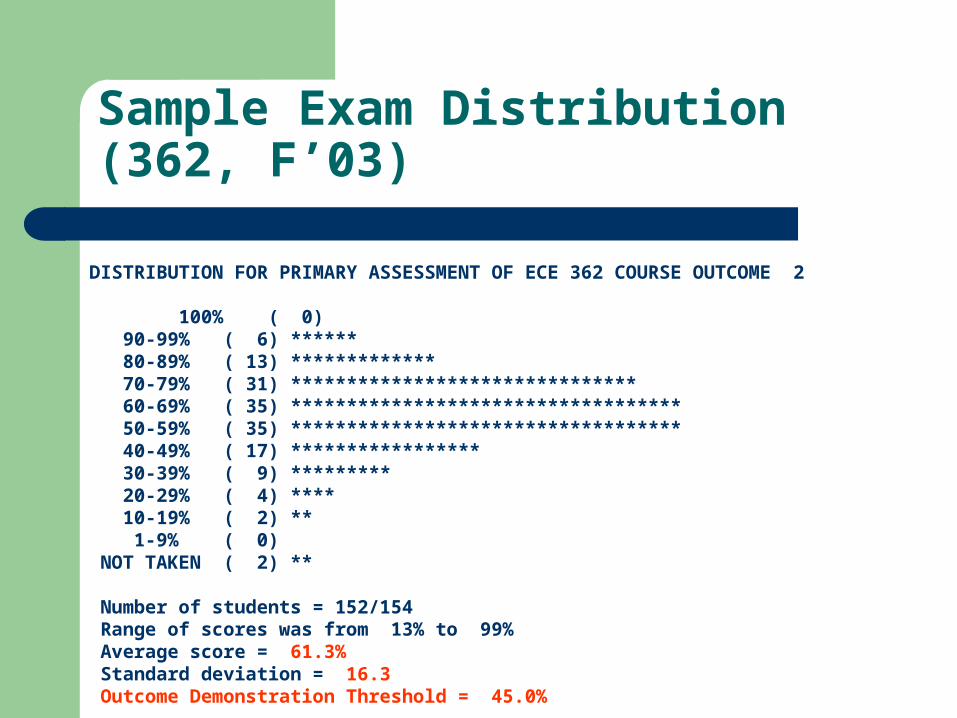
Sample Exam Distribution (362, F’03)
DISTRIBUTION FOR PRIMARY ASSESSMENT OF ECE 362 COURSE OUTCOME 2
100% ( 0) 90-99% ( 6) ****** 80-89% ( 13) ************* 70-79% ( 31) ******************************* 60-69% ( 35) *********************************** 50-59% ( 35) *********************************** 40-49% ( 17) ***************** 30-39% ( 9) ********* 20-29% ( 4) **** 10-19% ( 2) ** 1-9% ( 0) NOT TAKEN ( 2) **
Number of students = 152/154 Range of scores was from 13% to 99% Average score = 61.3% Standard deviation = 16.3 Outcome Demonstration Threshold = 45.0%
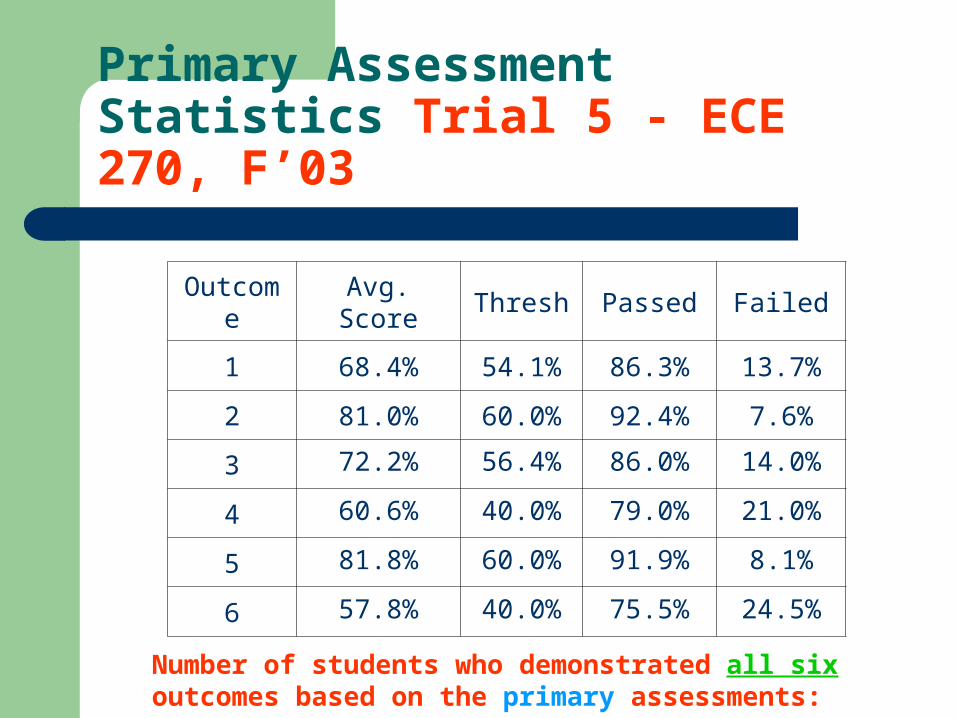
Primary Assessment Statistics Trial 5 - ECE 270, F’03
Outcome Avg. Score Thresh Passed Failed
1 68.4% 54.1% 86.3% 13.7%
2 81.0% 60.0% 92.4% 7.6%
3 72.2% 56.4% 86.0% 14.0%
4 60.6% 40.0% 79.0% 21.0%
5 81.8% 60.0% 91.9% 8.1%
6 57.8% 40.0% 75.5% 24.5%
Number of students who demonstrated all six outcomes based on the primary assessments: 149 / 277 54%
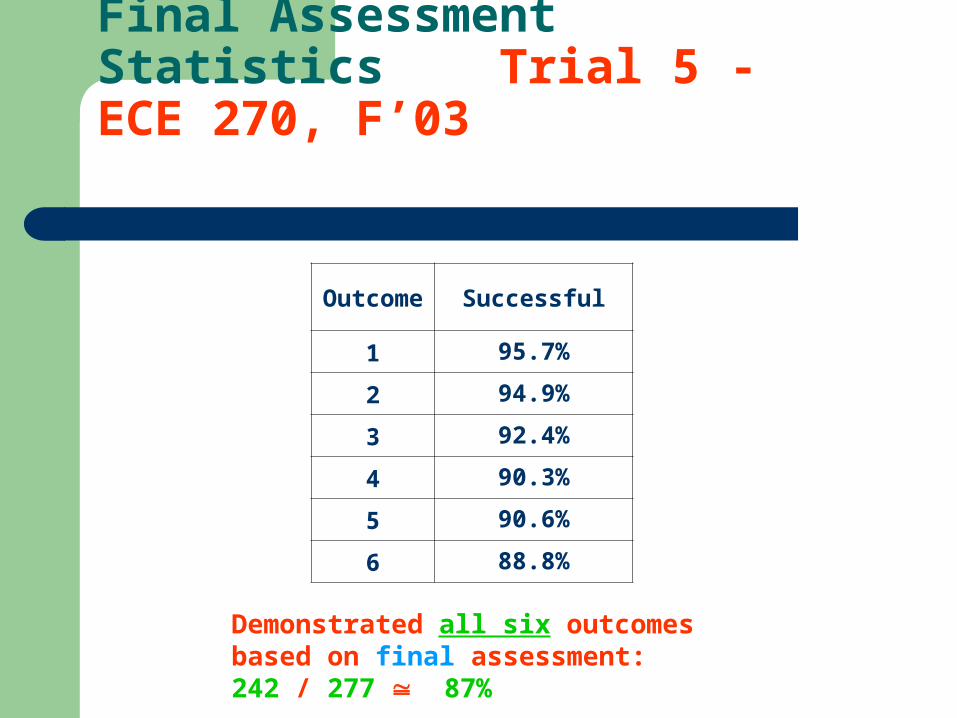
Demonstrated all six outcomes based on final assessment: 242 / 277 87%
Final Assessment Statistics Trial 5 - ECE 270, F’03
Outcome Successful
1 95.7%
2 94.9%
3 92.4%
4 90.3%
5 90.6%
6 88.8%
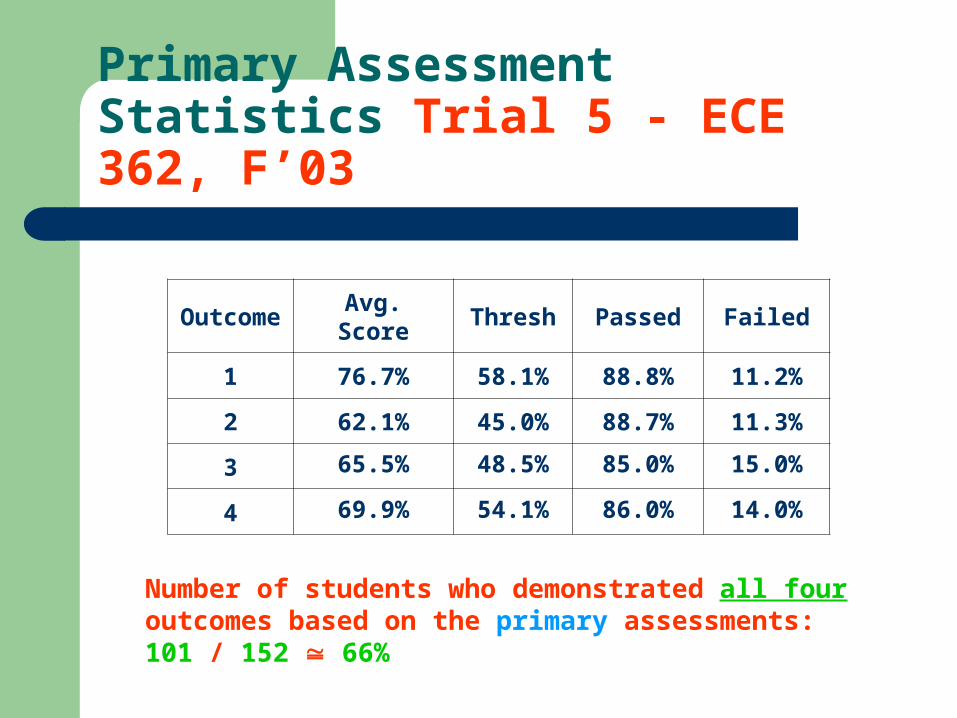
Primary Assessment Statistics Trial 5 - ECE 362, F’03
Number of students who demonstrated all four outcomes based on the primary assessments: 101 / 152 66%
Outcome Avg. Score Thresh Passed Failed
1 76.7% 58.1% 88.8% 11.2%
2 62.1% 45.0% 88.7% 11.3%
3 65.5% 48.5% 85.0% 15.0%
4 69.9% 54.1% 86.0% 14.0%
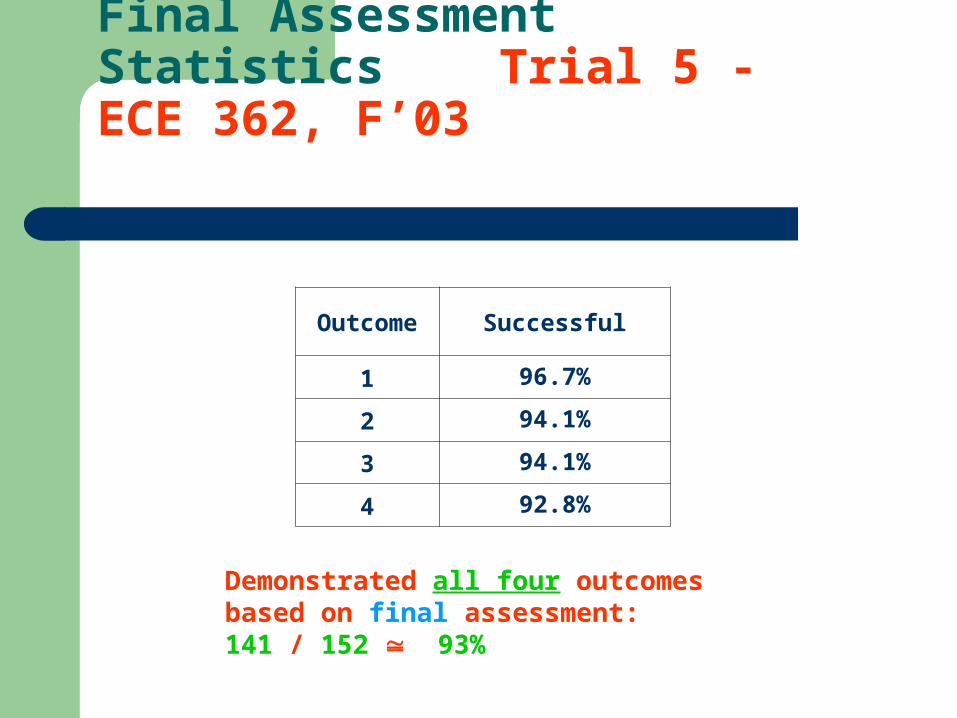
Demonstrated all four outcomes based on final assessment: 141 / 152 93%
Final Assessment Statistics Trial 5 - ECE 362, F’03
Outcome Successful
1 96.7%
2 94.1%
3 94.1%
4 92.8%
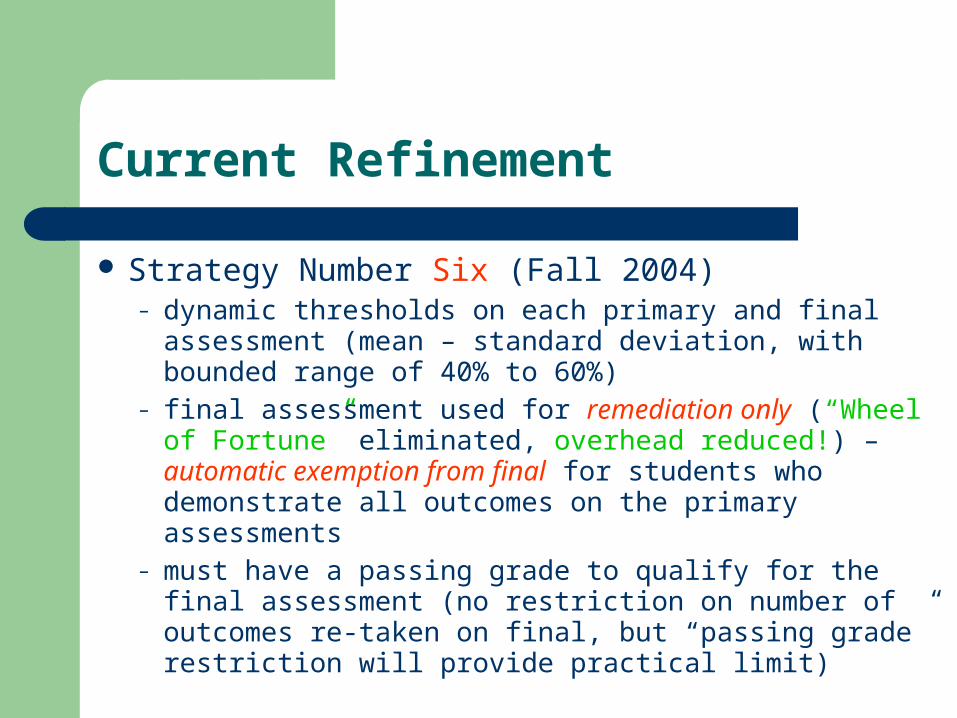
Current Refinement
Strategy Number Six (Fall 2004)– dynamic thresholds on each primary and final assessment
(mean – standard deviation, with bounded range of 40% to 60%)
– final assessment used for remediation only (“Wheel of Fortune” eliminated, overhead reduced!) – automatic exemption from final for students who demonstrate all outcomes on the primary assessments
– must have a passing grade to qualify for the final assessment (no restriction on number of outcomes re-taken on final, but “passing grade” restriction will provide practical limit)
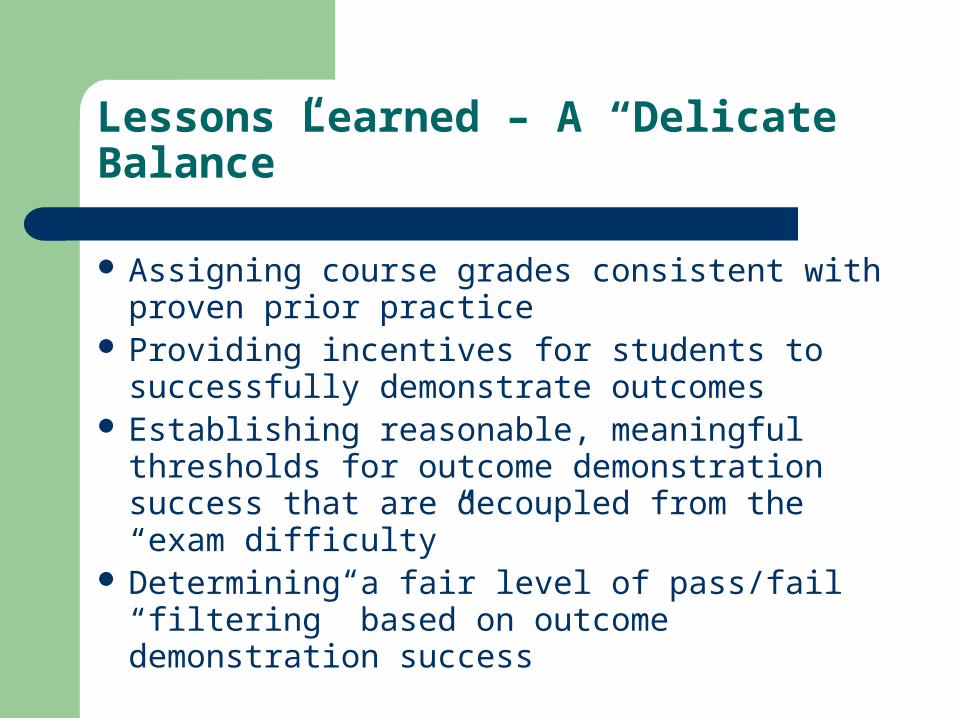
Lessons Learned – A “Delicate Balance”
Assigning course grades consistent with proven prior practice
Providing incentives for students to successfully demonstrate outcomes
Establishing reasonable, meaningful thresholds for outcome demonstration success that are decoupled from the “exam difficulty”
Determining a fair level of pass/fail “filtering” based on outcome demonstration success
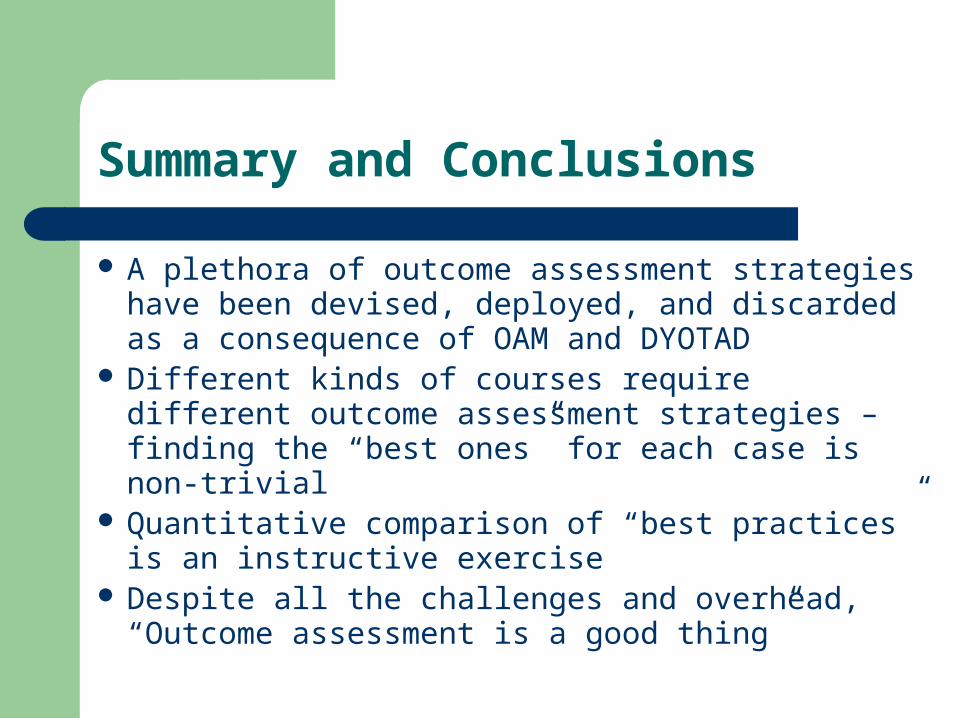
Summary and Conclusions
A plethora of outcome assessment strategies have been devised, deployed, and discarded as a consequence of OAM and DYOTAD
Different kinds of courses require different outcome assessment strategies – finding the “best ones” for each case is non-trivial
Quantitative comparison of “best practices” is an instructive exercise
Despite all the challenges and overhead, “Outcome assessment is a good thing”

More Information
Detailed information about the courses discussed in this presentation along with a copy
of the presentation slides can be found at
http://shay.ecn.purdue.edu/~dsml