Embed Size (px)
Citation preview
Part TWO
OVER AND BEYOND

Chapter 13 HIGH ALTITUDE WEATHER
Many general aviation as well as air carrier and military aircraft routinely fly the upper troposphere and lower stratosphere. Weather phenomena of these higher altitudes include the tropopause., the jet stream, cirrus clouds, clear air turbulence, con-
densation trails, high altitude "haze" layers, and canopy static. This chapter explains these phenomena along with the high altitude aspects of the more common icing and thunderstorm hazards.
135
1
II
j
THE TROPOPAUSE
Why is the high altitude pilot interested in the tropopause? Temperature and wind vary greatly in the vicinity of the tropopause affecting efficiency, comfort, and safety of flight . Maximum winds generally occur at levels near the tropopause. These strong winds create narrow zones of wind shear which often generate hazardous turbulence. Preflight knowledge of temperatu~e, . wind, and wind shear is important to flight planning.
In chapter 1, we learned that the tropopause is a thin layer forming the boundary between the troposphere and stratosphere. Height of the tropopause varies from about 65,000 feet over the Equator to 20,000 feet or lower over the poles. The
_ 045 0 _ 50·
I / , /
60,000' , /
I / I I I I \ \ I \
\ , 40,0000
, I
/
_ 45.0 -
,.-- .- O,AUSI
'OLAR 110'
_ 40°. - - - -- - -
20,000' -_ 30
0
- - - - - - - - --.-..-
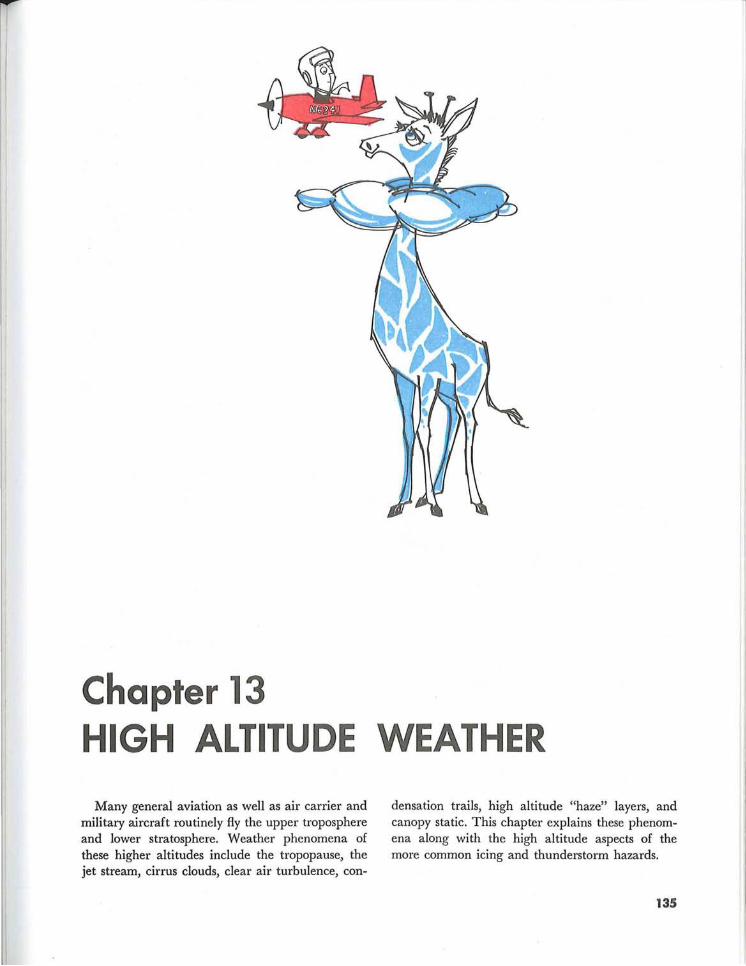
tropopause is not continuous but generally descends step-wise from the Equator to the poles. These steps occur as "breaks." Figure 123 is a cross section of the troposphere and lower stratosphere showing the tropopause and associated features . Note the break between the tropical and the polar tropopauses.
An abrupt change in temperature lapse rate characterizes the tropopause. Note in figure 123 how temperature above the tropical tropopause increases with height and how over the polar tropopause, temperature remains almost constant with height.
---_____ ._600
.-.... .:: ,.-
- 70 0
_ 70 0
_ 60··
_ 50°
_ 40°
_ 30°
-- ----- - 20°
- - _ 10· ..-
FIGURE 123. A cross section of the upper troposphere and lower stratosphere showing the tropopause and associated features. Note the "break" between the high tropical and the lower polar tropopause. Maximum winds occur in the vicinity of this break.
THE JET STREAM
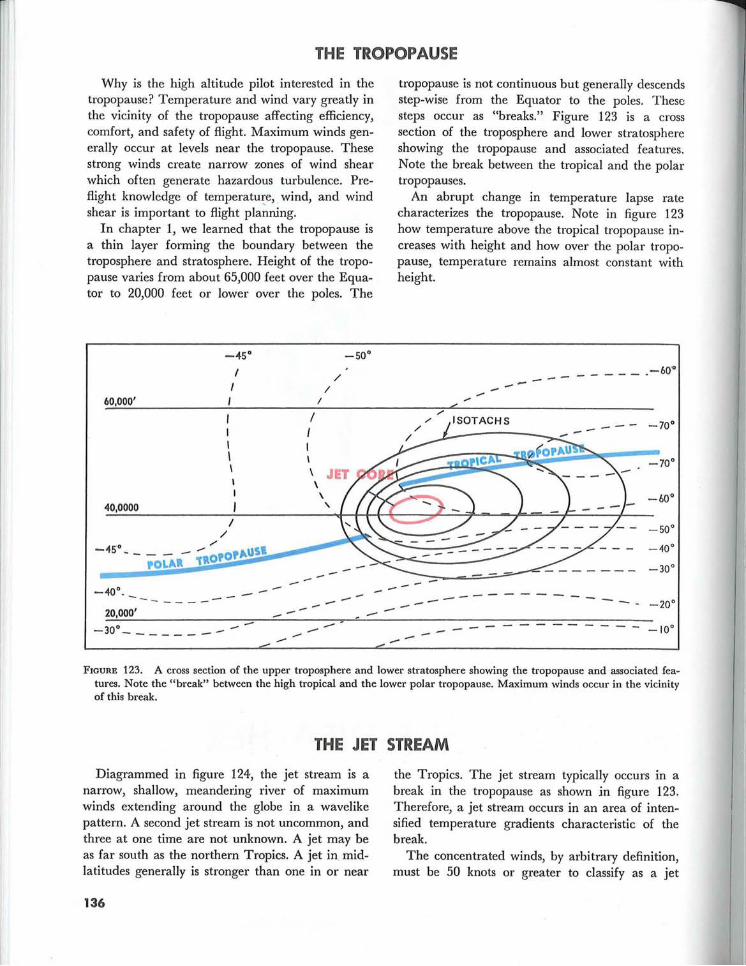
Diagrammed in figure 124, the jet stream is a narrow, shallow, meandering river of maximum winds extending around the globe in a wavelike pattern. A second jet stream is not uncommon, and three at one time are not unknown. A jet may be as far south as the northern Tropics. A jet in. midlatitudes generally is stronger than one in or near
136
the Tropics. The jet stream typically occurs in a break in the tropopause as shown in figure 123. Therefore, a jet stream occurs in an area of intensified temperature gradients characteristic of the break.
The concentrated winds, by arbitralY definition, must be 50 knots or greater to classify as a jet
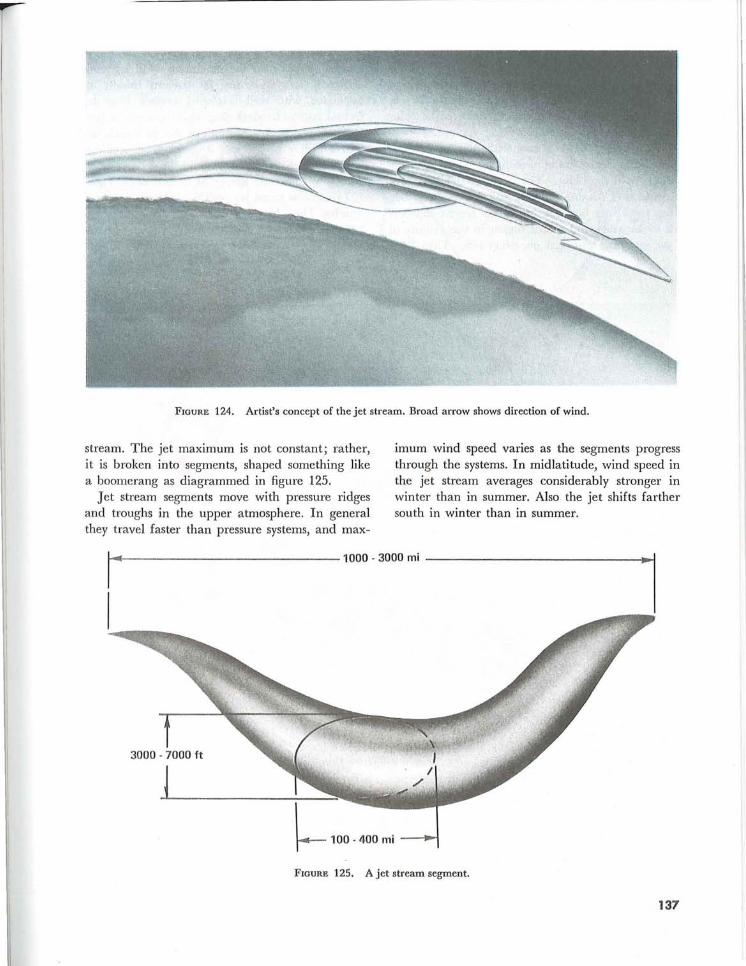
FIGURE 124. Artist's concept of the jet stream. Broad arrow shows direction of wind.
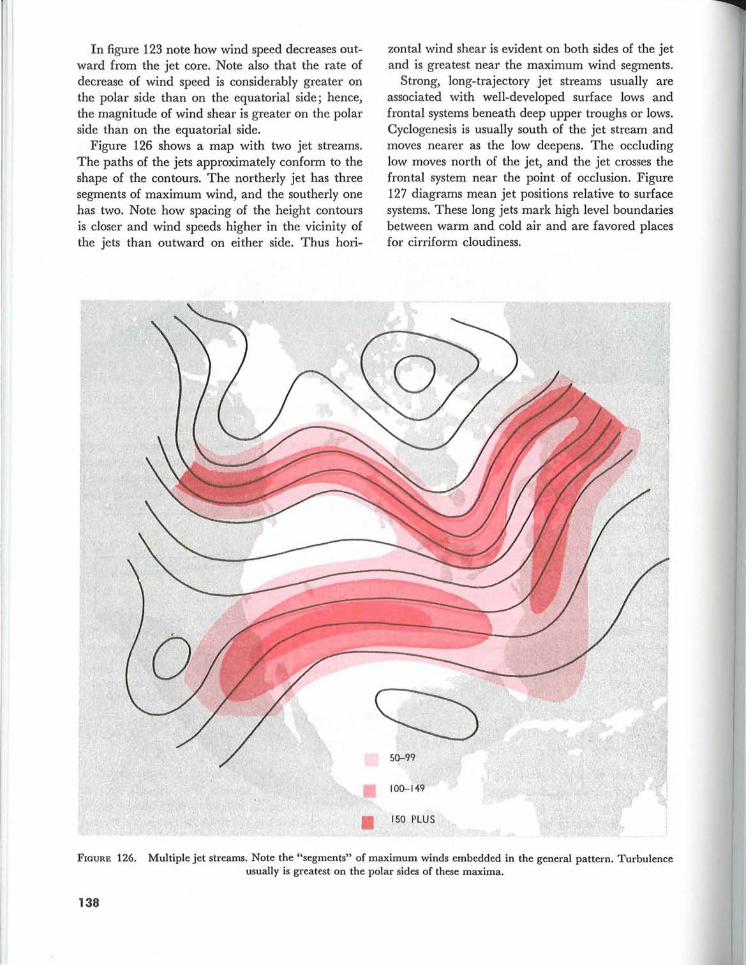
stream. The jet maximum is not constant; rather, it is broken into segments, shaped something like a boomerang as diagrammed in figure 125.
Jet stream segments move with pressure ridges and troughs in the upper atmosphere. In general they travel faster than pressure systems, and max-
imum wind speed varies as the segments progress through the systems. In midlatitude, wind speed in the jet stream averages considerably stronger in winter than in summer. Also the jet shifts farther south in winter than in summer.
I ~~4------------------------- 1000-3000mi ------------------------~~ I
I-- ,00 - 400 mi
FIGURE 125. A jet stream segment.
137
In figure 123 note how wind speed decreases outward from the jet core. Note also that the rate of decrease of wind speed is considerably greater on the polar side than on the equatorial side; hence, the magnitude of wind shear is greater on the polar side than on the equatorial side.
Figure 126 shows a map with two jet streams. The paths of the jets approximately conform to the shape of the contours. The northerly jet has three segments of maximum wind, and the southerly one has two. Note how spacing of the height contours is closer and wind speeds higher in the vicinity of the jets than outward on either side. Thus hori-
zontal wind shear is evident on both sides of the jet and is greatest near the maximum wind segments.
Strong, long-trajectory jet streams usually are associated with well-developed surface lows and frontal systems beneath deep upper troughs or lows. Cyclogenesis is usually south of the jet stream and moves nearer as the low deepens. The occluding low moves north of the jet, and the jet crosses the frontal system near the point of occlusion. Figure 127 diagrams mean jet positions relative to surface systems. These long jets mark high level boundaries between warm and cold air and are favored places for cirriform cloudiness.
50-99
• 100--149
• 150 PLUS
FIGURE 126. Multiple jet streams. Note the "segments" of maximum winds embedded in the general pattern. Turbulence usually is greatest on the polar sides of these maxima.
138
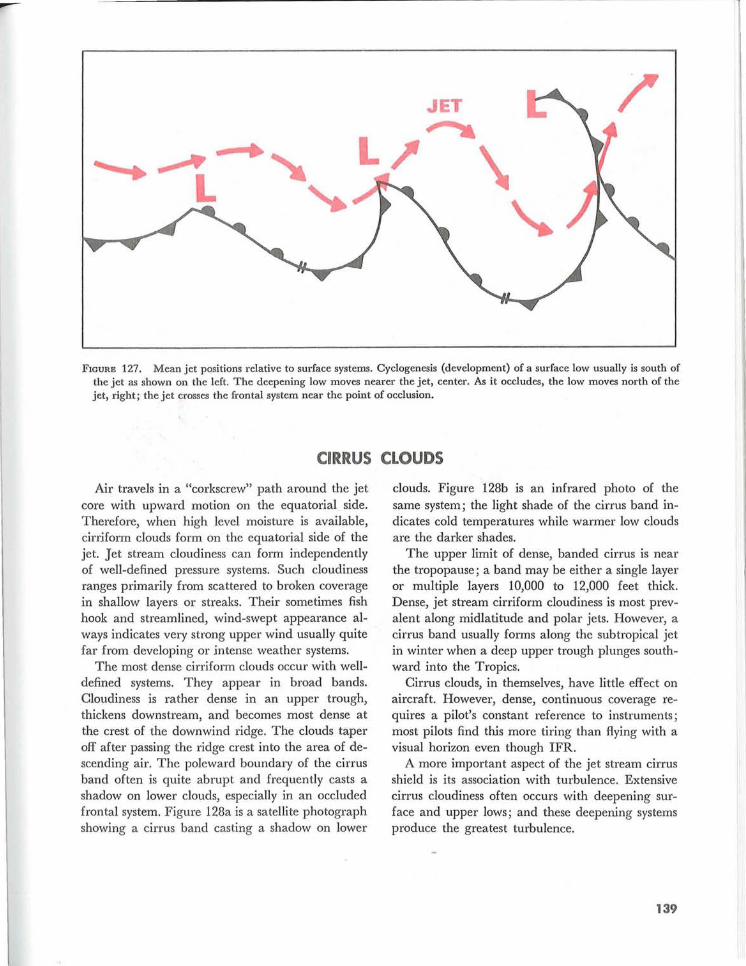
FIGURE 127. M ean jet positions relative to surface systems. Cyclogenesis (development) of a surface low usually is south of the jet as shown on the left. The deepening low moves nearer the jet, center. As it occludes, the low moves north of the jet, right; the jet crosses the frontal system near the point of occlusion.
CIRRUS CLOUDS
Air travels in a "corkscrew" path around the jet core with upward motion on the equatorial side. Therefore, when high level moisture is available, cirriform clouds form on the equatorial side of the jet. Jet stream cloudiness can form independently of well-defined pressure systems. Such cloudiness ranges primarily from scattered to broken coverage in shallow layers or streaks. Their sometimes fish hook and streamlined, wind-swept appearance always indicates very strong upper wind usually quite far from developing or intense weather systems.
The most dense cirriform clouds occur with welldefined systems. They appear in broad bands. Cloudiness is rather dense in an upper trough, thickens downstream, and becomes most dense at the crest of the downwind ridge. The clouds taper off after passing the ridge crest into the area of descending air. The poleward boundary of the cirrus band often is quite abrupt and frequently casts a shadow on lower clouds, especially in an occluded frontal system. Figure 128a is a satellite photograph showing a cirrus band casting a shadow on lower
clouds. Figure 128b is an infrared photo of the same system; the light shade of the cirrus band indicates cold temperatures while warmer low clouds are the darker shades.
The upper limit of dense, banded cirrus is near the tropopause; a band may be either a single layer or multiple layers 10,000 to 12,000 feet thick. Dense, jet stream cirriform cloudiness is most prevalent along midlatitude and polar jets. However, a cirrus band usually forms along the subtropical jet in winter when a deep upper trough plunges southward into the Tropics.
Cirrus clouds, in themselves, have little effect on aircraft. However, dense, continuous coverage requires a pilot's constant reference to instruments; most pilots find this more tiring than flying with a visual horizon even though IFR.
A more important aspect of the jet stream cirrus shield is its association with turbulence. Extensive cirrus cloudiness often occurs with deepening surface and upper lows; and these deepening systems produce the greatest turbulence.
139
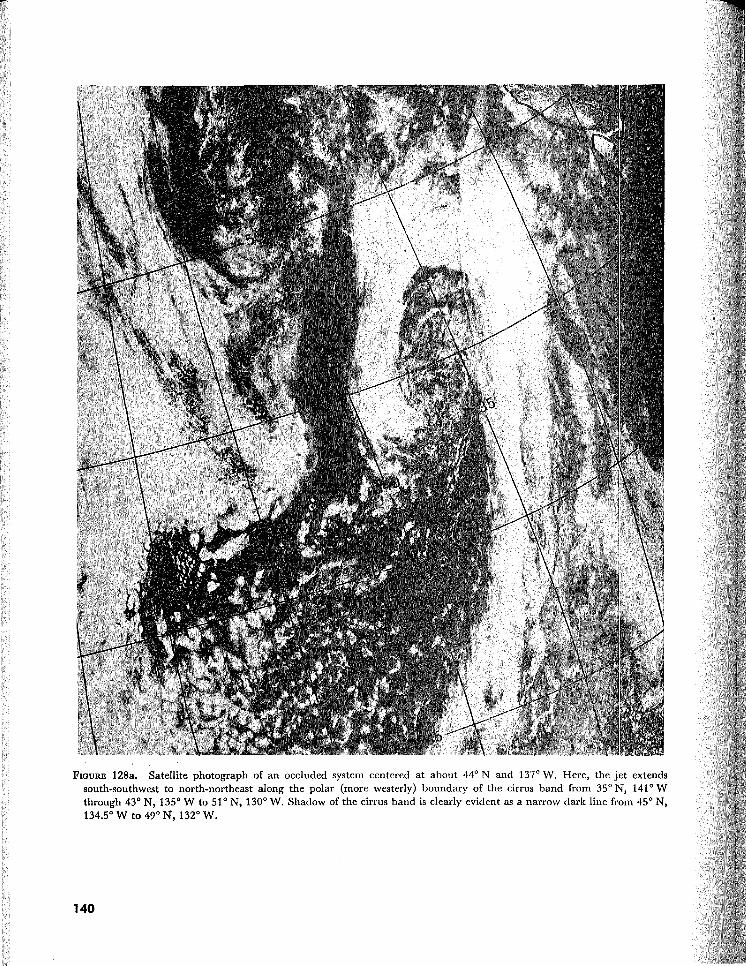
FIGURE 128a. Satellite photograph of an occluded system centered at about 44° Nand 13T W. Here, the jet extends south-southwest to north-northeast along the polar (more westerly) boundary of the cirrus band from 35° N, 141° W through 43° N, 135° W to 51 ° N, 130° W. Shadow of the cirrus band is clearly evident as a narrow dark line from 45° N, 134.5° W to 49° N, 132° W.
140
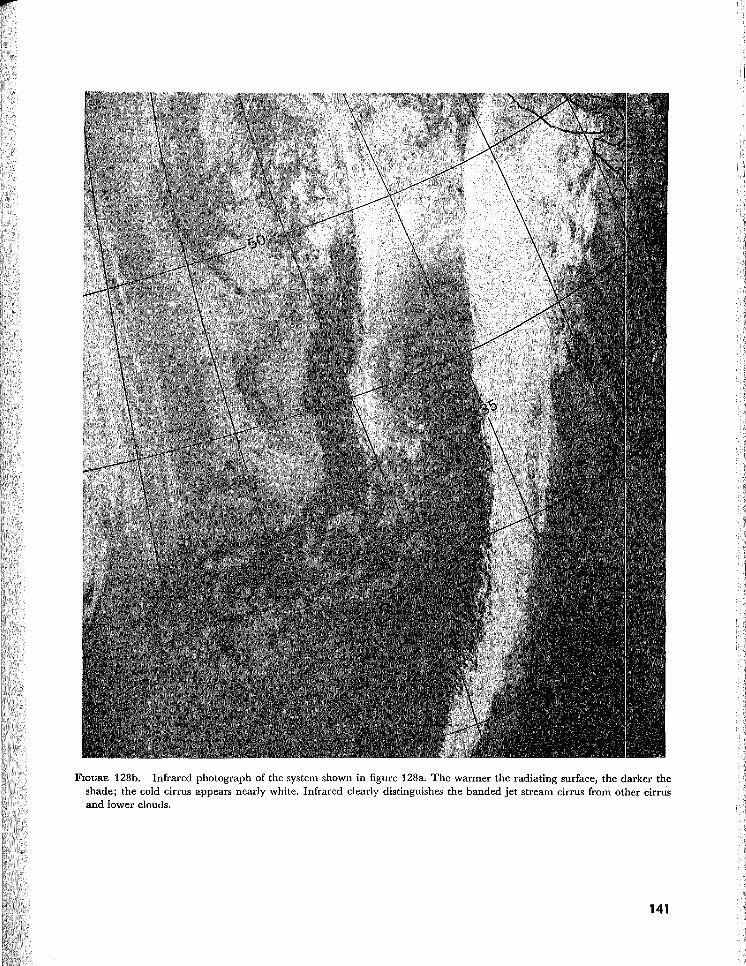
FIGURE 128b. Infrared photograph of the system shown in figure 128a. The warmer the radiating surface, the darker the shade; the cold cirrus appears nearly white. Infrared clearly distinguishes the banded jet stream cirrus from other cirrus and lower clouds.
141
CLEAR AIR TURBULENCE
Clear air turbulence (CAT) implies turbulence devoid of clouds. However, we commonly reserve the term for high level wind shear turbulence, even when in cirrus clouds.
Cold outbreaks colliding with warm air from the south intensify weather systems in the vicinity of the jet stream along the boundary between the cold and warm air. CAT develops in the turbulent energy exchange between the contrasting air masses. Cold and warm advection along with strong wind shears develop near the jet stream, especially where curvature of the jet stream sharply increases in deepening upper troughs. CAT is most pronounced in winter when temperature contrast is greatest between cold and warm air.
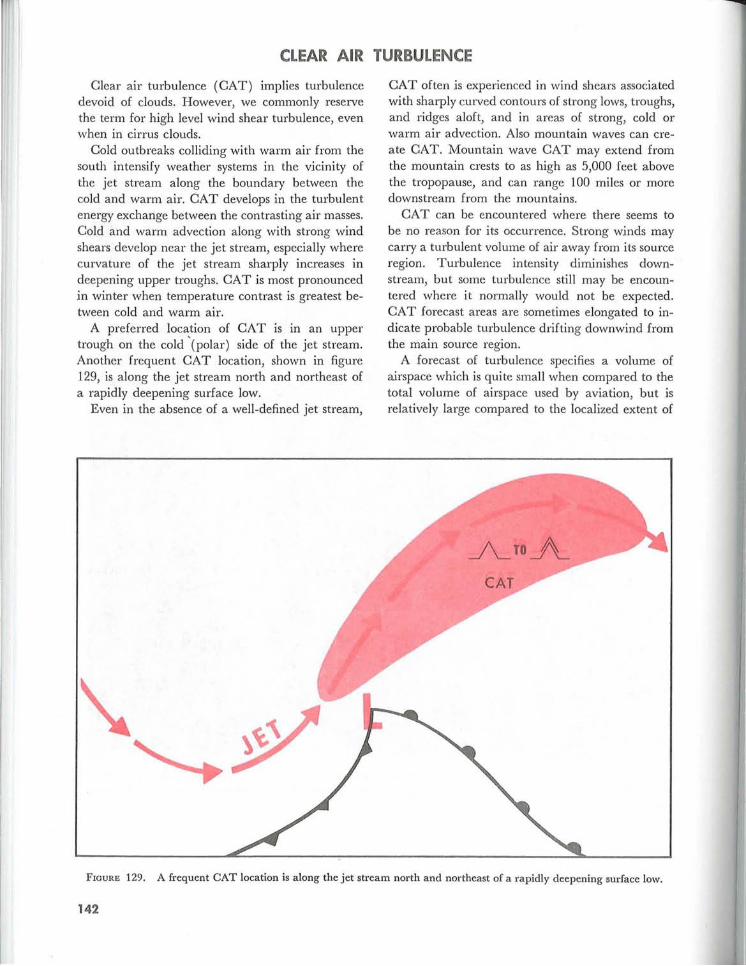
A preferred location of CAT is in an upper trough on the cold '( polar) side of the jet stream. Another frequent CAT location, shown in figure 129, is along the jet stream north and northeast of a rapidly deepening surface low.
Even in the absence of a well-defined jet stream,
CAT often is experienced in wind shears associated with sharply curved contours of strong lows, troughs, and ridges aloft, and in areas of strong, cold or warm air advection. Also mountain waves can create CAT. Mountain wave CAT may extend from the mountain crests to as high as 5,000 feet above the tropopause, and can range 100 miles or more downstream from the mountains.
CAT can be encountered where there seems to be no reason for its occurrence. Strong winds may carry a turbulent volume of air away from its source region. Turbulence intensity diminishes downstream, but some turbulence still may be encountered where it normally would not be expected. CAT forecast areas are sometimes elongated to indicate probable turbulence drifting downwind from the main source region.
A forecast of turbulence specifies a volume of airspace which is quite small when compared to the total volume of airspace used by aviation, but is relatively large compared to the localized extent of
FIGURE 129. A frequent CAT location is along the jet stream north and northeast of a rapidly deepening surface low.
142
the hazard. Since turbulence in the forecast vol. ume is patchy, you can expect to encounter it only intermittently and possibly not at all. A flight through forecast turbulence, on the average, en· counters only light and annoying turbulence 10 to 15 percent of the time; about 2 to 3 percent of the time there is a need to have all objects secured; the pilot experiences control problems only about two·tenths of 1 percent of the time-Ddds of this genuinely hazardous turbulence are about 1 in 500.
Look again at figure 126. Where are the most probable areas of CAT? Turbulence would be greatest near the windspeed maxima, usually on the polar sides where there is a combination of strong wind shear, curvature in the flow, and cold air advection. These areas would be to the northwest of Vancouver Island, from north of the Great Lakes to east of James Bay and over the Atlantic east of Newfoundland. Also, turbulence in the form of mountain waves is probable in the vicinity of the jet stream from southern California across the Rockies into the Central Plains.
In flight planning, use upper air charts and forecasts to locate the jet stream, wind shears, and areas of most probable turbulence. AVIATION WEATHER SERVICES (AC 00-45) explains in detail how to
obtain these parameters. If impractical to avoid completely an area of forecast turbulence, proceed with caution. You will do well to avoid areas where vertical shear exceeds 6 knots per 1,000 feet or horizontal shear exceeds 40 knots per 150 miles.
What can you do if you get into CAT rougher than you care to fly? If near the jet core, you could climb or descend a few thousand feet or you could move farther from the jet core. If caught in CAT not associated with the jet stream, your best bet is to change altitude since you have no positive way of knowing in which direction the strongest shear lies. Pilot reports from other flights, when available, are helpful.
Flight maneuvers increase stresses on the aircraft as does turbulence. The increased stresses are cumulative when the aircraft maneuvers in turbulence. Maneuver gently when in turbulence to minimize stress. The patchy nature of CAT makes current pilot reports extremely helpful to observers, briefers, forecasters, air traffic controllers, and, most important, to your fellow pilots. Always, if at all possible, make inflight weather reports of CAT or other turbulence encounters; negative reports also help when no CAT is experienced where it normally might be expected.
CONDENSATION TRAILS
A condensation trail, popularly contracted to "contrail," is generally defined as a cloud-like streamer which frequently is generated in the wake of aircraft flying in clear, cold, humid air, figure 130. Two distinct types are observed-exhaust trails and aerodynamic trails. "Distrails," contracted from dissipation trails, are produced differently from exhaust and aerodynamic trails.
EXHAUST CONTRAILS The exhaust contrail is formed by the addition
to the atmosphere of sufficient water vapor from aircraft exhaust gases to cause saturation or supersaturation of the air. Since heat is also added to the atmosphere in the wake of an aircraft, the addition of water vapor must be of such magnitude that it saturates or supersaturates the atmosphere in spite of the added heat. There is evidence to support the idea that the nuclei which are necessary for con· densation or sublimation may also be donated to the atmosphere in the exhaust gases of aircraft engines, further aiding contrail formation. These
nuclei are relatively large. Recent experiments, however, have revealed that visible exhaust contrails may be prevented by adding very minute nuclei material (dust, for example) to the exhaust. Condensation and sublimation on these smaller nuclei result in contrail particles too small to be visible.
AERODYNAMIC CONTRAILS In air that is almost saturated, aerodynamic
pressure reduction around airfoils, engine nacelles, and propellers cools the air to saturation leaving condensation trails from these components. This type of trail usually is neither as dense nor as persistent as exhaust trails. However, under critical atmospheric conditions, an aerodynamic contrail may trigger the formation and spreading of a deck of cirrus clouds.
Contrails create one problem unique to military operations in that they reveal the location of an aircraft attempting to fly undetected. A more general operational problem is a cirrus layer sometimes induced by the contrail. The induced layer
143
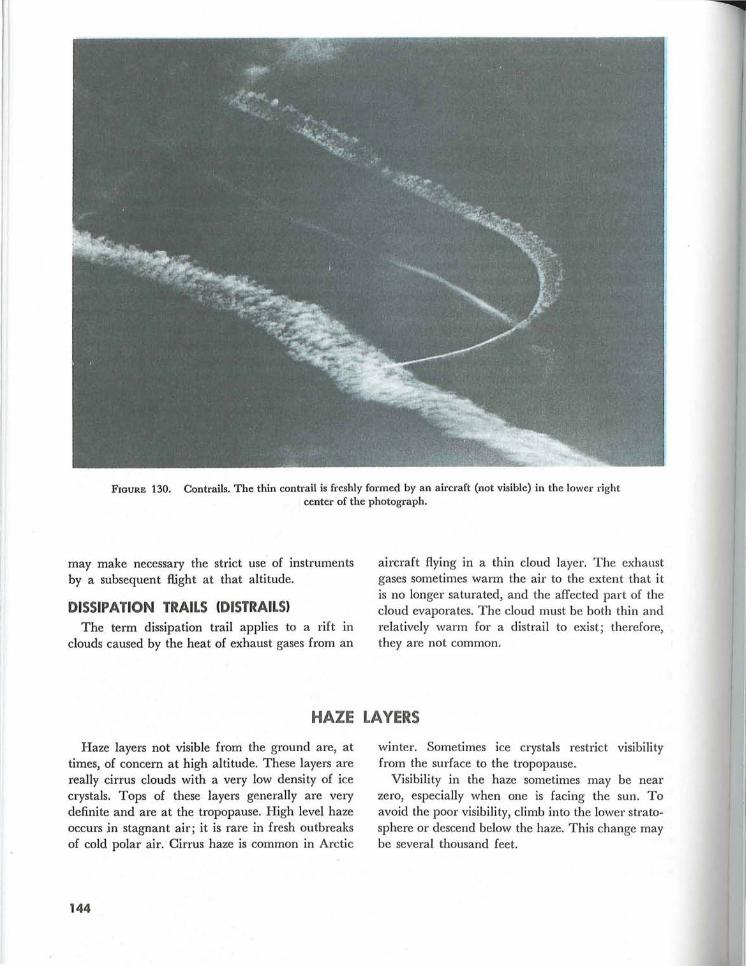
FIGURE 130. Contrails. The thin contrail is freshly formed by an aircraft (not visible) in the lower right center of the photograph.
may make necessary the strict use of instruments by a subsequent flight at that altitude.
DISSIPATION TRAILS (DISTRAILS) The term dissipation trail applies to a rift in
clouds caused by the heat of exhaust gases from an
aircraft flying in a thin cloud layer. The exhaust gases sometimes warm the air to the extent that it is no longer saturated, and the affected part of the cloud evaporates. The cloud must be both thin and relatively warm for a distrail to exist; therefore, they are not common.
HAZE LAYERS
Haze layers not visible from the ground are, at times, of concern at high altitude. These layers are really cirrus clouds with a very low density of ice crystals. Tops of these layers generally are very definite and are at the tropopause. High level haze occurs in stagnant air; it is rare in fresh outbreaks of cold polar air. Cirrus haze is common in Arctic
144
winter. Sometimes ice crystals restrict visibility from the surface to the tropopause.
Visibility in the haze sometimes may be near zero, especially when one is facing the sun. To avoid the poor visibility, climb into the lower stratosphere or descend below the haze. This change may be several thousand feet.
r <j
CANOPY STATIC
Canopy static, similar to the precipitation static sometimes encountered at lower levels, is produced by particles brushing against plastic-covered aircraft surfaces. The discharge of static electricity results in a noisy disturbance that interferes with
radio reception. Discharges can occur in such rapid succession that interference seems to be continuous. Since dust and ice crystals in cirrus clouds are the primary producers of canopy static, usually you may eliminate it by changing altitude.
ICING
Although icing at high altitude is not as common or extreme as at low altitudes, it can occur. It can form quickly on airfoils and exposed parts of jet engines. Structural icing at high altitudes usually is rime, although clear ice is possible.
High altitude icing generally forms in tops of tall cumulus buildups, anvils, and even in detached cirrus. Clouds over mountains are more likely to contain liquid water than those over more gently sloping terrain because of the added lift of the
mountains. Therefore, icing is more likely to occur and to be more hazardous over mountainous areas.
Because ice generally accumulates slowly at high altitudes, anti-icing equipment usually eliminates any serious problems. However, anti-icing systems currently in use are not always adequate. If such is the case, avoid the icing problem by changing altitude or by varying course to remain clear of the clouds. Chapter 10 discusses aircraft icing in more detail.
THUNDERSTORMS
A well-developed thunderstorm may extend upward through the troposphere and penetrate the lower stratosphere. Sometimes the main updraft in a thunderstorm may toss hail out the top or the upper portions of the storm. An aircraft may encounter hail in clear air at a considerable distance from the thunderstorm, especially under the anvil cloud. Turbulence may be encountered in clear air for a considerable distance both above and around a growing thunderstorm.
Thunderstorm avoidance rules given in chapter 11 apply equally at high altitude. When flying in the clear, visually avoid all thunderstorm tops. In a severe thunderstorm situation, avoid tops by at least 20 miles. When you are on instruments, weather avoidance radar assures you of avoiding thunderstorm hazards. If in an area of severe thunderstorms, avoid the most intense echoes by at least 20 miles. Most air carriers now use this distance as the minimum for thunderstorm avoidance.
145

Chapter 14 ARCTIC WEATHER
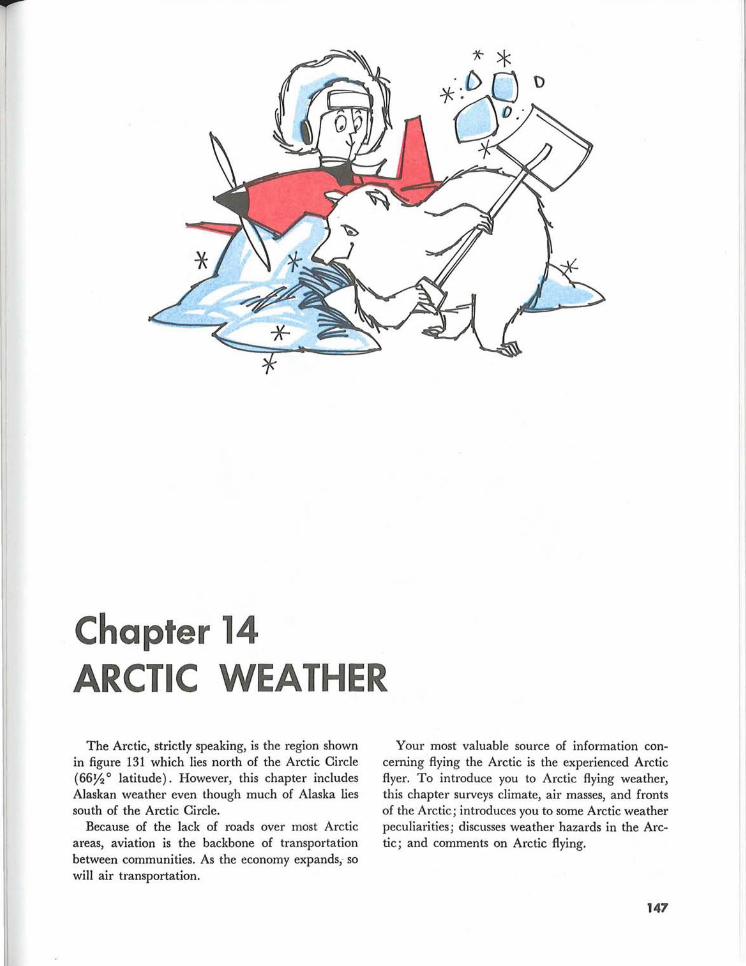
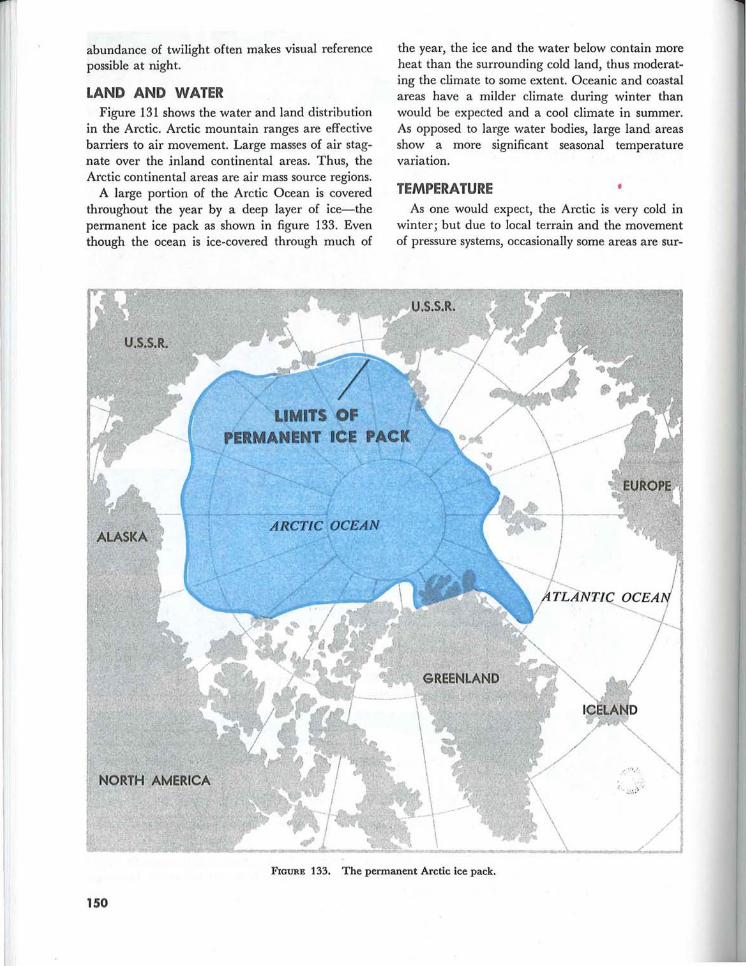
The Arctic, strictly speaking, is the region shown in figure 131 which lies north of the Arctic Circle (66~ 0 latitude). However, this chapter includes Alaskan weather even though much of Alaska lies south of the Arctic Circle.
Because of the lack of roads over most Arctic areas, aviation is the backbone of transportation between communities. As the economy expands,- so will air transportation.
Your most valuable source of information concerning flying the Arctic is the experienced Arctic flyer. To introduce you to Arctic flying weather, this chapter surveys climate, air masses, and fronts of the Arctic; introduces you to some Arctic weather peculiarities; discusses weather hazards in the Arctic; and comments on Arctic flying.
147
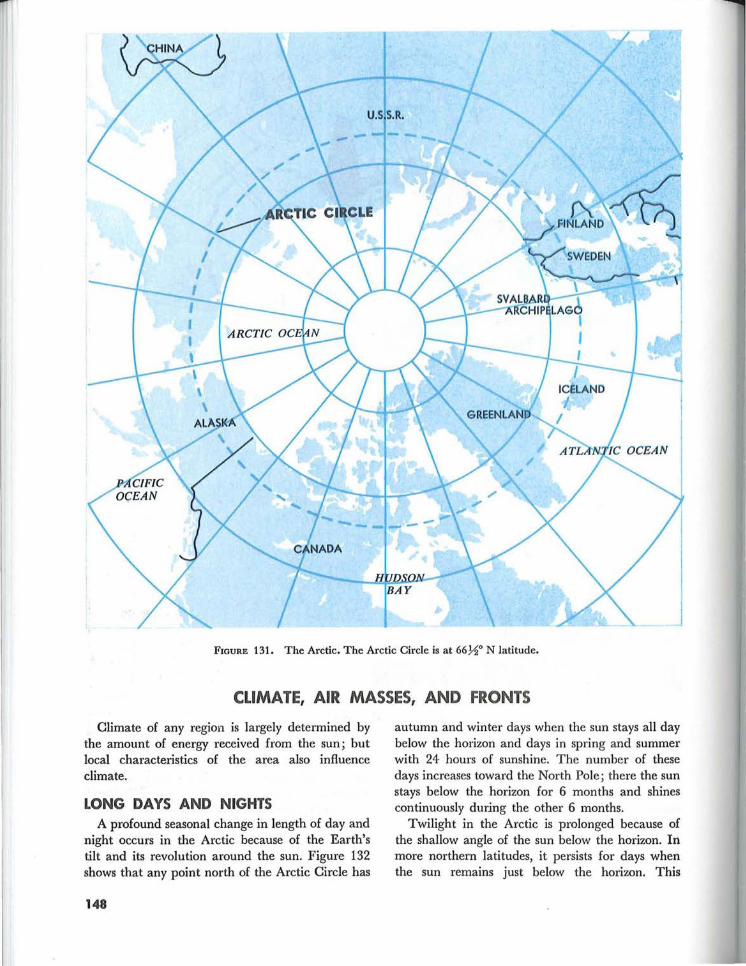
FIGURE 131. The Arctic. The Arctic Circle is at 66~o N latitude.
CLIMATE, AIR MASSES, AND FRONTS
Climate of any region is largely determined by the amount of energy received from the sun; but local characteristics of the area also influence climate.
LONG DAYS AND NIGHTS A profound seasonal change in length of day and
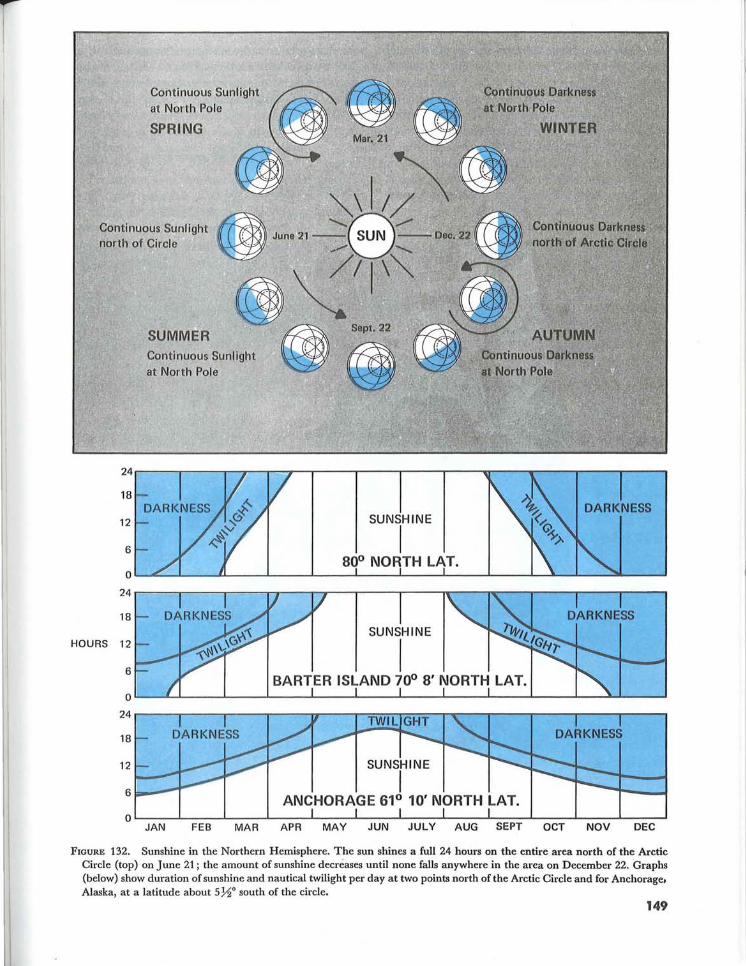
night occurs in the Arctic because of the Earth's tilt and its revolution around the sun. Figure 132 shows that any point north of the Arctic Circle has
148
autumn and winter days when the sun stays all day below the horizon and days in spring and summer with 24 hours of sunshine. The number of these days increases toward the North Pole; there the sun stays below the horizon for 6 months and shines continuously during the other 6 months.
Twilight in the Arctic is prolonged because of the shallow angle of the sun below the horizon. In more northern latitudes, it persists for days when the sun remains just below the horiwn. This
SUMMER
24
18
12
6
SUNSHINE
I 80° NORTH LAT.
0
24
18 SUNSHINE
HOURS 12
6 I BARTER ISLAND 70° 8' NORTH LAT.
0
24
18
12 SUNSHINE
6 I ANCHORAGE 61° 10' NORTH LAT.
0 JAN FEB MAR APR MAY JUN AUG SEPT OCT NOV DEC
FIGURE 132. Sunshine in the Northern Hemisphere. The sun shines a full 24 hours on the entire area north of the Arctic Circle (top) on June 21; the amount of sunshine decreases until none falls anywhere in the area on December 22. Graphs (below) show duration of sunshine and nautical twilight per day at two points north of the Arctic Circle and for Anchorage. Alaska, at a latitude about 5 Yz0 south of the circle.
149
abundance of twilight often makes visual reference possible at night.
LAND AND WATER Figure 131 shows the water and land distribution
in the Arctic. Arctic mountain ranges are effective barriers to air movement. Large masses of air stagnate over the inland continental areas. Thus, the Arctic continental areas are air mass source regions.
A large portion of the Arctic Ocean is covered throughout the year by a deep layer of ice-the permanent ice pack as shown in figure 133. Even though the ocean is ice-covered through much of
the year, the ice and the water below contain more heat than the surrounding cold land, thus moderating the climate to some extent. Oceanic and coastal areas have a milder climate during winter than would be expected and a cool climate in summer. As opposed to large water bodies, large land areas show a more significant seasonal temperature variation.
TEMPERATURE As one would expect, the Arctic is very cold in
winter; but due to local terrain and the movement of pressure systems, occasionally some areas are sur-
IOELAND
. .......
f r
,/1 / !
____ ~.~ ______ ~~~ __ J
FIGURE 133. The pennanent Arctic ice pack.
150
prisingly warm. During winter, coastal areas average about 20 degrees warmer than the interior. During summer, interior areas are pleasantly warm with many hours of sunshine. Coastal areas have relatively cool short summers due to their proximity to water.
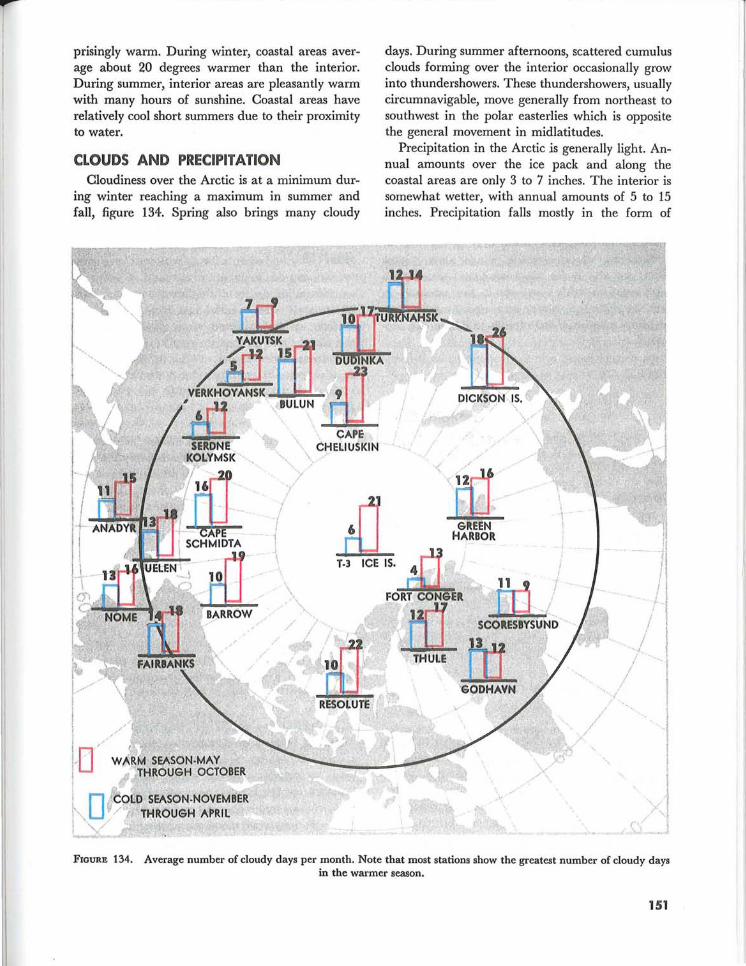
CLOUDS AND PRECIPITATION Cloudiness over the Arctic is at a minimum dur
ing winter reaching a maximum in summer and fall, figure 134. Spring also brings many cloudy
I " 1/""" i I I // to' W,ARM SEASON.MAY I rHROUGH OCTOBER I
l :, to' COLD SEASON·NOVEMBER I'" '1/'/ ~ THROUGH APRIL t~~~( 4 z .' '.; ,
CAPE , \. CHELIUSKIN "''', \. )'
! I 1
days. During summer afternoons, scattered cumulus clouds forming over the interior occasionally grow into thundershowers. These thundershowers, usually circumnavigable, move generally from northeast to southwest in the polar easterlies which is opposite the general movement in midlatitudes.
Precipitation in the Arctic is generally light. Annual amounts over the ice pack and along the coastal areas are only 3 to 7 inches. The interior is somewhat wetter, with annual amounts of 5 to 15 inches. Precipitation falls mostly in the form of
J t.
/ .j
/1 'j I
",1
! I
y.l ./ 'i
FIGURE 134. Average number of cloudy days per month. Note that most stations show the greatest number of cloudy days in the warmer season.
151
snow over ice caps and oceanic areas and mostly as summer rain over interior areas.
WIND Strong winds occur more often along the coasts
than elsewhere. The frequency of high winds in coastal areas is greatest in fall and winter. Wind speeds are generally light in the continental interior during the entire year, but are normally at their strongest during summer and fall.
AIR MASSES-WINTER In winter, air masses form over the expanded ice
pack and adjoining snow-covered land areas. These air masses are characterized by very cold surface air, very low humidity, and strong low-level temperature inversions. Occasionally, air from unfrozen ocean areas flows northward over the Arctic. These intrusions of moist, cold air account for most of the
infrequent wintertime cloudiness and precipitation in the Arctic.
AIR MASSES-SUMMER During the summer, the top layer of the Arctic
permafrost layer melts leaving very moist ground, and the open water areas of the Polar Basin increase markedly. Thus, the entire area becomes more humid, relatively mild, and semimaritime in character. The largest amount of cloudiness and precipitation occurs inland during the summer months.
FRONTS Occluded fronts are the rule. Weather conditions
with occluded fronts are much the same in the Arctic as elsewhere-low clouds, precipitation, poor visibility, and sudden fog formation. Fronts are much more frequent over coastal areas than over the interior.
ARCTIC PECULIARITIES
Several Arctic phenomena are peculiar to that region. At times, they have a direct bearing on Arctic flying.
EFFECTS OF TEMPERATURE INVERSION The intense low-level inversion over the Arctic
during much of the winter causes sound-including people's voices-to carryover extremely long distances. Light rays are bent as they pass at low angles through the inversion. This bending creates an effect known as looming-a form of mirage that causes objects beyond the horizon to appear above the horizon. Mirages distorting the shape of the sun, moon, and other objects are common with these low level inversions.
AURORA BOREALIS In theory, certain energy particles from the sun
strike the Earth's magnetic field and are carried along the lines of force where they tend to lower and converge near the geomagnetic poles. The energy particles then pass through rarefied gases of the outer atmosphere, illuminating them in much the same way as an electrical charge illuminates neon gas in neon signs.
The Aurora Borealis takes place at high altitudes above the Earth's surface and thus has been observed as far south as Florida. However, the highest
152
frequency of observations is over the northern United States and northward. Displays of aurora vary from a faint glow to an illumination of the Earth's surface equal to a full moon. They frequently change shape and form and are also called dancing lights or northern lights.
LIGHT REFLECTION BY SNOW-COVERED SURFACES
Much more light is reflected by snow-covered surfaces than by darker surfaces. Snow often reflects Arctic sunlight sufficiently to blot out shadows, thus markedly decreasing the contrast between objects. Dark distant mountains may be easily recognized, but a crevasse normally directly in view may be undetected due to lack of contrasts.
LIGHT FROM CELESTIAL BODIES Illumination from the moon and stars is much
more intense in the Arctic than in lower latitudes. Pilots have found that light from a half-moon over a snow-covered field may be sufficient for landing. Even illumination from the stars creates visibility far beyond that found elsewhere. Only under heavy overcast skies does the night darkness in the Arctic begin to approach the degree of darkness in lower latitudes.
WEATHER HAZARDS
Weather hazards include visibility restricting phenomena, blowing snow, icing, frost, and lack of contrast-whiteout.
FOG Fog limits landing and takeoff in the Arctic more
than any other visibility restriction. Water-droplet fog is the main hazard to aircraft operations in coastal areas during the summer. Ice fog is the major restriction in winter.
Ice Fog Ice fog is common in the Arctic. It forms in
moist air during extremely cold, calm conditions in winter, occurring often and tending to persist. Effective visibility is reduced much more in ice fog when one is looking toward the sun. Ice fog may be produced both naturally and artificially. Ice fog affecting aviation operations most frequently is produced by the combustion of aircraft fuel in cold air. When the wind is very light and the temperature is about -300 F or colder, ice fog often forms instantaneously in the exhaust gases of automobiles and aircraft. It lasts from as little as a few minutes to days.
Steam Fog Steam fog, often called "sea smoke," forms in
winter when cold, dry air passes from land areas over comparatively warm ocean waters. Moisture evaporates rapidly from the water surface; but since the cold air can hold only a small amount of water vapor, condensation takes place just above the surface of the water and appears as "steam" rising from the ocean. This fog is composed entirely of water droplets that often freeze quickly and fall back into the water as ice particles. Low level turbulence can occur and icing can become hazardous.
Advection Fog Advection fog, which may be composed either of
water droplets or of ice crystals, is most common in winter and is often persistent. Advection fog forms along coastal areas when comparatively warm, moist, oceanic air moves over cold land. If the land areas are hilly or mountainous, lifting of the air results in a combination of low stratus and fog. The stratus and fog quickly diminish inland. Lee sides of islands and mountains usually are free of advection fog because of drying due to compressional
heating as the air descends downslope. Icing in advection fog is in the form of rime and may become quite severe.
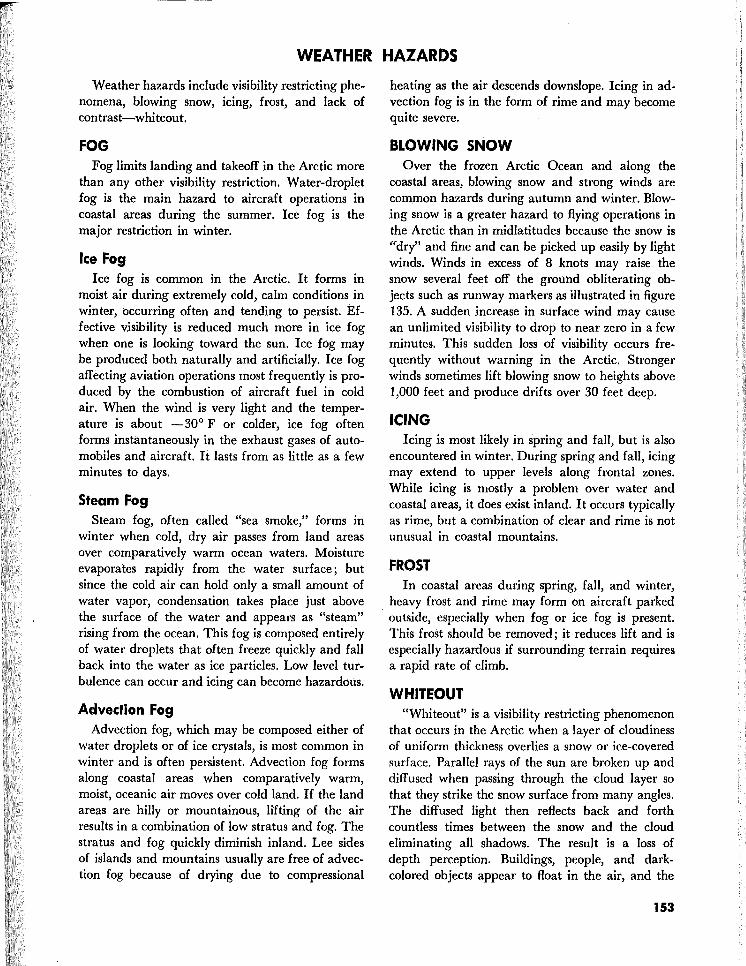
BLOWING SNOW Over the frozen Arctic Ocean and along the
coastal areas, blowing snow and strong winds are common hazards during autumn and winter. Blowing snow is a greater hazard to flying operations in the Arctic than in mid latitudes because the snow is «dry" and fine and can be picked up easily by light winds. Winds in excess of 8 knots may raise the snow several feet off the ground obliterating objects such as runway markers as illustrated in figure 135. A sudden increase in surface wind may cause an unlimited visibility to drop to near zero in a few minutes. This sudden loss of visibility occurs frequently without warning in the Arctic. Stronger winds sometimes lift blowing snow to heights above 1,000 feet and produce drifts over 30 feet deep.
ICING Icing is most likely in spring and fall, but is also
encountered in winter. During spring and fall, icing may extend to upper levels along frontal zones. While icing is mostly a problem over water and coastal areas, it does exist inland. It occurs typically as rime, but a combination of clear and rime is not unusual in coastal mountains.
FROST In coastal areas during spring, fall, and winter,
heavy frost and rime may form on aircraft parked outside, especially when fog or ice fog is present. This frost should be removed; it reduces lift and is especially hazardous if surrounding terrain requires a rapid rate of climb.
WHITEOUT "Whiteout" is a visibility restricting phenomenon
that occurs in the Arctic when a layer of cloudiness of uniform thickness overlies a snow or ice-covered surface. Parallel rays of the sun are broken up and diffused when passing through the cloud layer so that they strike the snow surface from many angles. The diffused light then reflects back and forth countless times between the snow and the cloud eliminating all shadows. The result is a loss of depth perception. Buildings, people, and darkcolored objects appear to float in the air, and the
153
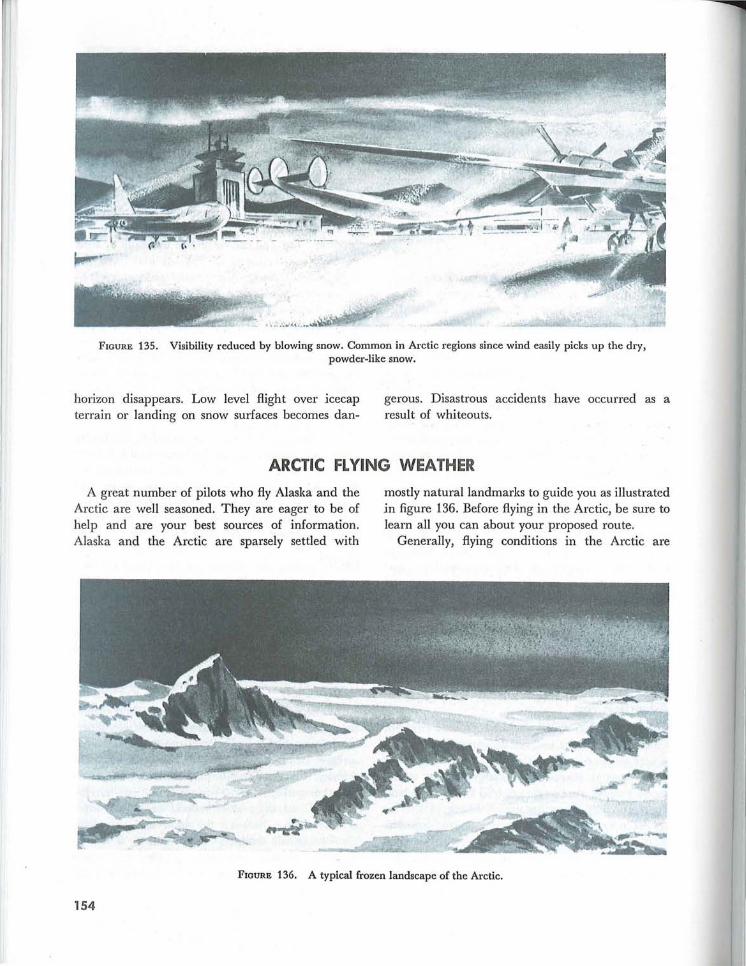
FIGURE 135. Visibility reduced by blowing snow. Common in Arctic regions since wind easily picks up the dry, powder-like snow.
horizon disappears. Low level flight over icecap terrain or landing on snow surfaces becomes dan-
gerous. Disastrous accidents have occurred as a result of whiteouts.
ARCTIC FLYING WEATHER
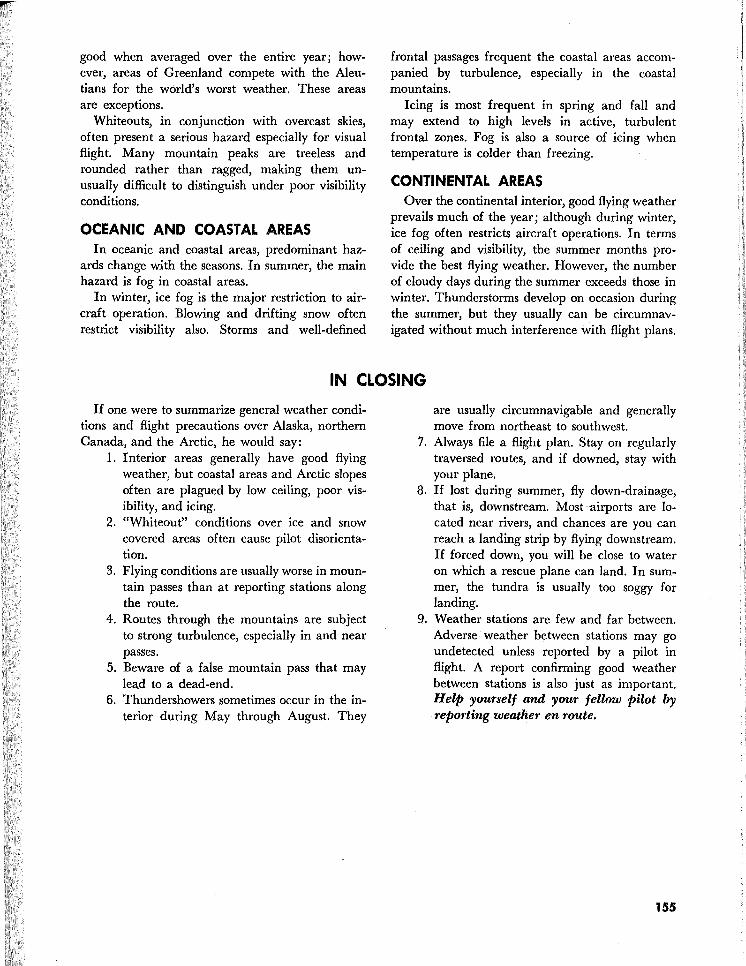
A great number of pilots who fly Alaska and the Arctic are well seasoned. They are eager to be of help and are your best sources of information. Alaska and the Arctic are sparsely settled with
mostly natural landmarks to guide you as illustrated in figure 136. Before flying in the Arctic, be sure to learn all you can about your proposed route.
Generally, flying conditions in the Arctic are
FIGURE 136. A typical frozen landscape of the Arctic.
154
good when averaged over the entire year; however, areas of Greenland compete with the Aleutians for the world's worst weather. These areas are exceptions.
Whiteouts, in conjunction with overcast skies, often present a serious hazard especially for visual flight. Many mountain peaks are treeless and rounded rather than ragged, making them unusually difficult to distinguish under poor visibility conditions.
OCEANIC AND COASTAL AREAS In oceanic and coastal areas, predominant haz
ards change with the seasons. In summer, the main hazard is fog in coastal areas.
In winter, ice fog is the major restriction to aircraft operation. Blowing and drifting snow often restrict visibility also. Storms and well-defined
frontal passages frequent the coastal areas accompanied by turbulence, especially in the coastal mountains.
Icing is most frequent in spring and fall and may extend to high levels in active, turbulent frontal zones. Fog is also a source of icing when temperature is colder than freezing.
CONTINENTAL AREAS Over the continental interior, good flying weather
prevails much of the year; although during winter, ice fog often restricts aircraft operations. In terms of ceiling and visibility, the summer months provide the best flying weather. However, the number of cloudy days during the summer exceeds those in winter. Thunderstorms develop on occasion during the summer, but they usually can be circumnavigated without much interference with flight plans.
IN CLOSING
If one were to summarize general weather conditions and flight precautions over Alaska, northern Canada, and the Arctic, he would say:
1. Interior areas generally have good flying weather, but coastal areas and Arctic slopes often are plagued by low ceiling, poor visibility, and icing.
2. "Whiteout" conditions over ice and snow covered areas often cause pilot disorientation.
3. Flying conditions are usually worse in mountain passes than at reporting stations along the route.
4. Routes through the mountains are subject to strong turbulence, especially in and near passes.
5. Beware of a false mountain pass that may lead to a dead-end.
6. Thundershowers sometimes occur in the interior during May through August. They
are usually circumnavigable and generally move from northeast to southwest.
7. Always file a flight plan. Stay on regularly traversed routes, and if downed, stay with your plane.
8. If lost during summer, fly down-drainage, that is, downstream. Most-airports are located near rivers, and chances are you can reach a landing strip by flying downstream. If forced down, you will be close to water on which a rescue plane can land. In summer, the tundra is usually too soggy for landing.
9. Weather stations are few and far between. Adverse weather between stations may go undetected unless reported by a pilot in flight. A report confirming good weather between stations is also just as important. Help yourself and your fellow pilot by reporting weather en route.
155

Chapter 15 TROPICAL WEATHER
Technically, the Tropics lie between latitudes 23!;'2° Nand 23!;'2° S. However, weather typical of this region sometimes extends as much as 450 from the Equator. One may think of the Tropics as uniformly rainy, warm, and humid. The facts are, however, that the Tropics contain both the wettest
and driest regions of the world. This chapter describes the circulation basic to the Tropics, terrain influences that determine arid and wet regions, and transitory systems that invade or disturb the basic tropical circulation.
157
CIRCULATION
In chapter 4, we learned that wind blowing out of the subtropical high pressure belts toward the Equator form the northeast and southeast trade winds of the two hemispheres. These trade winds converge in the vicinity of the Equator where air rises. This convergence zone is the "intertropical convergence zone" (ITCZ). In some areas of the world, seasonal temperature differences between land and water areas generate rather large circulation patterns that overpower the trade wind circulation; these areas ate "monsoon" regions. Tropical weather discussed here includes the subtropical high pressure belts, the trade wind belts, the intertropical convergence zone, and monsoon regions.
SUBTROPICAL HIGH PRESSURE BELTS If the surface under the subtropical high pres
sure belts were all water of uniform temperature, the high pressure belts would be continuous highs around the globe. The belts would be areas of descending or subsiding air and would be characterized by strong temperature inversions and very little precipitation. However, land surfaces at the latitudes of the high pressure belts are generally warmer throughout the year than are water surfaces. Thus, the high pressure belts are broken into semipermanent high pressure anticyclones over oceans with troughs or lows over continents as shown in figures 23 and 24, chapter 4. The subtropical highs shift southward during the Northern Hemisphere winter and northward during summer. The seasonal shift, the height and strength of the inversion, and terrain features determine weather in the subtropical high pressure belts.
Continental Weather Along the west coasts of continents under a sub
tropical high, the air is stable. The inversion is strongest and lowest where the east side of an anticyclone overlies the west side of a continent. Moisture is trapped under the inversion; fog and low stratus occur frequently. However, precipitation is rare since the moist layer is shallow and the air is stable. Heavily populated areas also add contaminants to the air which, when trapped under the inversion, create an air pollution problem.
The extreme southwestern United States, for example, is dominated in summer by a subtropical high. We are all familiar with the semi-arid summer climate of southern California. Rainfall is
158
infrequent but fog is common along the coast. Contaminants trapped along with fog under the strong inversion may persist for days creating "smog."
In winter, the subtropical high pressure belts shift southward. Again, let's consider southern California as an example. In winter, the area comes under the influence of midlatitude circulation which increases frequency of rain. Also, an occasional wintertime outbreak of polar air brings clear skies with excellent visibility.
The situation on eastern continental coasts is just the opposite. The inversion is weakest and highest where the west side of an anticyclone overlies the eastern coast of a continent. Convection can penetrate the inversion, and showers and thunderstorms often develop. Precipitation is generally sufficient to support considerable vegetation. For example, in the United States, Atlantic coastal areas at the same latitude as southern California are far from arid in summer.
Low ceiling and fog often prevent landing at a west coast destination, but a suitable alternate generally is available a few miles inland. Alternate selection may be more critical for an eastern coast destination because of widespread instability and associated hazards.
Weather over Open Sea Under a subtropical high over the open sea,
cloudiness is scant. The few clouds that do develop have tops from 3,000 to 6,000 feet depending on height of the inversion. Ceiling and visibility are generally quite ample for VFR flight.
Island Weather An island under a subtropical high receives very
little rainfall because of the persistent temperature inversion. Surface heating over some larger islands causes light convective showers. Cloud tops are only slightly higher than over open water. Temperatures are mild, showing small seasonal and diurnal changes. A good example is the pleasant, balmy climate of Bermuda.
TRADE WIND BELTS Figures 138 and 139 show prevailing winds
throughout the Tropics for July and January. Note that trade winds blowing out of the subtropical highs over ocean areas are predominantly northeasterly in the Northern Hemisphere and south-
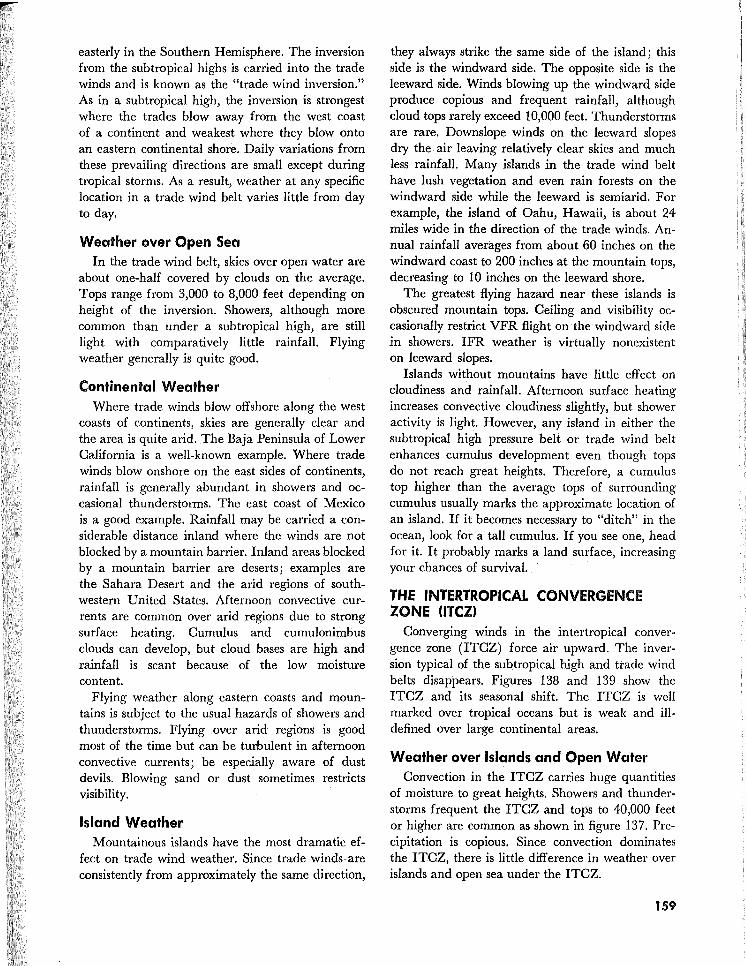
easterly in the Southern Hemisphere. The inversion from the subtropical highs is carried into the trade winds and is known as the "trade wind inversion." As in a subtropical high, the inversion is strongest where the trades blow away from the west coast of a continent and weakest where they blow onto an eastern continental shore. Daily variations from these prevailing directions are small except during tropical storms. As a result, weather at any specific location in a trade wind belt varies little from day to day.
Weather over Open Sea In the trade wind belt, skies over open water are
about one-half covered by clouds on the average. Tops range from 3,000 to 8,000 feet depending on height of the inversion. Showers, although more common than under a subtropical high, are still light with comparatively little rainfall. Flying weather generally is quite good.
Continental Weather Where trade winds blow offshore along the west
coasts of continents, skies are generally clear and the area is quite arid. The Baja Peninsula of Lower California is a well-known example. Where trade winds blow onshore on the east sides of continents, rainfall is generally abundant in showers and occasional thunderstonns. The east coast of Mexico is a good example. Rainfall may be carried a considerable distance inland where the winds are not blocked by a mountain barrier. Inland areas blocked by a mountain barrier are deserts; examples are the Sahara Desert and the arid regions of southwestern United States. Afternoon convective currents are common over arid regions due to strong surface heating. Cumulus and cumulonimbus clouds can develop, but cloud bases are high and rainfall is scant because of the low moisture content.
Flying weather along eastern coasts and mountains is subject to the usual hazards of showers and thunderstorms. Flying over arid regions is good most of the time but can be turbulent in afternoon convective currents; be especially aware of dust devils. Blowing sand or dust sometimes restricts visibility.
Island Weather Mountainous islands have the most dramatic ef
fect on trade wind weather. Since trade winds-are consistently from approximately the same direction,
they always strike the same side of the island; this side is the windward side. The opposite side is the leeward side. Winds blowing up the windward side produce copious and frequent rainfall, although cloud tops rarely exceed 10,000 feet. Thunderstonns are rare. Downslope winds on the leeward slopes dry the air leaving relatively clear skies and much less rainfall. Many islands in the trade wind belt have lush vegetation and even rain forests on the windward side while the leeward is semiarid. For example, the island of Oahu, Hawaii, is about 24 miles wide in the direction of the trade winds. Annual rainfall averages from about 60 inches on the windward coast to 200 inches at the mountain tops, decreasing to 10 inches on the leeward shore.
The greatest flying hazard near these islands is obscured mountain tops. Ceiling and visibility occasionally restrict VFR flight on the windward side in showers. IFR weather is virtually nonexistent on leeward slopes.
Islands without mountains have little effect on cloudiness and rainfall. Afternoon surface heating increases convective cloudiness slightly, but shower activity is light. However, any island in either the subtropical high pressure belt or trade wind belt enhances cumulus development even though tops do not reach great heights. Therefore, a cumulus top higher than the average tops of surrounding cumulus usually marks the approximate location of an island. If it becomes necessary to "ditch" in the ocean, look for a tall cumulus. If you see one, head for it. It probably marks a land surface, increasing your chances of survival.
THE INTERTROPICAL CONVERGENCE ZONE nTCZ)
Converging winds in the intertropical convergence zone (ITCZ) force air upward. The inversion typical of the subtropical high and trade wind belts disappears. Figures 138 and 139 show the ITCZ and its seasonal shift. The ITCZ is well marked over tropical oceans but is weak and illdefined over large continental areas.
Weather over Islands and Open Water Convection in the ITCZ carries huge quantities
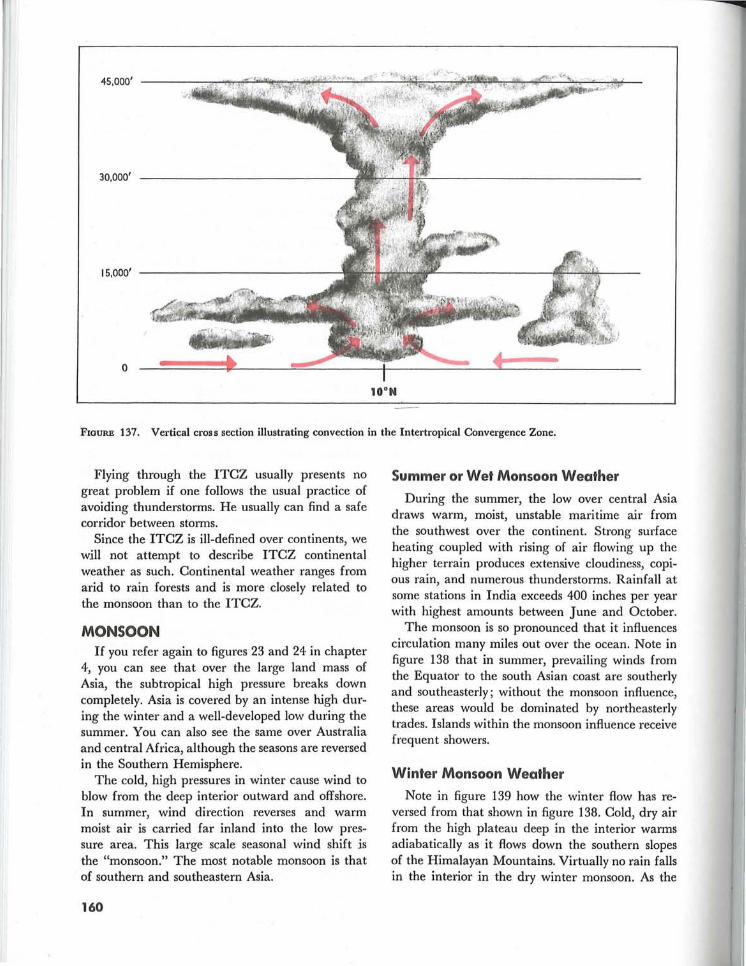
of moisture to great heights. Showers and thunderstorms frequent the ITCZ and tops to 40,000 feet or higher are common as shown in figure 137. Precipitation is copious. Since convection dominates the ITCZ, there is little difference in weather over islands and open sea under the ITCZ.
159
45,000'
30,000'
15,000'
a
lOON
FIGURE 137. Vertical cross section illustrating convection in the Intertropical Convergence Zone.
Flying through the ITCZ usually presents no great problem if one follows the usual practice of avoiding thunderstorms. He usually can find a safe corridor between storms.
Since the ITCZ is ill-defined over continents, we will not attempt to describe ITCZ continental weather as such. Continental weather ranges from arid to rain forests and is more closely related to the monsoon than to the ITCZ.
MONSOON If you refer again to figures 23 and 24 in chapter
4, you can see that over the large land mass of Asia, the subtropical high pressure breaks down completely. Asia is covered by an intense high during the winter and a well-developed low during the summer. You can also see the same over Australia and central Africa, although the seasons are reversed in the Southern Hemisphere.
The cold, high pressures in winter cause wind to blow from the deep interior outward and offshore. In summer, wind direction reverses and warm moist air is carried far inland into the low pressure area. This large scale seasonal wind shift is the "monsoon." The most notable monsoon is that of southern and southeastern Asia.
160
Summer or Wet Monsoon Weather
During the summer, the low over central Asia draws warm, moist, unstable maritime air from the southwest over the continent. Strong surface heating coupled with rising of air flowing up the higher terrain produces extensive cloudiness, copious rain, and numerous thunderstorms. Rainfall at some stations in India exceeds 400 inches per year with highest amounts between June and October.
The monsoon is so pronounced that it influences circulation many miles out over the ocean. Note in figure 138 that in summer, prevailing winds from the Equator to the south Asian coast are southerly and southeasterly; without the monsoon influence, these areas would be dominated by northeasterly trades. Islands within the monsoon influence receive frequent showers.
Winter Monsoon Weather
Note in figure 139 how the winter flow has reversed from that shown in figure 138. Cold, dry air from the high plateau deep in the interior warms adiabatically as it flows down the southern slopes of the Himalayan Mountains. Virtually no rain falls in the interior in the dry winter monsoon. As the
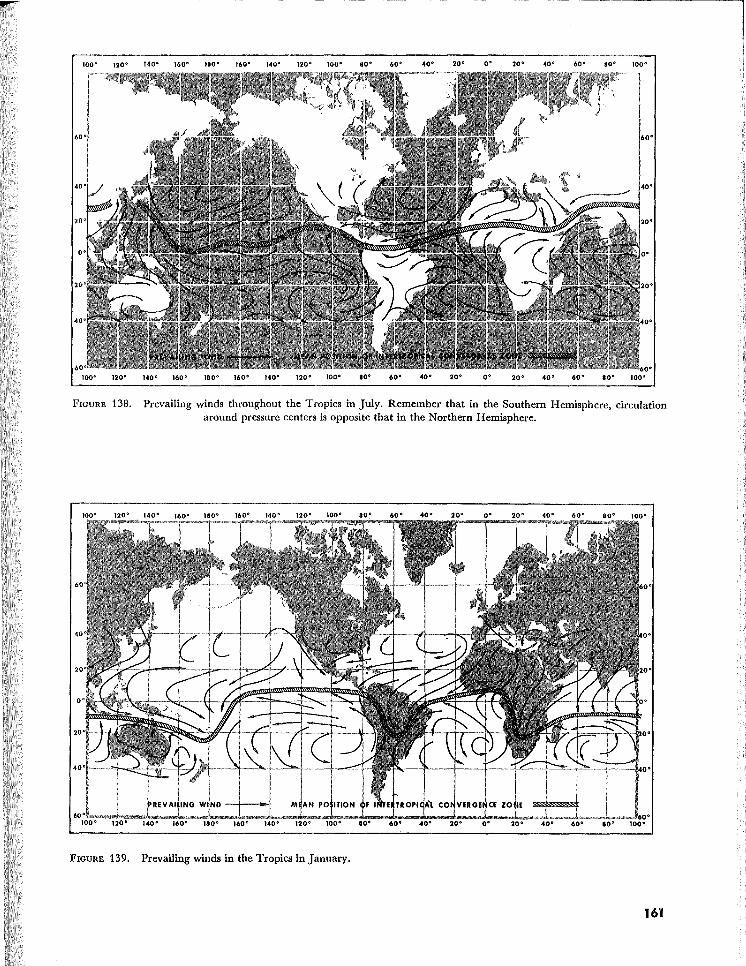
FIGURE 138. Prevailing winds throughout the Tropics in July. Remember that in the Southern Hemisphere, circulation around pressure centers is opposite that in the Northern Hemisphere.
FIGURE 139. Prevailing winds in the Tropics in January.
161
dry air moves off shore over warmer water, it rapidly takes in more moisture, becomes warmer in low levels and, therefore, unstable. Rain is frequent over off-shore islands and even along coastal areas after the air has had a significant over-water trajectory.
The Philippine Islands are in an area of special interest. During the summer, they are definitely in southerly monsoon flow and are subjected to abundant rainfall. In the winter, wind over the Philippines is northeasterly-in the transition zone between the northeasterly trades and the monsoon flow. It is academic whether we call the phenomenon the trade winds or monsoon; in either case, it produces abundant rainfall. The Philippines have a year-round humid, tropical climate.
Other Monsoon Areas Australia in July (Southern Hemisphere winter)
is an area of high pressure with predominantly offshore winds as shown in figure 138. Most of the continent is dry during the winter. In January, figure 139, winds are onshore into the continental low pressure. However, most of Australia is rimmed by mountains, coastal regions are wet where the onshore winds blow up the mountain slopes. The interior is arid where down-slope winds are warmed and dried.
Central Africa is known for its humid climate
and jungles. Note in figures 138 and 139 that prevailing wind is onshore much of the year over these regions. Some regions are wet the year round; others have the seasonal monsoon shift and have a summer wet season and a winter dry season. Climate of Africa is so varied that only a detailed area-by-area study can explain the climate typical of each area.
In the Amazon Valley of South America during the Southern Hemisphere winter (July), southeast trades, as shown in figure 138, penetrate deep into the valley bringing abundant rainfall which contributes to the jungle climate. In January, the ITCZ moves south of the valley as shown in figure 139. The northeast trades are caught up in the monsoon, cross the Equator, and also penetrate the Amazon Valley. The jungles of the Amazon result largely from monsoon winds.
Flying Weather in Monsoons During the winter monsoon, excellent flying
weather prevails over dry interior regions. Over water, one must pick his way around showers and thunderstorms. In the summer monsoon, VFR flight over land is often restricted by low ceilings and heavy rain. IFR flight must cope with the hazards of thunderstorms. Freezing level in the Tropics is quite high-14,000 feet or higher-so icing is restricted to high levels.
TRANSITORY SYSTEMS
So far, we have concentrated on prevailing circulations. Now, let's turn to migrating tropical weather producers--the shear line, trough aloft, tropical wave, and tropical cyclone.
SHEAR LINE A wind shear line found in the Tropics mainly
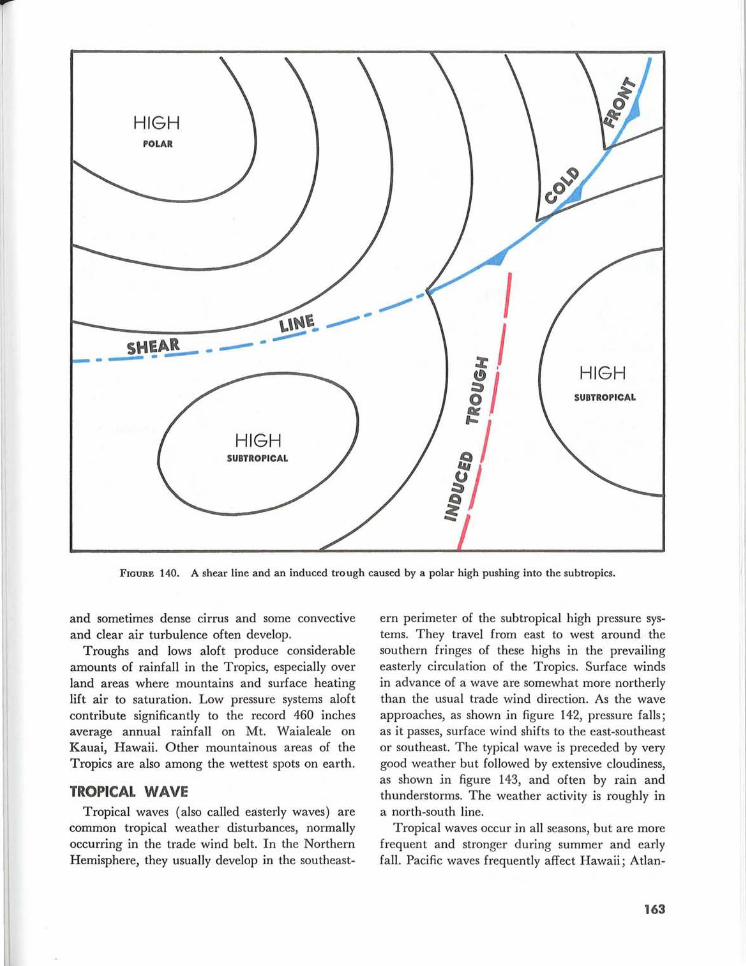
results from midlatitude influences. In chapter 8 we stated that an air mass becomes modified when it flows from its source region. By the time a cold air mass originating in high latitudes reaches the Tropics, temperature and moisture are virtually the same on both sides of the front. A shear line, or wind shift, is all that remains. A shear line also results when a semi-permanent high splits into two cells inducing a trough as shown in figure 140.
These shear lines are zones of convergence creating forced upward motion. Consequently, consider-
162
able thunderstorm and rain shower activity occurs along a shear line.
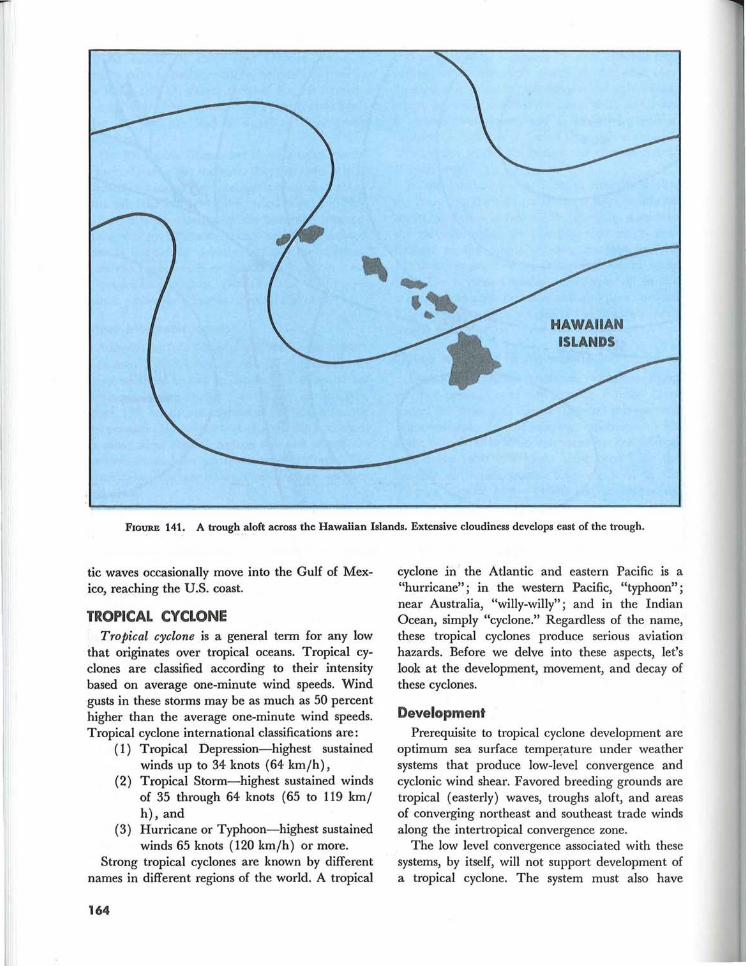
TROUGH ALOFT Troughs in the atmosphere, generally at or above
10,000 feet, move through the Tropics, especially along the poleward fringes. Figure 141 shows such a trough across the Hawaiian Island chain. As a trough moves to the southeast or east, it spreads middle and high cloudiness over extensive areas to the east of the trough line. Occasionally, a welldeveloped trough will extend deep into the Tropics, and a closed low forms at the equatorial end of the trough. The low then may separate from the trough and move westward producing a large amount of cloudiness and precipitation. If this occurs in the vicinity of a strong subtropical jet stream, extensive
HIGH POLAR
SH£A.!.- - --- ----HIGH
SUBTROPICAL
HIGH SUBTROPICAL
FIGURE 140. A shear line and an induced trough caused by a polar high pushing into the sUbtropics.
and sometimes dense cirrus and some convective and clear air turbulence often develop.
Troughs and lows aloft produce considerable amounts of rainfall in the Tropics, especially over land areas where mountains and surface heating lift air to saturation. Low pressure systems aloft contribute significantly to the record 460 inches average annual rainfall on Mt. Waialeale on Kauai, Hawaii. Other mountainous areas of the Tropics are also among the wettest spots on earth.
TROPICAL WAVE Tropical waves (also called easterly waves) are
common tropical weather disturbances, normally occurring in the trade wind belt. In the Northern Hemisphere, they usually develop in the southeast-
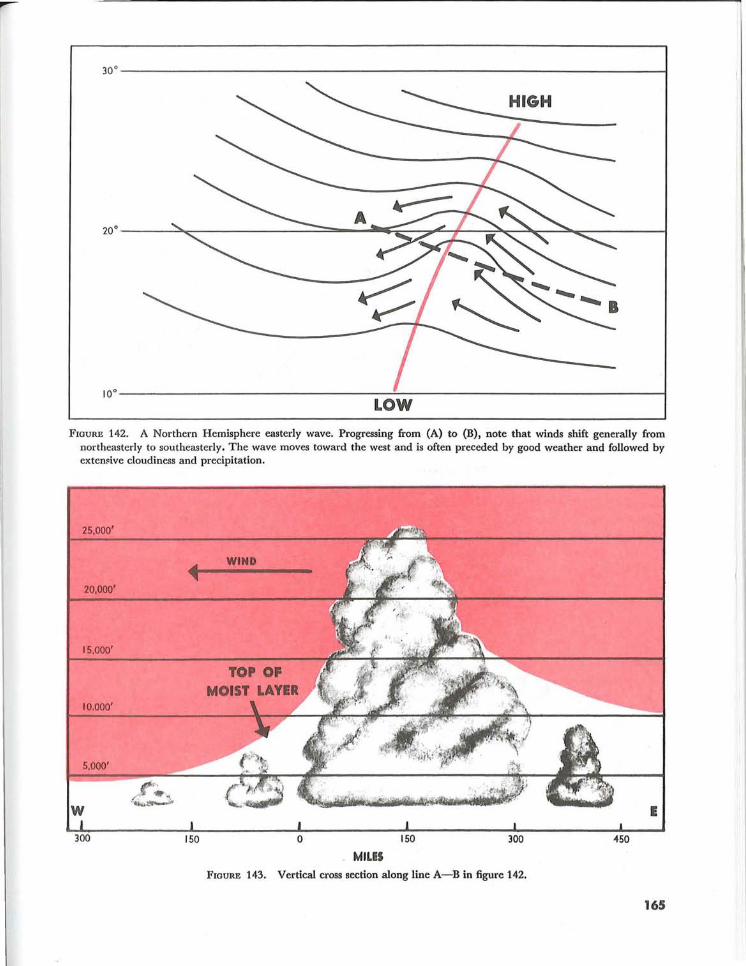
ern perimeter of the subtropical high pressure systems. They travel from east to west around the southern fringes of these highs in the prevailing easterly circulation of the Tropics. Surface winds in advance of a wave are somewhat more northerly than the usual trade wind direction. As the wave approaches, as shown in figure 142, pressure falls; as it passes, surface wind shifts to the east-southeast or southeast. The typical wave is preceded by very good weather but followed by extensive cloudiness, as shown in figure 143, and often by rain and thunderstorms. The weather activity is roughly in a north-south line.
Tropical waves occur in all seasons, but are more frequent and stronger during summer and early fall. Pacific waves frequently affect Hawaii; Atlan-
163
HAWAIIAN ISLANDS
FIGURE 141. A trough aloft across the Hawaiian Islands. Extensive cloudiness develops east of the trough.
tic waves occasionally move into the Gulf of Mexico, reaching the U.S. coast.
TROPICAL CYCLONE Tropical cyclone is a general term for any low
that originates over tropical oceans. Tropical cyclones are classified according to their intensity based on average one-minute wind speeds. Wind gusts in these storms may be as much as 50 percent higher than the average one-minute wind speeds. Tropical cyclone international classifications are:
( 1) Tropical Depression-highest sustained winds up to 34 knots (64 km/h),
(2) Tropical Storm-highest sustained winds of 35 through 64 knots (65 to 119 km/ h), and
(3) Hurricane or Typhoon-highest sustained winds 65 knots (120 km/h) or more.
Strong tropical cyclones are known by different names in different regions of the world. A tropical
164
cyclone in the Atlantic and eastern Pacific is a "hurricane"; in the western Pacific, "typhoon"; near Australia, "willy-willy"; and in the Indian Ocean, simply "cyclone." Regardless of the name, these tropical cyclones produce serious aviation hazards. Before we delve into these aspects, let's look at the development, movement, and decay of these cyclones.
Development Prerequisite to tropical cyclone development are
optimum sea surface tempe~ature under weather systems that produce low-level convergence and cyclonic wind shear. Favored breeding grounds are tropical (easterly) waves, troughs aloft, and areas of converging northeast and southeast trade winds along the intertropical convergence zone.
The low level convergence associated with these systems, by itself, will not support development of a tropical cyclone. The system must also have
30 0 ________________________________________________________________________________ ~
100 ________________________________________ ~ ______________________________________ _;
LOW
FIGURE 142. A Northern Hemisphere easterly wave. Progressing from (A) to (B), note that winds shift generally from northeasterly to southeasterly. The wave moves toward the west and is often preceded by good weather and followed by extemive cloudiness and precipitation.
25,000'
20,000'
15,000'
10.000'
5.000'
150 o 150 300 450
_ MILES FIGURE 143. Vertical cross section along line A-B in figure 142.
165
horizontal outflow-divergence-at high tropospheric levels. This combination creates a "chimney," in which air is forced upward causing clouds and precipitation. Condensation releases large quantities of latent heat which raises the temperature of the system and accelerates th~ upward motion. The rise in temperature lowers the surface pressure which increases low-level convergence . . This draws more moisture-laden air into the system. When these chain-reaction events continue, a huge vortex is generated which may culminate in hurricane force winds.
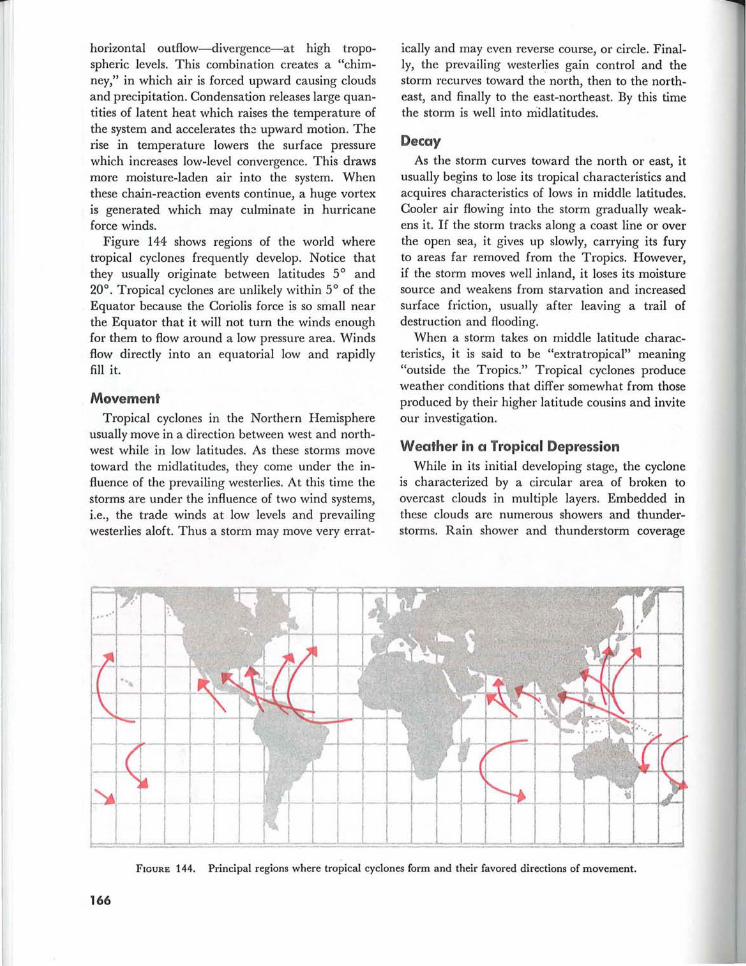
Figure 144 shows regions of the world where tropical cyclones frequently develop. Notice that they usually originate between latitudes 50 and 200. Tropical cyclones are unlikely within 50 of the Equator because the Coriolis force is so small near the Equator that it will not turn the winds enough for them to flow around a low pressure area. Winds flow directly into an equatorial low and rapidly fill it.
Movement Tropical cyclones in the Northern Hemisphere
usually move in a direction between west and northwest while in low latitudes. As these storms move toward the midlatitudes, they come under the influence of the prevailing westerlies. At this time the storms are under the influence of two wind systems, i.e., the trade winds at low levels and prevailing westerlies aloft. Thus a storm may move very en'at-
ically and may even reverse course, or circle. Finally, the prevailing westerlies gain control and the storm recurves toward the north, then to the northeast, and finally to the east-northeast. By this time the storm is well into rriidlatitudes.
Decay As the storm curves toward the north or east, it
usually begins to lose its tropical characteristics and acquires characteristics of lows in middle latitudes. Cooler air flowing into the storm gradually weakens it. If the storm tracks along a coast line or over the open sea, it gives up slowly, carrying its fury to areas far removed from the Tropics. However, if the storm moves well inland, it loses its moisture source and weakens from starvation and increased surface friction, usually after leaving a trail of destruction and flooding.
When a storm takes on middle latitude characteristics, it is said to be "extratropical" meaning "outside the Tropics." Tropical cyclones produce weather conditions that differ somewhat from those produced by their higher latitude cousins and invite our investigation.
Weather in a Tropical Depression While in its initial developing stage, the cyclone
is characterized by a circular area of broken to overcast clouds in multiple layers. Embedded in these clouds are numerous showers and thunderstorms. Rain shower and thunderstorm coverage
FIGURE 144. Principal regions where tropical cyclones form and their favored directions of movement.
166
varies from scattered to almost solid. Diameter of the cloud pattern varies from less than 100 miles in small systems to well over 200 miles in large ones.
Weather in Tropical Storms and Hurricanes As cyclonic flow increases, the thunderstorms and
rain showers form into broken or solid lines paralleling the wind flow that is spiraling into the center of the storm. These lines are the spiral rain bands frequently seen on radar. These rain bands continually change as they rotate around the storm. Rainfall in the rain bands is very heavy, reducing ceiling and visibility to near zero. Winds are usually very strong and gusty and, consequently, generate violent turbulence. Between the rain bands, ceilings and visibilities are somewhat better, and turbulence generally is less intense.
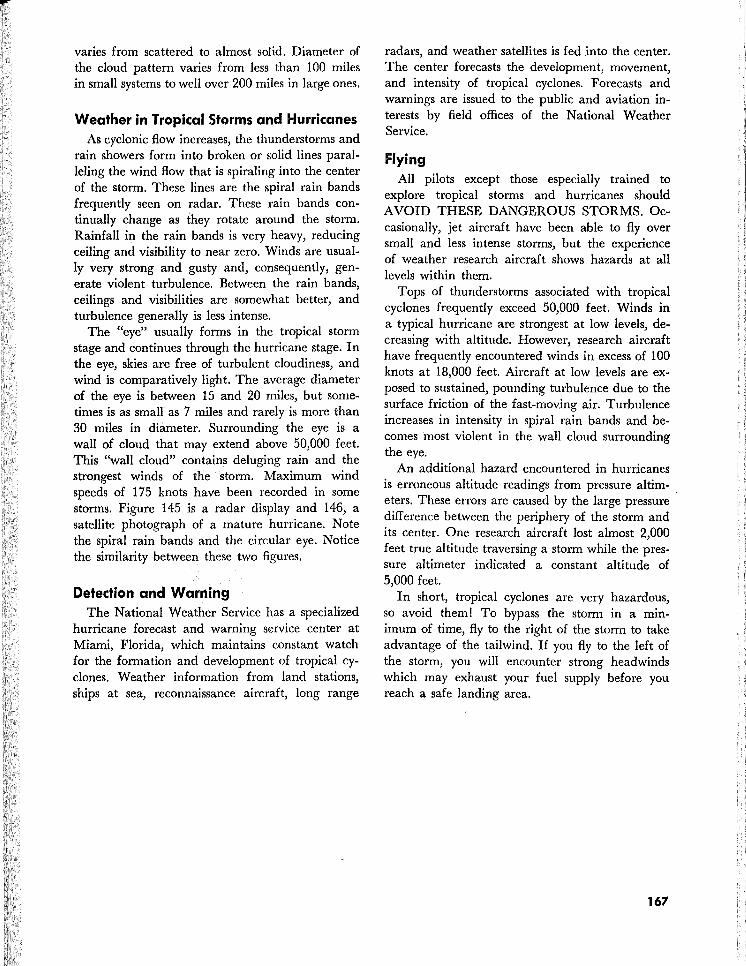
The "eye" usually forms in the tropical storm stage and continues through the hurricane stage. In the eye, skies are free of turbulent cloudiness, and wind is comparatively light. The average diameter of the eye is between 15 and 20 miles, but sometimes is as small as 7 miles and rarely is more than 30 miles in diameter. Surrounding the eye is a wall of cloud that may extend above 50,000 feet. This "wall cloud" contains deluging rain and the strongest winds of the storm. Maximum wind speeds of 175 knots have been recorded in some storms. Figure 145 is a radar display and 146, a satellite photograph of a mature hurricane. Note the spiral rain bands and the circular eye. Notice the similarity between these two figures.
Detection and Warning The National Weather Service has a specialized
hurricane forecast and warning service center at Miami, Florida, which maintains constant watch for the formation and development of tropical cyclones. Weather information from land stations, ships at sea, reconnaissance aircraft, long range
radars, and weather satellites is fed into the center. The center forecasts the development, movement, and intensity of tropical cyclones. Forecasts and warnings are issued to the public and aviation interests by field offices of the National Weather Service.
Flying All pilots except those especially trained to
explore tropical storms and hurricanes should AVOID THESE DANGEROUS STORMS. Occasionally, jet aircraft have been able to fly over small and less intense storms, but the experience of weather research aircraft shows hazards at all levels within them.
Tops of thunderstorms associated with tropical cyclones frequently exceed 50,000 feet. Winds in a typical hurricane are strongest at low levels, decreasing with altitude. However, research aircraft have frequently encountered winds in excess of 100 knots at 18,000 feet. Aircraft at low levels are exposed to sustained, pounding turbulence due to the surface friction of the fast-moving air. Turbulence increases in intensity in spiral rain bands and becomes most violent in the wall cloud surrounding the eye.
An additional hazard encountered in hurricanes is erroneous altitude readings from pressure altimeters. These errors are caused by the large pressure difference between the periphery of the storm and its center. One research aircraft lost almost 2,000 feet true altitude traversing a storm while the pressure altimeter indicated a constant altitude of 5,000 feet.
In short, tropical cyclones are very hazardous, so avoid them! To bypass the storm in a minimum of time, fly to the right of the storm to take advantage of the tailwind. If you fly to the left of the storm, you will encounter strong headwinds which may exhaust your fuel supply before you reach a safe landing area.
167
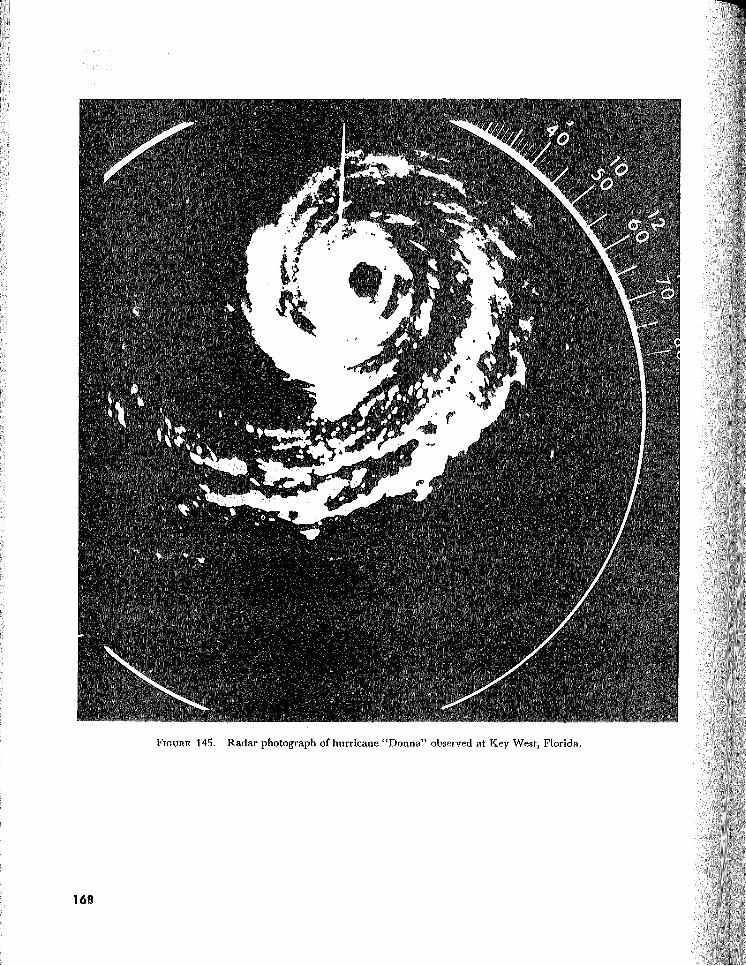
FIGURE 145. Radar photograph of hurricane "Donna" observed at Key West, Florida.
168
FIGURE 146. A hurricane observed by satellite.
169