Embed Size (px)
Citation preview
Cisco ONS 15454 DWDMJuly 2006
C H A P T E R 1
OverviewThis chapter provides an overview of dense wavelength division multiplexing (DWDM) systems.
The following topics are covered in this chapter:
• 1.1 Time Division Multiplexing Versus Wave Division Multiplexing, page 1-1
• 1.2 Wavelength Division Multiplexing Versus Dense Wavelength Division Multiplexing, page 1-2
• 1.3 Value of DWDM in the Metropolitan Area Network, page 1-3
• 1.4 DWDM System Functions, page 1-3
• 1.5 DWDM Components and Operation, page 1-4
• 1.6 DWDM Interfaces, page 1-19
• 1.7 Supported ITU-T Wavelengths in the C-Band and L-Band, page 1-22
1.1 Time Division Multiplexing Versus Wave Division Multiplexing
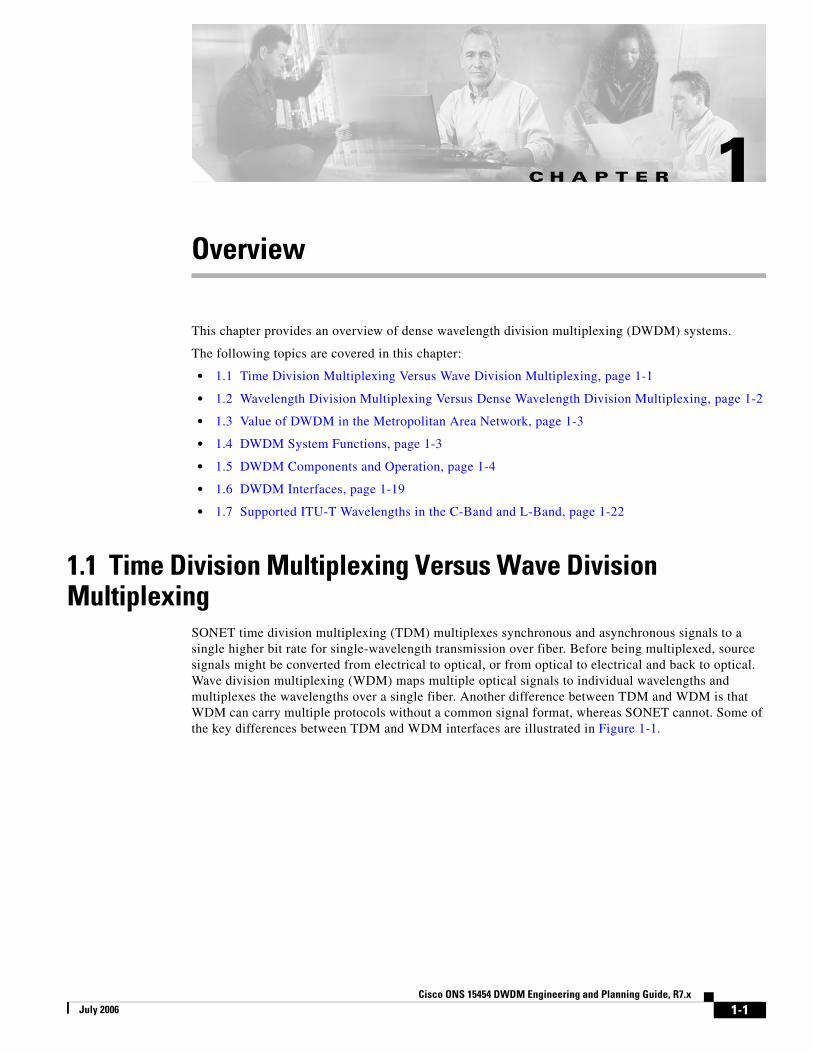
SONET time division multiplexing (TDM) multiplexes synchronous and asynchronous signals to a single higher bit rate for single-wavelength transmission over fiber. Before being multiplexed, source signals might be converted from electrical to optical, or from optical to electrical and back to optical. Wave division multiplexing (WDM) maps multiple optical signals to individual wavelengths and multiplexes the wavelengths over a single fiber. Another difference between TDM and WDM is that WDM can carry multiple protocols without a common signal format, whereas SONET cannot. Some of the key differences between TDM and WDM interfaces are illustrated in Figure 1-1.
1-1 Engineering and Planning Guide, R7.x
Chapter 1 Overview1.2 Wavelength Division Multiplexing Versus Dense Wavelength Division Multiplexing
Figure 1-1 TDM and WDM Interfaces
Bandwidth, the chief driver in the long-haul market, is also a big driver in metropolitan area, access, and large enterprise networks. In these types of networks, additional applications drive the demand for bandwidth, including storage area networks (SANs), which make possible the serverless office, consolidation of data centers, and real-time transaction processing backup.
1.2 Wavelength Division Multiplexing Versus Dense Wavelength Division Multiplexing
In a WDM system, each of the wavelengths is launched into the fiber, and the signals are demultiplexed at the receiving end. Like TDM, the resulting capacity is an aggregate of the input signals, but WDM carries each input signal independently of the others. This means that each channel has its own dedicated bandwidth and all signals arrive at the same time, rather than being broken up and carried in time slots.
The difference between WDM and dense wavelength division multiplexing (DWDM) is one of degree only. DWDM spaces the wavelengths more closely than WDM, and therefore DWDM has a greater overall capacity. The full capacity is not precisely known, and probably has not been reached.
DWDM can amplify all the wavelengths at once without first converting them to electrical signals and can carry signals of different speeds and types simultaneously and transparently over fiber, meaning DWDM provides protocol and bit rate independence.
From both technical and economic perspectives, potentially unlimited transmission capacity is the most obvious advantage of DWDM technology. Not only can the current investment in fiber plant be preserved, but it can also be optimized by a factor of at least 32. As demands change, more capacity can be added, either by simple equipment upgrades or by increasing the number of lambdas on the fiber, without expensive upgrades. Capacity can be obtained for the cost of the equipment, and the existing fiber plant investment is retained.
Single fiber(one wavelength)
Channel 1
Channel n
Mix of
DS1DS3
OC-1OC-3
OC-12OC-48
Single fiber(multiple wavelengths)
Mix of
OC-12OC-48
OC-192SONET
ATMGE
4807
3
TDM
WDM
1-2Cisco ONS 15454 DWDM Engineering and Planning Guide, R7.x
July 2006
Chapter 1 Overview1.3 Value of DWDM in the Metropolitan Area Network
In addition to bandwidth, DWDM has several key advantages:
• Transparency—Because DWDM is a physical layer architecture, it can transparently support both TDM and data formats such as asynchronous transfer mode (ATM), Gigabit Ethernet, Enterprise System Connection (ESCON), and Fibre Channel with open interfaces over a common physical layer.
• Scalability—DWDM can leverage the abundance of dark fiber in many metropolitan area and enterprise networks to quickly meet demand for capacity on point-to-point links and on spans of existing SONET/SDH rings.
• Dynamic provisioning—Fast, simple, and dynamic provisioning of network connections give providers the ability to provide high-bandwidth services in days rather than months.
1.3 Value of DWDM in the Metropolitan Area Network DWDM has been very successful in the network backbone. It was first deployed on long-haul routes in a time of fiber scarcity. Then the equipment savings made it the solution of choice for new long-haul routes, even when ample fiber was available. While DWDM can relieve fiber exhaustion in the metropolitan are network (MAN), its value in this market extends beyond the fiber advantage. DWDM provides fast and flexible provisioning of protocol transparent and bit-rate transparent, data-centric, protected services, along with new and higher-speed services at less cost.
The need to provision services of varying types in a rapid and efficient manner is a distinguishing characteristic of the metropolitan area networks. With SONET, which is the foundation of the vast majority of existing MANs, service provisioning is a lengthy and complex process. Network planning and analysis, add/drop multiplexer (ADM) provisioning, digital cross-connect system (DCS) reconfiguration, path and circuit verification, and service creation can take several weeks. With DWDM equipment installed, provisioning a new service can be as simple as turning on another lightwave in an existing fiber pair.
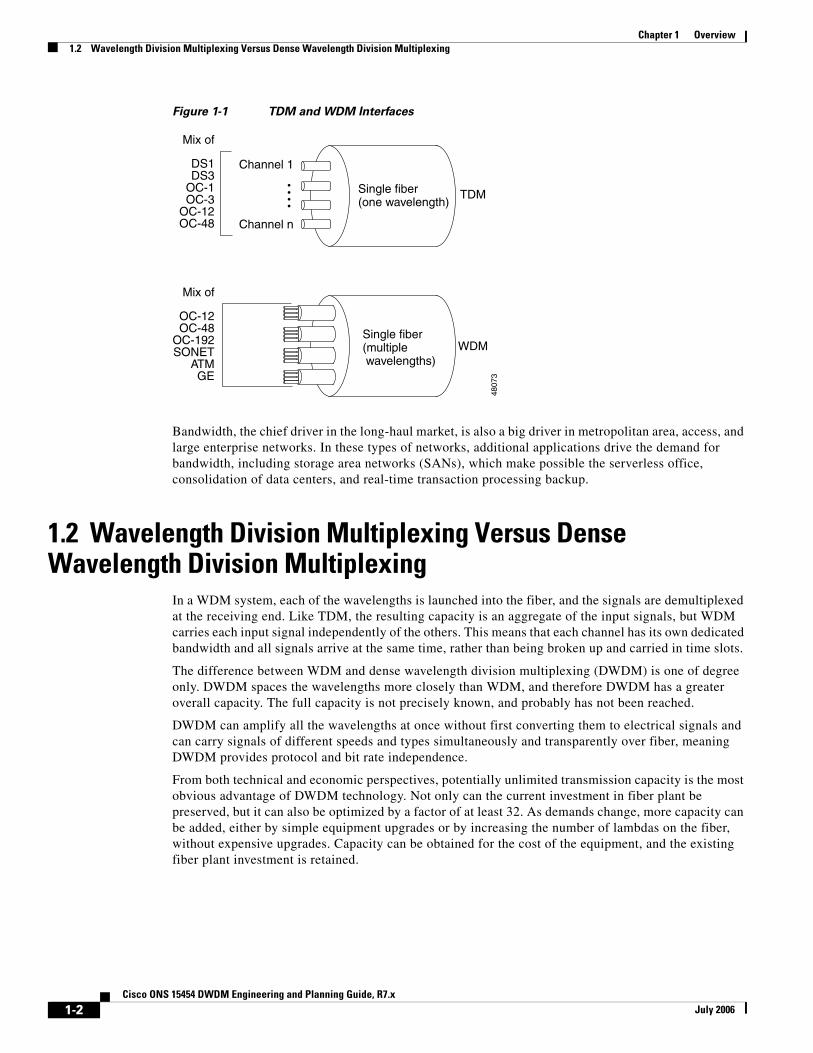
1.4 DWDM System FunctionsAt its core, DWDM involves a small number of physical-layer functions. These are depicted in Figure 1-2, which shows a DWDM schematic for four channels. Each optical channel occupies its own wavelength.
Figure 1-2 DWDM Functional Schematic
Transmitters Receivers
Combiningsignals
Separatingsignals
Transmission on fiber
4808
1
1-3Cisco ONS 15454 DWDM Engineering and Planning Guide, R7.x
July 2006
Chapter 1 Overview1.5 DWDM Components and Operation
A DWDM system performs the following primary functions:
• Generating the signal—The source, a solid-state laser, must provide stable light within a specific, narrow bandwidth that carries digital data modulated as an analog signal.
• Combining the signals—Modern DWDM systems employ multiplexers to combine the signals. There is some inherent loss associated with multiplexing and demultiplexing. This loss is dependent on the number of channels but can be mitigated with optical amplifiers, which boost all the wavelengths at once without electrical conversion.
• Transmitting the signals—The effects of crosstalk and optical signal degradation or loss must be considered in fiber-optic transmission. Controlling variables such as channel spacing, wavelength tolerance, and laser power levels can minimize these effects. The signal might need to be optically amplified over a transmission link.
• Separating the received signals—At the receiving end, the multiplexed signals must be separated out.
• Receiving the signals—The demultiplexed signal is received by a photodetector.
In addition to these functions, a DWDM system must also be equipped with client-side interfaces to receive the input signal. The client-side interface function can be performed by transponders. Interfaces on the DWDM side connect the optical fiber to DWDM systems.
1.5 DWDM Components and OperationDWDM is a core technology in an optical transport network. The essential components of DWDM can be classified by their place in the network:
• On the transmit side, lasers with precise, stable wavelengths
• On the link, optical fiber that exhibits low loss and transmission performance in the relevant wavelength spectra, in addition to flat-gain optical amplifiers to boost the signal on longer spans
• On the receive side, photodetectors and optical demultiplexers using thin film filters or diffracting elements
• Optical add/drop multiplexers and optical cross-connect components
These components and others, along with their underlying technologies, are discussed in the following sections.
1.5.1 Optical FibersThe main job of optical fibers is to guide lightwaves with a minimum of attenuation (loss of signal). Optical fibers are composed of fine threads of glass in layers, called the core and cladding, that can transmit light at about two-thirds the speed of light in a vacuum. Transmission of light in optical fiber is commonly explained using the principle of total internal reflection. With this phenomenon, 100 percent of the light that strikes a surface is reflected. By contrast, a mirror reflects about 90 percent of the light that strikes it.
Light is either reflected (it bounces back) or refracted (its angle is altered while passing through a different medium) depending on the angle of incidence, which is the angle at which light strikes the interface between more optically dense material and optically thinner material.
Total internal reflection happens when the following conditions are met:
1-4Cisco ONS 15454 DWDM Engineering and Planning Guide, R7.x
July 2006
Chapter 1 Overview1.5.1 Optical Fibers
• Beams pass from a more dense to a less dense material. The difference between the optical density of a given material and a vacuum is the material's refractive index.
• The incident angle is less than the critical angle. The critical angle is the maximum angle of incidence at which light stops being refracted and is instead totally reflected.
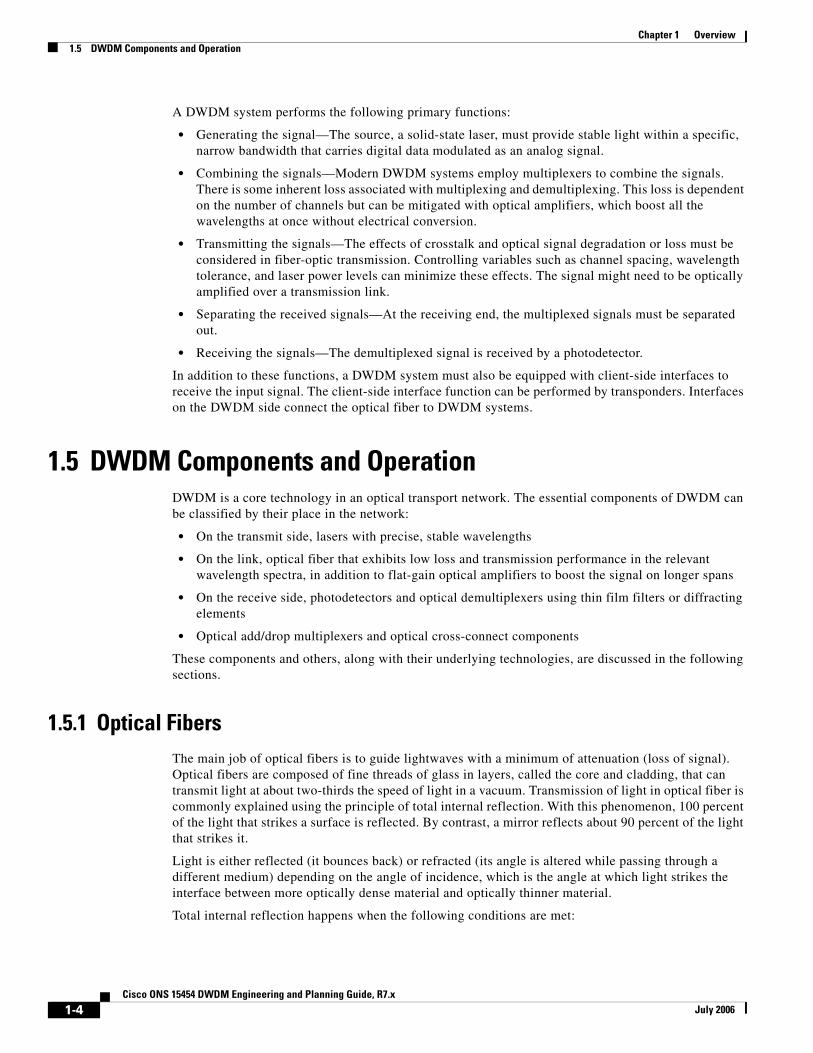
The principle of total internal reflection within a fiber core is illustrated in Figure 1-3. The core has a higher refractive index than the cladding, allowing the beam that strikes the surface at less than the critical angle to be reflected. The second beam does not meet the critical angle requirement and is refracted.
Figure 1-3 Principle of Total Internal Reflection
The core and the cladding are mixed with specific elements, called dopants, to adjust their refractive indices. The difference between the refractive indices of the two materials causes most of the transmitted light to bounce off the cladding and stay within the core. The critical angle requirement is met by controlling the angle at which the light is injected into the fiber. Two or more layers of protective coating around the cladding ensure that the glass can be handled without damage.
1.5.1.1 Multimode Fiber
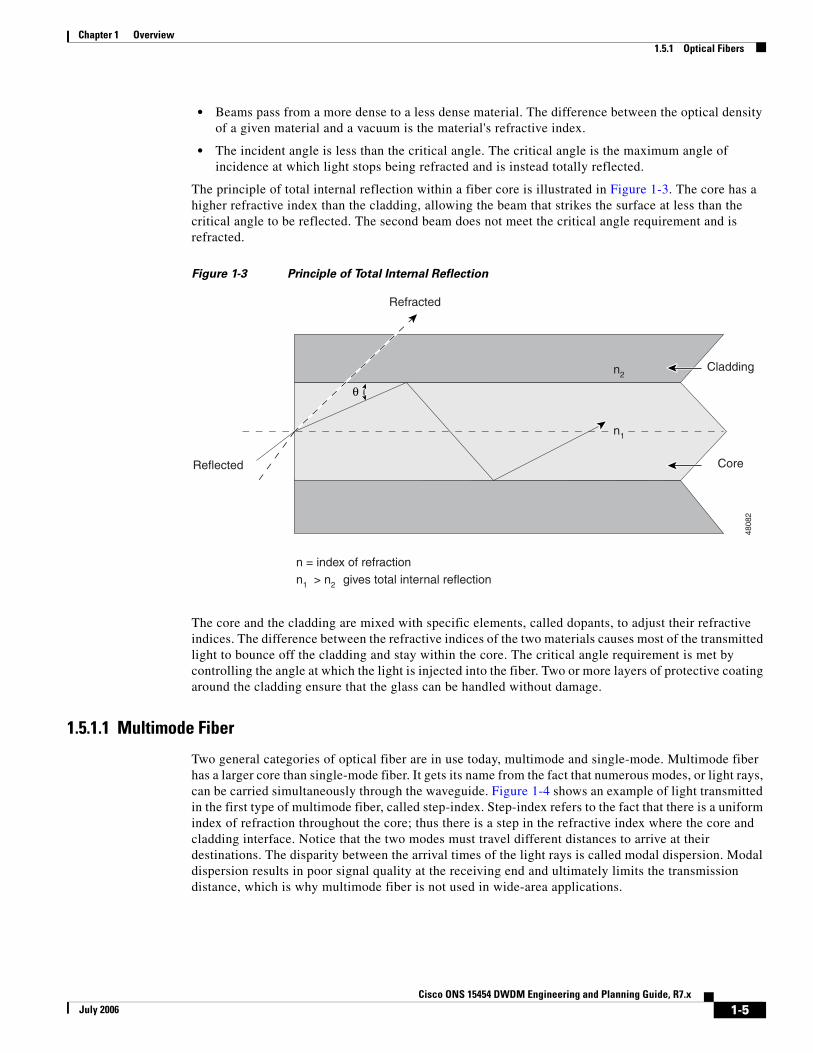
Two general categories of optical fiber are in use today, multimode and single-mode. Multimode fiber has a larger core than single-mode fiber. It gets its name from the fact that numerous modes, or light rays, can be carried simultaneously through the waveguide. Figure 1-4 shows an example of light transmitted in the first type of multimode fiber, called step-index. Step-index refers to the fact that there is a uniform index of refraction throughout the core; thus there is a step in the refractive index where the core and cladding interface. Notice that the two modes must travel different distances to arrive at their destinations. The disparity between the arrival times of the light rays is called modal dispersion. Modal dispersion results in poor signal quality at the receiving end and ultimately limits the transmission distance, which is why multimode fiber is not used in wide-area applications.
4808
2
Reflected
Refracted
Cladding
Core
n2
n1
n = index of refractionn1 > n2 gives total internal reflection
θ
1-5Cisco ONS 15454 DWDM Engineering and Planning Guide, R7.x
July 2006
Chapter 1 Overview1.5.1 Optical Fibers
Figure 1-4 Reflected Light in Step-Index Multimode Fiber
To compensate for the dispersion drawback of step-index multimode fiber, graded-index fiber was invented. Graded-index refers to the fact that the refractive index of the core is graded; it gradually decreases from the center of the core outward. The higher refraction at the center of the core slows the speed of some light rays, allowing all the rays to reach their destination at about the same time and reducing modal dispersion.
1.5.1.2 Single-Mode Fiber
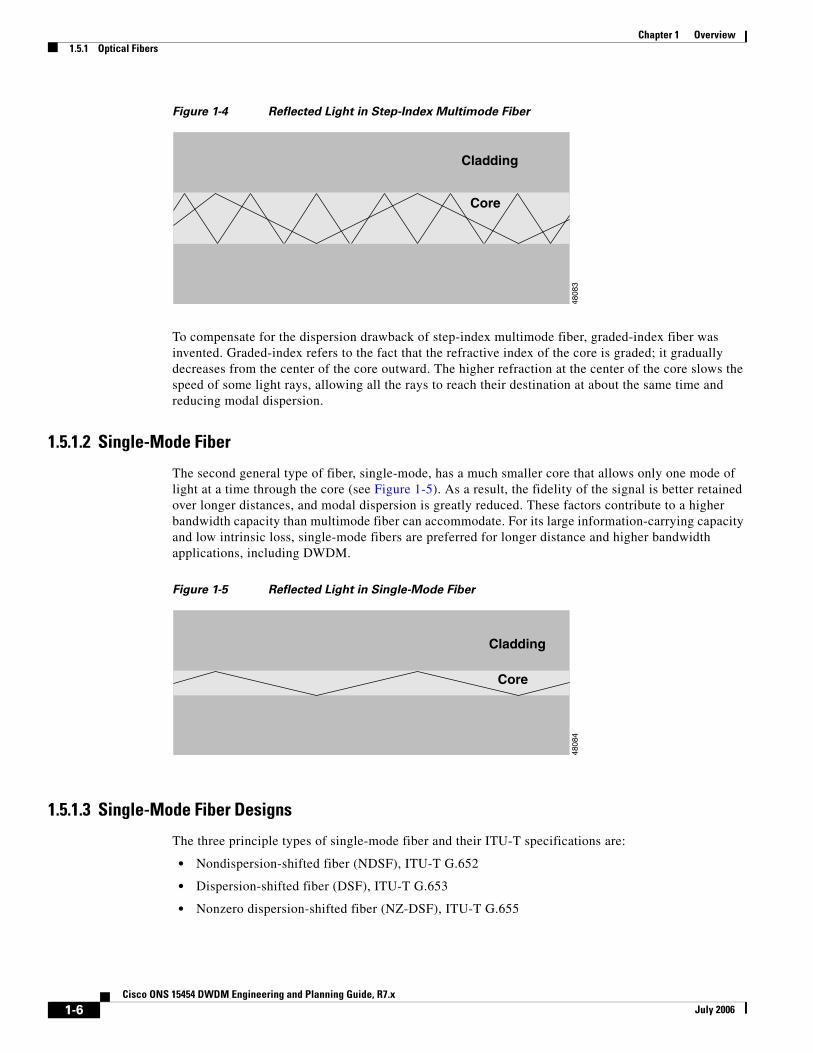
The second general type of fiber, single-mode, has a much smaller core that allows only one mode of light at a time through the core (see Figure 1-5). As a result, the fidelity of the signal is better retained over longer distances, and modal dispersion is greatly reduced. These factors contribute to a higher bandwidth capacity than multimode fiber can accommodate. For its large information-carrying capacity and low intrinsic loss, single-mode fibers are preferred for longer distance and higher bandwidth applications, including DWDM.
Figure 1-5 Reflected Light in Single-Mode Fiber
1.5.1.3 Single-Mode Fiber Designs
The three principle types of single-mode fiber and their ITU-T specifications are:
• Nondispersion-shifted fiber (NDSF), ITU-T G.652
• Dispersion-shifted fiber (DSF), ITU-T G.653
• Nonzero dispersion-shifted fiber (NZ-DSF), ITU-T G.655
Cladding
Core
4808
3
Cladding
Core
4808
4
1-6Cisco ONS 15454 DWDM Engineering and Planning Guide, R7.x
July 2006
Chapter 1 Overview1.5.2 Transmission Challenges
There are four windows within the infrared spectrum that have been exploited for fiber transmission. The first window, near 850 nm, was used almost exclusively for short-range, multimode applications. Nondispersion-shifted fibers, commonly called standard single-mode (SM) fibers, were designed for use in the second window, near 1310 nm. To optimize the fiber's performance in this window, the fiber was designed so that chromatic dispersion would be close to zero near the 1310-nm wavelength.
As optical fiber use became more common and the needs for greater bandwidth and distance increased, a third window, near 1550 nm, was exploited for single-mode transmission. Manufacturers developed dispersion-shifted fiber for the third window, or C-band. The fourth window is L-band, near 1600 nm; it was added to increase the band for C-band applications.
The third type of fiber, nonzero dispersion-shifted fiber, is designed specifically to meet the needs of DWDM applications. The aim of this design is to make the dispersion low in the 1550-nm region, but not zero. This strategy effectively introduces a controlled amount of dispersion, which counters nonlinear effects such as four-wave mixing that can hinder the performance of DWDM systems.
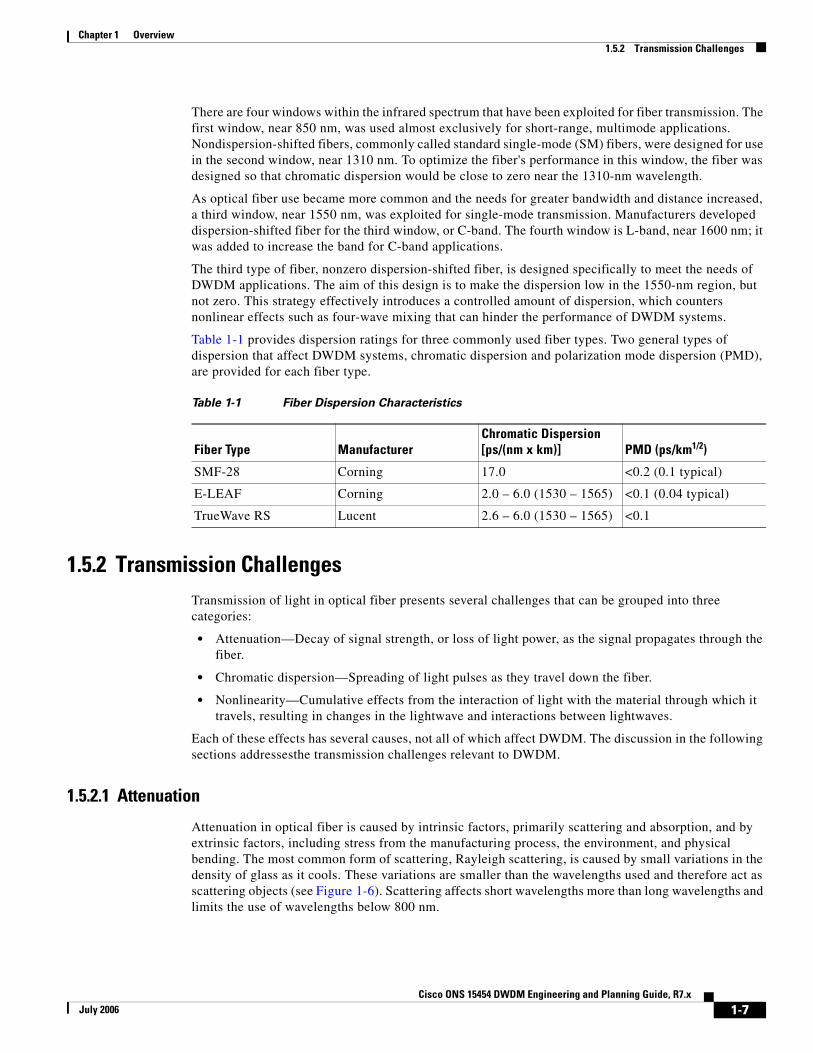
Table 1-1 provides dispersion ratings for three commonly used fiber types. Two general types of dispersion that affect DWDM systems, chromatic dispersion and polarization mode dispersion (PMD), are provided for each fiber type.
1.5.2 Transmission ChallengesTransmission of light in optical fiber presents several challenges that can be grouped into three categories:
• Attenuation—Decay of signal strength, or loss of light power, as the signal propagates through the fiber.
• Chromatic dispersion—Spreading of light pulses as they travel down the fiber.
• Nonlinearity—Cumulative effects from the interaction of light with the material through which it travels, resulting in changes in the lightwave and interactions between lightwaves.
Each of these effects has several causes, not all of which affect DWDM. The discussion in the following sections addressesthe transmission challenges relevant to DWDM.
1.5.2.1 Attenuation
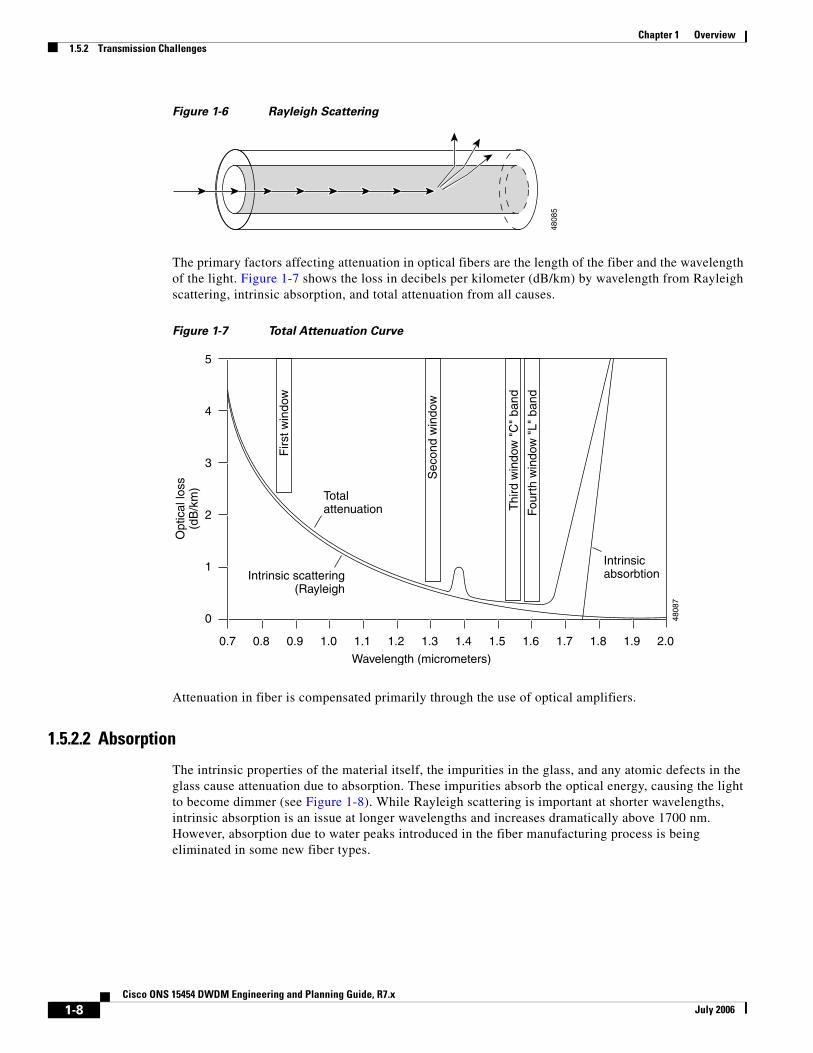
Attenuation in optical fiber is caused by intrinsic factors, primarily scattering and absorption, and by extrinsic factors, including stress from the manufacturing process, the environment, and physical bending. The most common form of scattering, Rayleigh scattering, is caused by small variations in the density of glass as it cools. These variations are smaller than the wavelengths used and therefore act as scattering objects (see Figure 1-6). Scattering affects short wavelengths more than long wavelengths and limits the use of wavelengths below 800 nm.
Table 1-1 Fiber Dispersion Characteristics
Fiber Type ManufacturerChromatic Dispersion [ps/(nm x km)] PMD (ps/km1/2)
SMF-28 Corning 17.0 <0.2 (0.1 typical)
E-LEAF Corning 2.0 – 6.0 (1530 – 1565) <0.1 (0.04 typical)
TrueWave RS Lucent 2.6 – 6.0 (1530 – 1565) <0.1
1-7Cisco ONS 15454 DWDM Engineering and Planning Guide, R7.x
July 2006
Chapter 1 Overview1.5.2 Transmission Challenges
Figure 1-6 Rayleigh Scattering
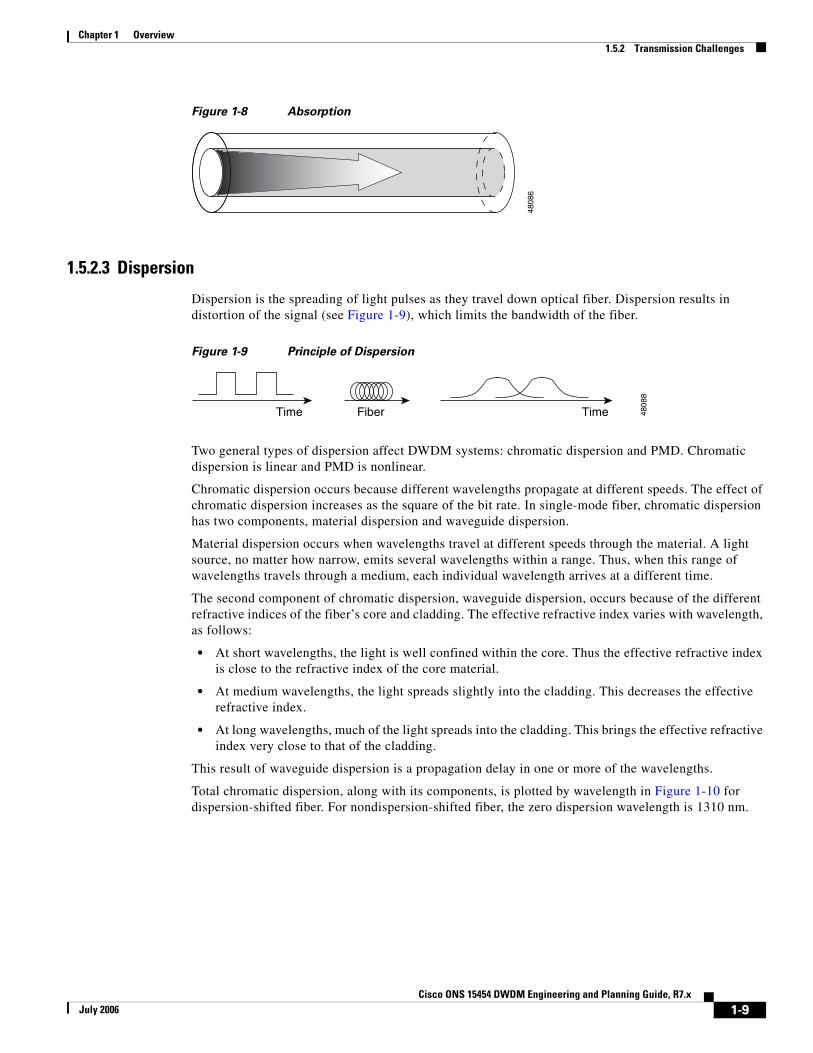
The primary factors affecting attenuation in optical fibers are the length of the fiber and the wavelength of the light. Figure 1-7 shows the loss in decibels per kilometer (dB/km) by wavelength from Rayleigh scattering, intrinsic absorption, and total attenuation from all causes.
Figure 1-7 Total Attenuation Curve
Attenuation in fiber is compensated primarily through the use of optical amplifiers.
1.5.2.2 Absorption
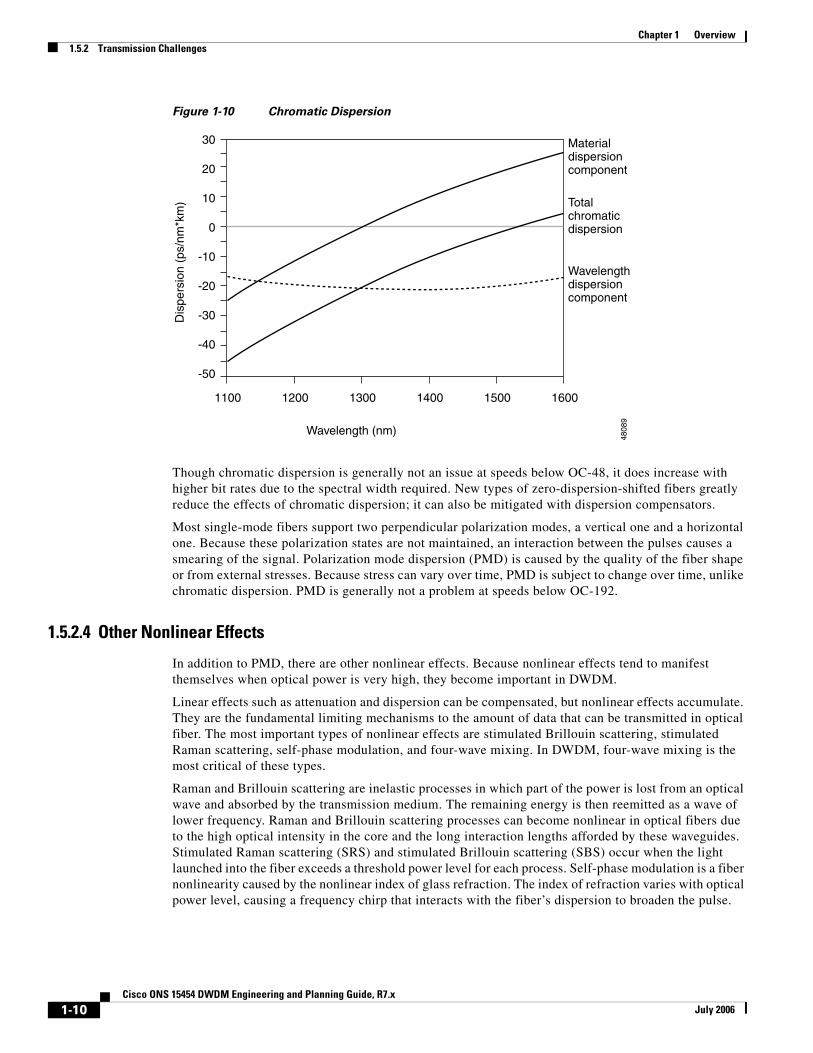
The intrinsic properties of the material itself, the impurities in the glass, and any atomic defects in the glass cause attenuation due to absorption. These impurities absorb the optical energy, causing the light to become dimmer (see Figure 1-8). While Rayleigh scattering is important at shorter wavelengths, intrinsic absorption is an issue at longer wavelengths and increases dramatically above 1700 nm. However, absorption due to water peaks introduced in the fiber manufacturing process is being eliminated in some new fiber types.
4808
5
5
4
3
2
1
0
0.7 0.8 0.9 1.0 1.1 1.2 1.3 1.4 1.5 1.6 1.7 1.8 1.9 2.0
Opt
ical
loss
(dB
/km
)
Firs
t win
dow
Sec
ond
win
dow
Thi
rd w
indo
w "
C"
band
Fou
rth
win
dow
"L"
ban
d
Wavelength (micrometers)
Intrinsic scattering(Rayleigh
Totalattenuation
Intrinsicabsorbtion
4808
7
1-8Cisco ONS 15454 DWDM Engineering and Planning Guide, R7.x
July 2006
Chapter 1 Overview1.5.2 Transmission Challenges
Figure 1-8 Absorption
1.5.2.3 Dispersion
Dispersion is the spreading of light pulses as they travel down optical fiber. Dispersion results in distortion of the signal (see Figure 1-9), which limits the bandwidth of the fiber.
Figure 1-9 Principle of Dispersion
Two general types of dispersion affect DWDM systems: chromatic dispersion and PMD. Chromatic dispersion is linear and PMD is nonlinear.
Chromatic dispersion occurs because different wavelengths propagate at different speeds. The effect of chromatic dispersion increases as the square of the bit rate. In single-mode fiber, chromatic dispersion has two components, material dispersion and waveguide dispersion.
Material dispersion occurs when wavelengths travel at different speeds through the material. A light source, no matter how narrow, emits several wavelengths within a range. Thus, when this range of wavelengths travels through a medium, each individual wavelength arrives at a different time.
The second component of chromatic dispersion, waveguide dispersion, occurs because of the different refractive indices of the fiber’s core and cladding. The effective refractive index varies with wavelength, as follows:
• At short wavelengths, the light is well confined within the core. Thus the effective refractive index is close to the refractive index of the core material.
• At medium wavelengths, the light spreads slightly into the cladding. This decreases the effective refractive index.
• At long wavelengths, much of the light spreads into the cladding. This brings the effective refractive index very close to that of the cladding.
This result of waveguide dispersion is a propagation delay in one or more of the wavelengths.
Total chromatic dispersion, along with its components, is plotted by wavelength in Figure 1-10 for dispersion-shifted fiber. For nondispersion-shifted fiber, the zero dispersion wavelength is 1310 nm.
4808
6
Time Fiber Time 4808
8
1-9Cisco ONS 15454 DWDM Engineering and Planning Guide, R7.x
July 2006
Chapter 1 Overview1.5.2 Transmission Challenges
Figure 1-10 Chromatic Dispersion
Though chromatic dispersion is generally not an issue at speeds below OC-48, it does increase with higher bit rates due to the spectral width required. New types of zero-dispersion-shifted fibers greatly reduce the effects of chromatic dispersion; it can also be mitigated with dispersion compensators.
Most single-mode fibers support two perpendicular polarization modes, a vertical one and a horizontal one. Because these polarization states are not maintained, an interaction between the pulses causes a smearing of the signal. Polarization mode dispersion (PMD) is caused by the quality of the fiber shape or from external stresses. Because stress can vary over time, PMD is subject to change over time, unlike chromatic dispersion. PMD is generally not a problem at speeds below OC-192.
1.5.2.4 Other Nonlinear Effects
In addition to PMD, there are other nonlinear effects. Because nonlinear effects tend to manifest themselves when optical power is very high, they become important in DWDM.
Linear effects such as attenuation and dispersion can be compensated, but nonlinear effects accumulate. They are the fundamental limiting mechanisms to the amount of data that can be transmitted in optical fiber. The most important types of nonlinear effects are stimulated Brillouin scattering, stimulated Raman scattering, self-phase modulation, and four-wave mixing. In DWDM, four-wave mixing is the most critical of these types.
Raman and Brillouin scattering are inelastic processes in which part of the power is lost from an optical wave and absorbed by the transmission medium. The remaining energy is then reemitted as a wave of lower frequency. Raman and Brillouin scattering processes can become nonlinear in optical fibers due to the high optical intensity in the core and the long interaction lengths afforded by these waveguides. Stimulated Raman scattering (SRS) and stimulated Brillouin scattering (SBS) occur when the light launched into the fiber exceeds a threshold power level for each process. Self-phase modulation is a fiber nonlinearity caused by the nonlinear index of glass refraction. The index of refraction varies with optical power level, causing a frequency chirp that interacts with the fiber’s dispersion to broaden the pulse.
30
20
10
0
-10
-20
-30
-40
-50
1100 1200 1300 1400 1500 1600
Wavelength (nm)
Dis
pers
ion
(ps/
nm*k
m)
Material dispersioncomponent
Totalchromaticdispersion
Wavelengthdispersioncomponent
4808
9
1-10Cisco ONS 15454 DWDM Engineering and Planning Guide, R7.x
July 2006
Chapter 1 Overview1.5.3 Light Emitters and Detectors
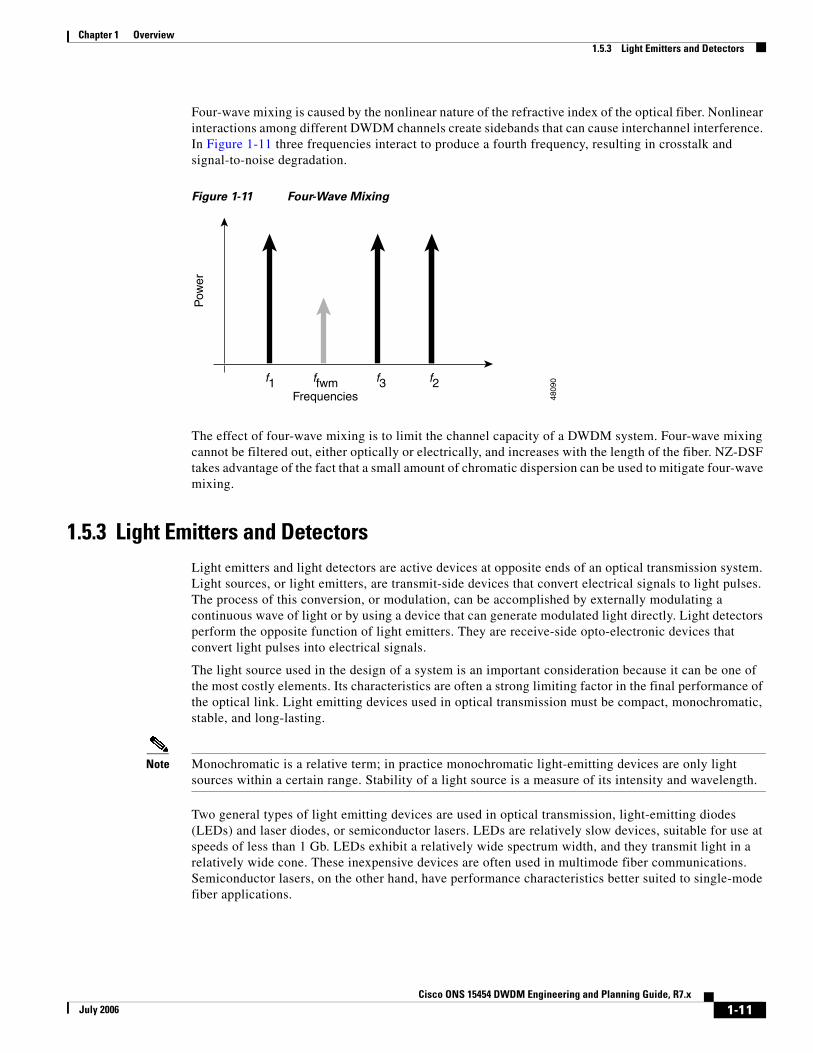
Four-wave mixing is caused by the nonlinear nature of the refractive index of the optical fiber. Nonlinear interactions among different DWDM channels create sidebands that can cause interchannel interference. In Figure 1-11 three frequencies interact to produce a fourth frequency, resulting in crosstalk and signal-to-noise degradation.
Figure 1-11 Four-Wave Mixing
The effect of four-wave mixing is to limit the channel capacity of a DWDM system. Four-wave mixing cannot be filtered out, either optically or electrically, and increases with the length of the fiber. NZ-DSF takes advantage of the fact that a small amount of chromatic dispersion can be used to mitigate four-wave mixing.
1.5.3 Light Emitters and DetectorsLight emitters and light detectors are active devices at opposite ends of an optical transmission system. Light sources, or light emitters, are transmit-side devices that convert electrical signals to light pulses. The process of this conversion, or modulation, can be accomplished by externally modulating a continuous wave of light or by using a device that can generate modulated light directly. Light detectors perform the opposite function of light emitters. They are receive-side opto-electronic devices that convert light pulses into electrical signals.
The light source used in the design of a system is an important consideration because it can be one of the most costly elements. Its characteristics are often a strong limiting factor in the final performance of the optical link. Light emitting devices used in optical transmission must be compact, monochromatic, stable, and long-lasting.
Note Monochromatic is a relative term; in practice monochromatic light-emitting devices are only light sources within a certain range. Stability of a light source is a measure of its intensity and wavelength.
Two general types of light emitting devices are used in optical transmission, light-emitting diodes (LEDs) and laser diodes, or semiconductor lasers. LEDs are relatively slow devices, suitable for use at speeds of less than 1 Gb. LEDs exhibit a relatively wide spectrum width, and they transmit light in a relatively wide cone. These inexpensive devices are often used in multimode fiber communications. Semiconductor lasers, on the other hand, have performance characteristics better suited to single-mode fiber applications.
Pow
er
f1 f3 f2ffwmFrequencies 48
090
1-11Cisco ONS 15454 DWDM Engineering and Planning Guide, R7.x
July 2006
Chapter 1 Overview1.5.3 Light Emitters and Detectors
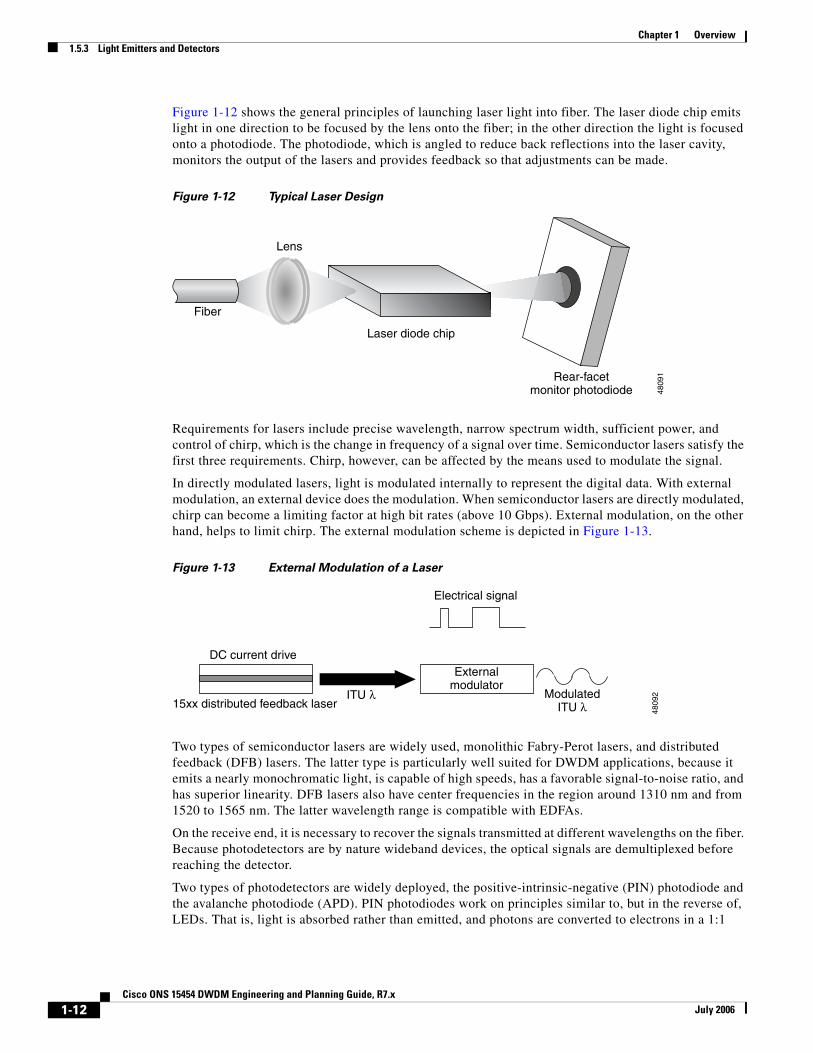
Figure 1-12 shows the general principles of launching laser light into fiber. The laser diode chip emits light in one direction to be focused by the lens onto the fiber; in the other direction the light is focused onto a photodiode. The photodiode, which is angled to reduce back reflections into the laser cavity, monitors the output of the lasers and provides feedback so that adjustments can be made.
Figure 1-12 Typical Laser Design
Requirements for lasers include precise wavelength, narrow spectrum width, sufficient power, and control of chirp, which is the change in frequency of a signal over time. Semiconductor lasers satisfy the first three requirements. Chirp, however, can be affected by the means used to modulate the signal.
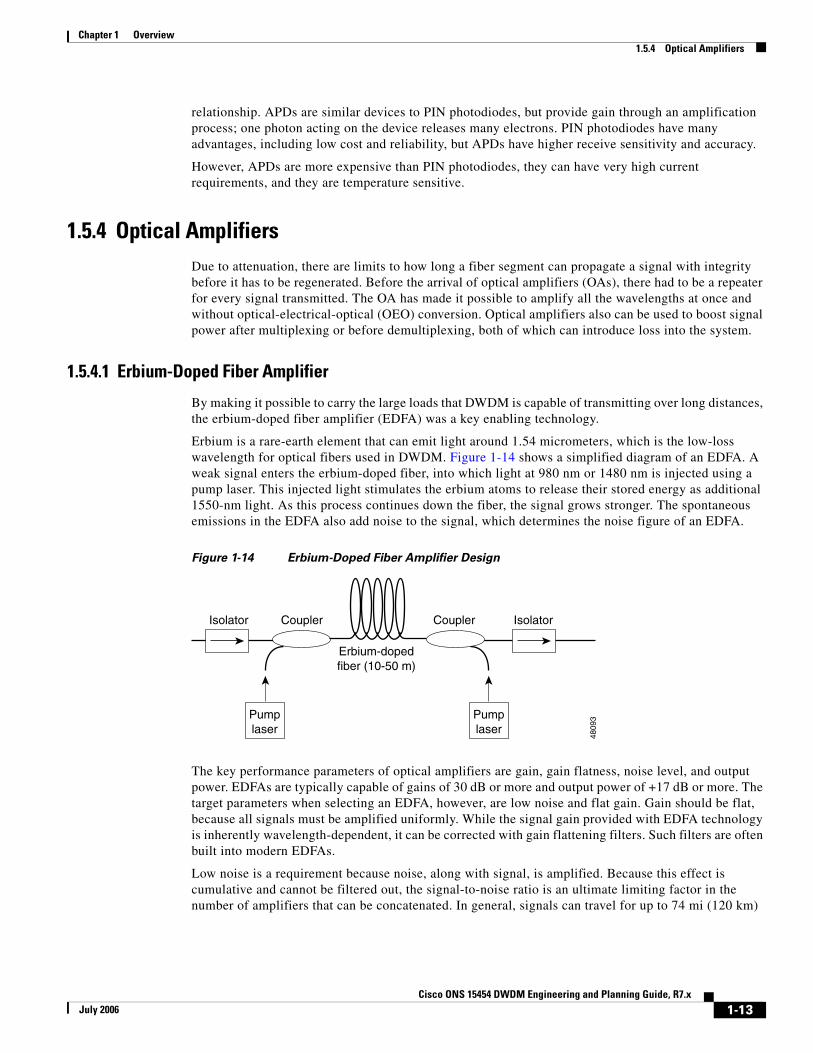
In directly modulated lasers, light is modulated internally to represent the digital data. With external modulation, an external device does the modulation. When semiconductor lasers are directly modulated, chirp can become a limiting factor at high bit rates (above 10 Gbps). External modulation, on the other hand, helps to limit chirp. The external modulation scheme is depicted in Figure 1-13.
Figure 1-13 External Modulation of a Laser
Two types of semiconductor lasers are widely used, monolithic Fabry-Perot lasers, and distributed feedback (DFB) lasers. The latter type is particularly well suited for DWDM applications, because it emits a nearly monochromatic light, is capable of high speeds, has a favorable signal-to-noise ratio, and has superior linearity. DFB lasers also have center frequencies in the region around 1310 nm and from 1520 to 1565 nm. The latter wavelength range is compatible with EDFAs.
On the receive end, it is necessary to recover the signals transmitted at different wavelengths on the fiber. Because photodetectors are by nature wideband devices, the optical signals are demultiplexed before reaching the detector.
Two types of photodetectors are widely deployed, the positive-intrinsic-negative (PIN) photodiode and the avalanche photodiode (APD). PIN photodiodes work on principles similar to, but in the reverse of, LEDs. That is, light is absorbed rather than emitted, and photons are converted to electrons in a 1:1
Rear-facetmonitor photodiode
Laser diode chip
Fiber
Lens
4809
1
Externalmodulator
ModulatedITU λ15xx distributed feedback laser
DC current drive
ITU λ
Electrical signal
4809
2
1-12Cisco ONS 15454 DWDM Engineering and Planning Guide, R7.x
July 2006
Chapter 1 Overview1.5.4 Optical Amplifiers
relationship. APDs are similar devices to PIN photodiodes, but provide gain through an amplification process; one photon acting on the device releases many electrons. PIN photodiodes have many advantages, including low cost and reliability, but APDs have higher receive sensitivity and accuracy.
However, APDs are more expensive than PIN photodiodes, they can have very high current requirements, and they are temperature sensitive.
1.5.4 Optical AmplifiersDue to attenuation, there are limits to how long a fiber segment can propagate a signal with integrity before it has to be regenerated. Before the arrival of optical amplifiers (OAs), there had to be a repeater for every signal transmitted. The OA has made it possible to amplify all the wavelengths at once and without optical-electrical-optical (OEO) conversion. Optical amplifiers also can be used to boost signal power after multiplexing or before demultiplexing, both of which can introduce loss into the system.
1.5.4.1 Erbium-Doped Fiber Amplifier
By making it possible to carry the large loads that DWDM is capable of transmitting over long distances, the erbium-doped fiber amplifier (EDFA) was a key enabling technology.
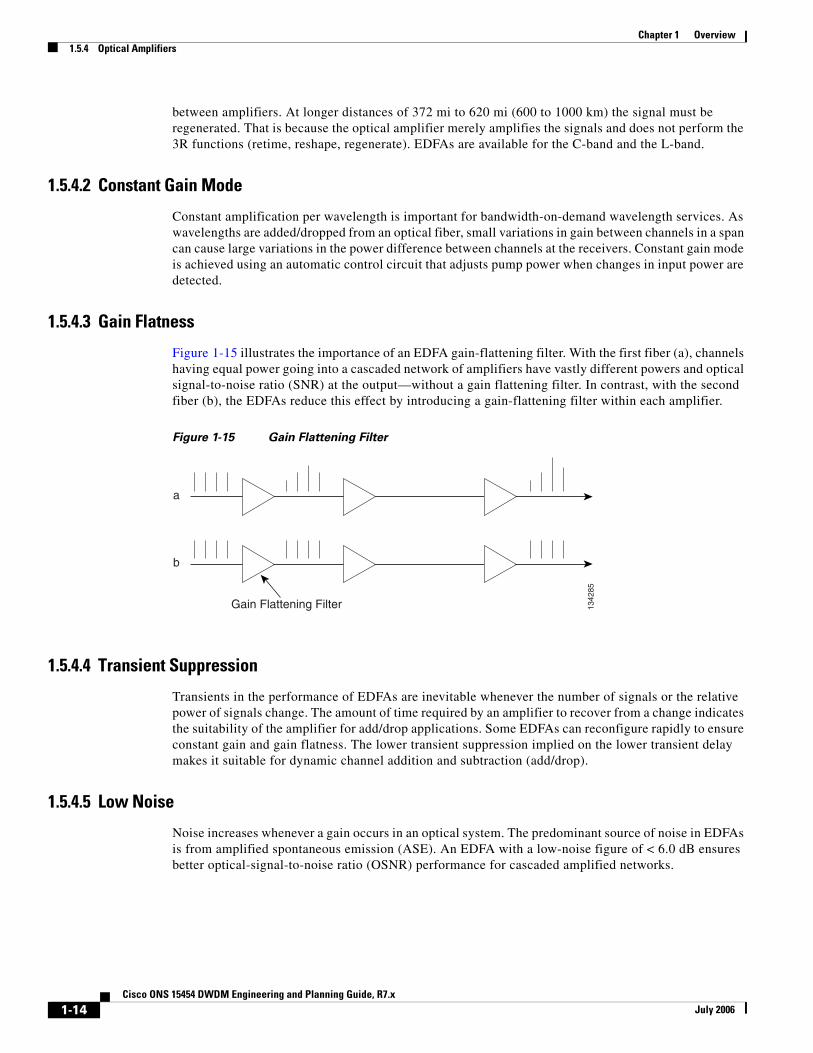
Erbium is a rare-earth element that can emit light around 1.54 micrometers, which is the low-loss wavelength for optical fibers used in DWDM. Figure 1-14 shows a simplified diagram of an EDFA. A weak signal enters the erbium-doped fiber, into which light at 980 nm or 1480 nm is injected using a pump laser. This injected light stimulates the erbium atoms to release their stored energy as additional 1550-nm light. As this process continues down the fiber, the signal grows stronger. The spontaneous emissions in the EDFA also add noise to the signal, which determines the noise figure of an EDFA.
Figure 1-14 Erbium-Doped Fiber Amplifier Design
The key performance parameters of optical amplifiers are gain, gain flatness, noise level, and output power. EDFAs are typically capable of gains of 30 dB or more and output power of +17 dB or more. The target parameters when selecting an EDFA, however, are low noise and flat gain. Gain should be flat, because all signals must be amplified uniformly. While the signal gain provided with EDFA technology is inherently wavelength-dependent, it can be corrected with gain flattening filters. Such filters are often built into modern EDFAs.
Low noise is a requirement because noise, along with signal, is amplified. Because this effect is cumulative and cannot be filtered out, the signal-to-noise ratio is an ultimate limiting factor in the number of amplifiers that can be concatenated. In general, signals can travel for up to 74 mi (120 km)
Pumplaser
Pumplaser
Erbium-dopedfiber (10-50 m)
CouplerIsolator IsolatorCoupler
4809
3
1-13Cisco ONS 15454 DWDM Engineering and Planning Guide, R7.x
July 2006
Chapter 1 Overview1.5.4 Optical Amplifiers
between amplifiers. At longer distances of 372 mi to 620 mi (600 to 1000 km) the signal must be regenerated. That is because the optical amplifier merely amplifies the signals and does not perform the 3R functions (retime, reshape, regenerate). EDFAs are available for the C-band and the L-band.
1.5.4.2 Constant Gain Mode
Constant amplification per wavelength is important for bandwidth-on-demand wavelength services. As wavelengths are added/dropped from an optical fiber, small variations in gain between channels in a span can cause large variations in the power difference between channels at the receivers. Constant gain mode is achieved using an automatic control circuit that adjusts pump power when changes in input power are detected.
1.5.4.3 Gain Flatness
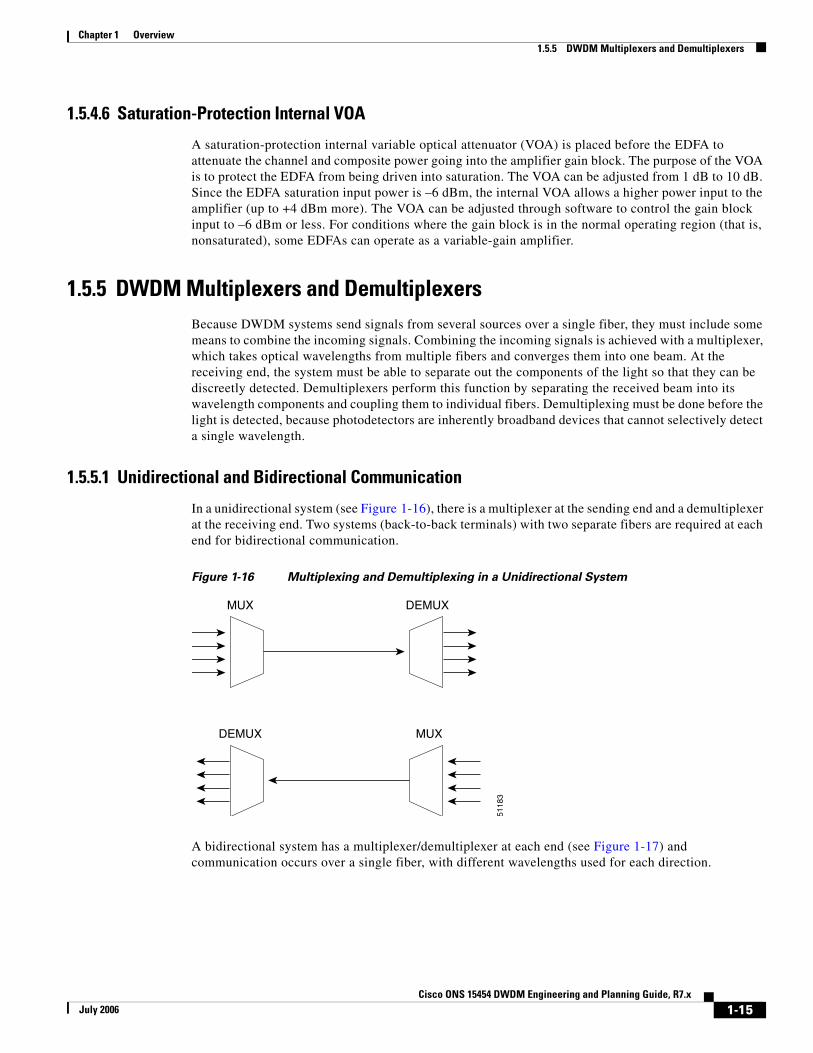
Figure 1-15 illustrates the importance of an EDFA gain-flattening filter. With the first fiber (a), channels having equal power going into a cascaded network of amplifiers have vastly different powers and optical signal-to-noise ratio (SNR) at the output—without a gain flattening filter. In contrast, with the second fiber (b), the EDFAs reduce this effect by introducing a gain-flattening filter within each amplifier.
Figure 1-15 Gain Flattening Filter
1.5.4.4 Transient Suppression
Transients in the performance of EDFAs are inevitable whenever the number of signals or the relative power of signals change. The amount of time required by an amplifier to recover from a change indicates the suitability of the amplifier for add/drop applications. Some EDFAs can reconfigure rapidly to ensure constant gain and gain flatness. The lower transient suppression implied on the lower transient delay makes it suitable for dynamic channel addition and subtraction (add/drop).
1.5.4.5 Low Noise
Noise increases whenever a gain occurs in an optical system. The predominant source of noise in EDFAs is from amplified spontaneous emission (ASE). An EDFA with a low-noise figure of < 6.0 dB ensures better optical-signal-to-noise ratio (OSNR) performance for cascaded amplified networks.
1342
85
a
b
Gain Flattening Filter
1-14Cisco ONS 15454 DWDM Engineering and Planning Guide, R7.x
July 2006
Chapter 1 Overview1.5.5 DWDM Multiplexers and Demultiplexers
1.5.4.6 Saturation-Protection Internal VOA
A saturation-protection internal variable optical attenuator (VOA) is placed before the EDFA to attenuate the channel and composite power going into the amplifier gain block. The purpose of the VOA is to protect the EDFA from being driven into saturation. The VOA can be adjusted from 1 dB to 10 dB. Since the EDFA saturation input power is –6 dBm, the internal VOA allows a higher power input to the amplifier (up to +4 dBm more). The VOA can be adjusted through software to control the gain block input to –6 dBm or less. For conditions where the gain block is in the normal operating region (that is, nonsaturated), some EDFAs can operate as a variable-gain amplifier.
1.5.5 DWDM Multiplexers and DemultiplexersBecause DWDM systems send signals from several sources over a single fiber, they must include some means to combine the incoming signals. Combining the incoming signals is achieved with a multiplexer, which takes optical wavelengths from multiple fibers and converges them into one beam. At the receiving end, the system must be able to separate out the components of the light so that they can be discreetly detected. Demultiplexers perform this function by separating the received beam into its wavelength components and coupling them to individual fibers. Demultiplexing must be done before the light is detected, because photodetectors are inherently broadband devices that cannot selectively detect a single wavelength.
1.5.5.1 Unidirectional and Bidirectional Communication
In a unidirectional system (see Figure 1-16), there is a multiplexer at the sending end and a demultiplexer at the receiving end. Two systems (back-to-back terminals) with two separate fibers are required at each end for bidirectional communication.
Figure 1-16 Multiplexing and Demultiplexing in a Unidirectional System
A bidirectional system has a multiplexer/demultiplexer at each end (see Figure 1-17) and communication occurs over a single fiber, with different wavelengths used for each direction.
MUX DEMUX
DEMUX MUX
5118
3
1-15Cisco ONS 15454 DWDM Engineering and Planning Guide, R7.x
July 2006
Chapter 1 Overview1.5.5 DWDM Multiplexers and Demultiplexers
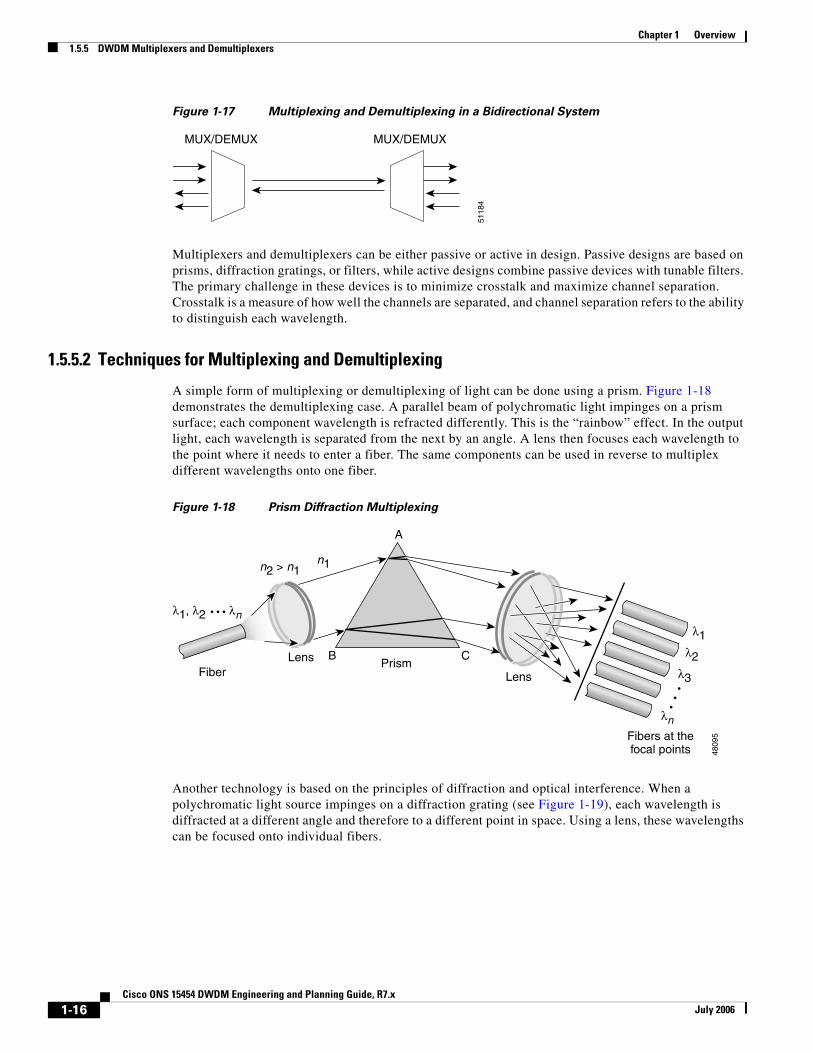
Figure 1-17 Multiplexing and Demultiplexing in a Bidirectional System
Multiplexers and demultiplexers can be either passive or active in design. Passive designs are based on prisms, diffraction gratings, or filters, while active designs combine passive devices with tunable filters. The primary challenge in these devices is to minimize crosstalk and maximize channel separation. Crosstalk is a measure of how well the channels are separated, and channel separation refers to the ability to distinguish each wavelength.
1.5.5.2 Techniques for Multiplexing and Demultiplexing
A simple form of multiplexing or demultiplexing of light can be done using a prism. Figure 1-18 demonstrates the demultiplexing case. A parallel beam of polychromatic light impinges on a prism surface; each component wavelength is refracted differently. This is the “rainbow” effect. In the output light, each wavelength is separated from the next by an angle. A lens then focuses each wavelength to the point where it needs to enter a fiber. The same components can be used in reverse to multiplex different wavelengths onto one fiber.
Figure 1-18 Prism Diffraction Multiplexing
Another technology is based on the principles of diffraction and optical interference. When a polychromatic light source impinges on a diffraction grating (see Figure 1-19), each wavelength is diffracted at a different angle and therefore to a different point in space. Using a lens, these wavelengths can be focused onto individual fibers.
MUX/DEMUX MUX/DEMUX
5118
4
Fibers at thefocal points
PrismFiber
Lens
Lens
4809
5
A
B C
λ1, λ2 λn
n2 > n1n1
λ1λ2
λ3
λn
1-16Cisco ONS 15454 DWDM Engineering and Planning Guide, R7.x
July 2006
Chapter 1 Overview1.5.5 DWDM Multiplexers and Demultiplexers
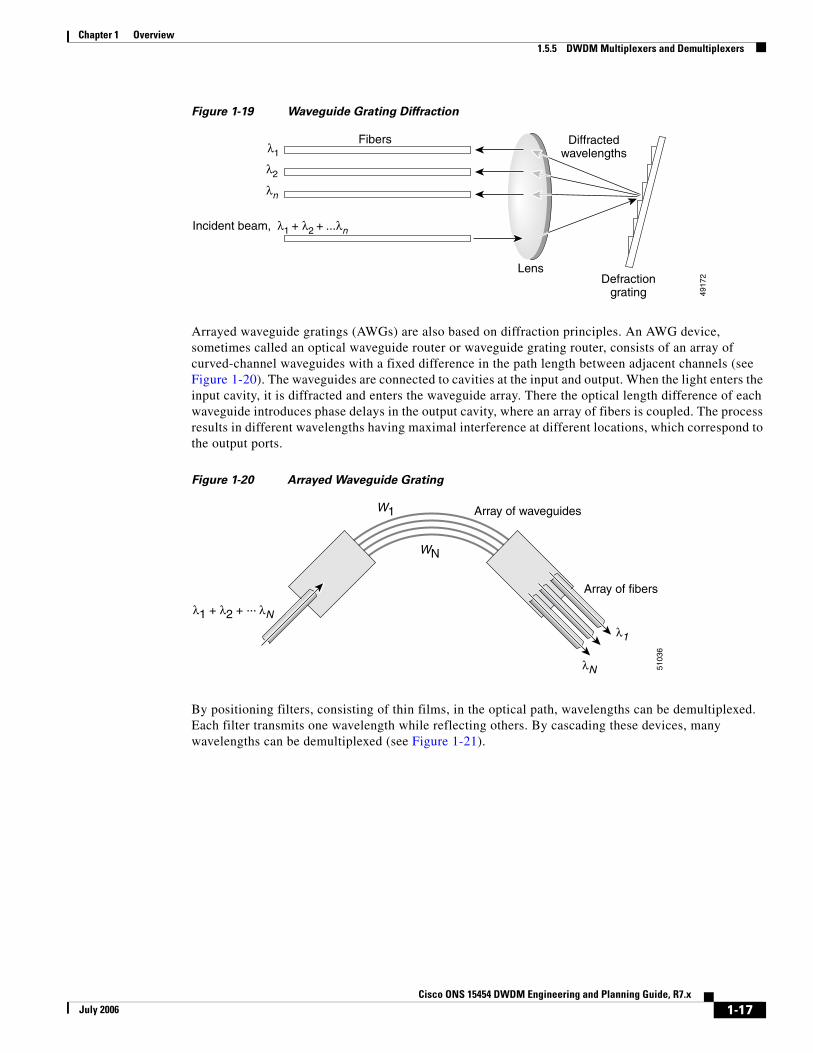
Figure 1-19 Waveguide Grating Diffraction
Arrayed waveguide gratings (AWGs) are also based on diffraction principles. An AWG device, sometimes called an optical waveguide router or waveguide grating router, consists of an array of curved-channel waveguides with a fixed difference in the path length between adjacent channels (see Figure 1-20). The waveguides are connected to cavities at the input and output. When the light enters the input cavity, it is diffracted and enters the waveguide array. There the optical length difference of each waveguide introduces phase delays in the output cavity, where an array of fibers is coupled. The process results in different wavelengths having maximal interference at different locations, which correspond to the output ports.
Figure 1-20 Arrayed Waveguide Grating
By positioning filters, consisting of thin films, in the optical path, wavelengths can be demultiplexed. Each filter transmits one wavelength while reflecting others. By cascading these devices, many wavelengths can be demultiplexed (see Figure 1-21).
Defractiongrating
Lens
Fibers Diffractedwavelengths
λ1 + λ2 + ...λn
λ2
λn
Incident beam,
λ1
4917
2
Array of fibers
Array of waveguides
λ1 + λ2 + ... λN
W1
WN
λN
λ1
5103
6
1-17Cisco ONS 15454 DWDM Engineering and Planning Guide, R7.x
July 2006
Chapter 1 Overview1.5.6 Optical Add/Drop Multiplexers
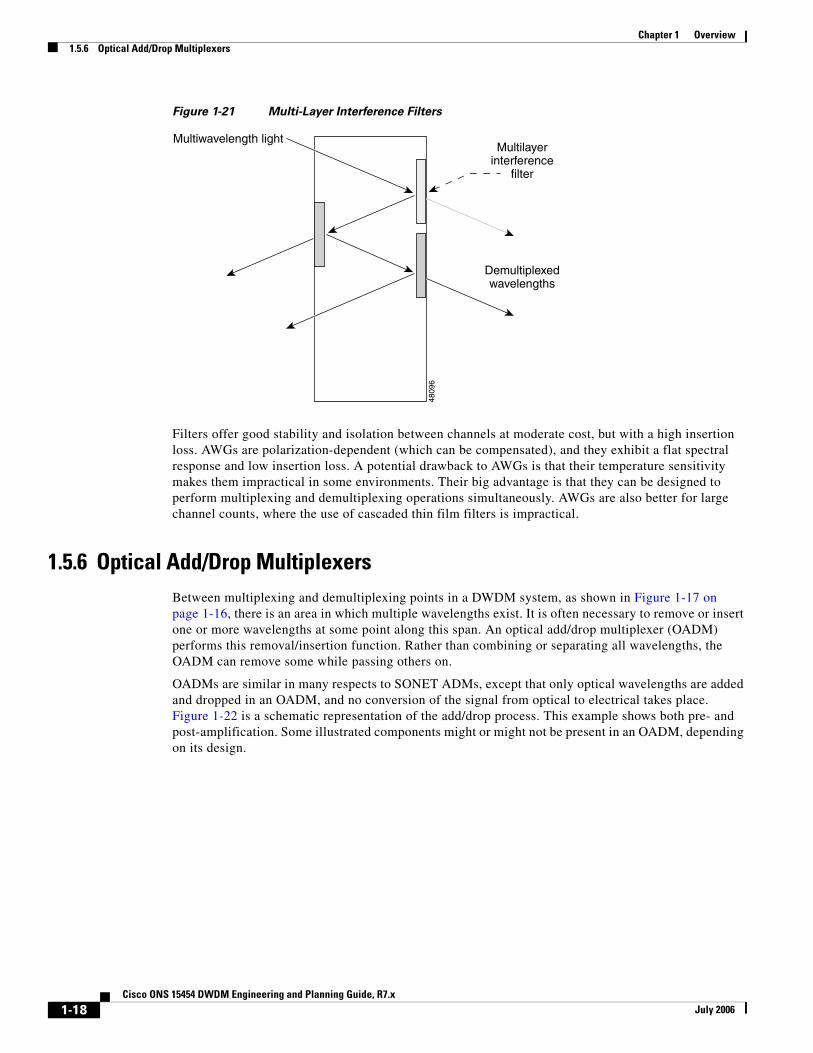
Figure 1-21 Multi-Layer Interference Filters
Filters offer good stability and isolation between channels at moderate cost, but with a high insertion loss. AWGs are polarization-dependent (which can be compensated), and they exhibit a flat spectral response and low insertion loss. A potential drawback to AWGs is that their temperature sensitivity makes them impractical in some environments. Their big advantage is that they can be designed to perform multiplexing and demultiplexing operations simultaneously. AWGs are also better for large channel counts, where the use of cascaded thin film filters is impractical.
1.5.6 Optical Add/Drop MultiplexersBetween multiplexing and demultiplexing points in a DWDM system, as shown in Figure 1-17 on page 1-16, there is an area in which multiple wavelengths exist. It is often necessary to remove or insert one or more wavelengths at some point along this span. An optical add/drop multiplexer (OADM) performs this removal/insertion function. Rather than combining or separating all wavelengths, the OADM can remove some while passing others on.
OADMs are similar in many respects to SONET ADMs, except that only optical wavelengths are added and dropped in an OADM, and no conversion of the signal from optical to electrical takes place. Figure 1-22 is a schematic representation of the add/drop process. This example shows both pre- and post-amplification. Some illustrated components might or might not be present in an OADM, depending on its design.
Multiwavelength light
Demultiplexedwavelengths
Multilayerinterference
filter
4809
6
1-18Cisco ONS 15454 DWDM Engineering and Planning Guide, R7.x
July 2006
Chapter 1 Overview1.6 DWDM Interfaces
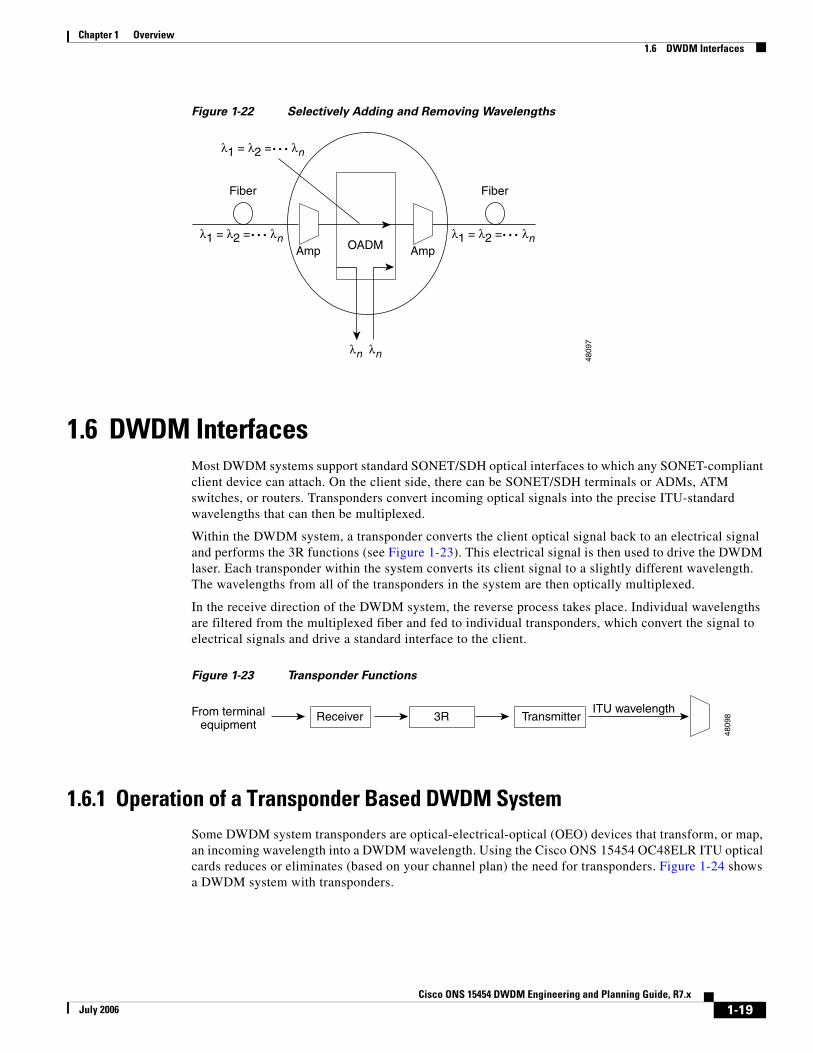
Figure 1-22 Selectively Adding and Removing Wavelengths
1.6 DWDM InterfacesMost DWDM systems support standard SONET/SDH optical interfaces to which any SONET-compliant client device can attach. On the client side, there can be SONET/SDH terminals or ADMs, ATM switches, or routers. Transponders convert incoming optical signals into the precise ITU-standard wavelengths that can then be multiplexed.
Within the DWDM system, a transponder converts the client optical signal back to an electrical signal and performs the 3R functions (see Figure 1-23). This electrical signal is then used to drive the DWDM laser. Each transponder within the system converts its client signal to a slightly different wavelength. The wavelengths from all of the transponders in the system are then optically multiplexed.
In the receive direction of the DWDM system, the reverse process takes place. Individual wavelengths are filtered from the multiplexed fiber and fed to individual transponders, which convert the signal to electrical signals and drive a standard interface to the client.
Figure 1-23 Transponder Functions
1.6.1 Operation of a Transponder Based DWDM SystemSome DWDM system transponders are optical-electrical-optical (OEO) devices that transform, or map, an incoming wavelength into a DWDM wavelength. Using the Cisco ONS 15454 OC48ELR ITU optical cards reduces or eliminates (based on your channel plan) the need for transponders. Figure 1-24 shows a DWDM system with transponders.
OADMAmp Amp
Fiber
λ1 = λ2 = λn
Fiber
λ1 = λ2 = λn
λ1 = λ2 = λn
λn λn 4809
7
From terminalequipment
ITU wavelengthReceiver Transmitter3R48
098
1-19Cisco ONS 15454 DWDM Engineering and Planning Guide, R7.x
July 2006
Chapter 1 Overview1.6.2 ITU Grid
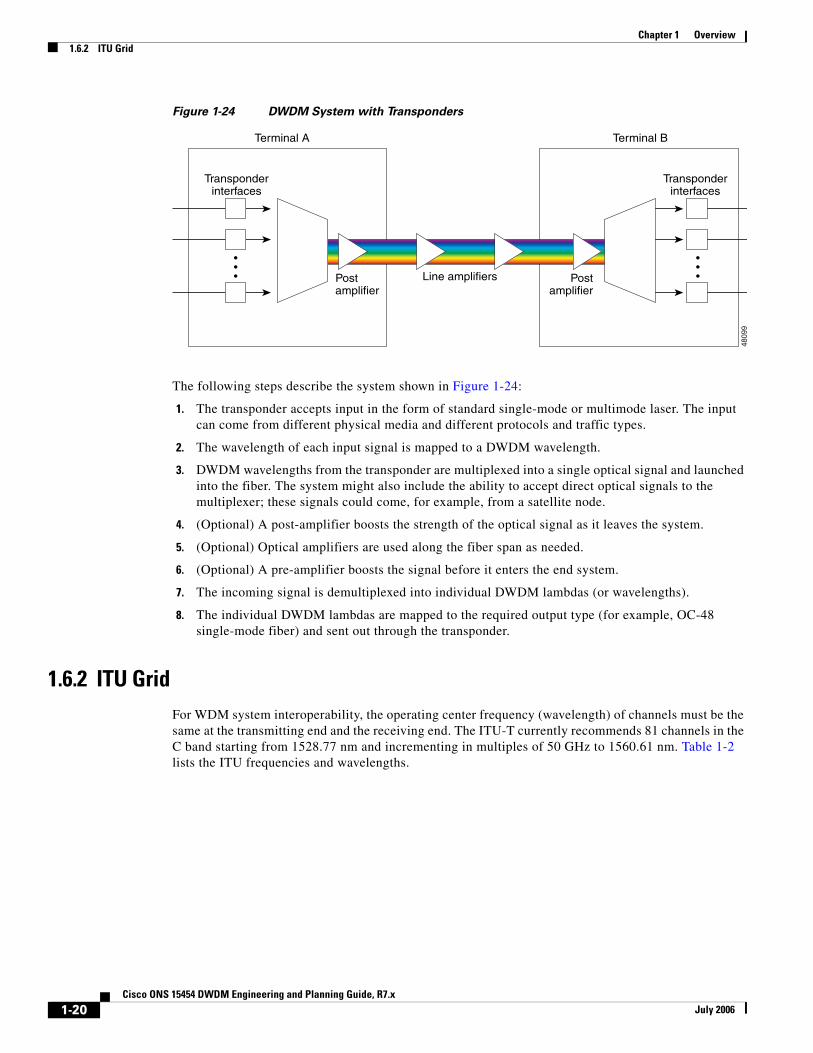
Figure 1-24 DWDM System with Transponders
The following steps describe the system shown in Figure 1-24:
1. The transponder accepts input in the form of standard single-mode or multimode laser. The input can come from different physical media and different protocols and traffic types.
2. The wavelength of each input signal is mapped to a DWDM wavelength.
3. DWDM wavelengths from the transponder are multiplexed into a single optical signal and launched into the fiber. The system might also include the ability to accept direct optical signals to the multiplexer; these signals could come, for example, from a satellite node.
4. (Optional) A post-amplifier boosts the strength of the optical signal as it leaves the system.
5. (Optional) Optical amplifiers are used along the fiber span as needed.
6. (Optional) A pre-amplifier boosts the signal before it enters the end system.
7. The incoming signal is demultiplexed into individual DWDM lambdas (or wavelengths).
8. The individual DWDM lambdas are mapped to the required output type (for example, OC-48 single-mode fiber) and sent out through the transponder.
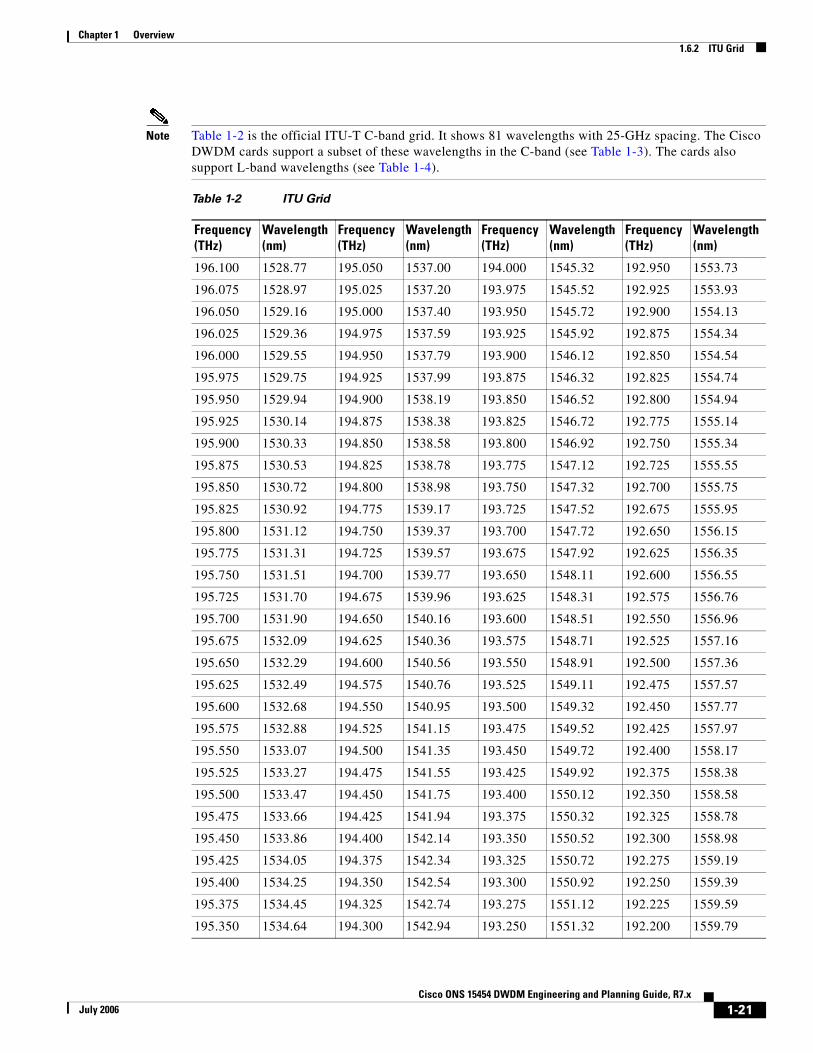
1.6.2 ITU GridFor WDM system interoperability, the operating center frequency (wavelength) of channels must be the same at the transmitting end and the receiving end. The ITU-T currently recommends 81 channels in the C band starting from 1528.77 nm and incrementing in multiples of 50 GHz to 1560.61 nm. Table 1-2 lists the ITU frequencies and wavelengths.
Postamplifier
Postamplifier
Transponderinterfaces
Transponderinterfaces
Line amplifiers
Terminal A Terminal B
4809
9
1-20Cisco ONS 15454 DWDM Engineering and Planning Guide, R7.x
July 2006
Chapter 1 Overview1.6.2 ITU Grid
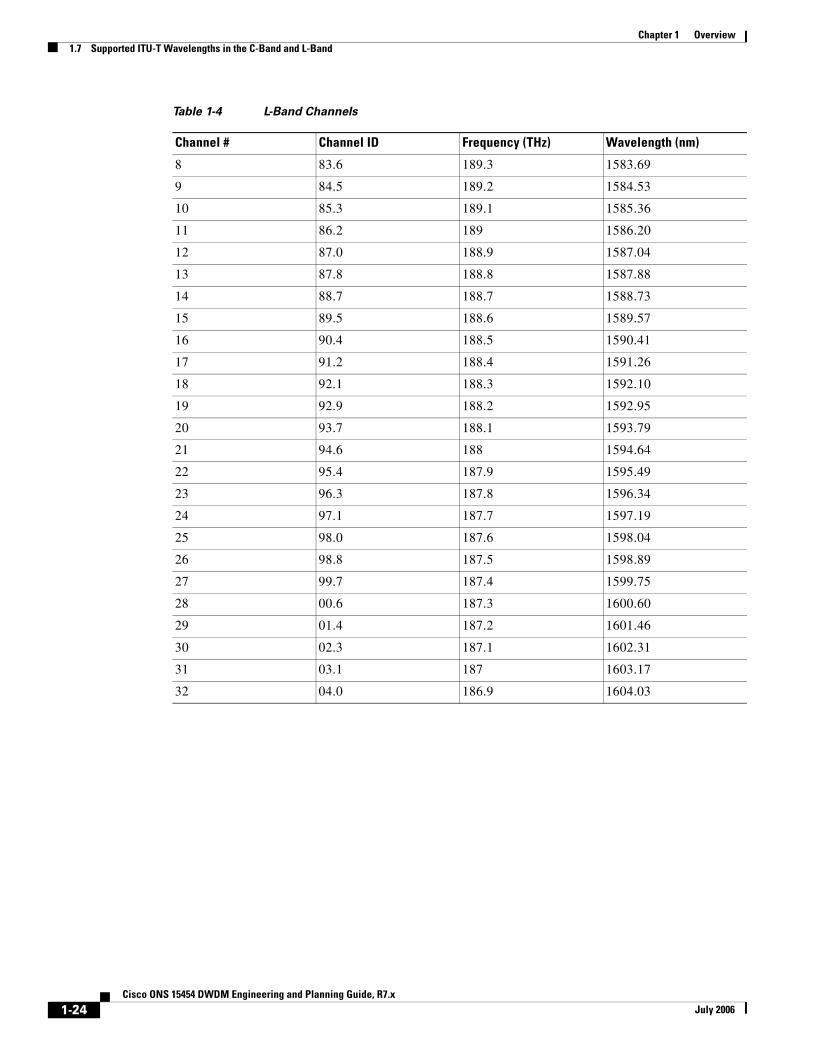
Note Table 1-2 is the official ITU-T C-band grid. It shows 81 wavelengths with 25-GHz spacing. The Cisco DWDM cards support a subset of these wavelengths in the C-band (see Table 1-3). The cards also support L-band wavelengths (see Table 1-4).
Table 1-2 ITU Grid
Frequency (THz)
Wavelength (nm)
Frequency (THz)
Wavelength (nm)
Frequency (THz)
Wavelength (nm)
Frequency (THz)
Wavelength (nm)
196.100 1528.77 195.050 1537.00 194.000 1545.32 192.950 1553.73
196.075 1528.97 195.025 1537.20 193.975 1545.52 192.925 1553.93
196.050 1529.16 195.000 1537.40 193.950 1545.72 192.900 1554.13
196.025 1529.36 194.975 1537.59 193.925 1545.92 192.875 1554.34
196.000 1529.55 194.950 1537.79 193.900 1546.12 192.850 1554.54
195.975 1529.75 194.925 1537.99 193.875 1546.32 192.825 1554.74
195.950 1529.94 194.900 1538.19 193.850 1546.52 192.800 1554.94
195.925 1530.14 194.875 1538.38 193.825 1546.72 192.775 1555.14
195.900 1530.33 194.850 1538.58 193.800 1546.92 192.750 1555.34
195.875 1530.53 194.825 1538.78 193.775 1547.12 192.725 1555.55
195.850 1530.72 194.800 1538.98 193.750 1547.32 192.700 1555.75
195.825 1530.92 194.775 1539.17 193.725 1547.52 192.675 1555.95
195.800 1531.12 194.750 1539.37 193.700 1547.72 192.650 1556.15
195.775 1531.31 194.725 1539.57 193.675 1547.92 192.625 1556.35
195.750 1531.51 194.700 1539.77 193.650 1548.11 192.600 1556.55
195.725 1531.70 194.675 1539.96 193.625 1548.31 192.575 1556.76
195.700 1531.90 194.650 1540.16 193.600 1548.51 192.550 1556.96
195.675 1532.09 194.625 1540.36 193.575 1548.71 192.525 1557.16
195.650 1532.29 194.600 1540.56 193.550 1548.91 192.500 1557.36
195.625 1532.49 194.575 1540.76 193.525 1549.11 192.475 1557.57
195.600 1532.68 194.550 1540.95 193.500 1549.32 192.450 1557.77
195.575 1532.88 194.525 1541.15 193.475 1549.52 192.425 1557.97
195.550 1533.07 194.500 1541.35 193.450 1549.72 192.400 1558.17
195.525 1533.27 194.475 1541.55 193.425 1549.92 192.375 1558.38
195.500 1533.47 194.450 1541.75 193.400 1550.12 192.350 1558.58
195.475 1533.66 194.425 1541.94 193.375 1550.32 192.325 1558.78
195.450 1533.86 194.400 1542.14 193.350 1550.52 192.300 1558.98
195.425 1534.05 194.375 1542.34 193.325 1550.72 192.275 1559.19
195.400 1534.25 194.350 1542.54 193.300 1550.92 192.250 1559.39
195.375 1534.45 194.325 1542.74 193.275 1551.12 192.225 1559.59
195.350 1534.64 194.300 1542.94 193.250 1551.32 192.200 1559.79
1-21Cisco ONS 15454 DWDM Engineering and Planning Guide, R7.x
July 2006
Chapter 1 Overview1.7 Supported ITU-T Wavelengths in the C-Band and L-Band
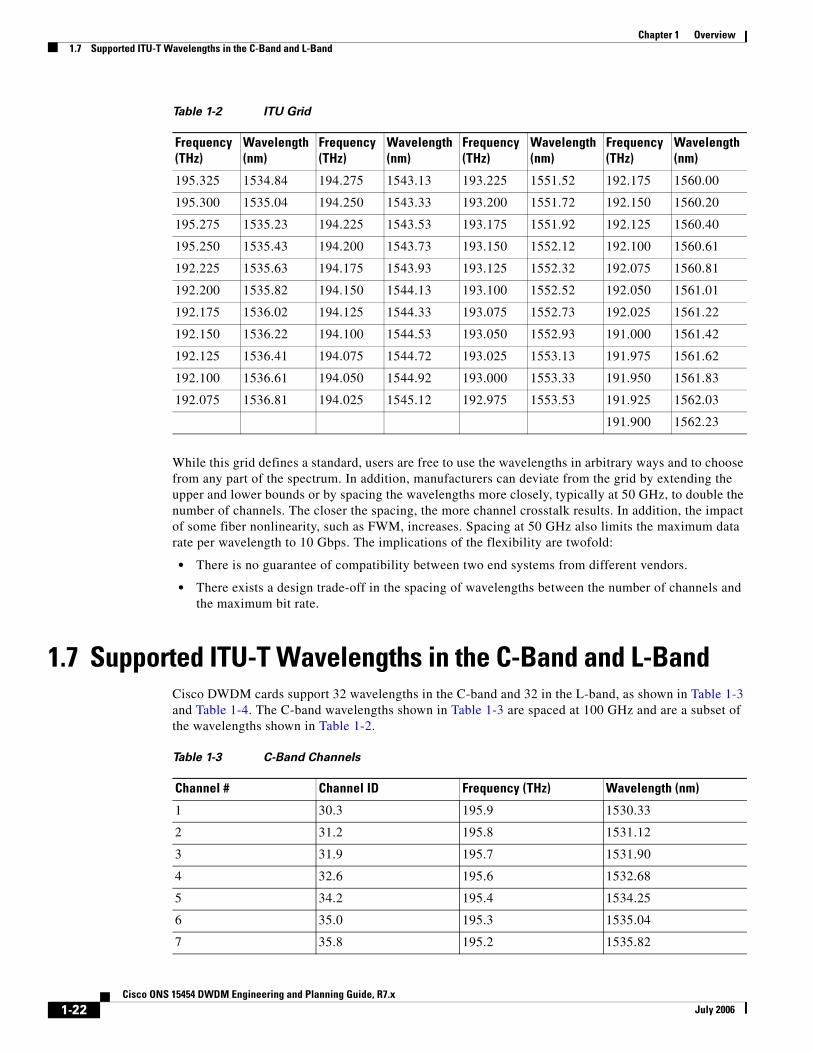
While this grid defines a standard, users are free to use the wavelengths in arbitrary ways and to choose from any part of the spectrum. In addition, manufacturers can deviate from the grid by extending the upper and lower bounds or by spacing the wavelengths more closely, typically at 50 GHz, to double the number of channels. The closer the spacing, the more channel crosstalk results. In addition, the impact of some fiber nonlinearity, such as FWM, increases. Spacing at 50 GHz also limits the maximum data rate per wavelength to 10 Gbps. The implications of the flexibility are twofold:
• There is no guarantee of compatibility between two end systems from different vendors.
• There exists a design trade-off in the spacing of wavelengths between the number of channels and the maximum bit rate.
1.7 Supported ITU-T Wavelengths in the C-Band and L-BandCisco DWDM cards support 32 wavelengths in the C-band and 32 in the L-band, as shown in Table 1-3 and Table 1-4. The C-band wavelengths shown in Table 1-3 are spaced at 100 GHz and are a subset of the wavelengths shown in Table 1-2.
195.325 1534.84 194.275 1543.13 193.225 1551.52 192.175 1560.00
195.300 1535.04 194.250 1543.33 193.200 1551.72 192.150 1560.20
195.275 1535.23 194.225 1543.53 193.175 1551.92 192.125 1560.40
195.250 1535.43 194.200 1543.73 193.150 1552.12 192.100 1560.61
192.225 1535.63 194.175 1543.93 193.125 1552.32 192.075 1560.81
192.200 1535.82 194.150 1544.13 193.100 1552.52 192.050 1561.01
192.175 1536.02 194.125 1544.33 193.075 1552.73 192.025 1561.22
192.150 1536.22 194.100 1544.53 193.050 1552.93 191.000 1561.42
192.125 1536.41 194.075 1544.72 193.025 1553.13 191.975 1561.62
192.100 1536.61 194.050 1544.92 193.000 1553.33 191.950 1561.83
192.075 1536.81 194.025 1545.12 192.975 1553.53 191.925 1562.03
191.900 1562.23
Table 1-2 ITU Grid
Frequency (THz)
Wavelength (nm)
Frequency (THz)
Wavelength (nm)
Frequency (THz)
Wavelength (nm)
Frequency (THz)
Wavelength (nm)
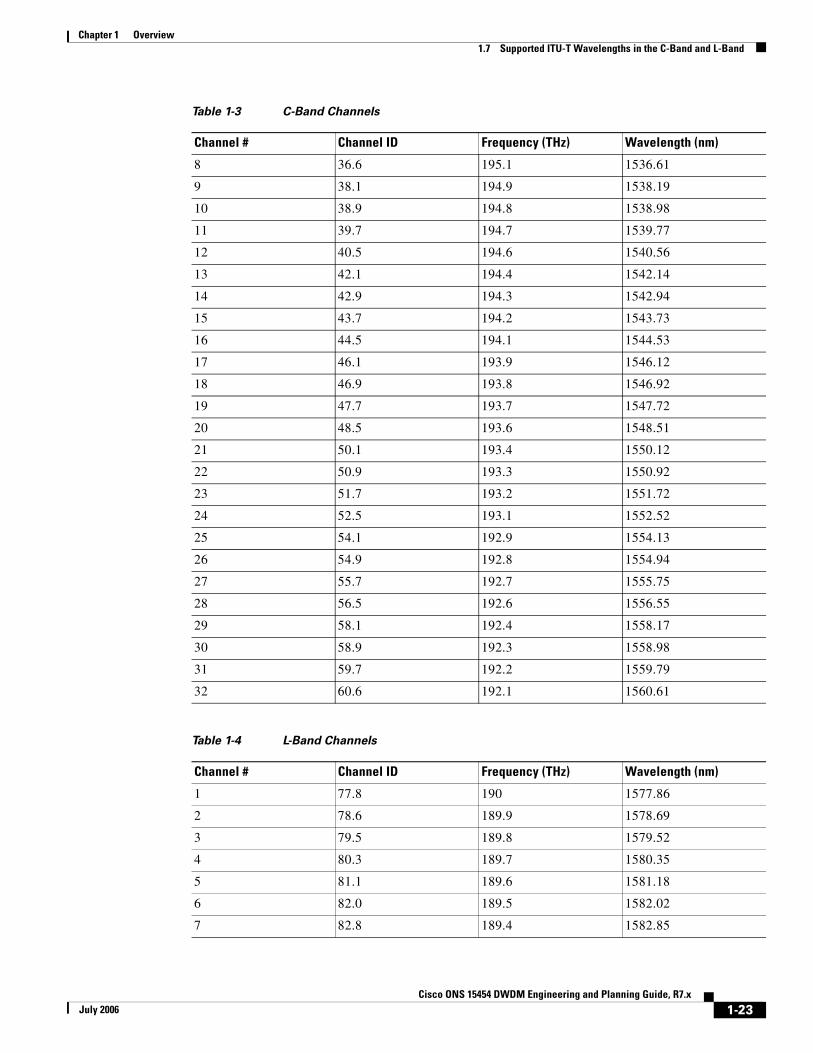
Table 1-3 C-Band Channels
Channel # Channel ID Frequency (THz) Wavelength (nm)
1 30.3 195.9 1530.33
2 31.2 195.8 1531.12
3 31.9 195.7 1531.90
4 32.6 195.6 1532.68
5 34.2 195.4 1534.25
6 35.0 195.3 1535.04
7 35.8 195.2 1535.82
1-22Cisco ONS 15454 DWDM Engineering and Planning Guide, R7.x
July 2006
Chapter 1 Overview1.7 Supported ITU-T Wavelengths in the C-Band and L-Band
8 36.6 195.1 1536.61
9 38.1 194.9 1538.19
10 38.9 194.8 1538.98
11 39.7 194.7 1539.77
12 40.5 194.6 1540.56
13 42.1 194.4 1542.14
14 42.9 194.3 1542.94
15 43.7 194.2 1543.73
16 44.5 194.1 1544.53
17 46.1 193.9 1546.12
18 46.9 193.8 1546.92
19 47.7 193.7 1547.72
20 48.5 193.6 1548.51
21 50.1 193.4 1550.12
22 50.9 193.3 1550.92
23 51.7 193.2 1551.72
24 52.5 193.1 1552.52
25 54.1 192.9 1554.13
26 54.9 192.8 1554.94
27 55.7 192.7 1555.75
28 56.5 192.6 1556.55
29 58.1 192.4 1558.17
30 58.9 192.3 1558.98
31 59.7 192.2 1559.79
32 60.6 192.1 1560.61
Table 1-4 L-Band Channels
Channel # Channel ID Frequency (THz) Wavelength (nm)
1 77.8 190 1577.86
2 78.6 189.9 1578.69
3 79.5 189.8 1579.52
4 80.3 189.7 1580.35
5 81.1 189.6 1581.18
6 82.0 189.5 1582.02
7 82.8 189.4 1582.85
Table 1-3 C-Band Channels
Channel # Channel ID Frequency (THz) Wavelength (nm)
1-23Cisco ONS 15454 DWDM Engineering and Planning Guide, R7.x
July 2006
Chapter 1 Overview1.7 Supported ITU-T Wavelengths in the C-Band and L-Band
8 83.6 189.3 1583.69
9 84.5 189.2 1584.53
10 85.3 189.1 1585.36
11 86.2 189 1586.20
12 87.0 188.9 1587.04
13 87.8 188.8 1587.88
14 88.7 188.7 1588.73
15 89.5 188.6 1589.57
16 90.4 188.5 1590.41
17 91.2 188.4 1591.26
18 92.1 188.3 1592.10
19 92.9 188.2 1592.95
20 93.7 188.1 1593.79
21 94.6 188 1594.64
22 95.4 187.9 1595.49
23 96.3 187.8 1596.34
24 97.1 187.7 1597.19
25 98.0 187.6 1598.04
26 98.8 187.5 1598.89
27 99.7 187.4 1599.75
28 00.6 187.3 1600.60
29 01.4 187.2 1601.46
30 02.3 187.1 1602.31
31 03.1 187 1603.17
32 04.0 186.9 1604.03
Table 1-4 L-Band Channels
Channel # Channel ID Frequency (THz) Wavelength (nm)
1-24Cisco ONS 15454 DWDM Engineering and Planning Guide, R7.x
July 2006