Embed Size (px)
Citation preview
Ownership Concentration and Performance in Ukraine’s Privatized Enterprises
ALEXANDER PIVOVARSKY*
This article investigates empirically the relationship between ownership concen-tration and performance in 376 partially and fully privatized Ukrainian enter-prises. It finds that ownership concentration is positively associated withenterprise performance in Ukraine. The article also finds that concentration ofownership by foreign companies and banks is associated with better performancethan ownership concentrated by the domestic owners. Ownership by Ukrainianinvestment funds and holding companies does not have a positive effect on per-formance. The article documents that, in contrast to predictions by manyobservers of early transition, privatization methods determined the long-termownership structure of privatized firms. [JEL G32, G37, L33, P31]
In the last two decades of the twentieth century, major transfers of state-ownedenterprises into private ownership have taken place around the world. The
scope of such transfers has been especially significant in the countries undergo-ing post-socialist transition (Nellis, 1998). These privatizations present a uniqueopportunity for the study of the effects of corporate ownership structure onenterprise performance. The ownership structures that were established in theprocess of privatization in these economies are an outcome of political bargaining
10
IMF Staff PapersVol. 50, No. 1© 2003 International Monetary Fund
*Alexander Pivovarsky is an Economist in the Expenditure Policy Division of the IMF’s Fiscal AffairsDepartment. At the time this article was prepared, he was in the IMF’s European II Department. This arti-cle is based on Chapter 1 of the author’s doctoral dissertation at Harvard University. He is grateful toRachel Glennerster, Oleh Havrylyshyn, Jess Hobart, Simon Johnson, Dwight Perkins, Katharina Pistor,Edgardo Ruggiero, Jeffrey Sachs, and Janusz Szyrmer, as well as an anonymous referee, the participantsin the Harvard Institute for International Development seminar in Kyiv, and the staff of the IMF’sEuropean II Department for valuable suggestions and comments.
(Kaufmann and Siegelbaum, 1996; World Bank, 1996). This process is funda-mentally different from the evolution of ownership structure in mature marketeconomies, which is an outcome of the interaction of market forces and leads toan optimal long-run equilibrium (Demsetz and Lehn, 1985). Given poor capitalmarkets and the high transaction cost of changes of ownership in most transitioneconomies, the initial post-privatization ownership structures tend to persist,thus providing an opportunity for testing a number of hypotheses on the role ofownership structure in enterprise restructuring and performance. In this article,I investigate the effects of ownership concentration on the post-privatization per-formance of medium and large enterprises in Ukraine. Its main hypothesis is thatin Ukraine’s inadequate legal and regulatory environment, enterprises withgreater nonstate concentration of ownership perform better than those with a dis-persed ownership structure.
This article is motivated by the debate on the effects of privatization. For theindustrialized and emerging market economies, there is strong evidence of thepositive effects of privatization on enterprise restructuring and performance. See,for example, Vining and Boardman (1992); Megginson, Nash, and vonRandenborgh (1994); Boubakri and Cosset (1998); La Porta and Lopez-de-Silanes(1999); Dewenter and Malatesta (2001). The empirical evidence in the literatureon privatization in transition economies is, however, less conclusive. Considersome examples of firm-level studies. For the Czech Republic, Hungary, andPoland, Frydman and others (1999) find that while privatization has no effect onprofit margins in the short run, it does lead to improved revenue performance. Forthe Slovak Republic, Djankov and Pohl (1998) find that privatization is associatedwith greater productivity and profitability as well as a number of other indicatorsof restructuring. For a group of Central European countries, Pohl and others(1997) find that privatization had a positive and significant impact on enterpriseproductivity. For Russia, Earle and Estrin (1997) find no significant differencesbetween performance of state-owned and privately owned enterprises. For smallretail stores in Russia, Barberis and others (1996) find significant improvement inrestructuring after privatization. For six Commonwealth of Independent States(CIS) countries, Djankov (1999) finds that state ownership is associated with lessrestructuring, but the result is not statistically significant. For Mongolia,Anderson, Lee, and Murrell (2000) find that state-owned enterprises perform bet-ter than privatized firms do.
In the survey studies of empirical literature on privatization, Djankov andMurrell (2000) and Megginson and Netter (2001) find that while privatization isstrongly associated with enterprise restructuring in Central Europe, the resultsare mixed for the CIS countries. Several explanations have been offered as towhy privatization results have not been uniform across transition economies.One strand of the literature has focused on the effects of ownership and controlgranted to enterprise insiders on the firms’ performance and restructuring afterprivatization. It has been argued that insiders are motivated by objectives otherthan enterprise efficiency and, therefore, enterprise equity should be transferredto outside owners to achieve better restructuring and performance (see, forexample, Aghion and Blanchard, 1996). A second strand of the literature has
OWNERSHIP CONCENTRATION AND PERFORMANCE IN UKRAINE’S ENTERPRISES
11
investigated the hypothesis that the degree of competition is more important thanthe ownership structure in explaining enterprise performance in transition(Tandon, 1995; Anderson, Lee, and Murrell, 2000). Market reforms in transitioneconomies involved price liberalization and subjecting domestic enterprises tointernational competition, and it is possible that firm-level and country-specificdifferences in competition explain the variation in post-privatization perfor-mance. A third strand of the literature has focused on the role of “soft budgetconstraints,” a major enterprise governance problem inherent in the socialist sys-tem (see Kornai, 1992 and 1995).
The empirical evidence supporting all of these hypotheses has been limitedso far. For instance, Estrin and Rosevear (1999) find that insider-dominated firmsin Ukraine actually perform better than outsider-dominated firms. Earle andEstrin (1996) obtain ambiguous results in their study of the role of competitionin enterprise performance in Russia. While some studies do find that enterprisesexpect “soft” government support after privatization (Anderson, Korsun, andMurrell, 2000), there is little evidence that soft budgets have an effect on post-privatization enterprise performance. For example, Earle and Estrin (1998) do notfind a negative relationship between government subsidies and labor productivityin Russia.
Recent literature on transition economies has focused on the interaction ofinstitutions and ownership structure for explanations of why privatization has notbeen a success across the board. Today, after we have had a chance to assess theearly results of transition, a consensus is emerging that at the beginning of transi-tion, more questions should have been asked—and answered—about how best toprivatize (see, for discussion, Havrylyshyn and McGettigan, 2000). In this article,I find evidence that supports some of the arguments made in this new literature andfocus on the degree of ownership concentration as an explanation of the variationin enterprise performance.
Ukraine was selected for this study for several reasons. First, like most transi-tion economies, in the early 1990s it adopted an ambitious privatization program.Second, Ukraine has made data on the identity and size of concentrated ownershipstakes in a large number of privatized enterprises available for research (the firstcountry in the CIS to do so). Third, the peculiarities of Ukraine’s privatization pro-gram led to a variation in opportunities for initial ownership concentration. Thisvariation in proportions of equity privatized by different privatization methods canbe exploited to estimate the effects of ownership concentration on enterpriseperformance.
Using data on 376 medium and large enterprises, this study finds that owner-ship concentration is positively associated with enterprise performance in Ukraine.An instrumental variable approach confirms the article’s basic findings. For thecross section of enterprises, the concentration of ownership by foreign companiesand banks is associated with better performance than ownership that is principallydomestic. Ownership by the Ukrainian investment funds and holding companiesdoes not have a positive effect on performance. This study also finds that, in con-trast to predictions by many observers of early transition, privatization methodshave had a lasting effect on ownership concentration in Ukraine.
Alexander Pivovarsky
12
The remainder of this article is organized as follows. Section I provides back-ground and a review of related literature. Section II presents the data. Section IIIpresents results of ordinary-least-squares regression estimates of the ownershipconcentration’s effects on enterprise performance. Section IV presents the argu-ment for using proportions of equity privatized by different privatization methodsas instruments for current ownership concentration. Section V presents results oftwo-stage-least-squares regressions, and Section VI concludes.
I. Background
For a long time, economic literature investigating the modern firm was domi-nated by the image of a broadly held American corporation (see, for example,Berle and Means, 1932). Its main focus has been on the corporate governanceproblem, with the agency perspective as the central theme.1 A manager control-ling the firm may not act in the interests of the owner, and such an agency prob-lem may have a negative impact on enterprise performance. This problem maybe especially severe when ownership is dispersed among a large number ofshareholders. Researchers have found empirical evidence of the positive associ-ation between ownership concentration and enterprise performance in theUnited States (Shleifer and Vishny, 1986). Some authors have challenged thattraditional view of the effects of dispersed ownership structures on enterpriseperformance. They have argued that ownership structure in a mature marketeconomy is the outcome of bargaining among economic agents and that anyassociation between ownership structure and performance is spurious at best(Coase, 1937; Demsetz and Lehn, 1985).
The problem of ownership concentration and its effects on enterprise perfor-mance reemerged in the context of post-socialist transition. The privatization pro-grams in transition economies have been an outcome of the political process thatdid not necessarily lead to creation of “optimal” post-privatization ownershipstructures (Kaufmann and Siegelbaum, 1996; World Bank, 1996). While govern-ments contemplating privatizations had a mixture of objectives—including maxi-mization of government revenues, attracting international and domestic capital,and promoting enterprise restructuring and equitable distribution of wealth—thepolitical constraints often interfered with these objectives. It was consideredalmost commonly accepted wisdom that privatization should proceed quickly,regardless of the method used, in order to reduce the possibility of corrupt officialsbenefiting from the control vacuum that emerged after the collapse of the plannedeconomic systems and to rule out the possibility of a communist comeback.Driven by the political need for speed, many countries privatized thousands offirms by widely dispersing share ownership with little consideration given to howenterprises would be governed after privatization. It was expected, at that time,that either the ownership structure would quickly evolve to attain an efficientequilibrium, given the institutional and other constraints facing the firms, or the
OWNERSHIP CONCENTRATION AND PERFORMANCE IN UKRAINE’S ENTERPRISES
13
1I follow the definition of corporate governance provided in Shleifer and Vishny (1997), which dealswith the ways in which suppliers of finance to firms assure that they will get a return on their investments.
institutional arrangements would evolve to support the post-privatization owner-ship structure (see, for example, Boycko, Shleifer, and Vishny, 1995).
More recent literature on comparative corporate governance has focused onthe interaction of the institutions of investor protection and ownership structuresin determining firms’ access to investment finance. It was argued that a combi-nation of legal rules and ownership concentration could be used to mitigate gov-ernance problems (Shleifer and Vishny, 1997). It has been shown, however, thateven in mature market economies, the diversion of corporate resources fromminority shareholders to controlling shareholders and managers can be substan-tial (see, for example, Johnson and others, 2000) and that corporations arewidely held only in countries with very good shareholder protection (La Porta,Lopez-de-Silanes, and Shleifer, 1999). In such countries, shareholders witheffective control over firms are not afraid that their firms will be expropriatedand, thus, they can afford to sell shares to raise new capital or to diversify risk.At the same time, small investors can afford to take minority ownership interestsin firms when they know that managers or controlling shareholders will notexpropriate their ownership stakes. This new literature suggests that the tradi-tional corporate governance paradigm, with its focus on the problem of moni-toring and control of the firms’ managers by outside shareholders, is notsufficient to address the enterprise problems of transition and of some otheremerging economies. In transition economies, small investors are not likely toplay an important role in providing new financing to firms in the near future,owing to the institutional constraints (Pistor, Raiser, and Gelfer, 2000). At thesame time, practitioners who were involved in designing mass privatization pro-grams in the region argue that outside governance mechanisms tend to be inef-fective in transition economies and suggest that privatization should involvemechanisms leading to direct enterprise monitoring by owners to achieve betterresults (Frydman and others, 1997). This debate on the interaction of institutionsof investor protection and the ownership structure is relevant for the transitioneconomies: there is a mismatch between the institutions of investor protectionand the ownership structure that emerged after privatization. From this perspec-tive, Ukraine is an excellent subject for a case study.
In December 1991, the Ukrainian parliament declared two key principles toguide the privatization of state-owned assets: speed and social acceptability. Tofulfill these principles, the government opted for privatization methods aimedprimarily at establishing dispersed ownership of state-owned enterprises. Theparliamentarians envisioned that all citizens would participate in privatization.Allocation of enterprises to investors who were capable of attracting new capi-tal into firms or improving the quality of governance was not on the privatiza-tion agenda at that early stage. The 1992 privatization law envisioned eightprivatization methods that differed in terms of the opportunities for ownershipconcentration that were offered to potentially interested parties (described indetail in Section IV of this article). Most small enterprises experienced a singlemethod of privatization. For medium and large enterprises (defined by theUkrainian government as enterprises that maintained independent balance sheetsbefore privatization), partial stakes were to be distributed via a combination of
Alexander Pivovarsky
14
some or all of the specified privatization methods. Preparation for privatizationof medium and large enterprises involved their transformation from units ofministries and government agencies into open joint stock companies.
In terms of numbers of enterprises and workers involved, the privatizationefforts have been enormous. Between 1991 and 1998, the Ukrainian governmenttransferred formal ownership titles for more than 60,000 state-owned enterprises tononstate agents and the privatization program involved all sectors of the nationaleconomy. The number of people employed by medium and large enterprises ownedby the central government declined from 13 million in 1992 to just over 5 millionin 1998. In terms of the share of capital assets employed by medium and largeenterprises, the magnitude of privatization was also significant.
For political and historical reasons, the Ukrainian privatization during1992–98 primarily involved mechanisms that led to dispersed ownership struc-tures. Enterprise insiders were able to acquire a significant proportion of shares inmany firms. In most cases, the equity offered to outsiders was either transferredinto dispersed individual holdings or into the holdings of broadly held financialintermediaries. State revenues from privatization as a share of GDP and total gov-ernment revenues were insignificant owing to the nature of mass privatization,which involved issuance of free privatization certificates. Only a small share ofequity was offered to owners interested in accumulating significant ownershipstakes, through such privatization methods as stock exchange or over-the-countersales and commercial and noncommercial tenders.
The Ukrainian privatization took place in an economic environment that didnot lend institutional support to minority shareholders or investors in general.After the collapse of the Soviet coordination and control system, Ukraine faced thechallenge of setting up a system of institutions that would support decentralizedinvestment and production. Corporate law had not existed for more than sevendecades. Unlike in neighboring Poland, Hungary, and the Czech Republic, therewere no commercial codes that could be restored and no deeply ingrained socialrules or civil society supporting private ownership. As a result, today Ukraine hasweaker investor protection than the developed market economies and the moreadvanced economies in transition.
Although by the mid-1990s Ukraine possessed a functioning legal and courtsystem, and its company law compared reasonably well with those of other coun-tries,2 it was poorly equipped for administration of commercial law and contractenforcement. The legal transition index of the European Bank for Reconstructionand Development (EBRD), based on a survey of lawyers in the region, ranks coun-tries on the basis of the extensiveness and effectiveness of their pledge,bankruptcy, and company laws (EBRD, 1997). Ukraine scored 2 (on a scale from
OWNERSHIP CONCENTRATION AND PERFORMANCE IN UKRAINE’S ENTERPRISES
15
2La Porta, Lopez-de-Silanes, Shleifer, and Vishny (1998) use six criteria to evaluate the quality ofshareholder protections, based on a country’s commercial law. They assign a cumulative score of anti-director rights (between zero and six) by adding points if a country’s commercial code or commercial lawmeets the criteria of minority shareholder protection. Ukrainian corporate law scores relatively well on theanti-director rights index compared with those of other transition countries (Pistor, Raiser, and Gelfer,2000). Countries whose laws are based on the English legal system have the greatest degree of protectionprovided to minority shareholders (La Porta, Lopez-de-Silanes, Shleifer, and Vishny, 1998).
1 to 4+) on both of their measures.3 The 1997 Index of Economic Freedom, assem-bled by the (U.S.) Heritage Foundation, assigned Ukraine a score of 3+ on a scalefrom 1 to 4, which signifies a moderate level of protection of private property.4 Onthe enterprise level, Johnson, McMillan, and Woodruff (1999) conducted a surveythat asked managers in five countries (Ukraine, Poland, Slovakia, Romania, andRussia) whether courts could be used to enforce contracts with customers and sup-pliers. The percentage of managers who gave a positive answer was lowest inUkraine (55 percent).
Some scholars have recently argued that corporate law is not the most impor-tant instrument of shareholder protection. For instance, Coffee (1998) has arguedthat legislation governing securities and exchanges provides broader and moreeffective rules for shareholder protection. Pistor (2001) has argued that investorprotection rules, such as rules of disclosure, mandatory takeover bids, and insidertrading rules, benefit investors in general and may be important in the develop-ment of sound equity markets. Glaeser, Johnson, and Shleifer (2001) have arguedthat government regulation of trading rules and financial intermediaries could sub-stitute for commercial law in countries where property rights are poorly definedand enforced. In terms of regulation of intermediaries, Ukraine is well behindadvanced market economies and its more advanced transitioning neighbors. TheUkrainian Securities and Exchange Commission, established as an independentgovernment body in 1995, sets and enforces regulations for intermediaries andtrading rules. The existing regulations take a laissez-faire approach to individualbrokers, brokerage companies, and investment funds licensed by the commission.The existing rules do not require “fair” practice or that intermediaries act in theinterests of their clients. Securities can be traded outside the control of the stockexchange. There is no provision that would ensure a uniform price for the samesecurities at the same time or wide distribution of information about securitiesprices. Nor is there a regulation that would ban the fixing of securities prices.
According to a Global Competitiveness Report survey (World EconomicForum, 1997 and 1999), business executives ranked Ukraine close to the bottomof the list of nations when they were asked the question: “Are government regula-tions precise and fully enforced?” A similar rating was achieved on the question
Alexander Pivovarsky
16
3The EBRD index of extensiveness equals 1 if legal rules are very limited in scope, 2 if legal rulesare limited in scope and may be the subject of conflicting interpretations, 3 if amended legislation hasrecently been enacted in at least two of the three areas (pledge, bankruptcy, and company law), 4 if com-prehensive legislation exists in at least two of the three areas, and 4+ if comprehensive legislation existsin all three areas and legal rules approach those of more developed countries. The index of effectivenessof legal rules equals 1 if commercial rules are usually very unclear and contradictory and law enforcementis rudimentary, 2 if commercial rules are generally unclear and sometimes contradictory and there are fewmeaningful procedures in place in order to make commercial laws operational and enforceable, 3 if com-mercial rules are reasonably clear but are not fully enforced by the court system, 4 if commercial law isreasonably clear and administration and judicial support of the law is reasonably adequate, and 4+ if com-mercial laws are clear and readily ascertainable.
4The score is accompanied by the following explanation: “Although its new constitution legally protectsprivate property, Ukraine has not yet fully established a legal system that sufficiently enforces the laws thatprotect it. But recent government reforms in the judicial system are improving some courts. Some inefficien-cies remain, however. Despite an ambitious government program to privatize large sectors of the economy,property remains subject to government expropriation” (Johnson, Holmes, and Kirkpatrick, 1998, p. 447).
of whether regulation and supervision of financial institutions was among themost stringent in the world (see World Economic Forum, 1997 and 1999). In theEBRD transition indicators for the quality of securities markets and nonbankfinancial institutions, Ukraine ranked consistently close to the bottom (seeEBRD, 1997 and 1998).
In sum, the quality of institutions of shareholder and investor protection inUkraine is low by most available definitions. In capital markets that do not pro-vide an easy exit option to small shareholders and possibilities for ownership con-centration, the combination of the poor institutions of investor protection anddispersed ownership structure should lead to a control vacuum and related corpo-rate governance problems. My main hypothesis, therefore, is that in Ukraine’sinadequate legal and regulatory environment, enterprises with greater concentra-tion of ownership should report better performance than those with dispersed own-ership structures.
There is some empirical evidence supporting my hypothesis for moreadvanced transition economies. For example, Weiss and Nikitin (1998) find thatownership concentration in the Czech Republic is associated with improvementsin the performance of companies, but only if ownership is concentrated in handsother than those of investment funds. Claessens and Djankov (1999) find that fora cross section of Czech firms, the more concentrated the ownership, the higherthe firm’s profitability and labor productivity. In contrast to the empiricalresearch done on the more advanced transition economies, this problem has notbeen addressed in the empirical research done on former Soviet republics.Nonetheless, the argument in favor of ownership concentration may be especiallyrelevant to the CIS countries. They were more likely than the more advanced tran-sition economies to adopt privatization strategies that led to dispersed post-privatization ownership structures (EBRD, 1997). Their equity markets arenontransparent and illiquid (IFC, 1999). At the same time, the legal mechanismsfor effective corporate governance in these countries are not as well developed asin the more advanced reformers of Central and Eastern Europe (Pistor and others,2000). Thus, a study of the interaction of ownership concentration and enterpriseperformance in Ukraine may explain, at least in part, the evidence that privatiza-tion was not as successful in the CIS countries as it was in the advanced transi-tion economies.
II. The Data
This study is based on financial and privatization data covering a cross section of376 medium and large enterprises. The 1998 balance sheet, financial statement,and ownership data are from a database maintained by the Ukrainian Commissionon Securities and Financial Markets (UCSFM). Starting in 1998, the commissionrequired open joint stock companies to report all shareholders with 5 percent ofequity or more. For the first time since the beginning of the privatization inUkraine, both financial data and ownership data for a significant group of mediumand large enterprises were made available. The data on the privatization history ofenterprises, including privatization flows over time and the privatization methods
OWNERSHIP CONCENTRATION AND PERFORMANCE IN UKRAINE’S ENTERPRISES
17
used, are from the database maintained by the State Property Fund of Ukraine. The combined dataset is limited to medium and large enterprises for two reasons.First, a significant majority of medium and large enterprises were transformed intoopen joint stock companies before privatization. Many of the small and mediumfirms, in particular those that insiders believed would be most attractive to outsidertakeovers, were transformed into closed joint stock companies, data on which arenot publicly available. Second, most medium and large enterprises, regardless oftheir performance, possess the organizational capacity necessary to process theirfinancial statements before supplying them to the UCSFM in an electronic format.Many small firms do not possess the same capacity. Thus, the sample would bebiased if small, open joint stock companies were included in the analysis, since theUCSFM database covers only open joint stock companies that submitted theirannual reports in the electronic format. The sample selection is determined by thevariation in the dates when enterprises submitted their reports to the UCSFM andit includes the data for enterprises whose reports were processed by the commis-sion before the end of May 2000. This type of selection should not be related tothe variables of interest for this study.
This study focuses on three measures of enterprise performance: total factorproductivity, material cost (per unit of revenue), and labor productivity. For mar-ket economies, price of shares, Tobin’s Q, and profits are appropriate measures ofenterprise performance and have been used in the literature (see, for example,Demsetz and Lehn, 1985; Shleifer and Vishny, 1986). These measures are notavailable or are simply not appropriate for the study of enterprises in the transitionenvironment. While a large number of enterprises in Ukraine have been trans-formed into corporations, most of them do not list their shares in the public mar-kets. Even when these firms’ shares are listed, their liquidity is low, so the shareprice and Tobin’s Q are not useful measures of performance. For a number of rea-sons, profitability is not a reliable measure either. Reported profits are subject tomanipulation owing to changes in accounting conventions and to tax considera-tions. The enterprises’ nonstate owners may hide profits in order to avoid taxationby the state. Recent studies found that transition economies, including Ukraine,possess shadow economies that are among the largest in the world (see, for exam-ple, Kaufmann and Kaliberda, 1996). While the historic cost of capital assets maybe sufficient to assess variation in the degree of capital intensity across enterprises,it is not a reliable measure of the value of today’s capital stock. It needs to be bornein mind that a significant share of firms’ assets was accumulated before the begin-ning of transition, when their value was based on the physical input costs of pro-ducing them rather than market prices.
Frydman and others (1997 and 1999) advocate the use of strategic (revenue-performance) and defensive (cost-performance) variables to measure enterpriserestructuring in transition economies. They argue that revenues are not only lesssubject to manipulation than profitability and other conventional measures of per-formance but also more transparent to an outside observer, more future-oriented,and more unpredictable on the basis of past history (Frydman and others, 1997,p. 10). These authors used changes in enterprise revenues over time to assess effectsof privatization on enterprise performance. Since there are no reliable time-series
Alexander Pivovarsky
18
financial data matched with the ownership data for a sufficiently large sample ofUkrainian enterprises, in this article I have identified an alternative approach tostudying cross-enterprise variation in revenue performance. Following Weiss andNikitin (1998), I use an approximation of total factor productivity, or Solow resid-ual, as a measure of enterprise revenue performance. To generate this variable, Iassume that all enterprises employ a Cobb-Douglas production function and esti-mate the following equation:
Ln (sales revenue in 1998)i = Constant + a ln Ki + b ln Li + ti (1)
where ln Ki is a logarithm of the value of enterprise balance assets, ln Li is a log-arithm of the enterprise number of employees, and ti is an approximation of totalfactor productivity. From this equation, I estimate ti for each firm by subtractingpredicted value of Ln (sales revenue in 1998)i from the logarithm of the actualvalue of the 1998 sales revenues.5 Given the highly simplifying assumptions madeto derive this variable, and owing to the concerns with the quality of the capitalasset data, statistical results involving total factor productivity should be inter-preted with caution.
To study the cross-firm variation in performance on the cost side, I focus onthe ratio of the cost of material inputs to sales revenues—a variable that reflectswell the managers’ efforts to reduce variable input costs. Socialist enterprises fre-quently hoarded material inputs, regardless of such a policy’s impact on their bal-ance sheets. One of the objectives of privatization was to reduce managers’incentives to hoard material inputs and to rationalize their utilization. The cost ofmaterial inputs may also, in part, reflect the managers’ ability to use transfer-pricing schemes to siphon off some of their firms’ revenues into affiliated firms. Iwould expect that the owners who are more capable of controlling such manage-rial behavior achieve better material cost performance.
Finally, I use sales revenues per employee (or labor productivity), a variablethat reflects both revenue performance and labor cost performance. The advan-tage of this variable is that its derivation does not involve the value of enterprisecapital or other variables that may be subject to manipulation or historic valua-tion problems. In addition, this variable reflects the enterprise manager’s abilityto trim the labor force to the minimum level necessary for the efficient function-ing of the enterprise.
I focus on two measures of nonstate ownership concentration: first, the sum ofownership stakes held by the top 10 reported nonstate owners (T10NS) and, second,
OWNERSHIP CONCENTRATION AND PERFORMANCE IN UKRAINE’S ENTERPRISES
19
5My derivation of the approximation of the total-factor-productivity variable is based on several sim-plifying assumptions. First, I assume that all enterprises employ the same production function. Second,I assume that all enterprises pay the same wages to labor and rents on capital. Finally, I assume that theoutput price per unit is the same across all enterprises in the sample. Only output volume varies acrossenterprises along with the variation in the volumes of inputs and enterprise-specific total factor produc-tivity. Given these assumptions, the constant in the equation (1) includes a log transformation of the unitoutput price. The predicted value of ln (sales revenue in 1998)i,predicted is derived by adding the constantand the enterprise-specific values of a ln Ki and b ln Li, and, thus, leaving the total-factor-productivityapproximation ti out. From here, ti is derived by subtracting ln (sales revenue in 1998)i,predicted from ln (sales revenue in 1998)i,actual.
a Herfindahl index of ownership concentration derived as a sum of squared valuesof ownership stakes held by each of the top 10 significant owners and divided by100 (HT10NS).
Before I turn to empirical analysis, let me add a few more words about thesample enterprises. The vast majority of enterprises included in the sample did notbegin privatization before the end of 1994. By the end of 1998, the year of inter-est for this study, 138 of the 376 enterprises were 100 percent privatized while therest were at different stages of the privatization process. Another 145 enterpriseswere more than 50 percent privatized, a status at which nonstate owners couldexercise effective control over them. The enterprises in the sample with largernumbers of employees were less privatized than the smaller ones. This is repre-sentative of the situation in the economy as a whole. The sample includes a broadrange of firms by industry, reflecting the structure of the Ukrainian economybefore privatization. For instance, capital goods, construction, and basicindustries—the industries favored by the socialist-era planners—together consti-tute almost 50 percent of all firms in the sample. The services, leisure, andfinance/real estate industries—the industries underdeveloped in the socialist era—represent a small fraction of the sample.
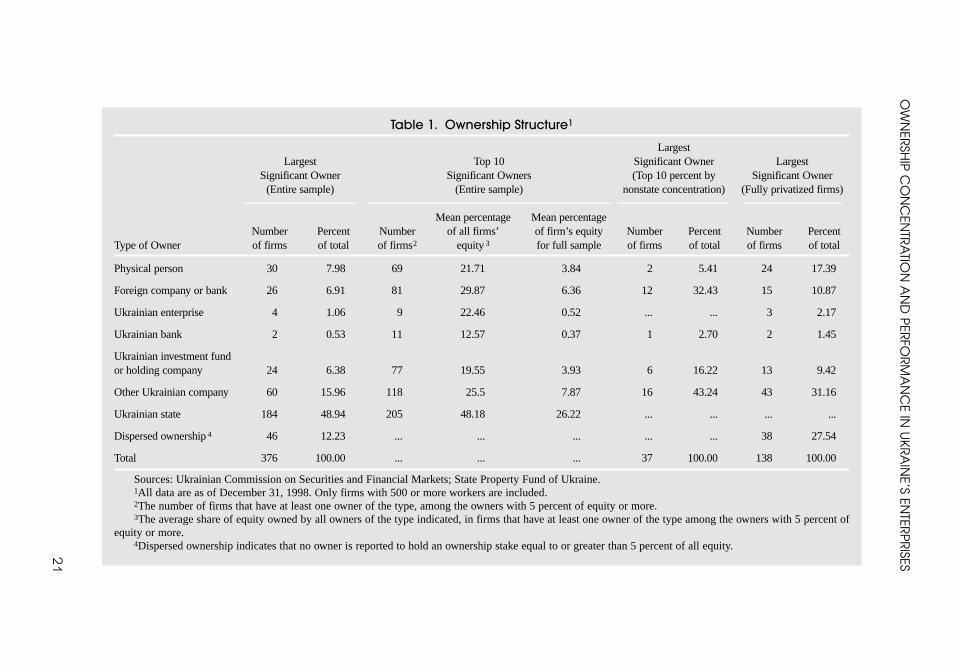
The enterprises included in the sample represent a diverse group in terms oftheir reported ownership structures at the end of 1998 (summarized in Table 1). Ofthe whole sample of 376 enterprises, 184 have the state as the largest significantowner of shares. The next largest group includes enterprises with other Ukrainiancompanies as the largest significant owners. In most cases, these are limited-liability companies established in the process of privatization with the primaryobjective of hiding the identity of significant owners. The third largest group, of46 enterprises, includes enterprises with no reported significant owners. “Physicalpersons” are the largest significant owners of 30 enterprises in the sample. Foreigncompanies and banks are the largest owners of 26 enterprises. The rest of theenterprises have Ukrainian investment funds and nonstate holding companies,Ukrainian enterprises-producers (that is, Ukrainian manufacturing enterprises),and Ukrainian banks as the largest significant owners.
Table 1 also summarizes the numbers of firms in the sample that have eachtype of owner, among the top 10 significant owners, and also the mean percentageof equity owned by each type of owner when such an owner is present. The meanvalue is highest when the largest owner is the state. On average, if the state isamong an enterprise’s top 10 owners, it controls 48.18 percent of all equity. Forthe nonstate significant owners, the sum of ownership stakes ranges between12.57 percent for Ukrainian banks and 22.46 percent for Ukrainian enterprises.For the top 10 percent of firms measured by the size of the T10NS variable, thelargest ownership stakes are most likely to be held, first, by other Ukrainian com-panies and, second, by foreign companies and banks. For fully privatized firms,other Ukrainian companies are the largest significant shareholders (31.16 percentof the fully privatized firms in the sample). For this subsample, the physicalperson and foreign company/bank rank second and third (17.39 percent and10.87 percent, respectively).
Alexander Pivovarsky
20
OW
NER
SHIP
CO
NC
ENTR
ATIO
NA
ND
PER
FOR
MA
NC
E IN U
KR
AIN
E’S ENTER
PR
ISES
21
Table 1. Ownership Structure1
Largest Largest Top 10 Significant Owner Largest
Significant Owner Significant Owners (Top 10 percent by Significant Owner(Entire sample) (Entire sample) nonstate concentration) (Fully privatized firms)
————————— ———————————————————— ————————— ————————Mean percentage Mean percentage
Number Percent Number of all firms’ of firm’s equity Number Percent Number Percent Type of Owner of firms of total of firms2 equity 3 for full sample of firms of total of firms of total
Physical person 30 7.98 69 21.71 3.84 2 5.41 24 17.39
Foreign company or bank 26 6.91 81 29.87 6.36 12 32.43 15 10.87
Ukrainian enterprise 4 1.06 9 22.46 0.52 ... ... 3 2.17
Ukrainian bank 2 0.53 11 12.57 0.37 1 2.70 2 1.45
Ukrainian investment fundor holding company 24 6.38 77 19.55 3.93 6 16.22 13 9.42
Other Ukrainian company 60 15.96 118 25.5 7.87 16 43.24 43 31.16
Ukrainian state 184 48.94 205 48.18 26.22 ... ... ... ...
Dispersed ownership 4 46 12.23 ... ... ... ... ... 38 27.54
Total 376 100.00 ... ... ... 37 100.00 138 100.00
Sources: Ukrainian Commission on Securities and Financial Markets; State Property Fund of Ukraine.1All data are as of December 31, 1998. Only firms with 500 or more workers are included.2The number of firms that have at least one owner of the type, among the owners with 5 percent of equity or more.3The average share of equity owned by all owners of the type indicated, in firms that have at least one owner of the type among the owners with 5 percent of
equity or more.4Dispersed ownership indicates that no owner is reported to hold an ownership stake equal to or greater than 5 percent of all equity.

III. OLS Estimates of Ownership Concentration and Enterprise Performance
The basic evidence on the relationship between ownership concentration andenterprise performance comes from the cross-section regressions of the followingform:
yi = µ + α Ri + γXi + εi, (2)
where yi is a measure of enterprise performance for enterprise i, Ri is a measure ofownership concentration, Xi is a vector of industry dummies and other covariates,and εi is a random error term.
The key coefficient of interest for this analysis is α, or the effect of nonstateownership concentration on enterprise performance. The coefficient is expected tohave a positive sign in the regressions on the total factor productivity estimate andlabor productivity and a negative sign in the regressions on material cost (per unitof revenue).
In previous literature, it has been hypothesized that the effect of ownershipconcentration on firm performance may depend on the size of individual owner-ship stakes. Previous authors have used either a linear combination of ownershipstakes held by a group of large shareholders (top 5, top 10, or top 20) or a trans-formation of such combination that would give greater weight to large individualownership stakes (Demsetz and Lehn, 1985; Weiss and Nikitin, 1998; andClaessens and Djankov, 1999). This article’s objective is to investigate whetherownership concentration has an effect on performance and not to test the alterna-tive theories on the functional form of this relationship. Given this, all empiricalmodels will be estimated for both types of ownership concentration indices—linear (T10NS) and Herfindahl (HT10NS). I will expect similar empirical resultsfrom these two measures of concentration, given their high degree of correlation.(The correlation coefficient is 0.78.)
Columns 1, 4, and 7 in Table 2 present the basic regression results for theT10NS measure of ownership concentration and columns 1, 4, and 7 in Table 3, forHT10NS. All regressions include a set of industry dummies, and regressions ofcost performance and labor productivity also include a logarithm of the capital-labor ratio to control for variation in capital intensity across firms. The empiricalevidence reveals that the higher the ownership concentration, the higher the totalfactor productivity and labor productivity and the lower the material cost (per unitof revenue). The coefficients on the ownership concentration variables have thepredicted signs and are statistically significant at the 90 percent level and higherfor all specifications.
For the basic regression specification, the coefficient α should be interpretedas a marginal effect on enterprise performance of ownership concentration vis-à-vis dispersed nonstate ownership and state ownership of equity. From a theoreti-cal point of view, it might be appropriate to group together state ownership anddispersed nonstate ownership. The agency problems of dispersed private owner-ship are also inherent in state ownership if one accepts the premise that the modern
Alexander Pivovarsky
22
OW
NER
SHIP
CO
NC
ENTR
ATIO
NA
ND
PER
FOR
MA
NC
E IN U
KR
AIN
E’S ENTER
PR
ISES
23
Table 2. OLS Regression of Enterprise Performance on Linear Index of Ownership Concentration
Total Factor Material Input Cost Productivity Estimate per Unit of Revenue Labor Productivity
—————————————— ————————————— —————————————Full Full Sample PR98> Full Full Sample PR98> Full Full Sample PR98 >
Independent Variables sample sample 50 percent sample sample 50 percent sample sample 50 percent(1) (2) (3) (4) (5) (6) (7) (8) (9)
Ownership concentration (T10NS) 0.0056* 0.0047** 0.0034*** –0.0022* –0.0025* –0.0025* 0.11** 0.12** 0.12**
(0.0018) (0.0019) (0.0019) (0.0008) (0.00085) (0.0009) (0.047) (0.049) (0.48)
Dummy for state share 25.1–50 percent –0.099 –0.0025 –4.92(0.13) (0.056) (3.24)
Dummy for state share 50.1–100 percent –0.21*** –0.056 0.33(0.12) (0.52) (2.99)
Log (Balance assets/Number of employees) 0.0014 0.0063 –0.029 8.69* 8.63* 8.55*
(0.030) (0.30) (0.35) (1.73) (1.75) (1.84)
Industry dummies included yes yes yes yes yes yes yes yes yes
Observations 374 374 280 374 374 280 374 374 280
R-squared 0.31 0.31 0.32 0.18 0.18 0.21 0.40 0.41 0.40
Sources: Ukrainian Commission on Securities and Financial Markets; State Property Fund of Ukraine.Notes: OLS denotes ordinary least squares. Standard errors are shown in parentheses.* indicates coefficient is significantly different from zero at the 1 percent level of confidence.** indicates coefficient is significantly different from zero at the 5 percent level of confidence.*** indicates coefficient is significantly different from zero at the 10 percent level of confidence.Sample PR98>50 percent indicates that only enterprises with more than 50 percent of equity privatized as of the end of 1998 were included in the regressions.
Ale
xan
de
r Pivo
varsky
24
Table 3. OLS Regression of Enterprise Performance on Herfindahl Index of Ownership Concentration
Total Factor Material Input Cost Productivity Estimate per Unit of Revenue Labor Productivity
—————————————— ————————————— —————————————Full Full Sample PR98> Full Full Sample PR98> Full Full Sample PR98 >
Independent Variables sample sample 50 percent sample sample 50 percent sample sample 50 percent(1) (2) (3) (4) (5) (6) (7) (8) (9)
Ownership concentration (HT10NS) 0.012* 0.0099** 0.0086*** –0.0037*** –0.0041*** –0.0032 0.30** 0.31** 0.32*
(0.0046) (0.0047) (0.0044) (0.0021) (0.0021) (0.0021) (0.12) (0.12) (0.11)
Dummy for state share 25.1–50 percent –0.10 0.00052 –4.97(0.13) (0.056) (3.24)
Dummy for state share 50.1–100 percent –0.24** –0.03 –0.21(0.12) (0.051) (2.92)
Log (Balance assets/Number of employees) –0.0016 –0.041 8.55* 8.54* 8.45*
(0.03) (0.035) (1.73) (1.75) (1.82)
Industry dummies included yes yes yes yes yes yes yes yes yes
Observations 374 374 280 374 374 280 374 374 280
R-squared 0.30 0.31 0.32 0.17 0.17 0.20 0.40 0.41 0.40
Sources: Ukrainian Commission on Securities and Financial Markets; State Property Fund of Ukraine.Notes: OLS denotes ordinary least squares. Standard errors are shown in parentheses.* indicates coefficient is significantly different from zero at the 1 percent level of confidence.** indicates coefficient is significantly different from zero at the 5 percent level of confidence.*** indicates coefficient is significantly different from zero at the 10 percent level of confidence.Sample PR98>50 percent indicates that only enterprises with more than 50 percent of equity privatized as of the end of 1998 were included in the regressions.
state closely resembles a corporation with a dispersed ownership structure. Animportant empirical problem that is not addressed by this approach is how enter-prises were selected for privatization. It is possible that the timing of privatizationwas, in fact, endogenous to enterprise performance and that the state retained own-ership in either the worst or the best enterprises. In order to control for this, I intro-duce dummies for two levels of significant state ownership (the controlling stakeand the blocking stake) into the basic specification (reported in columns 2, 5, and8 of Tables 2 and 3) and also undertake regressions for the sample limited to firmswith controlling stakes privatized (reported in columns 3, 6, and 9 of Tables 2and 3). With both types of control, the coefficients on ownership concentration donot change dramatically and remain statistically significant at the 90 percent levelor higher in five of the six cases. The only exception is the coefficient on HT10NSfor the material input cost per employee when the sample is limited to enterpriseswith controlling stakes privatized as of 1998 (Table 3, column 6). Even in thiscase, the coefficient has the predicted sign and a p-value of 14 percent. The rela-tionship between ownership concentration and performance is significant in eco-nomic terms. The ordinary-least-squares (OLS) regression estimate implies that a10 percent increase in ownership concentration variable T10NS leads to a 5.6 per-cent change in the total factor productivity estimate. These regressions show thata similar increase in ownership concentration would lead to a 2.2 percent declinein the material input cost (per unit of revenue). An increase in ownership concen-tration from the median value of the linear ownership concentration index(15.2 percent) to the seventy-fifth percentile value (42.79 percent) would be associ-ated with an increase in revenue per employee of 8,277 Ukrainian hryvnias (or morethan 30 percent of the mean value of sales per employee for the whole sample).
In the regressions described so far, all nonstate concentrated owners weretreated as a group and no distinction was made between the types of owners. Thetheoretical literature and empirical evidence for other countries suggest that not allconcentrated investors are alike in their ability to establish effective enterprisegovernance. This is particularly the case when authors compare the ownershipeffects of domestic and foreign strategic investors. Thus, Claessens and Djankov(1999) find that ownership concentration by foreign investors has a positive effecton enterprise profitability in the Czech Republic. Frydman and others (1999) alsofind that foreign investors perform better than domestic investors as owners afterprivatization in the Czech Republic, Hungary, and Poland. Another reason not tolump all owners together is that some types of domestic owners themselves havedispersed ownership structures and suffer from governance problems similar tothose of the enterprises they own. For instance, investment funds, which them-selves possess a dispersed ownership structure, succeeded in gaining significantownership stakes in many Ukrainian enterprises during privatization. Previousauthors have found that investment funds perform poorly as owners (Weiss andNikitin, 1998; Claessens and Djankov, 1999). To explore the effects of differenttypes of concentrated owners, I differentiate among three types of nonstate signif-icant owners: (a) Ukrainian investment funds and nonstate holding companies,(b) other Ukrainian nonstate owners, and (c) foreign companies and banks. For each of the three ownership types, the ownership concentration variables
OWNERSHIP CONCENTRATION AND PERFORMANCE IN UKRAINE’S ENTERPRISES
25
(T10NSINF, T10NSDOM, and T10NSFOR) are simple sums of each of the speci-fied owners among the top 10 nonstate significant owners. The coefficients oneach of these variables should be interpreted as marginal effects of ownership con-centration by each of the three types of owner on enterprise performance vis-à-visthe state and dispersed owners.
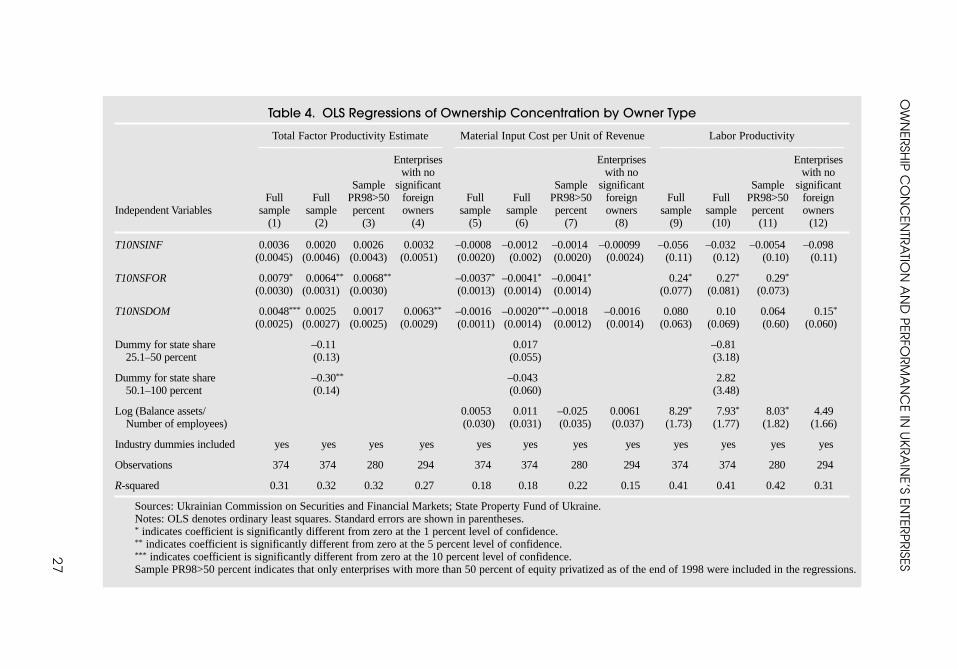
The results of empirical tests by ownership type are reported in Table 4. For allregression specifications, the coefficients on ownership concentration by Ukrainianinvestment funds and nonstate holding companies are statistically insignificant andhave a negative sign for the labor productivity variable. This is consistent with thefindings in the empirical literature for other countries and also with the theory onthe role of ownership concentration in countries with poor institutions of investorprotection. Since the investment funds have dispersed ownership structures, theysuffer from agency problems similar to those of the enterprises they own. The con-centrated ownership by foreign companies and banks has a strong positive effect onenterprise performance for all measures of performance and in all regression spec-ifications. The coefficients are larger in absolute terms than the coefficients fromregressions using the T10NS concentration variable (which did not differentiatebetween the owner types). The concentration effects of other domestic significantnonstate owners carry the predicted signs, but the coefficients’ statistical signifi-cance varies, depending on the sample specification or the inclusion of additionalcontrol variables in the regression equations. It is possible that foreign owners tar-geted better-quality enterprises during and after privatization. If the concentrationeffects were exclusively due to this type of selection, this would undermine myargument about the role of ownership concentration on enterprise performance.Since I could not test directly for this possibility, I tried limiting the sample to firmsthat did not have foreign owners among the top 10 significant nonstate owners. Forthis sample, the coefficients have the predicted signs and are statistically significantfor the total factor productivity estimate and for labor productivity. The coefficienthas the predicted sign but is not statistically significant at an acceptable level inregressions for material cost (per unit of revenue). Thus, while I cannot completelyrule out the possibility of selection of enterprises by foreign owners, these testsreveal that the ownership concentration effects are not exclusively due to ownershipconcentration by foreign owners.
Overall, the cross-section regressions reveal that ownership concentration hasa positive association with performance of medium and large enterprises inUkraine. It also reveals that among the three groups of significant owners, con-centrated ownership by foreign companies and banks is associated consistentlywith better performance for all measures of performance. Ownership concentra-tion by domestic owners other than the investment and holding companies has apositive, but less robust effect on performance. This is possibly due to the greatermeasurement error for the ownership concentration variable for domestic concen-trated owners than for foreign owners. Finally, concentrated ownership byUkrainian investment funds and nonstate holding companies does not have a sta-tistically significant effect on performance.
One has to be cautious when interpreting the results of such cross-sectionregressions. It is possible that quality of enterprises determined their ownership
Alexander Pivovarsky
26
OW
NER
SHIP
CO
NC
ENTR
ATIO
NA
ND
PER
FOR
MA
NC
E IN U
KR
AIN
E’S ENTER
PR
ISES
27
Table 4. OLS Regressions of Ownership Concentration by Owner Type
Total Factor Productivity Estimate Material Input Cost per Unit of Revenue Labor Productivity——————————————— ———————————————— ———————————————
Enterprises Enterprises Enterpriseswith no with no with no
Sample significant Sample significant Sample significantFull Full PR98>50 foreign Full Full PR98>50 foreign Full Full PR98>50 foreign
Independent Variables sample sample percent owners sample sample percent owners sample sample percent owners(1) (2) (3) (4) (5) (6) (7) (8) (9) (10) (11) (12)
T10NSINF 0.0036 0.0020 0.0026 0.0032 –0.0008 –0.0012 –0.0014 –0.00099 –0.056 –0.032 –0.0054 –0.098(0.0045) (0.0046) (0.0043) (0.0051) (0.0020) (0.002) (0.0020) (0.0024) (0.11) (0.12) (0.10) (0.11)
T10NSFOR 0.0079* 0.0064** 0.0068** –0.0037* –0.0041* –0.0041* 0.24* 0.27* 0.29*
(0.0030) (0.0031) (0.0030) (0.0013) (0.0014) (0.0014) (0.077) (0.081) (0.073)
T10NSDOM 0.0048*** 0.0025 0.0017 0.0063** –0.0016 –0.0020*** –0.0018 –0.0016 0.080 0.10 0.064 0.15*
(0.0025) (0.0027) (0.0025) (0.0029) (0.0011) (0.0014) (0.0012) (0.0014) (0.063) (0.069) (0.60) (0.060)
Dummy for state share –0.11 0.017 –0.8125.1–50 percent (0.13) (0.055) (3.18)
Dummy for state share –0.30** –0.043 2.8250.1–100 percent (0.14) (0.060) (3.48)
Log (Balance assets/ 0.0053 0.011 –0.025 0.0061 8.29* 7.93* 8.03* 4.49Number of employees) (0.030) (0.031) (0.035) (0.037) (1.73) (1.77) (1.82) (1.66)
Industry dummies included yes yes yes yes yes yes yes yes yes yes yes yes
Observations 374 374 280 294 374 374 280 294 374 374 280 294
R-squared 0.31 0.32 0.32 0.27 0.18 0.18 0.22 0.15 0.41 0.41 0.42 0.31
Sources: Ukrainian Commission on Securities and Financial Markets; State Property Fund of Ukraine.Notes: OLS denotes ordinary least squares. Standard errors are shown in parentheses.* indicates coefficient is significantly different from zero at the 1 percent level of confidence.** indicates coefficient is significantly different from zero at the 5 percent level of confidence.*** indicates coefficient is significantly different from zero at the 10 percent level of confidence.Sample PR98>50 percent indicates that only enterprises with more than 50 percent of equity privatized as of the end of 1998 were included in the regressions.
structures and, thus, the causality goes in the direction opposite from that hypoth-esized in this study. In order to address this problem, the next section will explorean instrumental variable approach that uses equity shares privatized by differentprivatization methods as instruments for ownership concentration during theperiod of interest for this study.
IV. Privatization Methods as Determinants of Ownership Concentration
The cross-section regressions presented in the previous section may suffer from areverse causality problem. It is possible that ownership in better enterprises wasconcentrated at the time of privatization or that they were more likely targets for apost-privatization concentration. Previous authors used panel data analysis(Frydman and others, 1999) or a difference-in-difference technique (La Porta andLopez-de-Silanes, 1999) to address the problems of selection in the process of pri-vatization. Given that no time-series, enterprise-level performance data corre-sponding to the ownership concentration data are available in Ukraine, I have usedshares of enterprise equity privatized by different privatization methods as instru-ments for current ownership concentration.
The privatization process in Ukraine has been an outcome of the interactionof political forces and was, to a significant extent, controlled by enterprise insid-ers. Workers’ collectives and management were granted a major role in the designand implementation of privatization plans for their enterprises. Even beforeUkraine’s independence in 1991, insiders as a group were allowed to lease theirenterprises, and, later on, they were allowed to transform leases into buyoutarrangements. There is evidence that workers’ collectives of enterprises that wereperceived to have good chances of profitable operation opted for lease arrange-ments early on and subsequently privatized better-quality enterprises (Kyryliukand Leshchenko, 2000).
From the point of view of insiders seeking to preserve control over their enter-prises, the privatization mechanisms had the following hierarchy: insider privati-zation was most preferable, dispersed outsider privatization was next mostpreferable, and privatization by concentrated outsiders least preferable. Given theequity considerations traditional in Ukraine’s socialist society, outright concentra-tion of ownership by the insiders was not politically acceptable. Enterprise man-agers often had to disguise themselves as outsiders by establishing proxy legalentities that would participate in the privatization auctions. Thus, the methodsmost preferred by the insiders that were also feasible from the equity point of viewled to dispersion of the initial post-privatization ownership. The next-best privati-zation methods from the insiders’ point of view were mass privatization methodsinvolving the issuance of privatization vouchers. For a given enterprise, only afterthe insiders’ rights for equity privatization had been satisfied and privatizationvoucher allocations had been made were relatively concentrated equity stakesoffered for privatization. This changed in 1999, when the government, interestedin generating additional budgetary revenues, shifted privatization efforts to meth-
Alexander Pivovarsky
28
ods involving the sale of concentrated equity stakes. This new stage of privatiza-tion is outside the scope of the present study.
The early observers of transition anticipated that once property rights wereproperly defined, the ownership of equity in privatized enterprises would be real-located to the most effective users. This conclusion was based on a simplifyingassumption about the nature of capital markets in, and did not take into accountthe realities of, transitional economies. Given the high transaction costs and infor-mational asymmetries of Ukrainian capital markets, the initial ownership structurehas been sustained over time and, thus, the privatization methods used have deter-mined, in large part, the enterprise ownership structure, even several years afterprivatization. If this is indeed the case, we can use proportions of equity privatizedby different privatization methods as instruments for ownership concentration inthe regressions on enterprise performance. Schematically, my story can be sum-marized as follows:
choice of privatization methods ⇒ initial post-privatization ownershipconcentration ⇒ present ownership concentration ⇒ current performance.
Let us review in some detail the eight proposed instrumental variables that areproportions of equity privatized by all of the privatization methods defined byUkrainian law. The data on privatization methods used is from the State PropertyFund database. The sample summary statistics for the proportions of equity priva-tized by each of the methods as of the end of 1998 are provided in Table 5.
The first method—distribution of the tenant association property or sharesaccumulated by the tenant associations engaged in lease-with-buyoutprocedures—was used to privatize a significant number of enterprises and affectedthe post-privatization ownership structure to a large degree. By 1991, thousands offirms operated under such lease agreements. In April 1992, the Ukrainian parlia-ment passed a law allowing enterprise insiders with lease agreements to acquireequity in leased firms in exchange for profits generated by the enterprise and paidto the state (Law on Leasing of Property of State Enterprises and Organizations).As a result, insiders in a large number of primarily small and medium enterprisessucceeded in formally privatizing all of their enterprises’ assets by the end of 1992.Since valuation of enterprise assets did not keep pace with inflation (and, thus,with the valuation of profits), insiders could acquire enterprises quickly and with-out significant cash outlays. The ownership stakes in these enterprises were dis-tributed among employees based on their positions and seniority in the enterprises.Only in very small enterprises could individuals receive significant ownershipstakes. This method was phased out in 1995, when the government shifted itsprivatization efforts to methods that involved the issuance and transfer of securi-ties. For the whole sample, just over 14 percent of total equity was privatized usingthe first method.
The second method—equity transfer on preferential terms—involved sharetransfers to enterprise employees and limited categories of outsiders. Using priva-tization certificates and cash, each current and former employee, as well as limitedadditional categories of citizens (such as distinguished veterans of World War II),could acquire from the state shares with a nominal value equivalent to 150 percent
OWNERSHIP CONCENTRATION AND PERFORMANCE IN UKRAINE’S ENTERPRISES
29
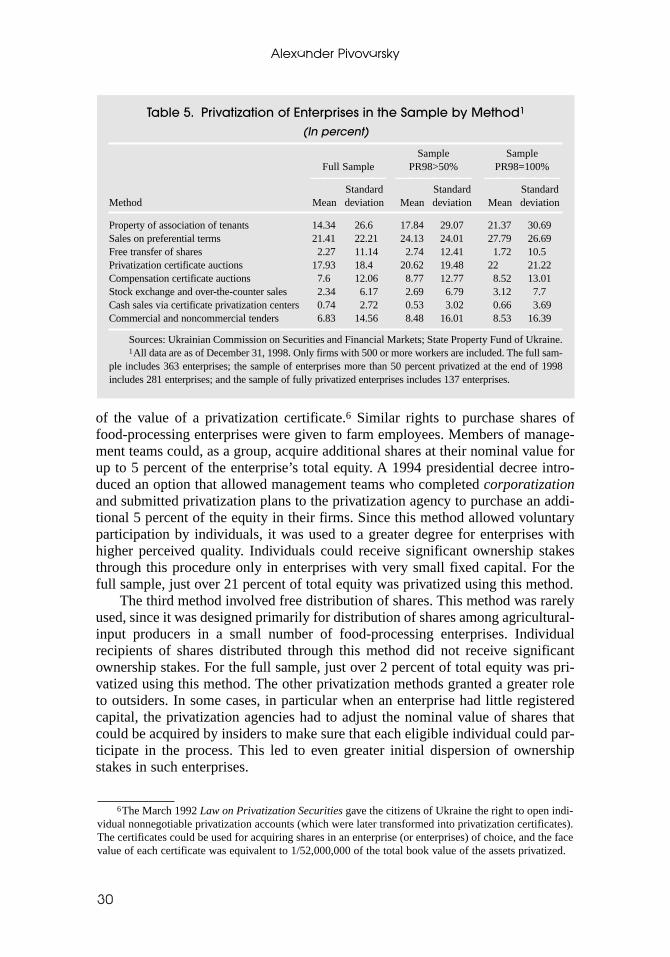
of the value of a privatization certificate.6 Similar rights to purchase shares offood-processing enterprises were given to farm employees. Members of manage-ment teams could, as a group, acquire additional shares at their nominal value forup to 5 percent of the enterprise’s total equity. A 1994 presidential decree intro-duced an option that allowed management teams who completed corporatizationand submitted privatization plans to the privatization agency to purchase an addi-tional 5 percent of the equity in their firms. Since this method allowed voluntaryparticipation by individuals, it was used to a greater degree for enterprises withhigher perceived quality. Individuals could receive significant ownership stakesthrough this procedure only in enterprises with very small fixed capital. For thefull sample, just over 21 percent of total equity was privatized using this method.
The third method involved free distribution of shares. This method was rarelyused, since it was designed primarily for distribution of shares among agricultural-input producers in a small number of food-processing enterprises. Individualrecipients of shares distributed through this method did not receive significantownership stakes. For the full sample, just over 2 percent of total equity was pri-vatized using this method. The other privatization methods granted a greater roleto outsiders. In some cases, in particular when an enterprise had little registeredcapital, the privatization agencies had to adjust the nominal value of shares thatcould be acquired by insiders to make sure that each eligible individual could par-ticipate in the process. This led to even greater initial dispersion of ownershipstakes in such enterprises.
Alexander Pivovarsky
30
Table 5. Privatization of Enterprises in the Sample by Method1
(In percent)
Sample Sample Full Sample PR98>50% PR98=100%
—————— —————— ——————Standard Standard Standard
Method Mean deviation Mean deviation Mean deviation
Property of association of tenants 14.34 26.6 17.84 29.07 21.37 30.69Sales on preferential terms 21.41 22.21 24.13 24.01 27.79 26.69Free transfer of shares 2.27 11.14 2.74 12.41 1.72 10.5Privatization certificate auctions 17.93 18.4 20.62 19.48 22 21.22Compensation certificate auctions 7.6 12.06 8.77 12.77 8.52 13.01Stock exchange and over-the-counter sales 2.34 6.17 2.69 6.79 3.12 7.7Cash sales via certificate privatization centers 0.74 2.72 0.53 3.02 0.66 3.69Commercial and noncommercial tenders 6.83 14.56 8.48 16.01 8.53 16.39
Sources: Ukrainian Commission on Securities and Financial Markets; State Property Fund of Ukraine.1All data are as of December 31, 1998. Only firms with 500 or more workers are included. The full sam-
ple includes 363 enterprises; the sample of enterprises more than 50 percent privatized at the end of 1998includes 281 enterprises; and the sample of fully privatized enterprises includes 137 enterprises.
6The March 1992 Law on Privatization Securities gave the citizens of Ukraine the right to open indi-vidual nonnegotiable privatization accounts (which were later transformed into privatization certificates).The certificates could be used for acquiring shares in an enterprise (or enterprises) of choice, and the facevalue of each certificate was equivalent to 1/52,000,000 of the total book value of the assets privatized.
The fourth method—privatization at the privatization certificate auctions—was employed to privatize large ownership stakes in a significant majority ofmedium-sized and large enterprises in exchange for privatization certificates. Thelaw envisioned the creation of two types of intermediaries—investment trusts andinvestment companies—that could handle transactions with privatization certifi-cates. Investment trusts were designed to assist individual holders of privatizationcertificates in the acquisition of shares in individual enterprises. Investment com-panies issued their own shares in exchange for privatization certificates.Accumulated certificates were used to purchase shares in enterprises offered forprivatization. Since privatization certificates were nontransferable, and each citi-zen was issued certificates equivalent in value to a small fraction of the total equitybeing privatized, only licensed financial intermediaries were allowed to bid forsignificant share packages. The law regulating financial intermediaries limited theshare of the total capital under the intermediary’s management that could be allo-cated for shares in a single enterprise, thus limiting further the opportunities forconcentration. For the full sample, about 18 percent of total equity was privatizedusing this method.
The fifth privatization method—privatization auctions for compensationcertificates—was introduced in 1994. These certificates were securities issued toindividuals whose deposits in the State Savings Bank and state insurance systemwere devalued after the 1992 price liberalization. Like privatization certificates,these securities could be used in the privatization auctions to bid at their face valuefor equity in enterprises being privatized. In contrast to the privatization certifi-cates, compensation certificates were tradable, and so enterprise insiders and out-siders were allowed to purchase significant stakes using this privatization method.Since no liquid market for compensation certificates emerged, broadly held inter-mediaries remained the only realistic actors in the market for significant owner-ship stakes at the compensation certificate auctions. For the full sample, just over7 percent of total equity was privatized using this method.
The sixth method involved cash sales via the organized stock exchanges orover-the-counter market and could lead to the creation of relatively concentratedstakes by financial intermediaries, managers, and outsiders. A legal provision stip-ulating that individuals purchasing significant ownership stakes must declare thesources of their income complicated participation of physical entities in biddingfor shares. As a result, as anecdotal evidence shows, individuals chose to hidebehind newly created legal entities (primarily limited partnerships) when purchas-ing shares. For the full sample, just over 2 percent of total equity was privatizedusing this method.
The seventh method—cash privatization via certificate privatization centers—was similar to the previous method, with the only difference being the auctions’location. These methods were used relatively rarely during the privatization—forthe full sample, less than 1 percent of total equity was privatized using thismethod.
The eighth method involved transfer of shares via commercial or noncom-mercial tenders. Participants in the noncommercial tenders had to present businessplans but did not need to make any cash or privatization securities payments to the
OWNERSHIP CONCENTRATION AND PERFORMANCE IN UKRAINE’S ENTERPRISES
31
state, and the winners received share packages sufficient to ensure their businessplans would be approved by the enterprises’ boards of directors. The businessplans were expected to lay out strategies that would increase enterprise employ-ment or, at least, keep employment constant. Most of the time, labor collectiveswon these noncommercial tenders, thus increasing the proportion of shares thatcould be allocated among insiders, and the government rarely followed up onwhether the business plans were fulfilled. The commercial tenders were auctionsin which the highest bidders were given a chance to buy shares from the state witha combination of cash and privatization and compensation certificates. Thus, theytended to allow insiders and, in some cases, outsiders to gain control of shares inaddition to those that could be acquired using the other methods. This method wasmore popular than cash sales, and, for the full sample, just under 7 percent of totalequity was privatized using this method.
As the previous discussion reveals, the privatization methods differed in termsof the opportunities they provided for the initial ownership concentration. Iassume that the choice of the privatization methods was exogenous to currententerprise performance and was related to current performance exclusivelythrough the methods’ effect on current ownership concentration. As in most recentprivatization programs around the world, the cash received for the share offeringsin Ukraine always went directly to the government. As a result, any post-privatization improvements in enterprise performance had to result from owner-ship structure changes rather than from new cash resources made available to theprivatized firms through the share offerings.
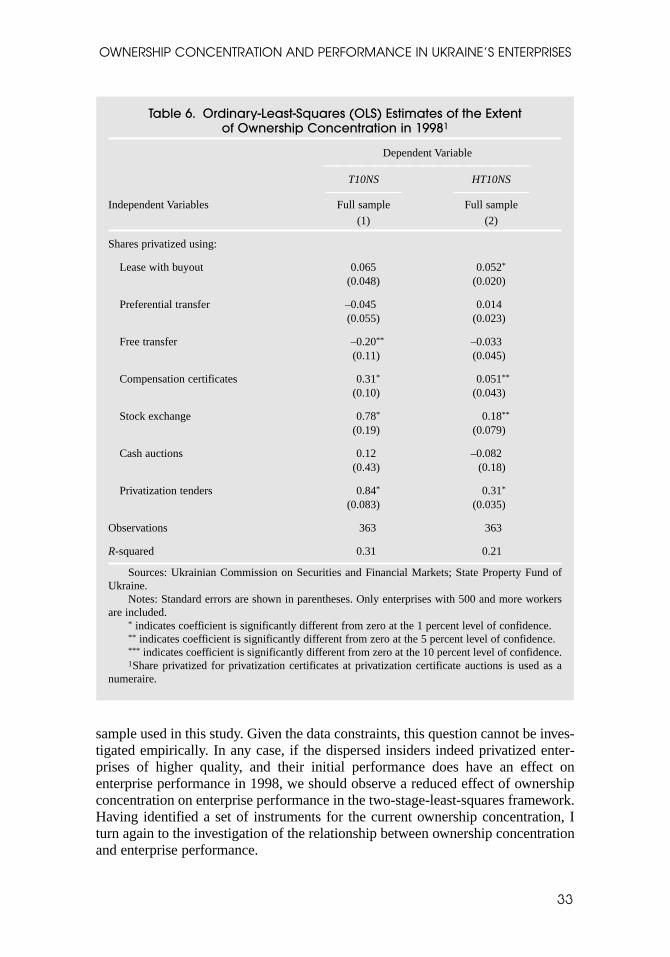
Table 6 presents the ordinary-least-squares (OLS) regression results for thetwo measures of ownership concentration versus the proportion of equity allocatedby each privatization method. The share of equity privatized at privatization cer-tificate auctions is omitted to prevent collinearity. (The equity privatized by dif-ferent methods would add up to the total percentage of equity privatized.) Thecoefficients on the proportions of equity privatized by different methods have thesigns that would be predicted by the nature of each of the methods. The coeffi-cients should be interpreted as the marginal effects of privatizing an additional per-centage of enterprise equity using a specific method on the measures of ownershipconcentration, compared with the effect of privatizing that equity at privatizationcertificate auctions. These variables alone explain 31 percent of the variation in thelinear ownership concentration index (T10NS) and 21 percent of the variation inthe Herfindahl index (HT10NS). This indicates that the proportions of equity pri-vatized by different privatization methods are good instruments for ownershipconcentration at the end of 1998.
A word of caution is warranted on the exogeneity of these instruments. It ispossible that perceived quality of enterprises at the time of the design of theirprivatization plans influenced the choice of a combination of privatization methods.For example, for a sample of small and medium-sized Ukrainian enterprises,Kyryliuk and Leshchenko (2000) find that in enterprises with better-than-averagepre-privatization performance, insiders privatized significant proportions of equitythrough the dispersed-ownership schemes. It is possible that pre-privatizationenterprise performance also had an effect on ownership concentration for the
Alexander Pivovarsky
32
sample used in this study. Given the data constraints, this question cannot be inves-tigated empirically. In any case, if the dispersed insiders indeed privatized enter-prises of higher quality, and their initial performance does have an effect onenterprise performance in 1998, we should observe a reduced effect of ownershipconcentration on enterprise performance in the two-stage-least-squares framework.Having identified a set of instruments for the current ownership concentration, Iturn again to the investigation of the relationship between ownership concentrationand enterprise performance.
OWNERSHIP CONCENTRATION AND PERFORMANCE IN UKRAINE’S ENTERPRISES
33
Table 6. Ordinary-Least-Squares (OLS) Estimates of the Extent of Ownership Concentration in 19981
Dependent Variable—————————————————
T10NS HT10NS—————— ——————
Independent Variables Full sample Full sample
(1) (2)
Shares privatized using:
Lease with buyout 0.065 0.052*
(0.048) (0.020)
Preferential transfer –0.045 0.014(0.055) (0.023)
Free transfer –0.20** –0.033(0.11) (0.045)
Compensation certificates 0.31* 0.051**
(0.10) (0.043)
Stock exchange 0.78* 0.18**
(0.19) (0.079)
Cash auctions 0.12 –0.082(0.43) (0.18)
Privatization tenders 0.84* 0.31*
(0.083) (0.035)
Observations 363 363
R-squared 0.31 0.21
Sources: Ukrainian Commission on Securities and Financial Markets; State Property Fund ofUkraine.
Notes: Standard errors are shown in parentheses. Only enterprises with 500 and more workersare included.
* indicates coefficient is significantly different from zero at the 1 percent level of confidence.** indicates coefficient is significantly different from zero at the 5 percent level of confidence.*** indicates coefficient is significantly different from zero at the 10 percent level of confidence.1Share privatized for privatization certificates at privatization certificate auctions is used as a
numeraire.
V. Ownership Concentration and Enterprise Performance:Instrumental Variable Results
The original equation (2), as rewritten here,
yi = µ + α Ri + γXi + ε i (2)
describes the relationship between ownership concentration and enterprise perfor-mance in 1998. Further relationships can be written as
Ri = λ R + βRCi + γRXi + υRi and (3)
Ci = λ C + βCPi + γCXi + υCi, (4)
where Ri is a measure of ownership concentration in 1998 for enterprise i, Ci is ameasure of initial post-privatization ownership concentration, Pi is a vector of pro-portions of equity privatized by each method for each enterprise, and Xi is a vec-tor of industry dummies and other covariates.
Given that there are no reliable data on the initial ownership concentrationvariable for the enterprise sample, my identification strategy will be to use the vec-tor of proportions of equity privatized by each method for each enterprise includedin the sample as a set of instruments for current ownership concentration andmodel Ri as
Ri = ξ + βPi + δXi + υ i. (5)
I estimate equations (2) and (5) jointly using two-stage-least-squaresmethodology.7
The basic results for the second-stage equation (2) are presented in Tables 7and 8. Columns 1, 5, and 9 in Table 7 present the second-stage coefficients fromthe two-stage regression for the T10NS measure of ownership concentration andcolumns 1, 5, and 9 in Table 8—for HT10NS. All of these regressions include a setof industry dummies, and the regressions of material cost performance and laborproductivity also include the log transformation of the capital-labor ratio to con-trol for variation in capital intensity across firms. For the linear index of owner-ship concentration, the coefficients α on ownership concentration have thepredicted signs in all cases and are statistically significant at the 99 percent levelfor the total factor productivity estimate and material cost performance, but notstatistically significant for the labor productivity measure (p-value of 0.28). Forthe Herfindahl index of ownership concentration, the coefficients α always havethe predicted signs and are statistically significant at the 90 percent level or higher.
The relationship between ownership concentration and performance is signif-icant in economic terms, too. The coefficients on the ownership concentration
Alexander Pivovarsky
34
7In the first-stage regression, enterprise-specific proportions of equity privatized by different methodsare used to generate an estimated, or predicted, value of current ownership concentration for each enter-prise. In the second stage, the predicted values of current ownership concentration are regressed on themeasures of enterprise performance. The ordinary-least-squares (OLS) estimates of ownership concentra-tion presented in Table 6 serve as an approximation of the first-stage regression results for the sample ofenterprises.
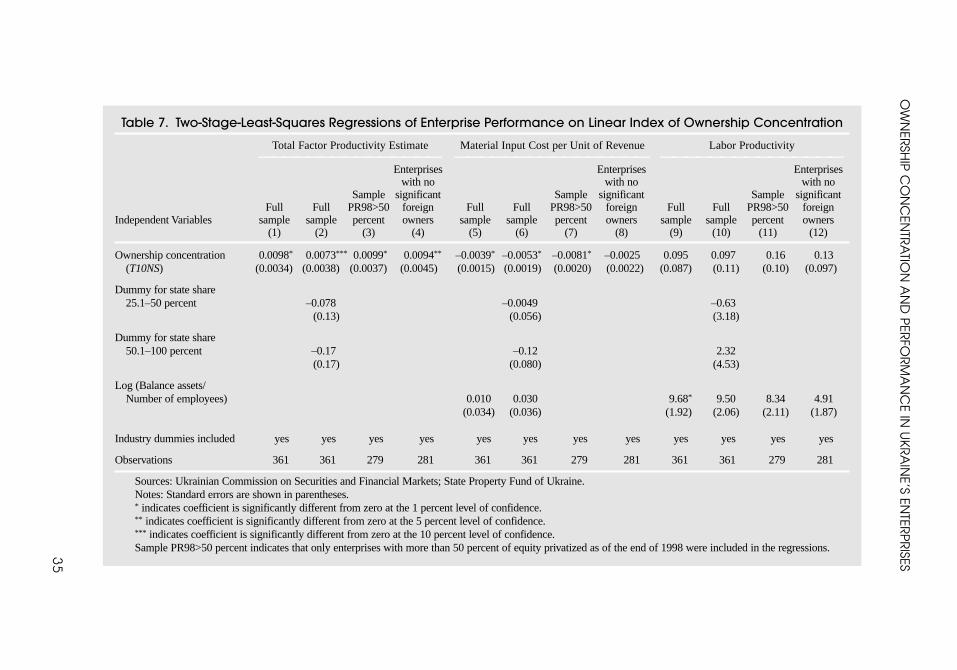
OW
NER
SHIP
CO
NC
ENTR
ATIO
NA
ND
PER
FOR
MA
NC
E IN U
KR
AIN
E’S ENTER
PR
ISES
35
Table 7. Two-Stage-Least-Squares Regressions of Enterprise Performance on Linear Index of Ownership Concentration
Total Factor Productivity Estimate Material Input Cost per Unit of Revenue Labor Productivity——————————————— ———————————————— ———————————————
Enterprises Enterprises Enterpriseswith no with no with no
Sample significant Sample significant Sample significantFull Full PR98>50 foreign Full Full PR98>50 foreign Full Full PR98>50 foreign
Independent Variables sample sample percent owners sample sample percent owners sample sample percent owners(1) (2) (3) (4) (5) (6) (7) (8) (9) (10) (11) (12)
Ownership concentration 0.0098* 0.0073*** 0.0099* 0.0094** –0.0039* –0.0053* –0.0081* –0.0025 0.095 0.097 0.16 0.13(T10NS) (0.0034) (0.0038) (0.0037) (0.0045) (0.0015) (0.0019) (0.0020) (0.0022) (0.087) (0.11) (0.10) (0.097)
Dummy for state share 25.1–50 percent –0.078 –0.0049 –0.63
(0.13) (0.056) (3.18)
Dummy for state share 50.1–100 percent –0.17 –0.12 2.32
(0.17) (0.080) (4.53)
Log (Balance assets/ Number of employees) 0.010 0.030 9.68* 9.50 8.34 4.91
(0.034) (0.036) (1.92) (2.06) (2.11) (1.87)
Industry dummies included yes yes yes yes yes yes yes yes yes yes yes yes
Observations 361 361 279 281 361 361 279 281 361 361 279 281
Sources: Ukrainian Commission on Securities and Financial Markets; State Property Fund of Ukraine.Notes: Standard errors are shown in parentheses.* indicates coefficient is significantly different from zero at the 1 percent level of confidence.** indicates coefficient is significantly different from zero at the 5 percent level of confidence.*** indicates coefficient is significantly different from zero at the 10 percent level of confidence.Sample PR98>50 percent indicates that only enterprises with more than 50 percent of equity privatized as of the end of 1998 were included in the regressions.
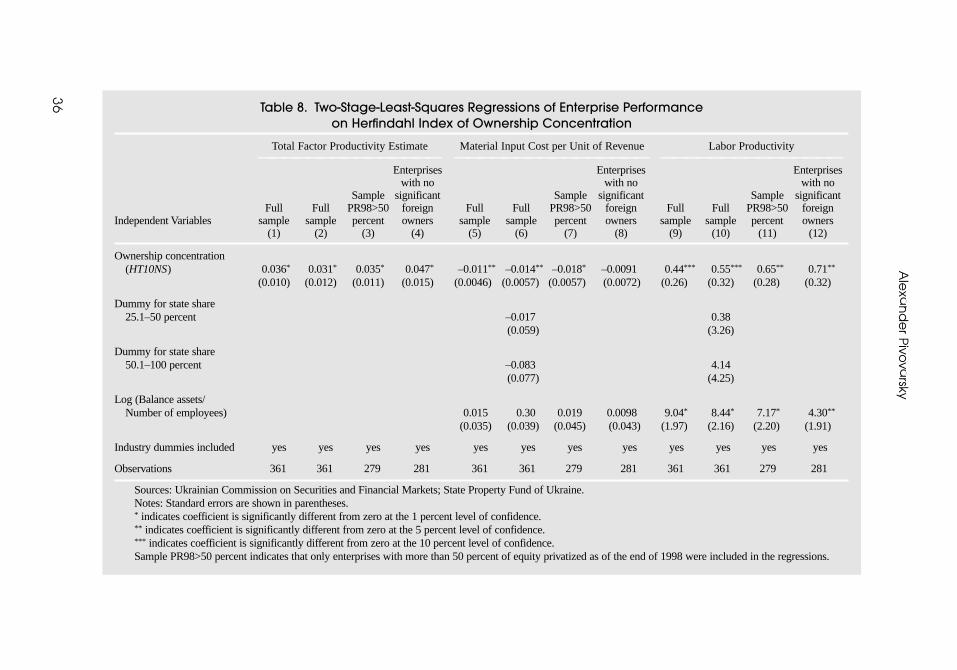
Ale
xan
de
r Pivo
varsky
36 Table 8. Two-Stage-Least-Squares Regressions of Enterprise Performance
on Herfindahl Index of Ownership Concentration
Total Factor Productivity Estimate Material Input Cost per Unit of Revenue Labor Productivity——————————————— ———————————————— ———————————————
Enterprises Enterprises Enterpriseswith no with no with no
Sample significant Sample significant Sample significantFull Full PR98>50 foreign Full Full PR98>50 foreign Full Full PR98>50 foreign
Independent Variables sample sample percent owners sample sample percent owners sample sample percent owners(1) (2) (3) (4) (5) (6) (7) (8) (9) (10) (11) (12)
Ownership concentration (HT10NS) 0.036* 0.031* 0.035* 0.047* –0.011** –0.014** –0.018* –0.0091 0.44*** 0.55*** 0.65** 0.71**
(0.010) (0.012) (0.011) (0.015) (0.0046) (0.0057) (0.0057) (0.0072) (0.26) (0.32) (0.28) (0.32)
Dummy for state share 25.1–50 percent –0.017 0.38
(0.059) (3.26)
Dummy for state share 50.1–100 percent –0.083 4.14
(0.077) (4.25)
Log (Balance assets/ Number of employees) 0.015 0.30 0.019 0.0098 9.04* 8.44* 7.17* 4.30**
(0.035) (0.039) (0.045) (0.043) (1.97) (2.16) (2.20) (1.91)
Industry dummies included yes yes yes yes yes yes yes yes yes yes yes yes
Observations 361 361 279 281 361 361 279 281 361 361 279 281
Sources: Ukrainian Commission on Securities and Financial Markets; State Property Fund of Ukraine.Notes: Standard errors are shown in parentheses.* indicates coefficient is significantly different from zero at the 1 percent level of confidence.** indicates coefficient is significantly different from zero at the 5 percent level of confidence.*** indicates coefficient is significantly different from zero at the 10 percent level of confidence.Sample PR98>50 percent indicates that only enterprises with more than 50 percent of equity privatized as of the end of 1998 were included in the regressions.
variable increase if compared with the simple cross-section regressions of the totalfactor productivity estimate and material cost performance using the linear indexof ownership concentration and for all three measures of performance in theregressions using the Herfindahl index of ownership concentration. Thus, a 10 per-cent increase in the ownership concentration variable T10NS leads to a 9.8 percentimprovement in the total factor productivity estimate. A similar increase in own-ership concentration would lead to a 3.9 percent decline in the material input cost(per unit of revenue). From regressions on the Herfindahl index of ownership con-centration, the increase in ownership concentration from the median value of 1.49to the seventy-fifth percentile value of 7.2 would be associated with an increase inrevenue per employee of 2,512 Ukrainian hryvnias (or approximately 10 percentof the mean value of sales revenue per employee for the whole sample).
An empirical problem that does not get addressed by the instrumental-variableapproach is the enterprise selection for privatization by the state. In order to controlfor the possibility that the state retained equity in the best- or worst-performingenterprises, I introduce dummies for two levels of significant state ownership (thecontrolling stake and the blocking stake) into the basic specification (reported incolumns 2, 6, and 10 of Tables 7 and 8) and also undertake regressions for the sam-ple limited to firms with controlling stakes privatized (reported in columns 3, 7, and11 of Tables 7 and 8). With both types of controls, the coefficients on ownershipconcentration remain statistically significant at the 90 percent level or higher in allcases with the exception of regressions of labor productivity on the linear index ofconcentration.
The ordinary-least-squares approach generated evidence that enterprises withconcentrated foreign owners perform better than enterprises with concentrateddomestic owners. The instrumental-variable story presented in this study does notaddress potential concerns related to selection of enterprises for concentration byownership type (foreign versus domestic). It is also possible that the foreigninvestors acquired concentrated ownership stakes in better-quality enterprises afterprivatization. Since I cannot address this question directly, I limit the sample toenterprises with no significant foreign owners as a robustness check on the broadconclusions about the effects of ownership concentration on performance. Theresults for the limited sample are included in columns 4, 8, and 12 in Tables 7 and 8.In all cases, the coefficients retain the predicted signs and do not change significantlyfrom those for the full sample. The statistical significance declines in the regressionof material input cost (per unit of revenue) for both measures of ownership concen-tration. Given this, I cannot rule out the possibility that foreign investors improve thecost performance of enterprises for reasons different from concentrated owners’greater ability to resolve an agency problem than dispersed owners.
Overall, this article finds that nonstate ownership concentration has a positiveeffect on enterprise performance in Ukraine. The effect is especially strong whenperformance is measured as an estimate of total factor productivity and labor pro-ductivity (sales revenues per employee). The article also finds that, in contrast topredictions made by many observers of early transition, privatization methods hada lasting effect on ownership structure in Ukraine. Although the article also findsthat for a cross section of firms, concentration of ownership by foreign companies
OWNERSHIP CONCENTRATION AND PERFORMANCE IN UKRAINE’S ENTERPRISES
37
and banks is associated with better performance than concentration of ownershipdomestically, further study is needed to determine the channels through which for-eign ownership affects performance and to address the possibility that foreignowners acquired better-quality enterprises after privatization.
VI. Concluding Remarks
The article’s findings have several important policy implications. First, the articlequestions the effectiveness of mass privatization methods that led to a dispersedpost-privatization ownership structure and suggests that privatization that grantssignificant ownership stakes to single parties may bring about greater efficiencygains than privatization that disperses ownership. Second, it finds that severalyears after privatization, the ownership structures of individual enterprises depend,to a significant extent, on the privatization methods used. Thus, if, owing to polit-ical and equity considerations, the governments in transition economies have touse privatization mechanisms leading to dispersed ownership, they should con-sider creating appropriate conditions for ownership reallocation to make privati-zation work. Third, the cross-section regression results reveal that ownershipconcentration by foreign companies and banks is positively associated with enter-prise performance. If foreign companies and banks indeed perform better as own-ers, perhaps the governments should consider attracting foreign investors forparticipation in future privatizations and making the institutional environmentconducive to foreign direct investment.
My argument in favor of privatization that grants concentrated ownershipstakes is based on the observation that the institutional environment in Ukraine isnot conducive to the protection of investors (whether foreign or domestic) andexacerbates the agency problems associated with dispersed ownership. From thisperspective, my results should be interpreted as promoting a second-best solution.If a country possesses an appropriate institutional environment for investor pro-tection, the agency costs of dispersed ownership may be outweighed by the bene-fits of the risk diversification and access to capital afforded by the arm’s-lengthcapital markets. This second-best approach does not address the legitimate equityconcerns regarding privatization. These concerns can be addressed in a number ofways, including by improving the quality of institutions of investor protection,increasing the transparency and liquidity of the capital markets, and transferringmost privatization revenues to the public.
It is important to stress that a number of important questions remain. First, thestudy’s empirical evidence did not identify all the channels through which owner-ship concentration affects performance. I have argued here that ownership con-centration affects performance by addressing the agency problems. However, onecan think of several other channels through which ownership concentration affectsperformance. First, concentrated owners may reinvest more profits than dispersedowners and, thus, increase their enterprises’ productivity. Second, concentratedinvestors (especially foreign investors) may have better access to new technology.Third, concentrated investors may be better at replacing incompetent managerswith competent new ones. In any case, the findings show that ownership concen-
Alexander Pivovarsky
38
tration affects performance. Further research is needed to determine the precisechannels through which this effect is transmitted. From a policy perspective,though, the lessons are more straightforward: it is a good idea to privatize con-centrated stakes, at least until the government is able to improve capital marketinfrastructure and institutions for investor protection.
This study’s findings are also important for other reasons. First, a significantshare of Ukraine’s capital assets is still owned by the state and, thus, the findingshave implications for the design of the future privatization efforts in Ukraine.Starting in late 1999, medium-sized and large enterprises have been privatized byselling large packages of shares. The government has invited foreign investors toparticipate in privatization tenders. Some critics of the government have arguedthat this new approach is a result of the urgent need to increase government rev-enues and not of a careful search for an effective privatization model. The goodnews is that in this instance the political process may have a positive side effect onthe Ukrainian economy. Second, the results for Ukraine may be generalized toother countries in the region. Ukraine’s privatization program was similar to thoseadopted by other CIS countries, which possess similar institutional environmentsfor arm’s-length corporate governance (World Bank, 1996; EBRD, 1998). Finally,the study’s findings may be useful for designing privatization programs in coun-tries yet to embark on such efforts (such as Belarus, China, Cuba, and Vietnam).
REFERENCES
Aghion, Philippe, and Olivier Blanchard, 1996, “On Insider Privatization,” European EconomicReview, Vol. 40, No. 5, pp. 759–66.
Anderson, James H., Georges Korsun, and Peter Murrell, 2000, “Which Enterprises (BelieveThey) Have Soft Budgets?: Evidence on the Effects of Ownership and Decentralization inMongolia,” Journal of Comparative Economics, Vol. 28, No. 2, pp. 219–46.
Anderson, James H., Young Lee, and Peter Murrell, 2000, “Competition and PrivatizationAmidst Weak Institutions: Evidence from Mongolia,” Economic Inquiry, Vol. 38, No. 4,pp. 527–49.
Barberis, Nicholas, and others, 1996, “How Does Privatization Work? Evidence from theRussian Shops,” Journal of Political Economy, Vol. 104, No. 4, pp. 764–90.
Berle, Adolf A., and Gardiner C. Means, 1932, The Modern Corporation and Private Property(New York: Macmillan).
Boubakri, Narjess, and Jean-Claude Cosset, 1998, “The Financial and Operating Performanceof Newly Privatized Firms: Evidence from Developing Countries,” Journal of Finance,Vol. 53 (June), pp. 1081–110.
Boycko, Maxim, Andrei Shleifer, and Robert Vishny, 1995, Privatizing Russia (Cambridge,Massachusetts: MIT Press).
Claessens, Stijn, and Simeon Djankov, 1999, “Ownership Concentration and CorporatePerformance in the Czech Republic,” Journal of Comparative Economics, Vol. 27, No. 3,pp. 498–513.
Coase, Ronald H., 1937, “The Nature of the Firm,” Economica, Vol. 4 (November),pp. 386–405.
OWNERSHIP CONCENTRATION AND PERFORMANCE IN UKRAINE’S ENTERPRISES
39
Coffee, John C., Jr., 1998, “The Future as History: The Prospects for Global Convergence inCorporate Governance and Its Implications” (unpublished). Available on the web athttp://papers.ssrn.com/so13/delivery.cfm/991020101.pdf?abstractid=142833.
Demsetz, Harold, and Kenneth Lehn, 1985, “The Structure of Corporate Ownership: Causesand Consequences,” Journal of Political Economy, Vol. 93, No. 6, pp. 1155–77.
Dewenter, K. L., and P. H. Malatesta, 2001, “State-Owned and Privately Owned Firms: AnEmpirical Analysis of Profitability, Leverage, and Labor Intensity,” American EconomicReview, Vol. 91, No. 1, pp. 320–34.
Djankov, Simeon, 1999, “Ownership Structure and Enterprise Restructuring in Six NewlyIndependent States,” World Bank Policy Research Paper No. 2047 (Washington: WorldBank).
———, and Peter Murrell, 2000, “Enterprise Restructuring in Transition: A QuantitativeSurvey” (unpublished). Available on the web at http://papers.ssrn.com/so13/delivery.cfm/SSRN_ID238716_code001031600.pdf?abstractid=238716.
Djankov, Simeon, and Gerhard Pohl, 1998, “The Restructuring of Large Firms in the SlovakRepublic,” Economics of Transition, Vol. 6, No. 1, pp. 67–85.
Earle, John S., and Saul Estrin, 1996, “Privatization versus Competition: Changing EnterpriseBehavior in Russia,” IIASA Working Paper No. 96-049 (Laxenburg, Austria: InternationalInstitute for Applied Systems Analysis).
———, 1997, “After Voucher Privatization: The Structure of Corporate Ownership in RussianManufacturing Industry,” SITE Working Paper No. 120 (Stockholm: Stockholm Institute ofTransition Economies and East European Economies).
———, 1998, “Privatization, Competition, and Budget Constraints: Disciplining Enterprises inRussia,” SITE Working Paper No. 128 (Stockholm: Stockholm Institute of TransitionEconomies and East European Economies).
Estrin, Saul, and Adam Rosevear, 1999, “Enterprise Performance and Corporate Governance inUkraine,” Journal of Comparative Economics, Vol. 27, No. 3, pp. 442–58.
European Bank for Reconstruction and Development (EBRD), 1997, Transition Report, 1997:Enterprise Performance and Growth (London).
———, 1998, Transition Report, 1998: Financial Sector in Transition (London).
Frydman, Roman, and others, 1997, “Private Ownership and Corporate Performance: SomeLessons from Transition Economies,” NYU C.V. Starr Center for Applied EconomicsWorking Paper No. 97-28 (New York: New York University).
———, 1999, “When Does Privatization Work? The Impact of Private Ownership onCorporate Performance in the Transition Economies,” Quarterly Journal of Economics,Vol. 114, No. 4, pp. 1153–91.
Glaeser, Edward, Simon Johnson, and Andrei Shleifer, 2001, “Coase versus the Coasians,”Quarterly Journal of Economics, Vol. 116, No. 3, pp. 853–99.
Havrylyshyn, Oleh, and Donal McGettigan, 2000, “Privatization in Transition Countries,” Post-Soviet Affairs, Vol. 16, No. 3, pp. 257–86.
International Finance Corporation (IFC), 1999, Emerging Stock Markets Factbook(Washington: International Finance Corporation).
Johnson, Bryan T., Kim R. Holmes, and M. Kirkpatrick, 1998, Index of Economic Freedom,1997 (Washington: Heritage Foundation and Wall Street Journal).
Johnson, Simon, and others, 2000, “Tunnelling,” American Economic Review, Papers andProceedings, Vol. 90 (May), pp. 22–27.
Alexander Pivovarsky
40
Johnson, Simon, John McMillan, and Christopher Woodruff, 1999, “Contract Enforcement inTransition” (unpublished). Available on the web at http://www.hss.se/site/publications/workingpapers/No151web.pdf.
Kaufmann, Daniel, and Alexander Kaliberda, 1996, “Integrating the Unofficial Economy intothe Dynamics of Post-Socialist Economies: A Framework of Analysis and Evidence,” inEconomic Transition in Russia and the New States of Eurasia, ed. by Bartolomiej Kaminski(Armonk, New York and London: M. E. Sharpe), pp. 81–120.
Kaufmann, Daniel, and Paul Siegelbaum, 1996, “Privatization and Corruption in TransitionEconomies,” Journal of International Affairs, Vol. 50 (Winter), pp. 419–58.
Kornai, János, 1992, The Socialist System: The Political Economy of Communism (Princeton,New Jersey: Princeton University Press).
———, 1995, Highway and Byways: Studies on Reform and Post-Communist Transition(Cambridge, Massachusetts: MIT Press).
Kyryliuk, Volodymyr, and Larysa Leshchenko, 2000, “Performance of Ukrainian PrivatizedEnterprises: Some Statistical Evidence and Conclusions,” Economic Essays, Kyiv, Instituteof Reforms, Vol. 1, pp. 46–80.
La Porta, Rafael, and Florencio Lopez-de-Silanes, 1999, “The Benefits of Privatization:Evidence from Mexico,” Quarterly Journal of Economics, Vol. 114 (November),pp. 1193–242.
———, and Andrei Shleifer, 1999, “Corporate Ownership Around the World,” Journal ofFinance, Vol. 54, No. 2, pp. 471–517.
———, and Robert Vishny, 1998, “Law and Finance,” Journal of Political Economy, Vol. 106,No. 6, pp. 1113–55.
Megginson, William L., Robert C. Nash, and Matthias von Randenborgh, 1994, “The Financialand Operating Performance of Newly Privatized Firms: An International EmpiricalAnalysis,” Journal of Finance, Vol. 49 (June), pp. 403–52.
Megginson, William L., and Jeffrey M. Netter, 2001, “From State to Market: A Survey ofEmpirical Studies on Privatization,” Journal of Economic Literature, Vol. 39 (June),pp. 321–89.
Nellis, John, 1998, “Privatization in Transition Economies: An Update,” in Case-by-CasePrivatization in the Russian Federation: Lessons from International Experience, ed. byHarry G. Broadman (Washington: World Bank), pp. 13–22.
Pistor, Katharina, 2001, “Law as a Determinant for Equity Market Development: TheExperience of Transition Economies,” in Assessing the Value of Law in TransitionEconomies, ed. by Peter Murrell (Ann Arbor, Michigan: University of Michigan Press).
———, Martin Raiser, and Stanislaw Gelfer, 2000, “Law and Finance in TransitionEconomies,” Economics of Transition, Vol. 8, No. 2, pp. 325–68.
Pohl, Gerhard, and others, 1997, “Privatization and Restructuring in Central and EasternEurope: Evidence and Policy Options,” World Bank Technical Paper No. 368 (Washington:World Bank).
Shleifer, Andrei, and Robert W. Vishny, 1986, “Large Shareholders and Corporate Control,”Journal of Political Economy, Vol. 94 (June), pp. 461–88.
———, 1997, “A Survey of Corporate Governance,” Journal of Finance, Vol. 52 (June),pp. 737–83.
Tandon, Pankaj, 1995, “Welfare Effects of Privatization: Some Evidence from Mexico,”International Law Journal, Vol. 13, No. 2, pp. 329–49.
OWNERSHIP CONCENTRATION AND PERFORMANCE IN UKRAINE’S ENTERPRISES
41
Vining, Aidan R., and Anthony E. Boardman, 1992, “Ownership Versus Competition:Efficiency in Public Enterprise,” Public Choice, Vol. 73 (March), pp. 205–39.
Weiss, Andrew, and Georgiy Nikitin, 1998, “Performance of Czech Companies by OwnershipStructure,” William Davidson Institute Working Paper No. 186 (Ann Arbor, Michigan:University of Michigan).
World Bank, 1996, World Development Report 1996: From Plan to Market (Oxford and NewYork: Oxford University Press for the World Bank).
World Economic Forum, 1997, Global Competitiveness Report (Geneva).
———, 1999, Global Competitiveness Report (Geneva).
Alexander Pivovarsky
42