Embed Size (px)
Citation preview
In the format provided by the authors and unedited.
1
Supplementary Information
Oxygen Vacancies Enhance Pseudocapacitive Charge Storage Properties of MoO3-x
Hyung-Seok Kim,1 John B. Cook,2,3 Hao Lin,1 Jesse S. Ko,1
Sarah H. Tolbert,1,2,3* Vidvuds Ozolins,1* and Bruce Dunn,1,3,*
1Department of Materials Science and Engineering, UCLA, Los Angeles, California 90095-1595,
United States
2Department of Chemistry and Biochemistry, UCLA, Los Angeles, California 90095-1569,
United States
3The California NanoSystems Institute, UCLA, Los Angeles, California 90095
*to whom correspondence should be addressed: [email protected]; [email protected];
Oxygen vacancies enhance pseudocapacitive charge storage properties of MoO3-x
© 2016 Macmillan Publishers Limited, part of Springer Nature. All rights reserved.
SUPPLEMENTARY INFORMATIONDOI: 10.1038/NMAT4810
NATURE MATERIALS | www.nature.com/naturematerials 1

2
Figure S1. TEM images of (a) reduced MoO3-x, and (b) fully oxidized MoO3. (Inset of (a) shows
the blue color of as-prepared reduced MoO3-x)
© 2016 Macmillan Publishers Limited, part of Springer Nature. All rights reserved.
NATURE MATERIALS | www.nature.com/naturematerials 2
SUPPLEMENTARY INFORMATIONDOI: 10.1038/NMAT4810
3
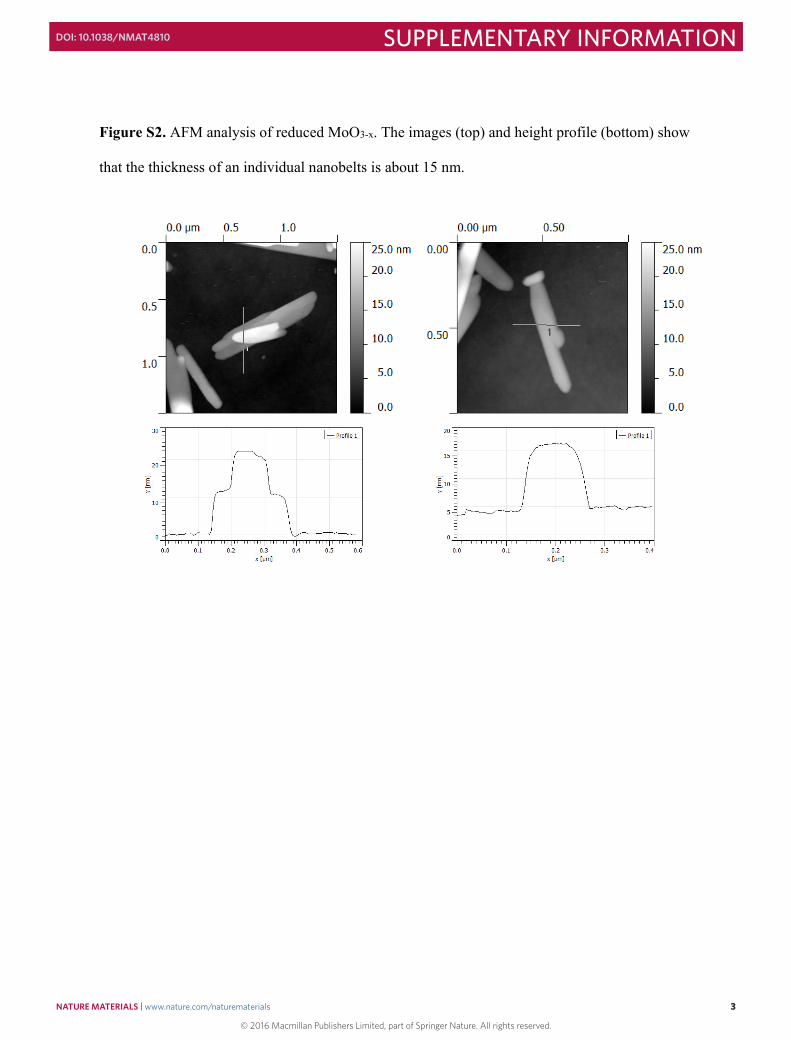
Figure S2. AFM analysis of reduced MoO3-x. The images (top) and height profile (bottom) show
that the thickness of an individual nanobelts is about 15 nm.
© 2016 Macmillan Publishers Limited, part of Springer Nature. All rights reserved.
NATURE MATERIALS | www.nature.com/naturematerials 3
SUPPLEMENTARY INFORMATIONDOI: 10.1038/NMAT4810
4
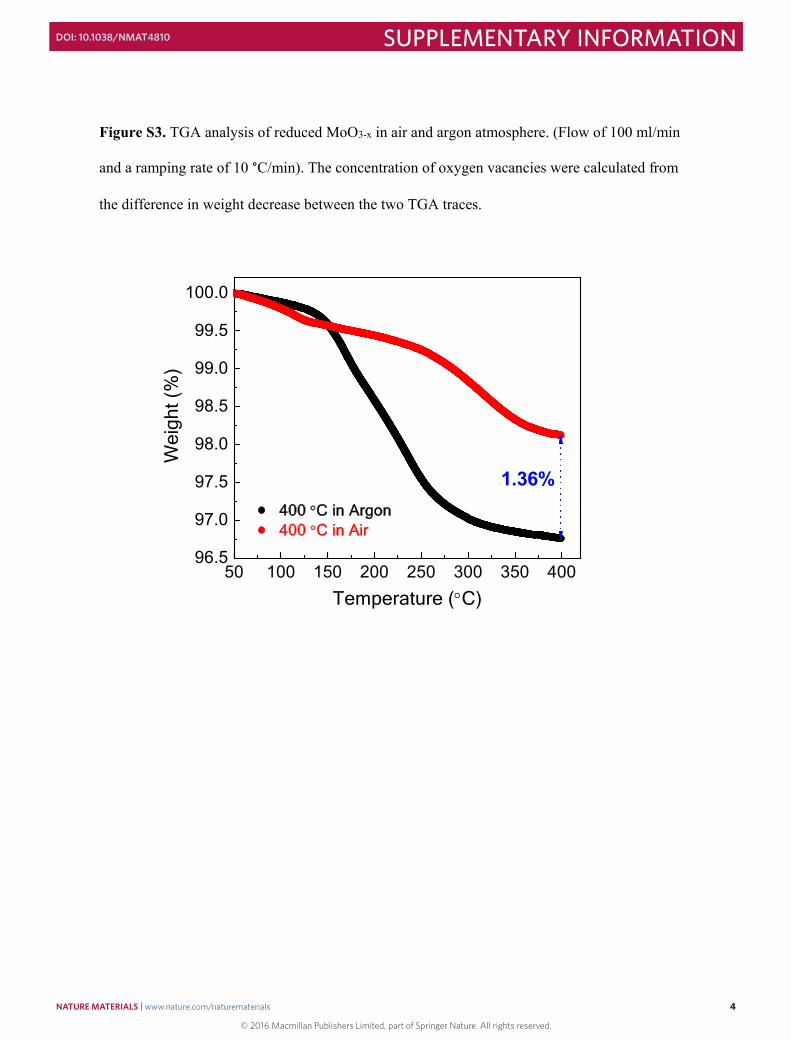
Figure S3. TGA analysis of reduced MoO3-x in air and argon atmosphere. (Flow of 100 ml/min
and a ramping rate of 10 °C/min). The concentration of oxygen vacancies were calculated from
the difference in weight decrease between the two TGA traces.
50 100 150 200 250 300 350 40096.5
97.0
97.5
98.0
98.5
99.0
99.5
100.0
Wei
ght (
%)
Temperature (C)
400 C in Argon400 C in Air
1.36%
© 2016 Macmillan Publishers Limited, part of Springer Nature. All rights reserved.
NATURE MATERIALS | www.nature.com/naturematerials 4
SUPPLEMENTARY INFORMATIONDOI: 10.1038/NMAT4810
5
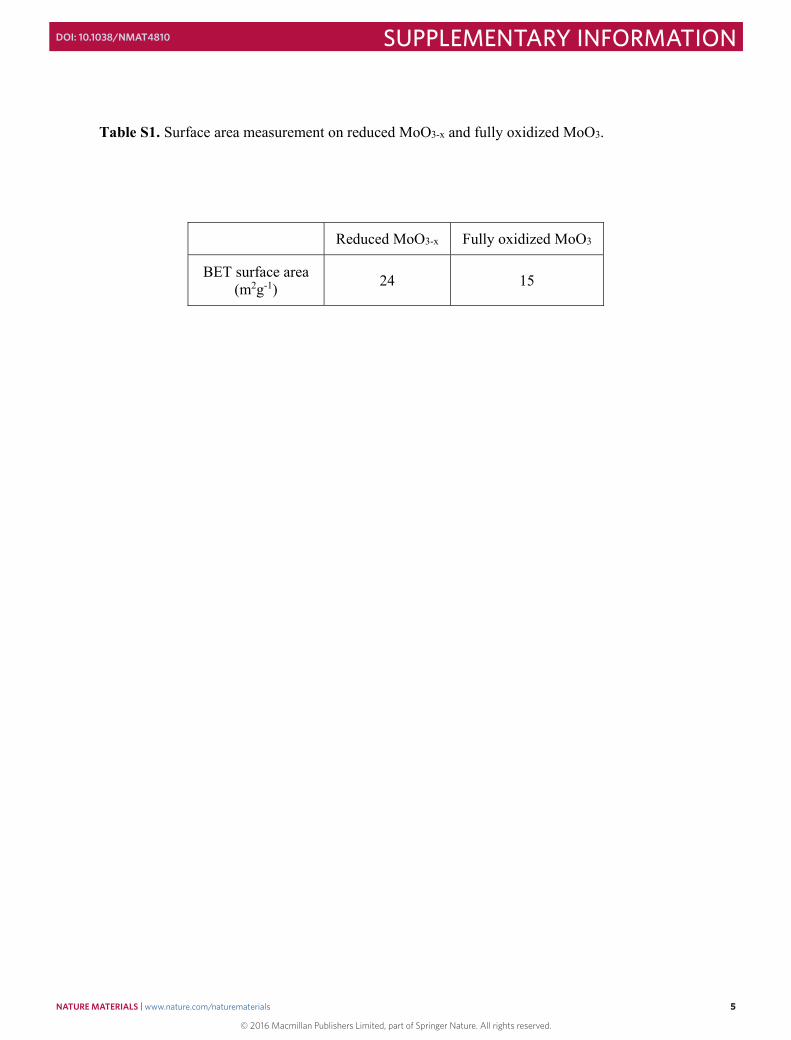
Table S1. Surface area measurement on reduced MoO3-x and fully oxidized MoO3.
Reduced MoO3-x Fully oxidized MoO3
BET surface area (m2g-1) 24 15
© 2016 Macmillan Publishers Limited, part of Springer Nature. All rights reserved.
NATURE MATERIALS | www.nature.com/naturematerials 5
SUPPLEMENTARY INFORMATIONDOI: 10.1038/NMAT4810
6
Discussions of HSE Vs. GGA+U in MoO3
It is widely known that local and semi-local xc functionals (such as LDA and GGA) fail
in systems with localized electrons electrons, such as transition metal compounds, due to
incomplete of cancellation of electron self-interaction effects1. The “+U” method is the simplest
approach to account for on-site Coulomb interactions in a mean-field manner; GGA+U has been
shown to calculate the redox potentials accurately2. HSE06 is arguably more sophisticated
because it is parameter-free and calculates the corrections self-consistently. Nevertheless, it still
a rather ad hoc mixture of DFT and Hartree-Fock with screening and has had mixed success in
transition metal compounds. For instance, Ong et al. showed that HSE is important when the
polaron lives in hybridized transition metal d - Oxygen p orbitals, in which case GGA+U cannot
localize the polaron because the +U is applied to the d orbital only3. However, in the same paper
it is shown that HSE predicts the wrong phase diagram for olivines, while GGA+U is better.
In MoO3, the polaron lives almost entirely in the d orbital. In our previous work4, we
calculated polaron energies and migration barriers in stoichiometric MoO3 using GGA+U and
HSE; the predictions are comparable and found to be in good agreement with experiment. We
expect that the same conclusion will hold for reduced MoO3-x because the localization of the
polaron is still confined to the Mo d orbitals. Therefore, we applied GGA+U method in the
research of this paper.
© 2016 Macmillan Publishers Limited, part of Springer Nature. All rights reserved.
NATURE MATERIALS | www.nature.com/naturematerials 6
SUPPLEMENTARY INFORMATIONDOI: 10.1038/NMAT4810
7
Discussions of polaron configurations, polaron binding energies and variance of bond
lengths in reduced MoO3-x.
Oxygen vacancy was modeled by removing one oxygen atom in a 3×1×3 supercell
containing 36 formula units of stoichiometric MoO3. The preference site of oxygen vacancy in
our results is consistent with previous GGA+U calculations, but the most stable polaron state is
different. Coquet et al.5 found that the structure with a terminating oxygen vacancy and with the
reduced MoO3-x center in the Mo4+ state is the most stable structure, which is the structure with
the second lowest formation energy in our calculation, while in another study6 the polaron state
was not mentioned. We argue that our results should be more reliable because at least two
polaron configurations were considered in each type of oxygen vacancy structure and previous
calculations only showed one polaron configuration. Moreover, our prediction for polaron states
is in good agreement with our experimental observation (Observation of Mo5+ states) and our
prediction for the polaron orbital (dxz) in the six-fold coordinated Mo6+ion is consistent with our
previous study of fully oxidizedα-MoO37. Since GGA methods cannot describe the localized d
electrons in the transition metals correctly, it is not surprising that the preferred site of oxygen
vacancy by GGA methods is the Os site, which contradicts the results from GGA+U methods5.
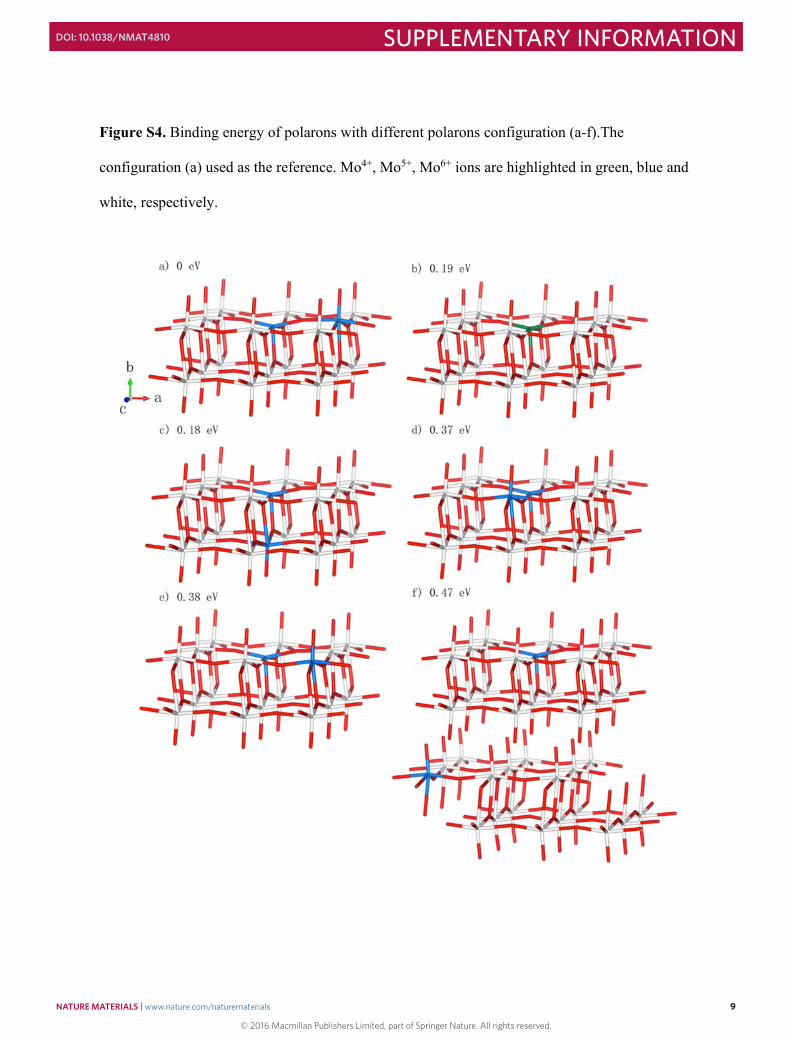
Furthermore, binding energies of the polarons were investigated by comparing the total
energy difference of structures with various polaron configurations. If the bipolaron structure
with an Ot vacancy is treated as a reference structure (see the polaron orbitals in Fig. 2c and the
structure a in Fig. S4), the energies of the structures with a Mo4+ cation at the defect center
(structure b in Fig. S4) and with two adjacent Mo5+ cations within the same bilayer are about
0.20 eV higher (structure c in Fig. S4). However, the separation of the bipolaron requires at least
0.37 eV. As shown in Structure d to f in Fig. S4, isolation of two polarons within the same
© 2016 Macmillan Publishers Limited, part of Springer Nature. All rights reserved.
NATURE MATERIALS | www.nature.com/naturematerials 7
SUPPLEMENTARY INFORMATIONDOI: 10.1038/NMAT4810
8
bilayer needs 0.37 eV, while separation of two polarons into two different bilayers demands 0.47
eV. Bipolaron structures are favored in reduced MoO3-x, because adjacent two polarons can
minimize the total energy by relaxing the lattice distortion locally and this was confirmed by the
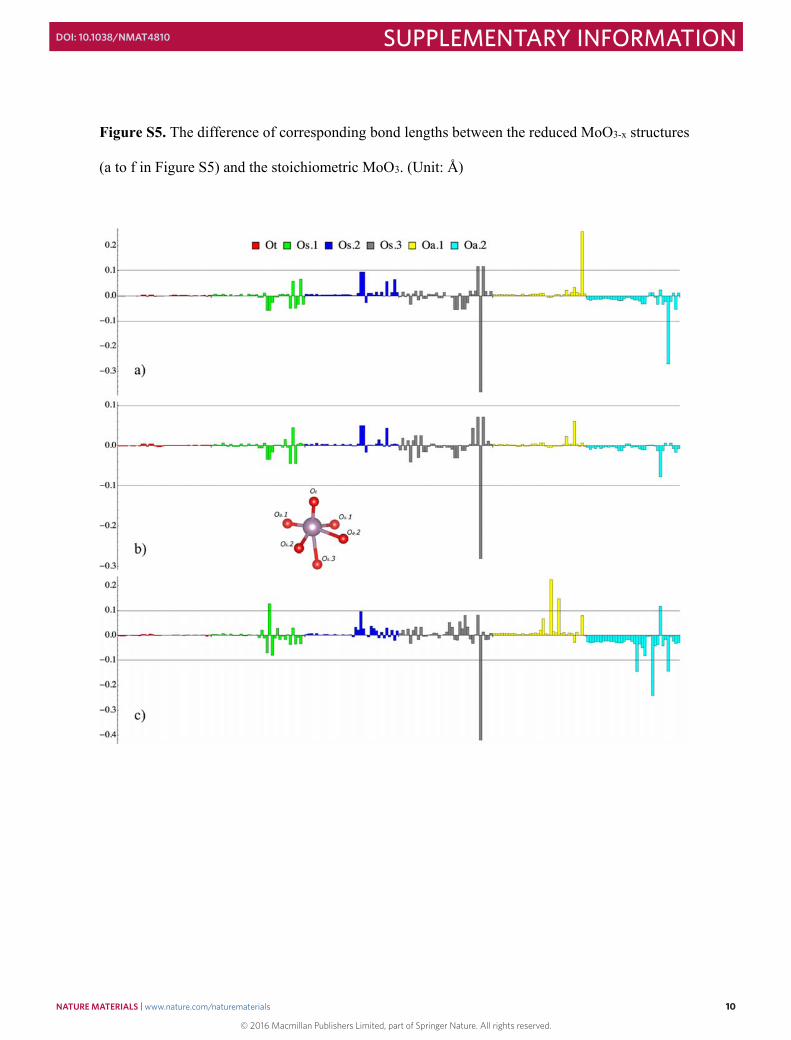
analyzing the variance of bond lengths. Compared to the same kind of Mo-O bond lengths in
stoichiometric MoO3, only 5 Mo-O bonds lengths in the reference structure are changed about
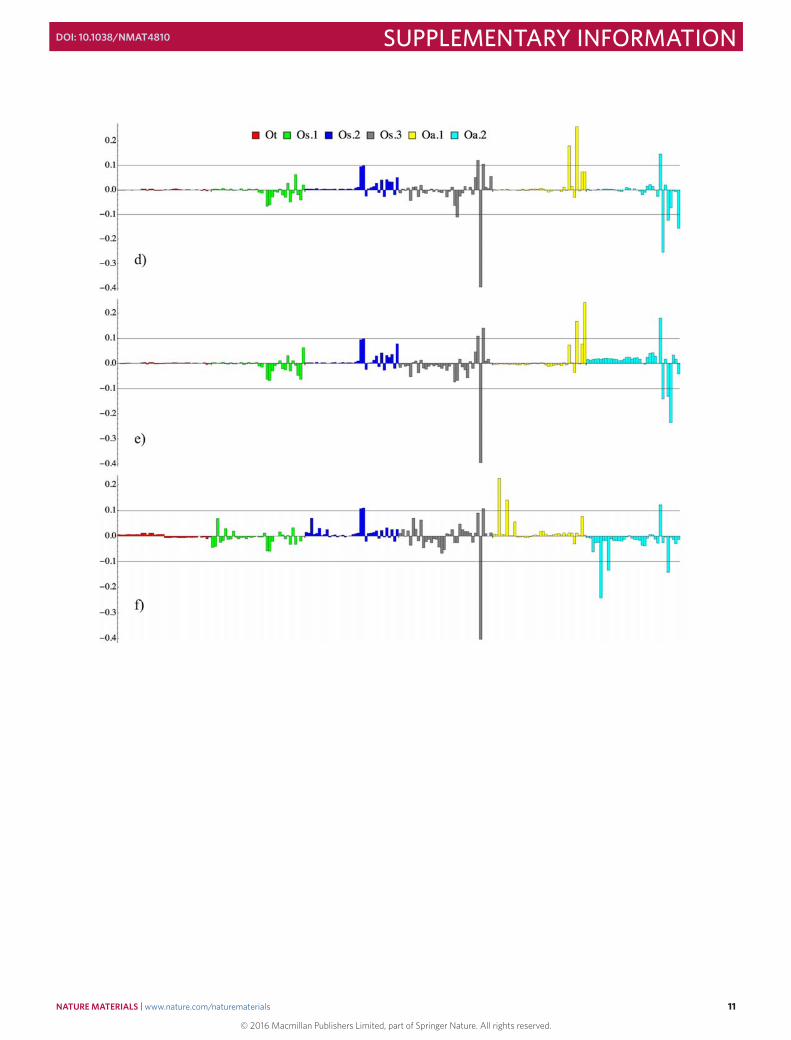
0.1 Å, while in structure 3 to 6, at least 8 Mo-O bond lengths are changed approximately 0.1 Å
(See Fig. S5). As for structure c, although the distance of the two polarons is close, the two
MoO6 octahedra containing the two polarons are edge sharing in the different layers, which is
believed to be less flexible than the two polarons in the two adjacent corner-sharing octahedra in
reference structure a. We point out that in the Mo4+ structure, only one Mo-O bond length is
changed more than 0.1 Å, but the repulsion between the two polarons in the same Mo cation
center might lead to the increase of energy.
© 2016 Macmillan Publishers Limited, part of Springer Nature. All rights reserved.
NATURE MATERIALS | www.nature.com/naturematerials 8
SUPPLEMENTARY INFORMATIONDOI: 10.1038/NMAT4810
9
Figure S4. Binding energy of polarons with different polarons configuration (a-f).The
configuration (a) used as the reference. Mo4+, Mo5+, Mo6+ ions are highlighted in green, blue and
white, respectively.
© 2016 Macmillan Publishers Limited, part of Springer Nature. All rights reserved.
NATURE MATERIALS | www.nature.com/naturematerials 9
SUPPLEMENTARY INFORMATIONDOI: 10.1038/NMAT4810
10
Figure S5. The difference of corresponding bond lengths between the reduced MoO3-x structures
(a to f in Figure S5) and the stoichiometric MoO3. (Unit: Å)
© 2016 Macmillan Publishers Limited, part of Springer Nature. All rights reserved.
NATURE MATERIALS | www.nature.com/naturematerials 10
SUPPLEMENTARY INFORMATIONDOI: 10.1038/NMAT4810
11
© 2016 Macmillan Publishers Limited, part of Springer Nature. All rights reserved.
NATURE MATERIALS | www.nature.com/naturematerials 11
SUPPLEMENTARY INFORMATIONDOI: 10.1038/NMAT4810
12
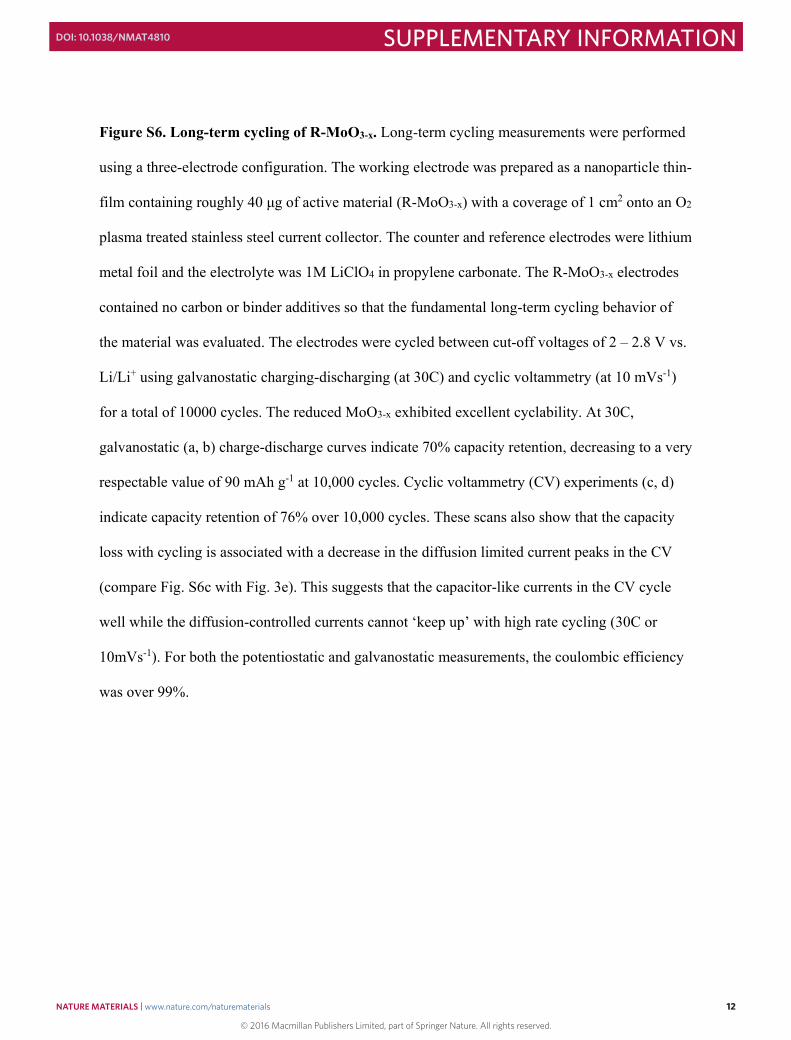
Figure S6. Long-term cycling of R-MoO3-x. Long-term cycling measurements were performed
using a three-electrode configuration. The working electrode was prepared as a nanoparticle thin-
film containing roughly 40 μg of active material (R-MoO3-x) with a coverage of 1 cm2 onto an O2
plasma treated stainless steel current collector. The counter and reference electrodes were lithium
metal foil and the electrolyte was 1M LiClO4 in propylene carbonate. The R-MoO3-x electrodes
contained no carbon or binder additives so that the fundamental long-term cycling behavior of
the material was evaluated. The electrodes were cycled between cut-off voltages of 2 – 2.8 V vs.
Li/Li+ using galvanostatic charging-discharging (at 30C) and cyclic voltammetry (at 10 mVs-1)
for a total of 10000 cycles. The reduced MoO3-x exhibited excellent cyclability. At 30C,
galvanostatic (a, b) charge-discharge curves indicate 70% capacity retention, decreasing to a very
respectable value of 90 mAh g-1 at 10,000 cycles. Cyclic voltammetry (CV) experiments (c, d)
indicate capacity retention of 76% over 10,000 cycles. These scans also show that the capacity
loss with cycling is associated with a decrease in the diffusion limited current peaks in the CV
(compare Fig. S6c with Fig. 3e). This suggests that the capacitor-like currents in the CV cycle
well while the diffusion-controlled currents cannot ‘keep up’ with high rate cycling (30C or
10mVs-1). For both the potentiostatic and galvanostatic measurements, the coulombic efficiency
was over 99%.
© 2016 Macmillan Publishers Limited, part of Springer Nature. All rights reserved.
NATURE MATERIALS | www.nature.com/naturematerials 12
SUPPLEMENTARY INFORMATIONDOI: 10.1038/NMAT4810

13
Electrochemical analysis of thin film
MoO3 electrodes. To complement the
results shown in Figure 3b, which
considers the sweep rate dependence
on capacity, we have plotted here the
specific capacitance (Fg-1) as a
function of sweep rate. The outcome is
the same as we observe the R-MoO3-x
(red) having a much greater specific capacitance than that of F-MoO3 (black)
0 2000 4000 6000 8000 100000
100
200
300
400
500
600
700
800
Galvanostatic Cycling Charge Discharge
Cycle Number (n)
Cap
acity
(C/g
)
0
20
40
60
80
100C
oulombic Efficiency (%
)
b
0 2000 4000 6000 8000 100000
100
200
300
400
500
600
700
Charge Discharge
Cycle Number (n)
Cap
acity
(C/g
)
Cyclic Voltammetry0
20
40
60
80
100
Coulom
bic Efficiency (%)
d
0 20 40 60 80 100 120 140
2.0
2.2
2.4
2.6
2.8 a
Cycle 10 Cycle 100 Cycle 1000 Cycle 10000
Galvanostatic Cycling30C; 2 - 2.8 V vs. Li/Li+
Volta
ge (V
vs.
Li/L
i+ )
Capacity (mAh/g)
1.8 2.0 2.2 2.4 2.6 2.8 3.0
-0.3
-0.2
-0.1
0.0
0.1
0.2
0.3
0.4
Cyclic Voltammetry10 mV/s; 2 - 2.8 V vs. Li/Li+
Cycle 10 Cycle 100 Cycle 1000 Cycle 10000
Cur
rent
(mA)
Voltage (V vs. Li/Li+)
c Cycle 100.22 V
Cycle 100000.03 V
0.05 VCycle 100
0 20 40 60 80 1000
100
200
300
400
500
Sweep rate (mVs-1)
Cap
acita
nce
(Fg-1
)
Reduced MoO3-x
Fully Oxidized MoO3
© 2016 Macmillan Publishers Limited, part of Springer Nature. All rights reserved.
NATURE MATERIALS | www.nature.com/naturematerials 13
SUPPLEMENTARY INFORMATIONDOI: 10.1038/NMAT4810
14
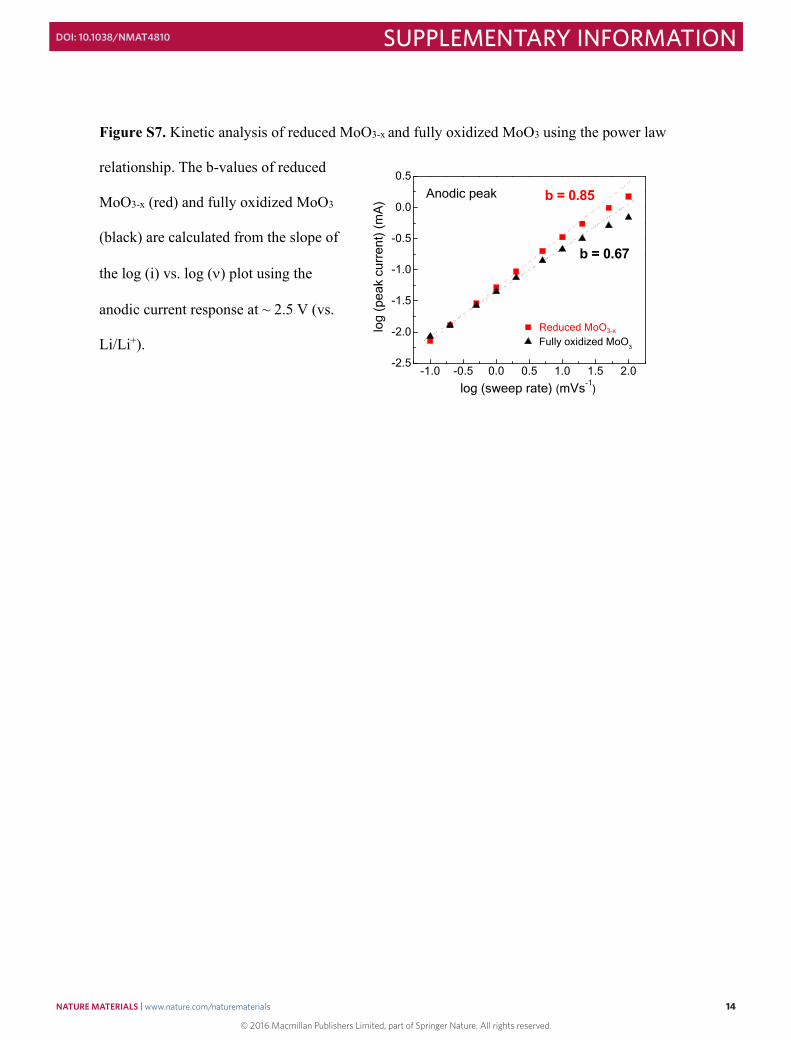
Figure S7. Kinetic analysis of reduced MoO3-x and fully oxidized MoO3 using the power law
relationship. The b-values of reduced
MoO3-x (red) and fully oxidized MoO3
(black) are calculated from the slope of
the log (i) vs. log () plot using the
anodic current response at ~ 2.5 V (vs.
Li/Li+).
-1.0 -0.5 0.0 0.5 1.0 1.5 2.0-2.5
-2.0
-1.5
-1.0
-0.5
0.0
0.5
log (sweep rate) (mVs-1
)lo
g (p
eak
curr
ent)
(mA
) Anodic peak
b = 0.67
b = 0.85
Reduced MoO3-x
Fully oxidized MoO3
© 2016 Macmillan Publishers Limited, part of Springer Nature. All rights reserved.
NATURE MATERIALS | www.nature.com/naturematerials 14
SUPPLEMENTARY INFORMATIONDOI: 10.1038/NMAT4810
15
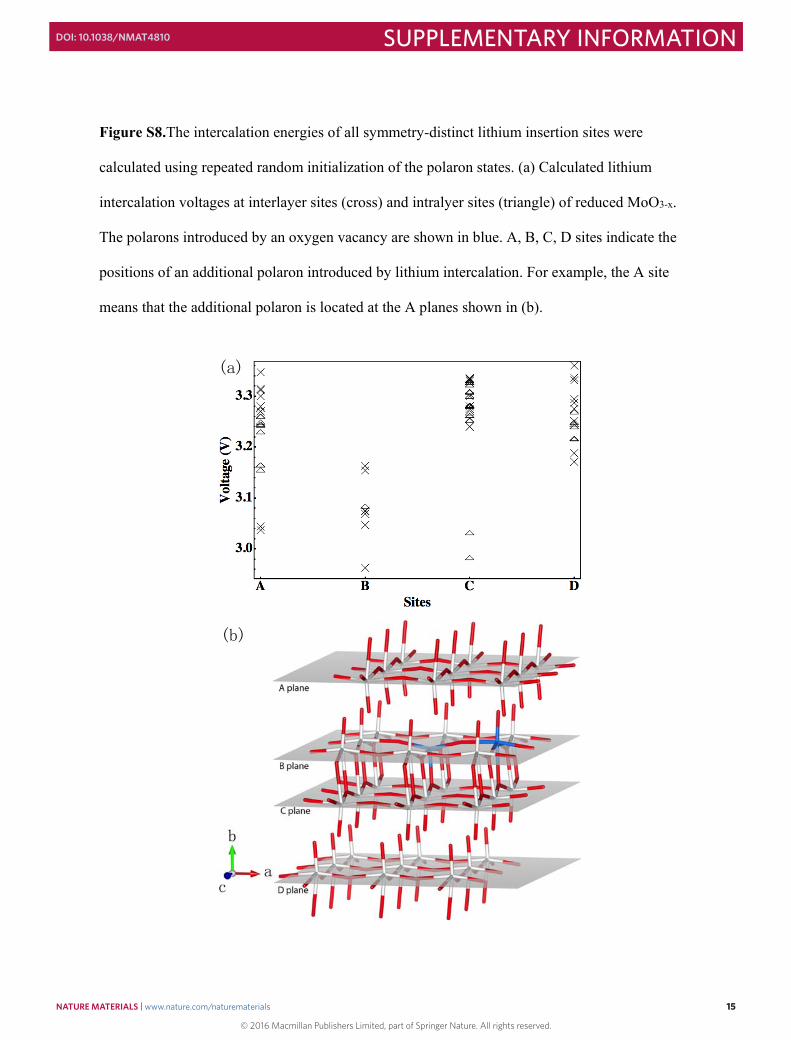
Figure S8.The intercalation energies of all symmetry-distinct lithium insertion sites were
calculated using repeated random initialization of the polaron states. (a) Calculated lithium
intercalation voltages at interlayer sites (cross) and intralyer sites (triangle) of reduced MoO3-x.
The polarons introduced by an oxygen vacancy are shown in blue. A, B, C, D sites indicate the
positions of an additional polaron introduced by lithium intercalation. For example, the A site
means that the additional polaron is located at the A planes shown in (b).
(a)
(b)
© 2016 Macmillan Publishers Limited, part of Springer Nature. All rights reserved.
NATURE MATERIALS | www.nature.com/naturematerials 15
SUPPLEMENTARY INFORMATIONDOI: 10.1038/NMAT4810

16
Discussions regarding polaron configurations after lithium intercalation.
As shown in Fig. S8, our results indicate that the additional polaron introduced by lithium
intercalation does not favor the B plane, where the oxygen defect induced polarons are located.
In other words polarons are unlikely to remain together as the polaron concentration increases
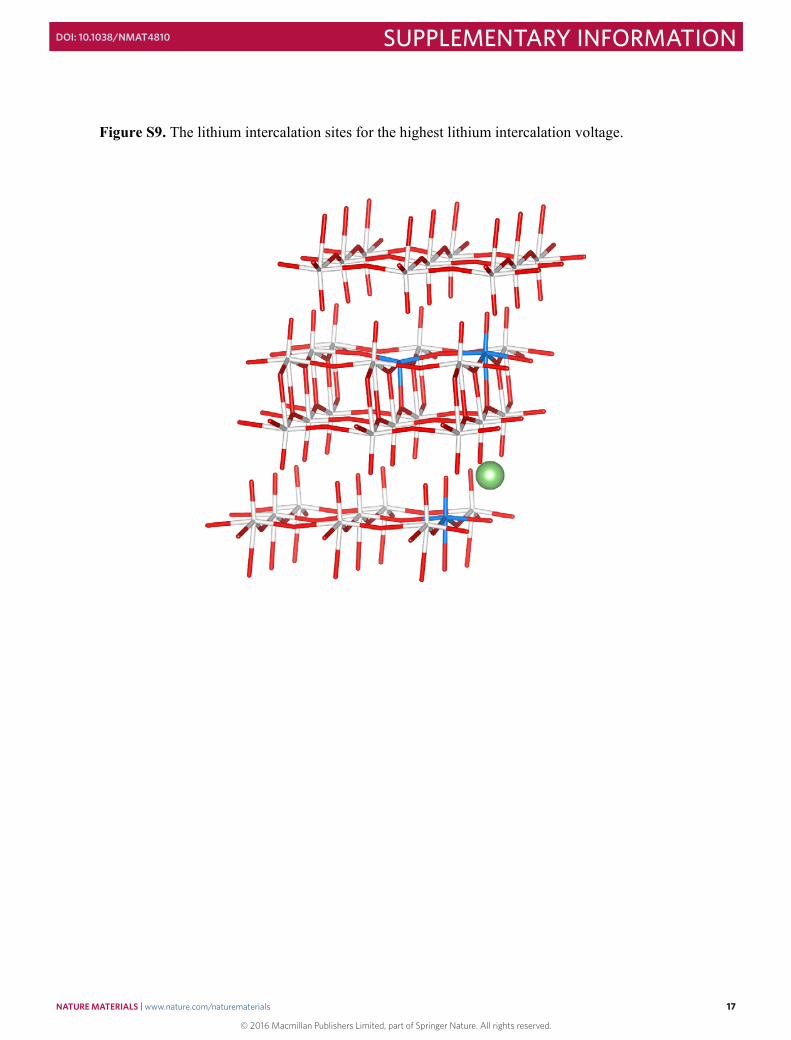
from 0.22 to 0.33 within the same plane. The highest intercalation energy corresponds to the
structure in which the lithium ion at the interlayer site is far from the oxygen vacancy center (6.3
Å) and the additional polaron introduced along with the lithium ion is not in the same layer as
those polarons introduced by an oxygen vacancy (see Fig. S9).
An explanation regarding the additional peak during the cathodic sweep
The calculated voltage difference between reduced MoO3-x and fully oxidized MoO3
explain the new peak at 3.0 V in the CV of reduced MoO3-x (see Fig. 3e). Compared to lithium
intercalation in fully oxidized MoO3, oxygen vacancies in the reduced MoO3-x might release the
structural strain energy during the lithium intercalation and lead to higher voltages. Therefore,
the new peak is only observed in the reduced MoO3-x. In the discharge process, this new peak is
less distinctive than that in the charge process, because lithium ions might not migrate directly
from the electrolyte to the high voltage sites in reduced MoO3-x.Instead, the weak signal of the
new peak in the discharge process is contributed by the diffusion of lithium from the electrolyte
to the high voltage sites existing near the interface between electrode and electrolyte.
© 2016 Macmillan Publishers Limited, part of Springer Nature. All rights reserved.
NATURE MATERIALS | www.nature.com/naturematerials 16
SUPPLEMENTARY INFORMATIONDOI: 10.1038/NMAT4810
17
Figure S9. The lithium intercalation sites for the highest lithium intercalation voltage.
© 2016 Macmillan Publishers Limited, part of Springer Nature. All rights reserved.
NATURE MATERIALS | www.nature.com/naturematerials 17
SUPPLEMENTARY INFORMATIONDOI: 10.1038/NMAT4810
18
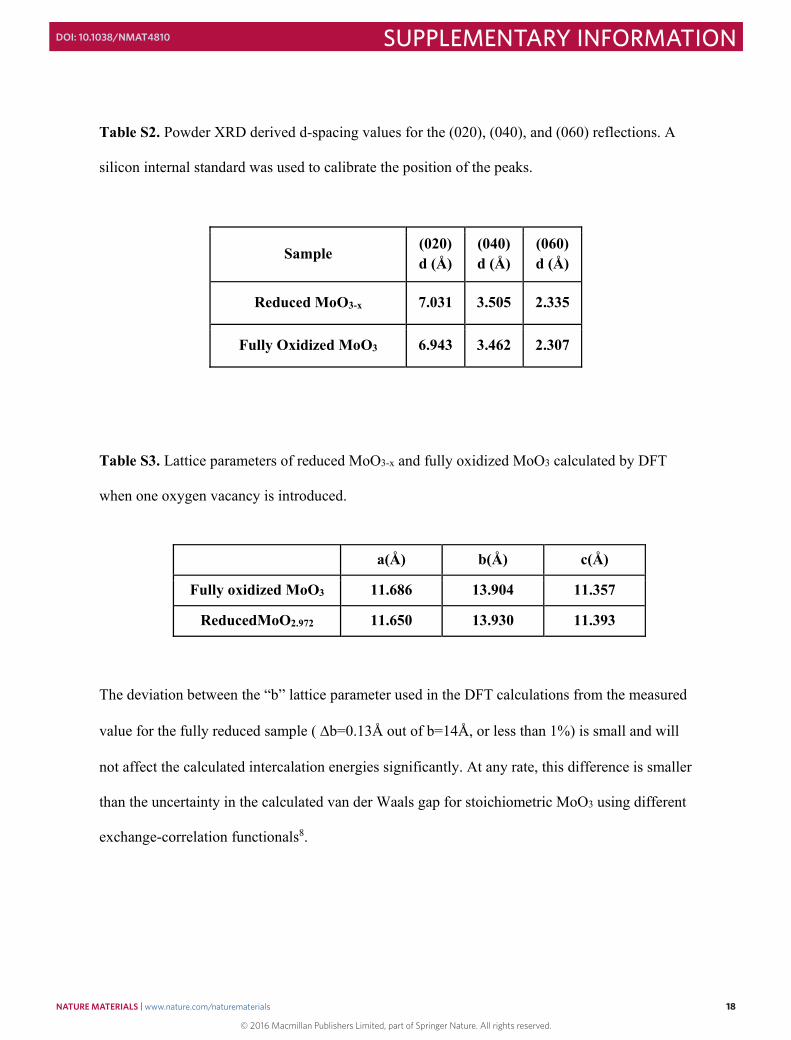
Table S2. Powder XRD derived d-spacing values for the (020), (040), and (060) reflections. A
silicon internal standard was used to calibrate the position of the peaks.
Table S3. Lattice parameters of reduced MoO3-x and fully oxidized MoO3 calculated by DFT
when one oxygen vacancy is introduced.
The deviation between the “b” lattice parameter used in the DFT calculations from the measured
value for the fully reduced sample (b=0.13Å out of b=14Å, or less than 1%) is small and will
not affect the calculated intercalation energies significantly. At any rate, this difference is smaller
than the uncertainty in the calculated van der Waals gap for stoichiometric MoO3 using different
exchange-correlation functionals8.
Sample (020) d (Å)
(040) d (Å)
(060) d (Å)
Reduced MoO3-x 7.031 3.505 2.335
Fully Oxidized MoO3 6.943 3.462 2.307
a(Å) b(Å) c(Å)
Fully oxidized MoO3 11.686 13.904 11.357
ReducedMoO2.972 11.650 13.930 11.393
© 2016 Macmillan Publishers Limited, part of Springer Nature. All rights reserved.
NATURE MATERIALS | www.nature.com/naturematerials 18
SUPPLEMENTARY INFORMATIONDOI: 10.1038/NMAT4810
19
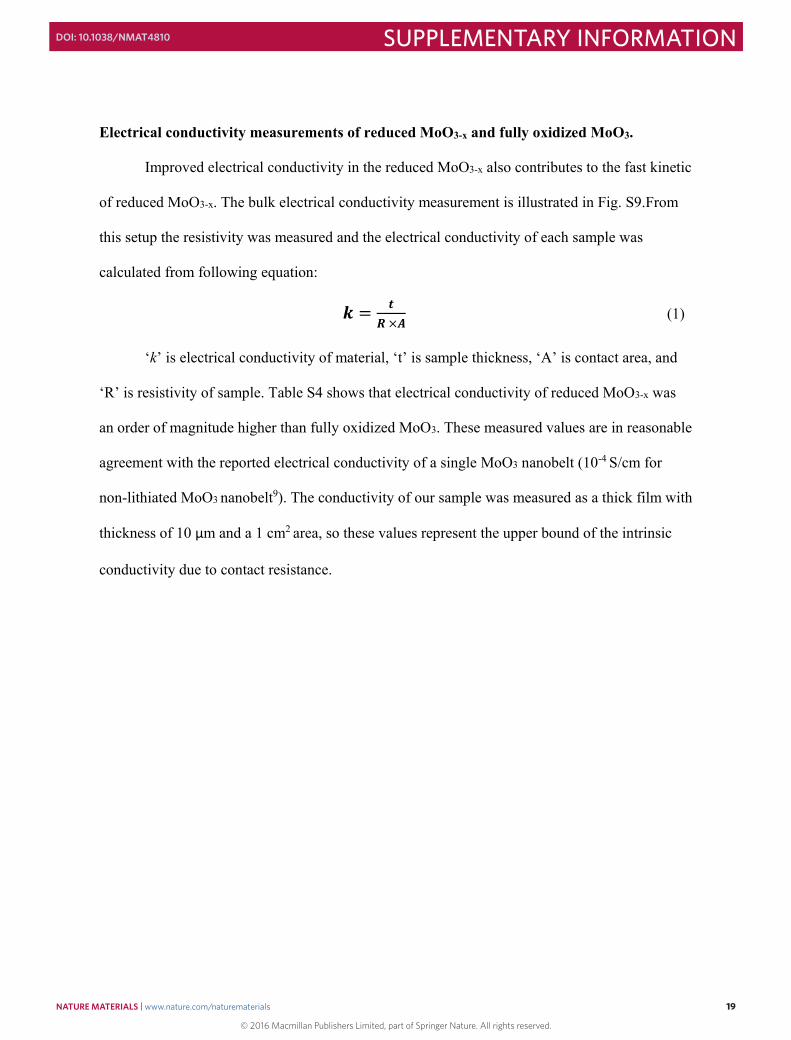
Electrical conductivity measurements of reduced MoO3-x and fully oxidized MoO3.
Improved electrical conductivity in the reduced MoO3-x also contributes to the fast kinetic
of reduced MoO3-x. The bulk electrical conductivity measurement is illustrated in Fig. S9.From
this setup the resistivity was measured and the electrical conductivity of each sample was
calculated from following equation:
� � ����(1)
‘k’ is electrical conductivity of material, ‘t’ is sample thickness, ‘A’ is contact area, and
‘R’ is resistivity of sample. Table S4 shows that electrical conductivity of reduced MoO3-x was
an order of magnitude higher than fully oxidized MoO3. These measured values are in reasonable
agreement with the reported electrical conductivity of a single MoO3 nanobelt (10-4 S/cm for
non-lithiated MoO3 nanobelt9). The conductivity of our sample was measured as a thick film with
thickness of 10 μm and a 1 cm2 area, so these values represent the upper bound of the intrinsic
conductivity due to contact resistance.
© 2016 Macmillan Publishers Limited, part of Springer Nature. All rights reserved.
NATURE MATERIALS | www.nature.com/naturematerials 19
SUPPLEMENTARY INFORMATIONDOI: 10.1038/NMAT4810
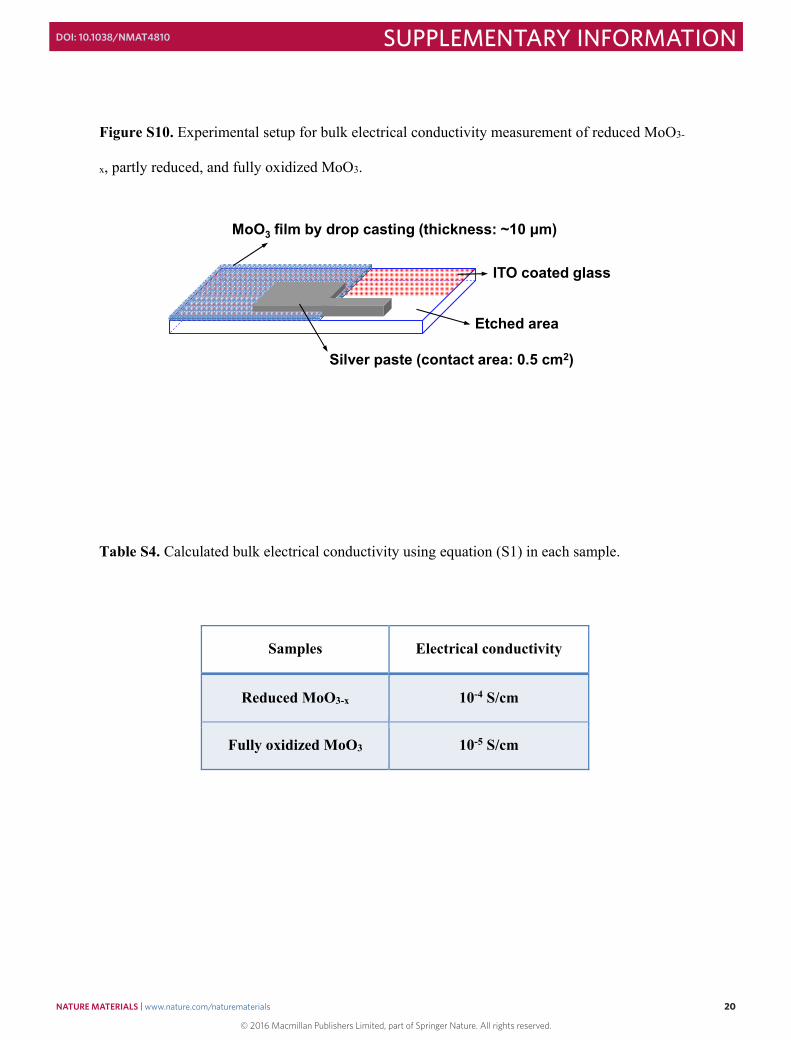
20
Figure S10. Experimental setup for bulk electrical conductivity measurement of reduced MoO3-
x, partly reduced, and fully oxidized MoO3.
Table S4. Calculated bulk electrical conductivity using equation (S1) in each sample.
Samples Electrical conductivity
Reduced MoO3-x 10-4 S/cm
Fully oxidized MoO3 10-5 S/cm
MoO3 film by drop casting (thickness: ~10 μm)
Silver paste (contact area: 0.5 cm2)
ITO coated glass
Etched area
© 2016 Macmillan Publishers Limited, part of Springer Nature. All rights reserved.
NATURE MATERIALS | www.nature.com/naturematerials 20
SUPPLEMENTARY INFORMATIONDOI: 10.1038/NMAT4810
21
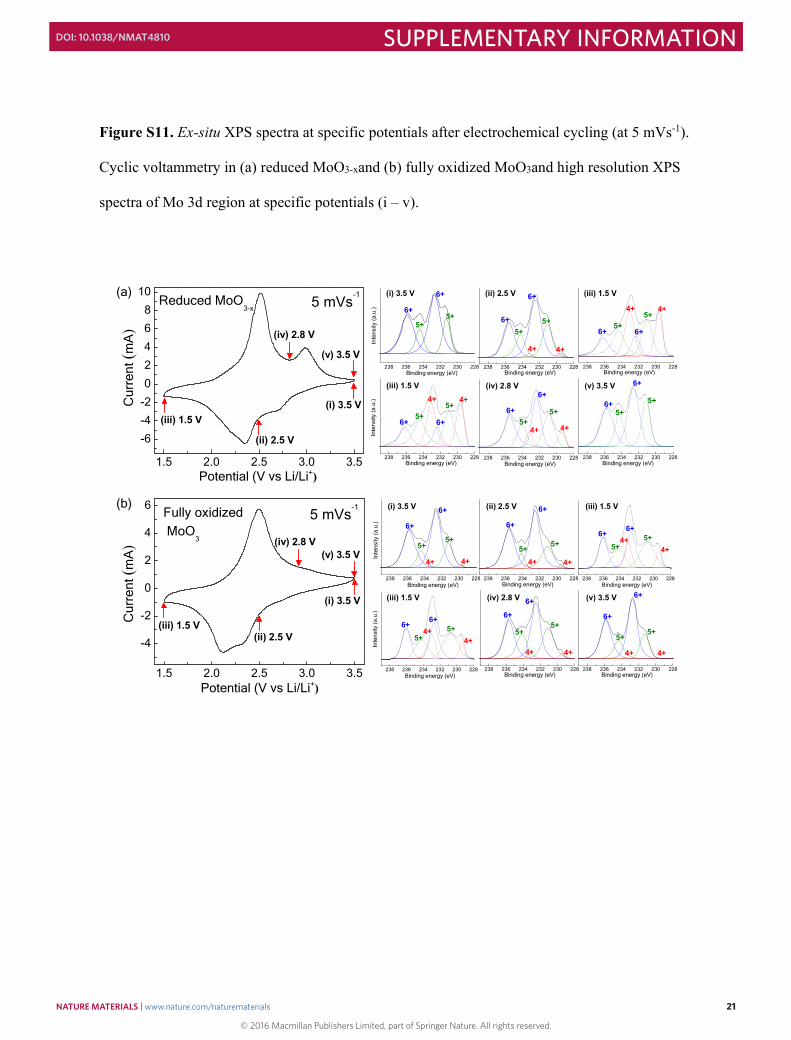
Figure S11. Ex-situ XPS spectra at specific potentials after electrochemical cycling (at 5 mVs-1).
Cyclic voltammetry in (a) reduced MoO3-xand (b) fully oxidized MoO3and high resolution XPS
spectra of Mo 3d region at specific potentials (i – v).
1.5 2.0 2.5 3.0 3.5
-6-4-202468
105 mVs-1Reduced MoO
3-x
Cur
rent
(mA
)
Potential (V vs Li/Li+)
(iv) 2.8 V
(v) 3.5 V
(iii) 1.5 V
(ii) 2.5 V
(i) 3.5 V
238 236 234 232 230 228
5+
6+
5+
6+
Binding energy (eV) In
tens
ity (a
.u.)
238 236 234 232 230 228Binding energy (eV)
4+4+
5+5+
6+
6+
238 236 234 232 230 228
4+4+
Binding energy (eV)
5+
6+5+
6+
238 236 234 232 230 228Binding energy (eV)
4+4+
5+
6+
5+6+
238 236 234 232 230 228Binding energy (eV)
5+
6+
5+6+
(i) 3.5 V (ii) 2.5 V (iii) 1.5 V
(iv) 2.8 V (v) 3.5 V
(a)
238 236 234 232 230 228 Binding energy (eV)
In
tens
ity (a
.u.) 4+4+
5+
6+5+
6+
(iii) 1.5 V
1.5 2.0 2.5 3.0 3.5
-4
-2
0
2
4
6
Potential (V vs Li/Li+)
Cur
rent
(mA
)
Fully oxidized MoO
3
5 mVs-1
(v) 3.5 V(iv) 2.8 V
(iii) 1.5 V(ii) 2.5 V
(i) 3.5 V
238 236 234 232 230 228Binding energy (eV)
Inte
nsity
(a.u
.)
4+4+
5+
6+
5+
6+
238 236 234 232 230 228Binding energy (eV)
4+4+
5+
6+
5+
6+
238 236 234 232 230 228Binding energy (eV)
4+4+
5+
6+
5+
6+
238 236 234 232 230 228Binding energy (eV)
4+4+
5+
6+
5+
6+
(i) 3.5 V (ii) 2.5 V (iii) 1.5 V
(iv) 2.8 V (v) 3.5 V
(b)
(iii) 1.5 V
238 236 234 232 230 228Binding energy (eV)
4+4+ 5+
6+
5+6+
238 236 234 232 230 228
Inte
nsity
(a.u
.)
Binding energy (eV)
4+4+ 5+
6+
5+6+
© 2016 Macmillan Publishers Limited, part of Springer Nature. All rights reserved.
NATURE MATERIALS | www.nature.com/naturematerials 21
SUPPLEMENTARY INFORMATIONDOI: 10.1038/NMAT4810
22
References
1. Cheng, J., Sulpizi, M., VandeVondele, J. & Sprik, M. Hole localization and
thermochemistry of oxidative dehydrogenation of aqueous rutile TiO2(110).
Chemcatchem 4, 636-640 (2012).
2. Zhou, F. et al. First-principles prediction of redox potentials in transition-metal
compounds with LDA + U. Phys. Rev. B 70, (2004).
3. Ong, S. P., Chevrier, V. L. & Ceder, G. Comparison of small polaron migration and
phase separation in olivine LiMnPO4 and LiFePO4 using hybrid density functional
theory. Phys. Rev. B 83, (2011).
4. Ding, H. et al. Computational investigation of electron small polarons in alpha-MoO3. J.
Phys. Chem. C 118, 15565-15572 (2014).
5. Coquet, R. & Willock, D. J. The (010) surface of α-MoO3, a DFT + U study. Phys. Chem.
Chem. Phys. 7, 3819-3828 (2005).
6. Lei, Y.-H. & Chen, Z.-X. DFT+U study of properties of MoO3 and hydrogen adsorption
on MoO3(010). J. Phys. Chem. C 116, 25757-25764 (2012).
7. Ding, H. et al. Computational investigation of electron small polarons in alpha-MoO3. J.
Phys. Chem. C 118, 15565-15572 (2014).
8. Ding, H., Ray, K. G., Ozolins, V. & Asta, M. Structural and vibrational properties of
alpha-MoO3 from van der Waals corrected density functional theory calculations. Phys.
Rev. B 85, (2012).
9. Mai, L. et al. Lithiated MoO3 nanobelts with greatly improved performance for lithium
batteries. Adv. Mater. 19, 3712-3716 (2007).
© 2016 Macmillan Publishers Limited, part of Springer Nature. All rights reserved.
NATURE MATERIALS | www.nature.com/naturematerials 22
SUPPLEMENTARY INFORMATIONDOI: 10.1038/NMAT4810


![The prevalence of surface oxygen vacancies over the ...Nanocubes Nanostructures Crystal size Morphology Toluene Surface oxygen vacancies ... ity in zirconium-doped ceria [15]. However,](https://img.pdfslide.net/doc/110x75/5f1ea2eb43495322d6612a8a/the-prevalence-of-surface-oxygen-vacancies-over-the-nanocubes-nanostructures.jpg)


![Influence of oxygen vacancy defects and cobalt doping on ... 48 02.pdf · influencing its electronic structure and making it con-ductive [4]. As oxygen vacancies play a critical](https://img.pdfslide.net/doc/110x75/5faa69b35b0b2852e7567cb9/iniuence-of-oxygen-vacancy-defects-and-cobalt-doping-on-48-02pdf-iniuencing.jpg)