Embed Size (px)
Citation preview
Analysts who prepared this report are registered as research analysts in Indonesia but not in any other jurisdiction, including the U.S.
PLEASE SEE ANALYST CERTIFICATIONS AND IMPORTANT DISCLOSURES & DISCLAIMERS IN APPENDIX 1 AT THE END OF REPORT.
Pakuwon Jati (PWON IJ)
King of recurring income
Expert in property-leasing and property-selling
Pakuwon Jati (PWON) has exhibited resilient performance over the years, which we ascribe to the company’s solid property-leasing (recorded as recurring income) and strong property-selling (recorded as marketing sales) activities. We like PWON for its strong profile of retail malls compared to its competitors. PWON’s 32 years of experience in managing and leasing retail malls has made solid positioning in consumers’ minds, which led the company to enjoy higher occupancy rate compared to its competitors (Occupancy rate: PWON 95% vs. Jakarta average 92%). We also like the fact that the company 1) is aggressively expanding new retail malls, 2) has well-diversified lease expiration profile, 3) is able to benefit from sustainable rental price increase, and 4) has relatively young profile of retail malls. PWON’s solid property-selling activities also contribute as strong pillars of its earnings. PWON’s marketing sales performance excelled other developers in 1Q16 – an evidence of property-selling expertise. With sound revenue stemming from both property-leasing and property-selling, we are confident that PWON’s earnings will continue to improve.
Prudent ability to utilize its assets and leverages
We value the company’s sound activity ratio as it greatly excelled its peers’ performances. PWON’s ability to sell its property inventories is fast with only 407 days of inventory – one of the key traits behind its resilient marketing sales performance. The company’s ability to employ its current assets and liabilities to generate cash is also satisfying with only 410 cash conversion cycle days. All in all, given the company’s prudent ability to utilize its assets and leverages, we are confident PWON’s balance sheet will remain concrete going forward.
Safe and sound; Initiate coverage with a Buy call
We initiate coverage on PWON with a Buy recommendation and a 12-month forward target price of IDR650 (representing an upside of 20.4% from current price) valued at 19.1x on our implied forward P/E ratio, below +1 SD of its historical 5-year trailing P/E of 23x. Our target price was derived by applying 4.5% perpetual growth rate, 7.5% risk free rate and 8% market risk premium into our DCF calculation. We believe our rich valuation on PWON is justified by the following arguments: 1) Strongest recurring income among developers stemming from sound and young retail malls profile, 2) Property market leader in Indonesia’s second largest economy (i.e., Surabaya), and 3) Solid property-selling performance despite sluggish economy backdrop and also excelling peer developers’ performance. Key risks to our investment call include weakening of purchasing power, greater-than-expected competition, and slower payment from mall tenants.
FY (Dec) 2012 2013 2014 2015 2016F 2017F Revenue (IDRbn) 2,165.4 3,029.8 3,872.3 4,625.1 6,168.8 7,545.8 Operating profit (IDRbn) 1,062.3 1,511.9 1,889.3 2,264.6 2,947.9 3,606.0 OP margin 49.1 49.9 48.8 49.0 47.8 47.8 NP (IDRbn) 748.0 1,132.8 2,515.2 1,261.9 1,635.0 2,037.6 EPS (IDR) 15.5 23.5 52.2 26.2 34.0 42.3 BPS (IDR) 60.5 80.6 128.0 149.9 179.6 216.6 P/E (x) 36.1 23.8 10.7 21.4 16.5 13.2 ROE (%) 25.7 29.2 40.8 17.5 18.9 19.5 Note: All figures are based on consolidated PSAK; NP refers to net profit attributable to controlling interests Source: Company data, Bloomberg estimates
Property
Initiation Report June 13, 2016
Recommendation Buy
Target Price (12M, IDR) 650
Share Price (6/10/16, IDR) 540
Expected Return 20.4%
Consensus OP (16F, IDRbn) 2,803
EPS Growth (16F, %) 29.9 P/E (16F, x) 19.1 Industry P/E (16F, x) 12.9 Benchmark P/E (16F, x) 14.9
Market Cap (IDRbn) 26,006.2 Shares Outstanding (mn) 48,159.6 Free Float (mn) 23,017.9 Institutional Ownership (%) 44.6 Beta (Adjusted, 24M) 1.6 52-Week Low (IDR) 313 52-Week High (IDR) 580
(%) 1M 6M 12M Absolute 11.1 15.6 35.0 Relative 9.3 7.1 36.7
PT Daewoo Securities Indonesia Developers Franky Rivan +62-21-515-1140 [email protected]

Pakuwon Jati
2
June 13, 2016
Daewoo Securities Research
Daewoo Securities Research
C O N T E N T S
Key charts 3
Company snapshot 4
Company in brief 4 Shareholder structure 6 Management team 6 Property portfolio 7
Operations and financials 10
Strong retail malls as earnings foundation 10 Property-selling as growth drivers 11 Concrete-strong balance sheets 13
REITs: Hurdles and obstacles 14
Brief introduction to the Real Estate Investment Trust (REIT) 14 Waiting for the right timing 15
Daewoo on-the-grounds 17
On the grounds checks 21
Valuations and recommendations 22
Pakuwon Jati
3
June 13, 2016
Daewoo Securities Research
Daewoo Securities Research
Key charts
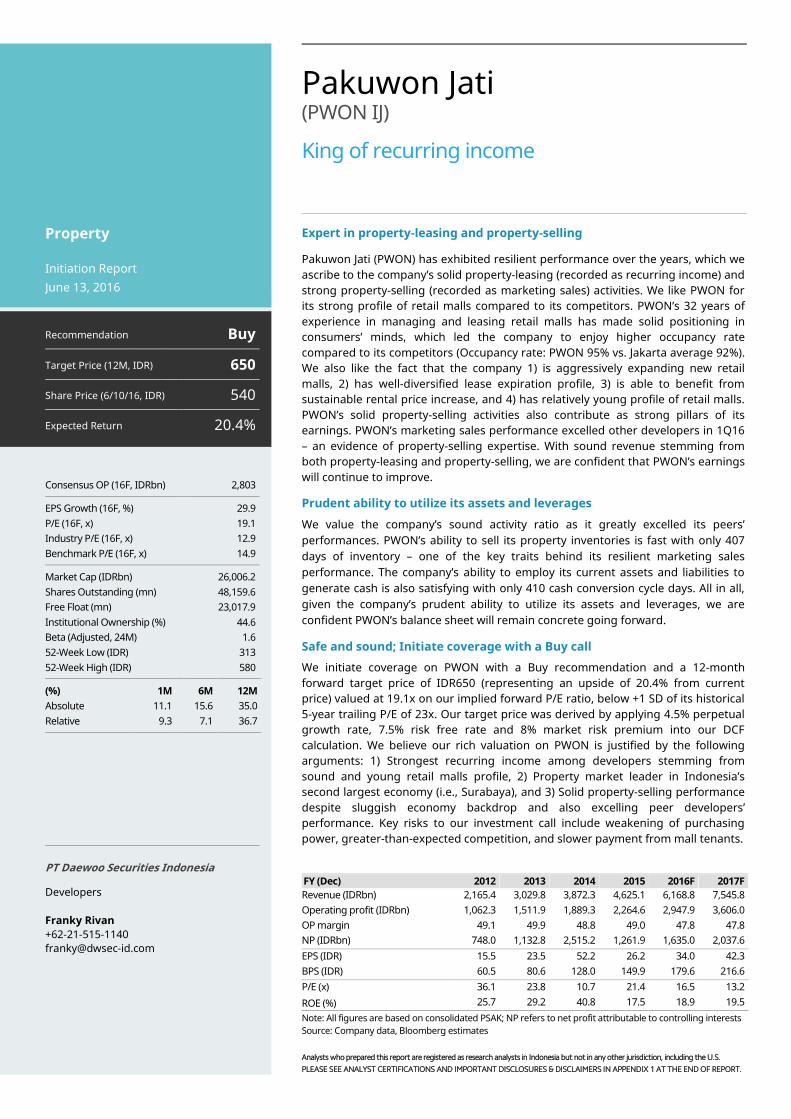
Figure 1. Revenue of five largest developers Figure 2. PWON’s revenue breakdown
Source: Company data, Daewoo Securities Research Note: Accumulated data from FY14-1Q16.
Source: Company data, Daewoo Securities Research
Figure 3. Relatively young investment property assets Figure 4. High and sustainable occupancy rate
Source: Company data, Daewoo Securities Research
Source: Company data, Colliers, Daewoo Securities Research
Figure 5. 1Q16 marketing sales achievement to target Figure 6. Days of inventory among developers
Source: Company data, Daewoo Securities Research
Source: Bloomberg, Daewoo Securities Research
0%
10%
20%
30%
40%
50%
60%
70%
80%
90%
100%
LPKR PWON SMRA BSDE CTRA
Development revenue Recurring income
0%
10%
20%
30%
40%
50%
60%
70%
80%
90%
100%
2013 2014 2015 1Q16
Landed housessales
Condo sales
Office & othersales
Hotel & servicedapartments
Office leasing
Retail mallsleasing
35.1
29.5
27.2
18.4 18.7
0
5
10
15
20
25
30
35
40
BSDE SMRA CTRA LPKR PWON
(years)
0
2
4
6
8
10
12
14
16
18
20
PWON BSDE SMRA LPKR
(% to target)
0
200
400
600
800
1,000
1,200
1,400
1,600
2010 2011 2012 2013 2014 2015 1Q16
PWON BSDE SMRA LPKR CTRA(days)
93.0
95.1
95.3 95.394.7
87
89
91
93
95
97
99
101
2012 2013 2014 2015 1Q16
Tunjungan Plaza
Kota KasablankaMall
Gandaria CityMall
SupermalPakuwon Indah
Pakuwon TradeCenter
Royal Plaza
Blok M Plaza
PWON average
Jakarta CBDaverage
(%)
Pakuwon Jati
4
June 13, 2016
Daewoo Securities Research
Daewoo Securities Research
Company snapshot
Company in brief
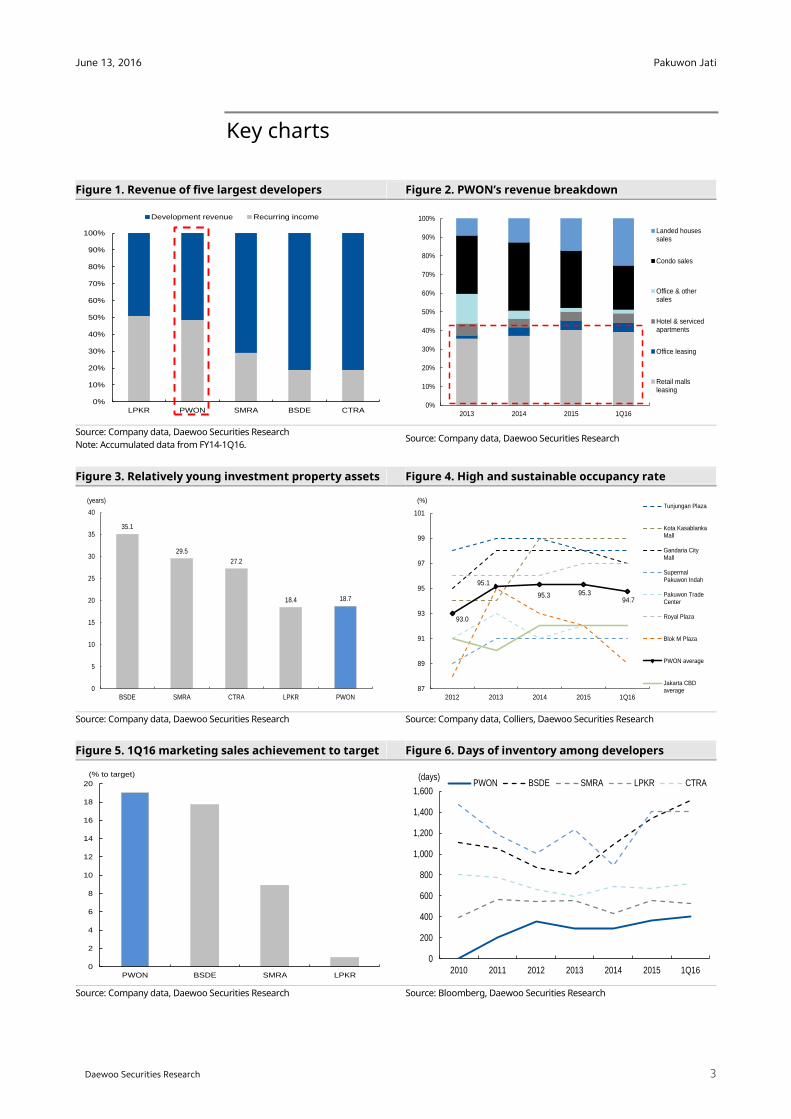
Pakuwon Jati is an Indonesia-based company primarily engaged in property developing, listed in the Indonesian market. The company was established in September 20th, 1982 in Jakarta to develop the first modern mall in Surabaya (i.e., Tunjungan Plaza). In 1989, it became the first Indonesian developer to list its share on the Jakarta Stock Exchange with PWON ticker (Bloomberg: PWON IJ, Reuters: PWON.JK). Began with only one retail mall in Surabaya, it became one of the largest developers with IDR19.3tr assets including 9 property portfolio thorough Jakarta and Surabaya.
Figure 7. PWON’s footprints
Source: Company data, Daewoo Securities Research
Niche characteristics
Each developer companies in Indonesia possess unique characteristic of its own. Key traits separating PWON from other developers are:
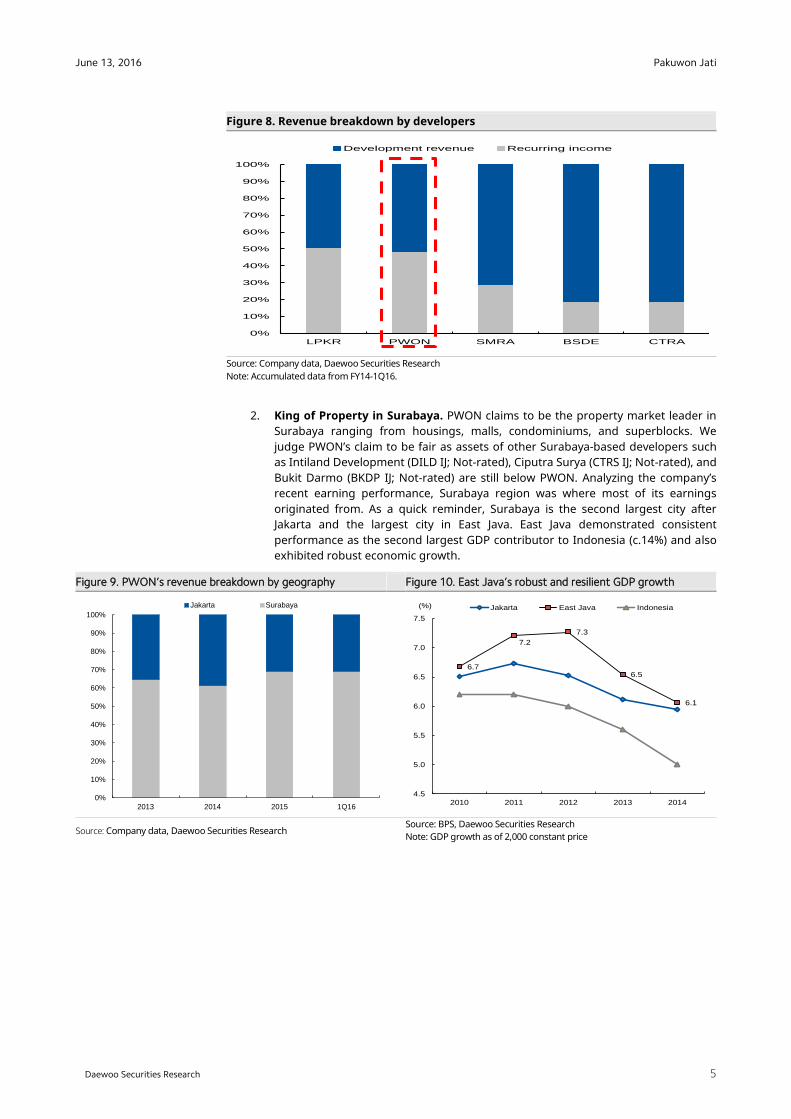
1. Stable and high recurring income. Started as a mall developer and operator in Surabaya, PWON is one of the developers with high exposures to recurring income. Hence, dissecting its revenue performance, PWON exhibits minimum revenue volatility amongst other developers. Although Lippo Karawaci (LPKR) has the highest recurring income, we suspect that its recurring income is unsustainable given its recurring income stems from Siloam Hospital (SILO; which is suffering from a margin squeeze).
Pakuwon Jati
5
June 13, 2016
Daewoo Securities Research
Daewoo Securities Research
Figure 8. Revenue breakdown by developers
Source: Company data, Daewoo Securities Research Note: Accumulated data from FY14-1Q16.
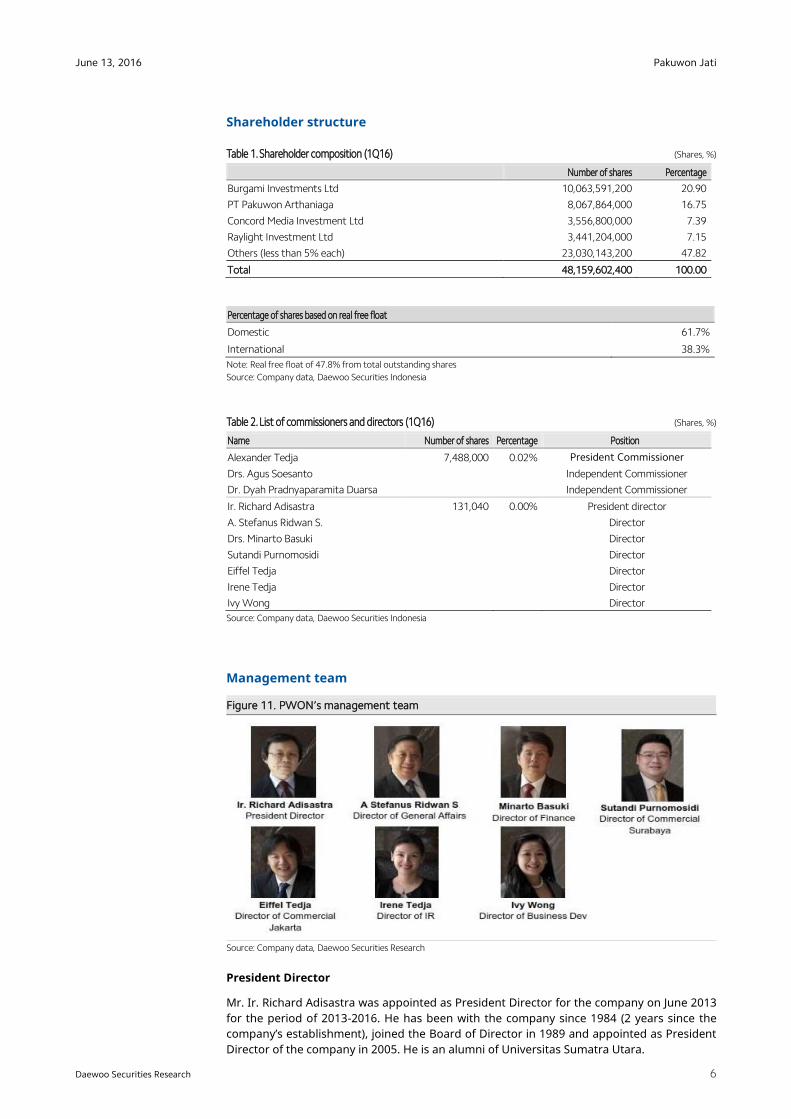
2. King of Property in Surabaya. PWON claims to be the property market leader in Surabaya ranging from housings, malls, condominiums, and superblocks. We judge PWON’s claim to be fair as assets of other Surabaya-based developers such as Intiland Development (DILD IJ; Not-rated), Ciputra Surya (CTRS IJ; Not-rated), and Bukit Darmo (BKDP IJ; Not-rated) are still below PWON. Analyzing the company’s recent earning performance, Surabaya region was where most of its earnings originated from. As a quick reminder, Surabaya is the second largest city after Jakarta and the largest city in East Java. East Java demonstrated consistent performance as the second largest GDP contributor to Indonesia (c.14%) and also exhibited robust economic growth.
Figure 9. PWON’s revenue breakdown by geography Figure 10. East Java’s robust and resilient GDP growth
Source: Company data, Daewoo Securities Research Source: BPS, Daewoo Securities Research Note: GDP growth as of 2,000 constant price
0%
10%
20%
30%
40%
50%
60%
70%
80%
90%
100%
LPKR PWON SMRA BSDE CTRA
Development revenue Recurring income
0%
10%
20%
30%
40%
50%
60%
70%
80%
90%
100%
2013 2014 2015 1Q16
Jakarta Surabaya
6.7
7.2
7.3
6.5
6.1
4.5
5.0
5.5
6.0
6.5
7.0
7.5
2010 2011 2012 2013 2014
Jakarta East Java Indonesia(%)
Pakuwon Jati
6
June 13, 2016
Daewoo Securities Research
Daewoo Securities Research
Shareholder structure
Table 1. Shareholder composition (1Q16) (Shares, %)
Number of shares Percentage
Burgami Investments Ltd 10,063,591,200 20.90
PT Pakuwon Arthaniaga 8,067,864,000 16.75
Concord Media Investment Ltd 3,556,800,000 7.39
Raylight Investment Ltd 3,441,204,000 7.15
Others (less than 5% each) 23,030,143,200 47.82
Total 48,159,602,400 100.00
Percentage of shares based on real free float
Domestic 61.7%
International 38.3%
Note: Real free float of 47.8% from total outstanding shares
Source: Company data, Daewoo Securities Indonesia
Table 2. List of commissioners and directors (1Q16) (Shares, %)
Name Number of shares Percentage Position
Alexander Tedja 7,488,000 0.02% President Commissioner
Drs. Agus Soesanto Independent Commissioner
Dr. Dyah Pradnyaparamita Duarsa Independent Commissioner
Ir. Richard Adisastra 131,040 0.00% President director
A. Stefanus Ridwan S. Director
Drs. Minarto Basuki Director
Sutandi Purnomosidi Director
Eiffel Tedja Director
Irene Tedja Director
Ivy Wong Director
Source: Company data, Daewoo Securities Indonesia
Management team
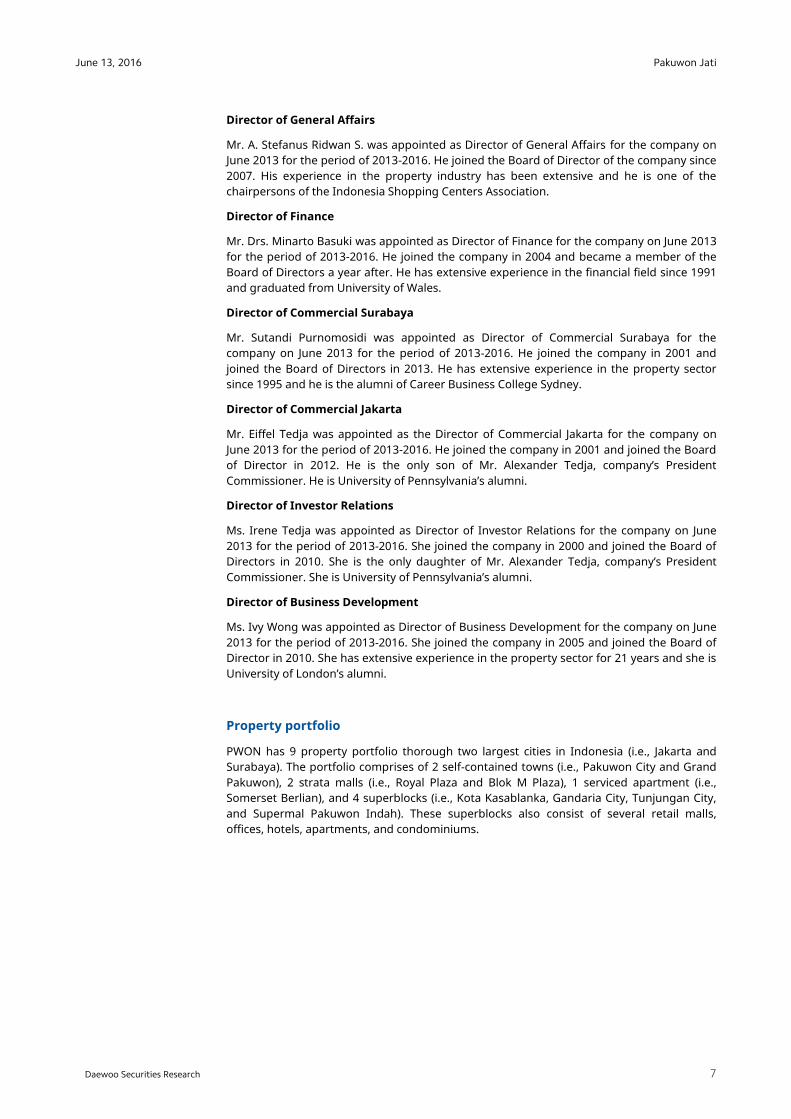
Figure 11. PWON’s management team
Source: Company data, Daewoo Securities Research
President Director
Mr. Ir. Richard Adisastra was appointed as President Director for the company on June 2013 for the period of 2013-2016. He has been with the company since 1984 (2 years since the company’s establishment), joined the Board of Director in 1989 and appointed as President Director of the company in 2005. He is an alumni of Universitas Sumatra Utara.
Pakuwon Jati
7
June 13, 2016
Daewoo Securities Research
Daewoo Securities Research
Director of General Affairs
Mr. A. Stefanus Ridwan S. was appointed as Director of General Affairs for the company on June 2013 for the period of 2013-2016. He joined the Board of Director of the company since 2007. His experience in the property industry has been extensive and he is one of the chairpersons of the Indonesia Shopping Centers Association.
Director of Finance
Mr. Drs. Minarto Basuki was appointed as Director of Finance for the company on June 2013 for the period of 2013-2016. He joined the company in 2004 and became a member of the Board of Directors a year after. He has extensive experience in the financial field since 1991 and graduated from University of Wales.
Director of Commercial Surabaya
Mr. Sutandi Purnomosidi was appointed as Director of Commercial Surabaya for the company on June 2013 for the period of 2013-2016. He joined the company in 2001 and joined the Board of Directors in 2013. He has extensive experience in the property sector since 1995 and he is the alumni of Career Business College Sydney.
Director of Commercial Jakarta
Mr. Eiffel Tedja was appointed as the Director of Commercial Jakarta for the company on June 2013 for the period of 2013-2016. He joined the company in 2001 and joined the Board of Director in 2012. He is the only son of Mr. Alexander Tedja, company’s President Commissioner. He is University of Pennsylvania’s alumni.
Director of Investor Relations
Ms. Irene Tedja was appointed as Director of Investor Relations for the company on June 2013 for the period of 2013-2016. She joined the company in 2000 and joined the Board of Directors in 2010. She is the only daughter of Mr. Alexander Tedja, company’s President Commissioner. She is University of Pennsylvania’s alumni.
Director of Business Development
Ms. Ivy Wong was appointed as Director of Business Development for the company on June 2013 for the period of 2013-2016. She joined the company in 2005 and joined the Board of Director in 2010. She has extensive experience in the property sector for 21 years and she is University of London’s alumni.
Property portfolio
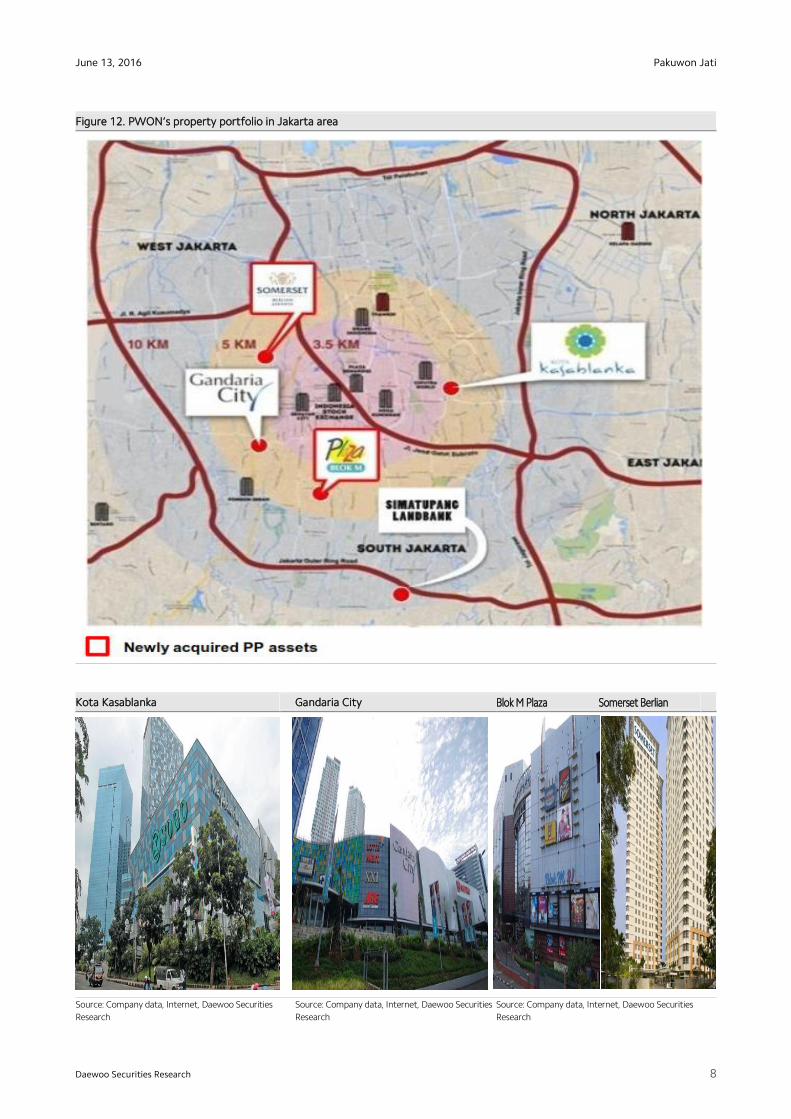
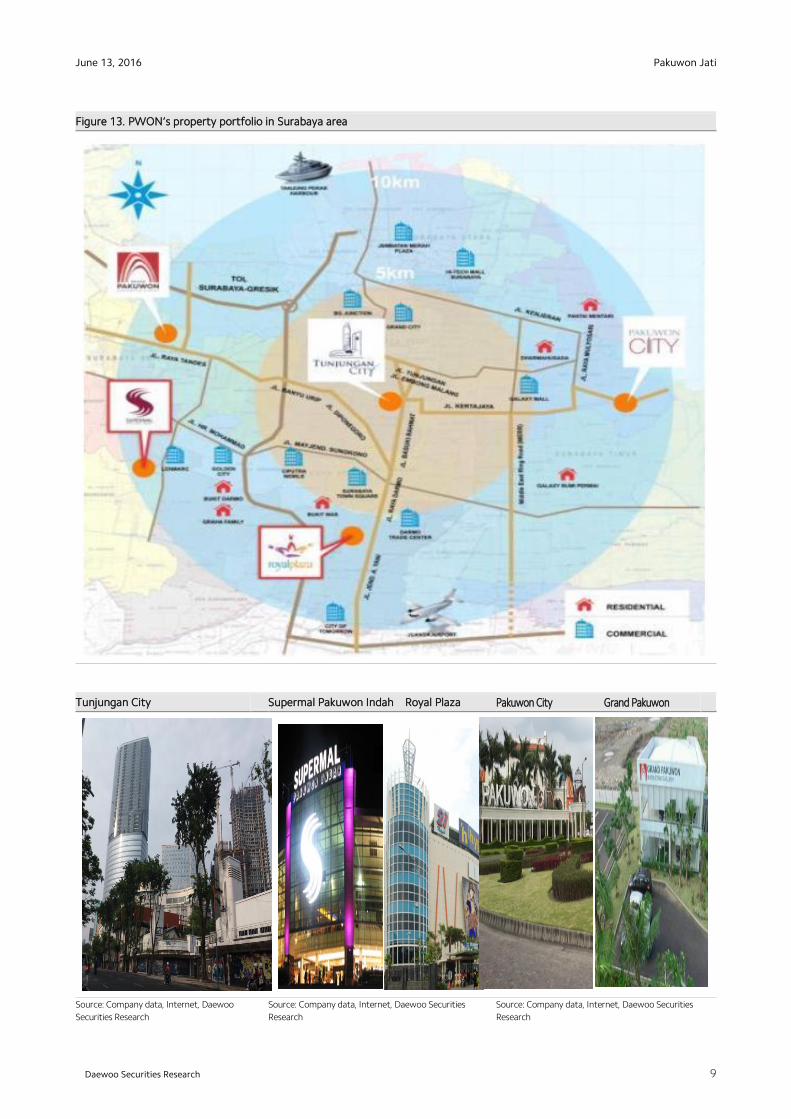
PWON has 9 property portfolio thorough two largest cities in Indonesia (i.e., Jakarta and Surabaya). The portfolio comprises of 2 self-contained towns (i.e., Pakuwon City and Grand Pakuwon), 2 strata malls (i.e., Royal Plaza and Blok M Plaza), 1 serviced apartment (i.e., Somerset Berlian), and 4 superblocks (i.e., Kota Kasablanka, Gandaria City, Tunjungan City, and Supermal Pakuwon Indah). These superblocks also consist of several retail malls, offices, hotels, apartments, and condominiums.
Pakuwon Jati
8
June 13, 2016
Daewoo Securities Research
Daewoo Securities Research
Figure 12. PWON’s property portfolio in Jakarta area
Kota Kasablanka Gandaria City Blok M Plaza Somerset Berlian
Source: Company data, Internet, Daewoo Securities
Research Source: Company data, Internet, Daewoo Securities
Research
Source: Company data, Internet, Daewoo Securities
Research
Pakuwon Jati
9
June 13, 2016
Daewoo Securities Research
Daewoo Securities Research
Figure 13. PWON’s property portfolio in Surabaya area
Tunjungan City Supermal Pakuwon Indah Royal Plaza Pakuwon City Grand Pakuwon
Source: Company data, Internet, Daewoo
Securities Research Source: Company data, Internet, Daewoo Securities
Research
Source: Company data, Internet, Daewoo Securities
Research
Pakuwon Jati
10
June 13, 2016
Daewoo Securities Research
Daewoo Securities Research
Operations and financials
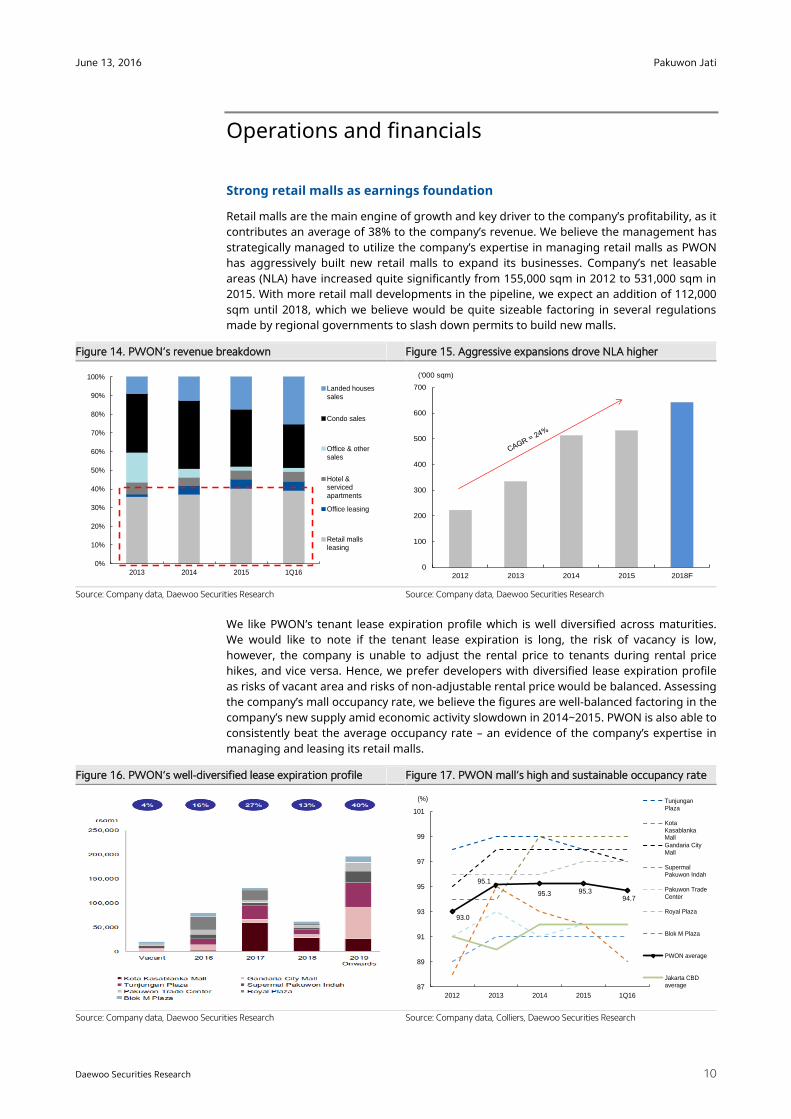
Strong retail malls as earnings foundation
Retail malls are the main engine of growth and key driver to the company’s profitability, as it contributes an average of 38% to the company’s revenue. We believe the management has strategically managed to utilize the company’s expertise in managing retail malls as PWON has aggressively built new retail malls to expand its businesses. Company’s net leasable areas (NLA) have increased quite significantly from 155,000 sqm in 2012 to 531,000 sqm in 2015. With more retail mall developments in the pipeline, we expect an addition of 112,000 sqm until 2018, which we believe would be quite sizeable factoring in several regulations made by regional governments to slash down permits to build new malls.
Figure 14. PWON’s revenue breakdown Figure 15. Aggressive expansions drove NLA higher
Source: Company data, Daewoo Securities Research
Source: Company data, Daewoo Securities Research
We like PWON’s tenant lease expiration profile which is well diversified across maturities. We would like to note if the tenant lease expiration is long, the risk of vacancy is low, however, the company is unable to adjust the rental price to tenants during rental price hikes, and vice versa. Hence, we prefer developers with diversified lease expiration profile as risks of vacant area and risks of non-adjustable rental price would be balanced. Assessing the company’s mall occupancy rate, we believe the figures are well-balanced factoring in the company’s new supply amid economic activity slowdown in 2014~2015. PWON is also able to consistently beat the average occupancy rate – an evidence of the company’s expertise in managing and leasing its retail malls.
Figure 16. PWON’s well-diversified lease expiration profile Figure 17. PWON mall’s high and sustainable occupancy rate
Source: Company data, Daewoo Securities Research
Source: Company data, Colliers, Daewoo Securities Research
0%
10%
20%
30%
40%
50%
60%
70%
80%
90%
100%
2013 2014 2015 1Q16
Landed housessales
Condo sales
Office & othersales
Hotel &servicedapartments
Office leasing
Retail mallsleasing
93.0
95.1
95.3 95.394.7
87
89
91
93
95
97
99
101
2012 2013 2014 2015 1Q16
TunjunganPlaza
KotaKasablankaMall
Gandaria CityMall
SupermalPakuwon Indah
Pakuwon TradeCenter
Royal Plaza
Blok M Plaza
PWON average
Jakarta CBDaverage
(%)
0
100
200
300
400
500
600
700
2012 2013 2014 2015 2018F
('000 sqm)
Pakuwon Jati
11
June 13, 2016
Daewoo Securities Research
Daewoo Securities Research
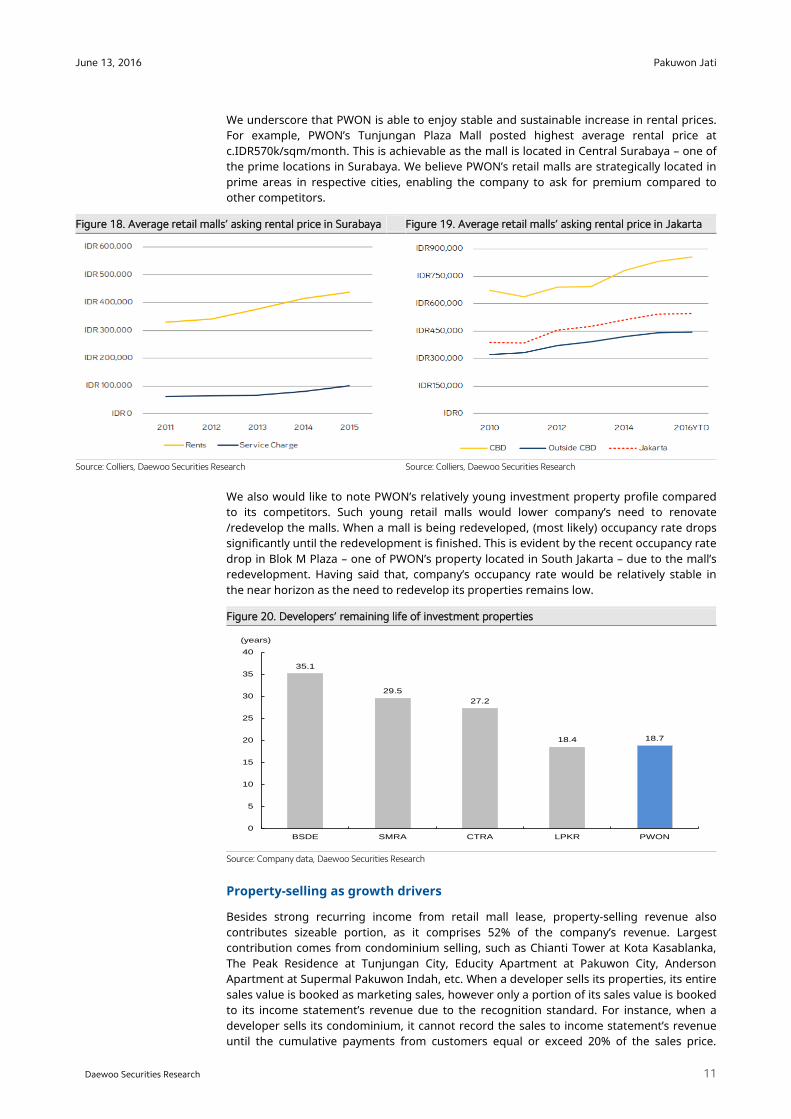
We underscore that PWON is able to enjoy stable and sustainable increase in rental prices. For example, PWON’s Tunjungan Plaza Mall posted highest average rental price at c.IDR570k/sqm/month. This is achievable as the mall is located in Central Surabaya – one of the prime locations in Surabaya. We believe PWON’s retail malls are strategically located in prime areas in respective cities, enabling the company to ask for premium compared to other competitors.
Figure 18. Average retail malls’ asking rental price in Surabaya Figure 19. Average retail malls’ asking rental price in Jakarta
Source: Colliers, Daewoo Securities Research
Source: Colliers, Daewoo Securities Research
We also would like to note PWON’s relatively young investment property profile compared to its competitors. Such young retail malls would lower company’s need to renovate /redevelop the malls. When a mall is being redeveloped, (most likely) occupancy rate drops significantly until the redevelopment is finished. This is evident by the recent occupancy rate drop in Blok M Plaza – one of PWON’s property located in South Jakarta – due to the mall’s redevelopment. Having said that, company’s occupancy rate would be relatively stable in the near horizon as the need to redevelop its properties remains low.
Figure 20. Developers’ remaining life of investment properties
Source: Company data, Daewoo Securities Research
Property-selling as growth drivers
Besides strong recurring income from retail mall lease, property-selling revenue also contributes sizeable portion, as it comprises 52% of the company’s revenue. Largest contribution comes from condominium selling, such as Chianti Tower at Kota Kasablanka, The Peak Residence at Tunjungan City, Educity Apartment at Pakuwon City, Anderson Apartment at Supermal Pakuwon Indah, etc. When a developer sells its properties, its entire sales value is booked as marketing sales, however only a portion of its sales value is booked to its income statement’s revenue due to the recognition standard. For instance, when a developer sells its condominium, it cannot record the sales to income statement’s revenue until the cumulative payments from customers equal or exceed 20% of the sales price.
35.1
29.5
27.2
18.4 18.7
0
5
10
15
20
25
30
35
40
BSDE SMRA CTRA LPKR PWON
(years)
Pakuwon Jati
12
June 13, 2016
Daewoo Securities Research
Daewoo Securities Research
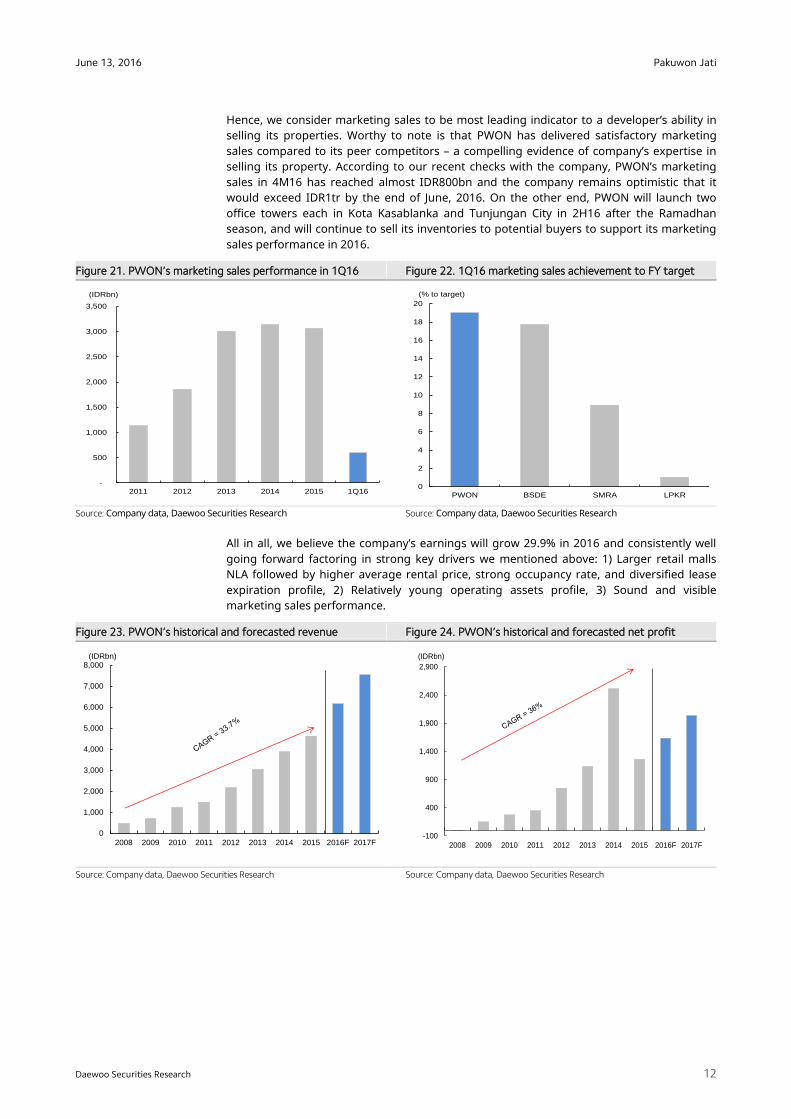
Hence, we consider marketing sales to be most leading indicator to a developer’s ability in selling its properties. Worthy to note is that PWON has delivered satisfactory marketing sales compared to its peer competitors – a compelling evidence of company’s expertise in selling its property. According to our recent checks with the company, PWON’s marketing sales in 4M16 has reached almost IDR800bn and the company remains optimistic that it would exceed IDR1tr by the end of June, 2016. On the other end, PWON will launch two office towers each in Kota Kasablanka and Tunjungan City in 2H16 after the Ramadhan season, and will continue to sell its inventories to potential buyers to support its marketing sales performance in 2016.
Figure 21. PWON’s marketing sales performance in 1Q16 Figure 22. 1Q16 marketing sales achievement to FY target
Source: Company data, Daewoo Securities Research
Source: Company data, Daewoo Securities Research
All in all, we believe the company’s earnings will grow 29.9% in 2016 and consistently well going forward factoring in strong key drivers we mentioned above: 1) Larger retail malls NLA followed by higher average rental price, strong occupancy rate, and diversified lease expiration profile, 2) Relatively young operating assets profile, 3) Sound and visible marketing sales performance.
Figure 23. PWON’s historical and forecasted revenue Figure 24. PWON’s historical and forecasted net profit
Source: Company data, Daewoo Securities Research
Source: Company data, Daewoo Securities Research
-
500
1,000
1,500
2,000
2,500
3,000
3,500
2011 2012 2013 2014 2015 1Q16
(IDRbn)
0
2
4
6
8
10
12
14
16
18
20
PWON BSDE SMRA LPKR
(% to target)
0
1,000
2,000
3,000
4,000
5,000
6,000
7,000
8,000
2008 2009 2010 2011 2012 2013 2014 2015 2016F 2017F
(IDRbn)
-100
400
900
1,400
1,900
2,400
2,900
2008 2009 2010 2011 2012 2013 2014 2015 2016F 2017F
(IDRbn)
Pakuwon Jati
13
June 13, 2016
Daewoo Securities Research
Daewoo Securities Research
Concrete-strong balance sheets
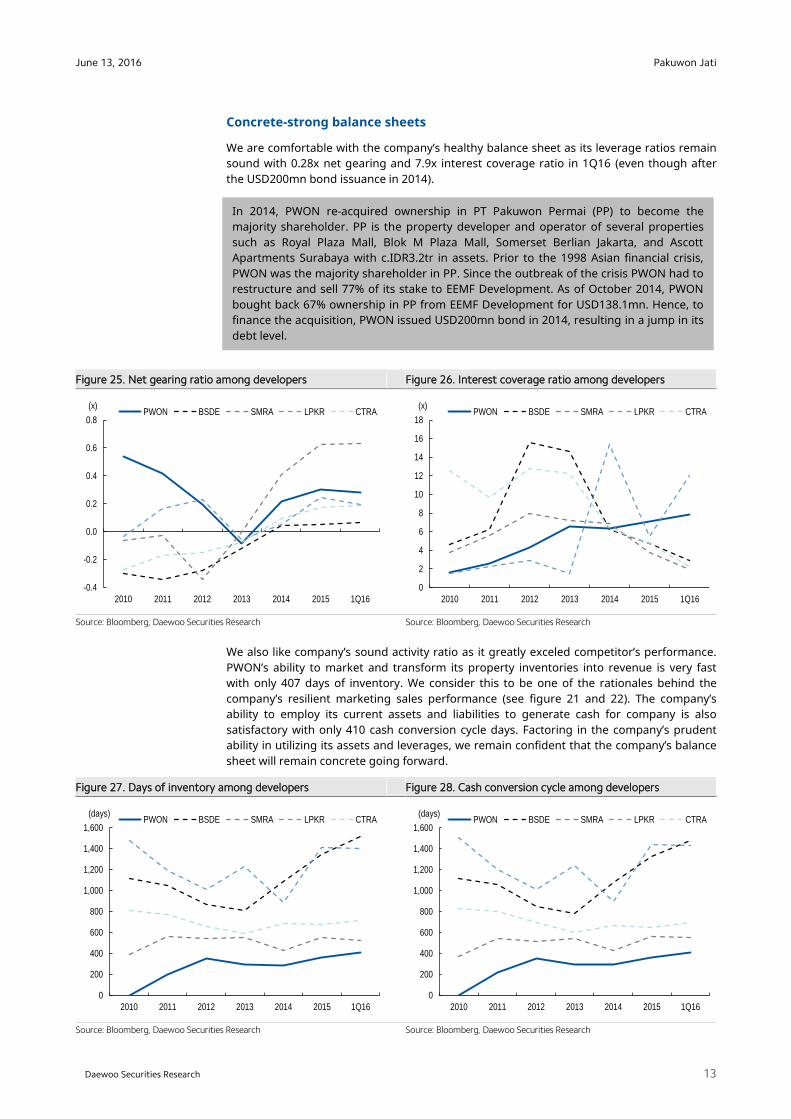
We are comfortable with the company’s healthy balance sheet as its leverage ratios remain sound with 0.28x net gearing and 7.9x interest coverage ratio in 1Q16 (even though after the USD200mn bond issuance in 2014).
Figure 25. Net gearing ratio among developers Figure 26. Interest coverage ratio among developers
Source: Bloomberg, Daewoo Securities Research
Source: Bloomberg, Daewoo Securities Research
We also like company’s sound activity ratio as it greatly exceled competitor’s performance. PWON’s ability to market and transform its property inventories into revenue is very fast with only 407 days of inventory. We consider this to be one of the rationales behind the company’s resilient marketing sales performance (see figure 21 and 22). The company’s ability to employ its current assets and liabilities to generate cash for company is also satisfactory with only 410 cash conversion cycle days. Factoring in the company’s prudent ability in utilizing its assets and leverages, we remain confident that the company’s balance sheet will remain concrete going forward.
Figure 27. Days of inventory among developers Figure 28. Cash conversion cycle among developers
Source: Bloomberg, Daewoo Securities Research
Source: Bloomberg, Daewoo Securities Research
In 2014, PWON re-acquired ownership in PT Pakuwon Permai (PP) to become the majority shareholder. PP is the property developer and operator of several properties such as Royal Plaza Mall, Blok M Plaza Mall, Somerset Berlian Jakarta, and Ascott Apartments Surabaya with c.IDR3.2tr in assets. Prior to the 1998 Asian financial crisis, PWON was the majority shareholder in PP. Since the outbreak of the crisis PWON had to restructure and sell 77% of its stake to EEMF Development. As of October 2014, PWON bought back 67% ownership in PP from EEMF Development for USD138.1mn. Hence, to finance the acquisition, PWON issued USD200mn bond in 2014, resulting in a jump in its debt level.
-0.4
-0.2
0.0
0.2
0.4
0.6
0.8
2010 2011 2012 2013 2014 2015 1Q16
PWON BSDE SMRA LPKR CTRA(x)
0
2
4
6
8
10
12
14
16
18
2010 2011 2012 2013 2014 2015 1Q16
PWON BSDE SMRA LPKR CTRA(x)
0
200
400
600
800
1,000
1,200
1,400
1,600
2010 2011 2012 2013 2014 2015 1Q16
PWON BSDE SMRA LPKR CTRA(days)
0
200
400
600
800
1,000
1,200
1,400
1,600
2010 2011 2012 2013 2014 2015 1Q16
PWON BSDE SMRA LPKR CTRA(days)
Pakuwon Jati
14
June 13, 2016
Daewoo Securities Research
Daewoo Securities Research
REITs: Hurdles and obstacles
Brief introduction to the Real Estate Investment Trust (REIT)
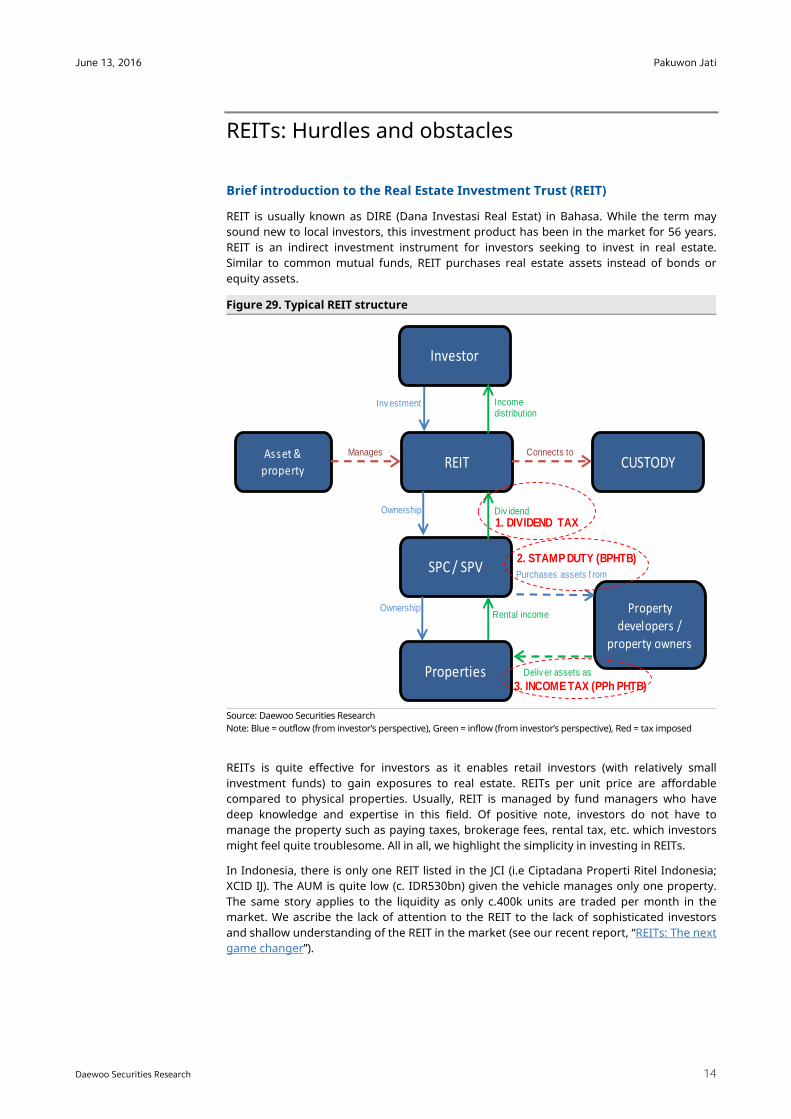
REIT is usually known as DIRE (Dana Investasi Real Estat) in Bahasa. While the term may sound new to local investors, this investment product has been in the market for 56 years. REIT is an indirect investment instrument for investors seeking to invest in real estate. Similar to common mutual funds, REIT purchases real estate assets instead of bonds or equity assets.
Figure 29. Typical REIT structure
Source: Daewoo Securities Research Note: Blue = outflow (from investor’s perspective), Green = inflow (from investor’s perspective), Red = tax imposed
REITs is quite effective for investors as it enables retail investors (with relatively small investment funds) to gain exposures to real estate. REITs per unit price are affordable compared to physical properties. Usually, REIT is managed by fund managers who have deep knowledge and expertise in this field. Of positive note, investors do not have to manage the property such as paying taxes, brokerage fees, rental tax, etc. which investors might feel quite troublesome. All in all, we highlight the simplicity in investing in REITs.
In Indonesia, there is only one REIT listed in the JCI (i.e Ciptadana Properti Ritel Indonesia; XCID IJ). The AUM is quite low (c. IDR530bn) given the vehicle manages only one property. The same story applies to the liquidity as only c.400k units are traded per month in the market. We ascribe the lack of attention to the REIT to the lack of sophisticated investors and shallow understanding of the REIT in the market (see our recent report, “REITs: The next game changer”).
Investor
REIT CUSTODYAsset &
property
SPC / SPV
Properties
Propertydevelopers /
property owners
Inv estment
Ownership
Ownership
Manages Connects to
Incomedistribution
Div idend
Rental income
Purchases assets f rom
Deliv er assets as
1. DIVIDEND TAX
2. STAMP DUTY (BPHTB)
3. INCOME TAX (PPh PHTB)
Pakuwon Jati
15
June 13, 2016
Daewoo Securities Research
Daewoo Securities Research
Waiting for the right timing
Following our latest conversation with PWON’s management, we conclude that the company is quite reluctant to access the REIT market. However, management cited that it would watch and study its potential actively. In our developers report “The night is darkest before the dawn” and “More light on the horizon”, we underlined government’s regulation would place positive implications on the property sector. One of the agenda is the tax cut on REIT. We consider a potential tax cut to reflect government’s intention to stimulate REITs.
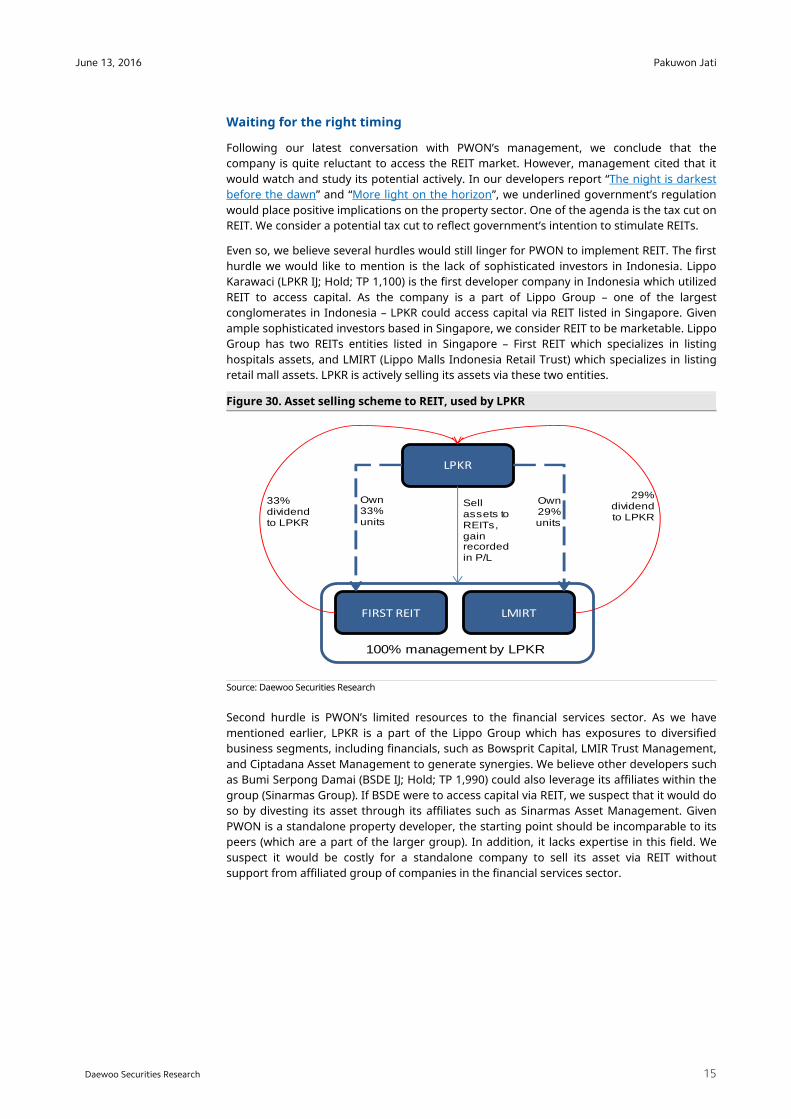
Even so, we believe several hurdles would still linger for PWON to implement REIT. The first hurdle we would like to mention is the lack of sophisticated investors in Indonesia. Lippo Karawaci (LPKR IJ; Hold; TP 1,100) is the first developer company in Indonesia which utilized REIT to access capital. As the company is a part of Lippo Group – one of the largest conglomerates in Indonesia – LPKR could access capital via REIT listed in Singapore. Given ample sophisticated investors based in Singapore, we consider REIT to be marketable. Lippo Group has two REITs entities listed in Singapore – First REIT which specializes in listing hospitals assets, and LMIRT (Lippo Malls Indonesia Retail Trust) which specializes in listing retail mall assets. LPKR is actively selling its assets via these two entities.
Figure 30. Asset selling scheme to REIT, used by LPKR
Source: Daewoo Securities Research
Second hurdle is PWON’s limited resources to the financial services sector. As we have mentioned earlier, LPKR is a part of the Lippo Group which has exposures to diversified business segments, including financials, such as Bowsprit Capital, LMIR Trust Management, and Ciptadana Asset Management to generate synergies. We believe other developers such as Bumi Serpong Damai (BSDE IJ; Hold; TP 1,990) could also leverage its affiliates within the group (Sinarmas Group). If BSDE were to access capital via REIT, we suspect that it would do so by divesting its asset through its affiliates such as Sinarmas Asset Management. Given PWON is a standalone property developer, the starting point should be incomparable to its peers (which are a part of the larger group). In addition, it lacks expertise in this field. We suspect it would be costly for a standalone company to sell its asset via REIT without support from affiliated group of companies in the financial services sector.
LPKR
FIRST REIT LMIRT
100% management by LPKR
Sell assets to REITs, gain recorded in P/L
Own 33% units
Own 29% units
33% dividend to LPKR
29% dividend to LPKR

Pakuwon Jati
16
June 13, 2016
Daewoo Securities Research
Daewoo Securities Research
The third hurdle is developers’ dilemma between selling their properties and recording it as marketing sales (property-selling developers) or leasing it and recording it as recurring income (property-leasing developers). In order for a developer to build properties, it would need sources of funds, either from equity or debt. Typically in Indonesia, the cost of debt and cost of equity is c.10% and c.15%, respectively. By selling property, developers can directly gain around 10~40% net margin (higher margin), far above the cost of debt and equity. By leasing the property, developers can only gain c.9% in rental income yield (lower margin), below the cost of debt and equity. Hence, usually it’s more lucrative to sell properties instead of leasing because property sales embed higher margins. However, this would be true so long as the market situation is favorable – where property buyers actively purchase properties. When the macro condition is weak (i.e., softening of economic cycle), things can turn sour for property-selling developers, as marketing sales will lag. For property-leasing developers, the situation would be relatively better, as dependency on marketing sales is quite minimal. Hence, we believe PWON’s potential asset sales to REITs could backfire in such adverse cycles combined with lack of stable recurring income.
Factoring in the collective arguments we mentioned above, we believe PWON’s plans to sell its assets via REIT would not be well accepted by the market.
Pakuwon Jati
17
June 13, 2016
Daewoo Securities Research
Daewoo Securities Research
Daewoo on-the-grounds
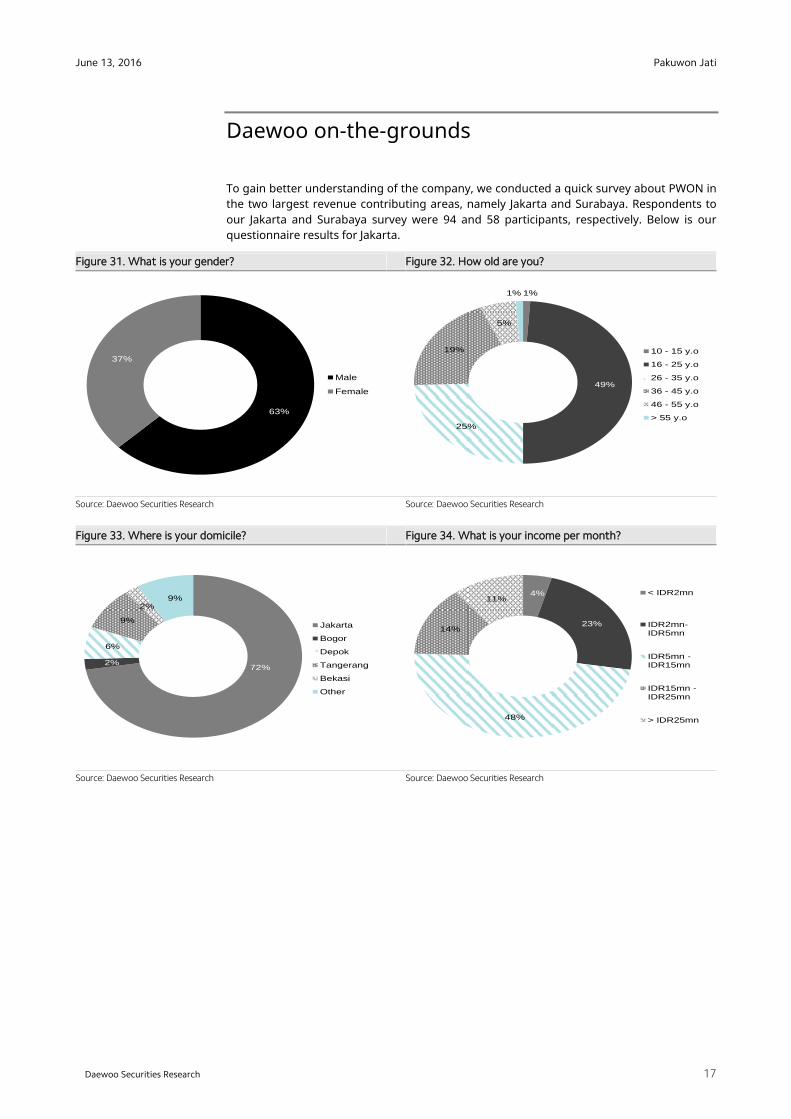
To gain better understanding of the company, we conducted a quick survey about PWON in the two largest revenue contributing areas, namely Jakarta and Surabaya. Respondents to our Jakarta and Surabaya survey were 94 and 58 participants, respectively. Below is our questionnaire results for Jakarta.
Figure 31. What is your gender? Figure 32. How old are you?
Source: Daewoo Securities Research
Source: Daewoo Securities Research
Figure 33. Where is your domicile? Figure 34. What is your income per month?
Source: Daewoo Securities Research
Source: Daewoo Securities Research
63%
37%
Male
Female
1%
49%
25%
19%
5%
1%
10 - 15 y.o
16 - 25 y.o
26 - 35 y.o
36 - 45 y.o
46 - 55 y.o
> 55 y.o
72%2%
6%
9%
2%9%
Jakarta
Bogor
Depok
Tangerang
Bekasi
Other
4%
23%
48%
14%
11%< IDR2mn
IDR2mn-IDR5mn
IDR5mn -IDR15mn
IDR15mn -IDR25mn
> IDR25mn
Pakuwon Jati
18
June 13, 2016
Daewoo Securities Research
Daewoo Securities Research
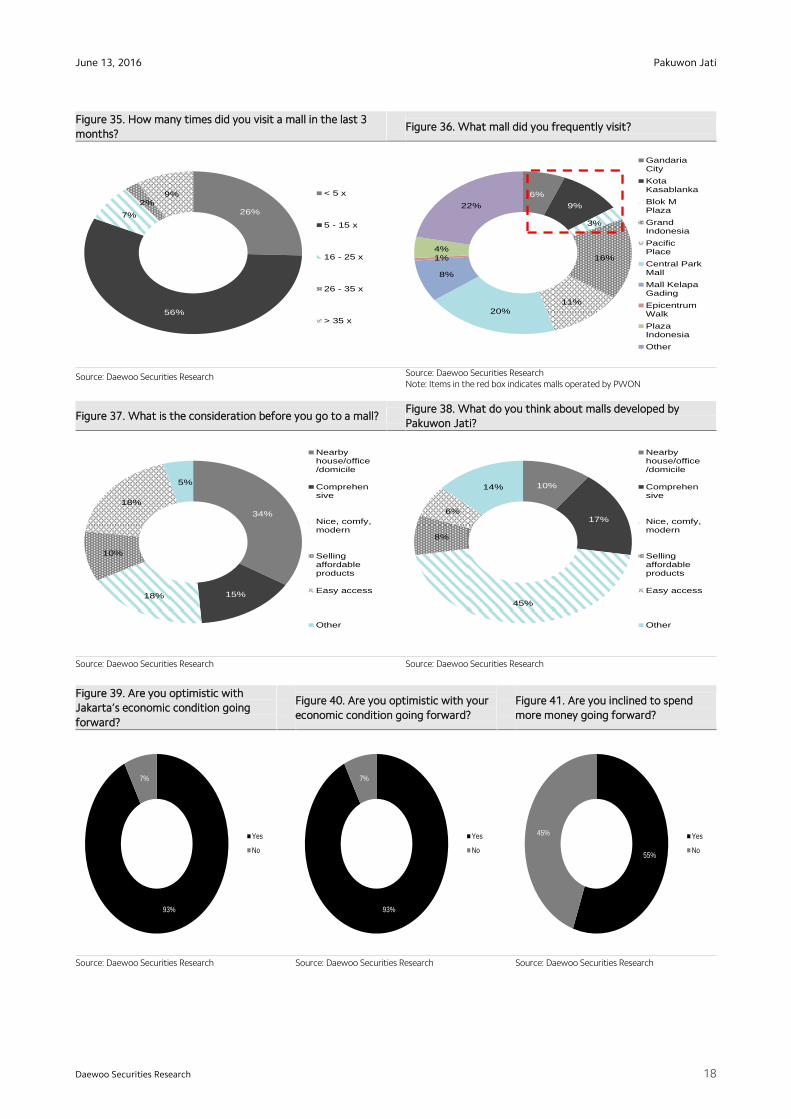
Figure 35. How many times did you visit a mall in the last 3
months? Figure 36. What mall did you frequently visit?
Source: Daewoo Securities Research
Source: Daewoo Securities Research Note: Items in the red box indicates malls operated by PWON
Figure 37. What is the consideration before you go to a mall? Figure 38. What do you think about malls developed by
Pakuwon Jati?
Source: Daewoo Securities Research
Source: Daewoo Securities Research
Figure 39. Are you optimistic with
Jakarta’s economic condition going
forward?
Figure 40. Are you optimistic with your
economic condition going forward?
Figure 41. Are you inclined to spend
more money going forward?
Source: Daewoo Securities Research
Source: Daewoo Securities Research
Source: Daewoo Securities Research
26%
56%
7%
2%9% < 5 x
5 - 15 x
16 - 25 x
26 - 35 x
> 35 x
34%
15%18%
10%
18%
5%
Nearbyhouse/office/domicile
Comprehensive
Nice, comfy,modern
Sellingaffordableproducts
Easy access
Other
10%
17%
45%
8%
6%
14%
Nearbyhouse/office/domicile
Comprehensive
Nice, comfy,modern
Sellingaffordableproducts
Easy access
Other
93%
7%
Yes
No
93%
7%
Yes
No55%
45% Yes
No
6%
9%
3%
16%
11%
20%
8%
1%
4%
22%
GandariaCity
KotaKasablanka
Blok MPlaza
GrandIndonesia
PacificPlace
Central ParkMall
Mall KelapaGading
EpicentrumWalk
PlazaIndonesia
Other
Pakuwon Jati
19
June 13, 2016
Daewoo Securities Research
Daewoo Securities Research
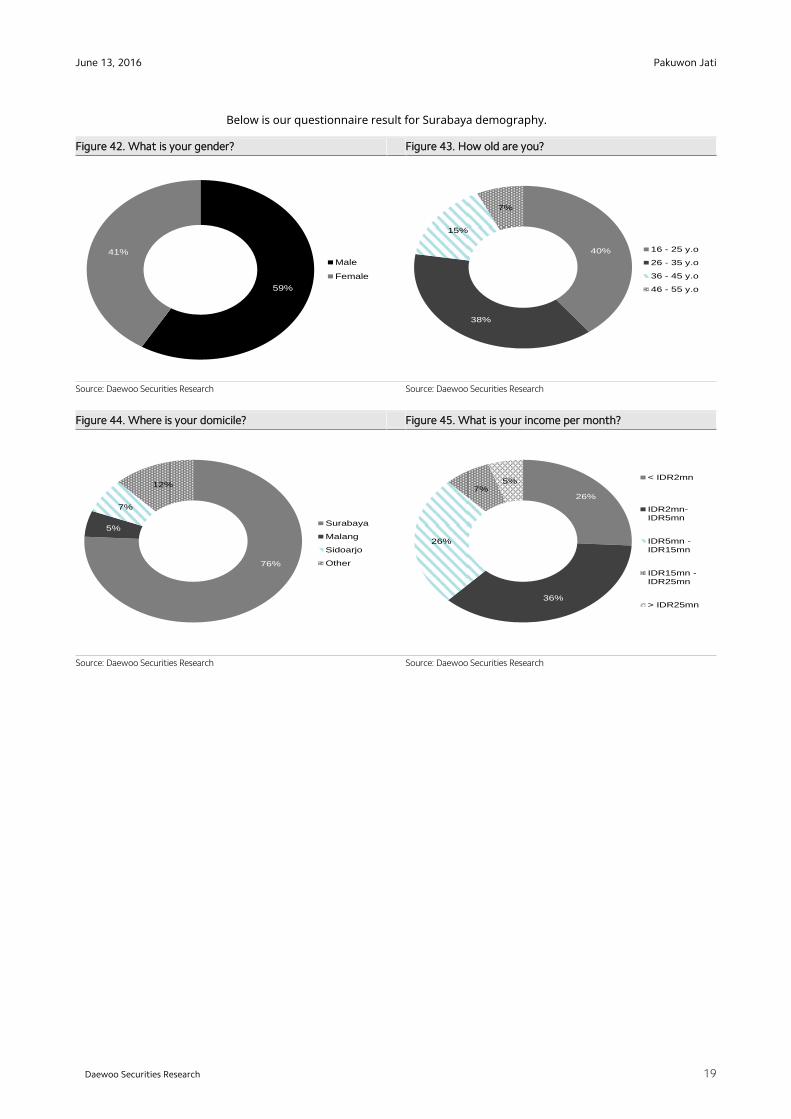
Below is our questionnaire result for Surabaya demography.
Figure 42. What is your gender? Figure 43. How old are you?
Source: Daewoo Securities Research
Source: Daewoo Securities Research
Figure 44. Where is your domicile? Figure 45. What is your income per month?
Source: Daewoo Securities Research
Source: Daewoo Securities Research
59%
41%
Male
Female
40%
38%
15%
7%
16 - 25 y.o
26 - 35 y.o
36 - 45 y.o
46 - 55 y.o
76%
5%
7%
12%
Surabaya
Malang
Sidoarjo
Other
26%
36%
26%
7%5%
< IDR2mn
IDR2mn-IDR5mn
IDR5mn -IDR15mn
IDR15mn -IDR25mn
> IDR25mn
Pakuwon Jati
20
June 13, 2016
Daewoo Securities Research
Daewoo Securities Research
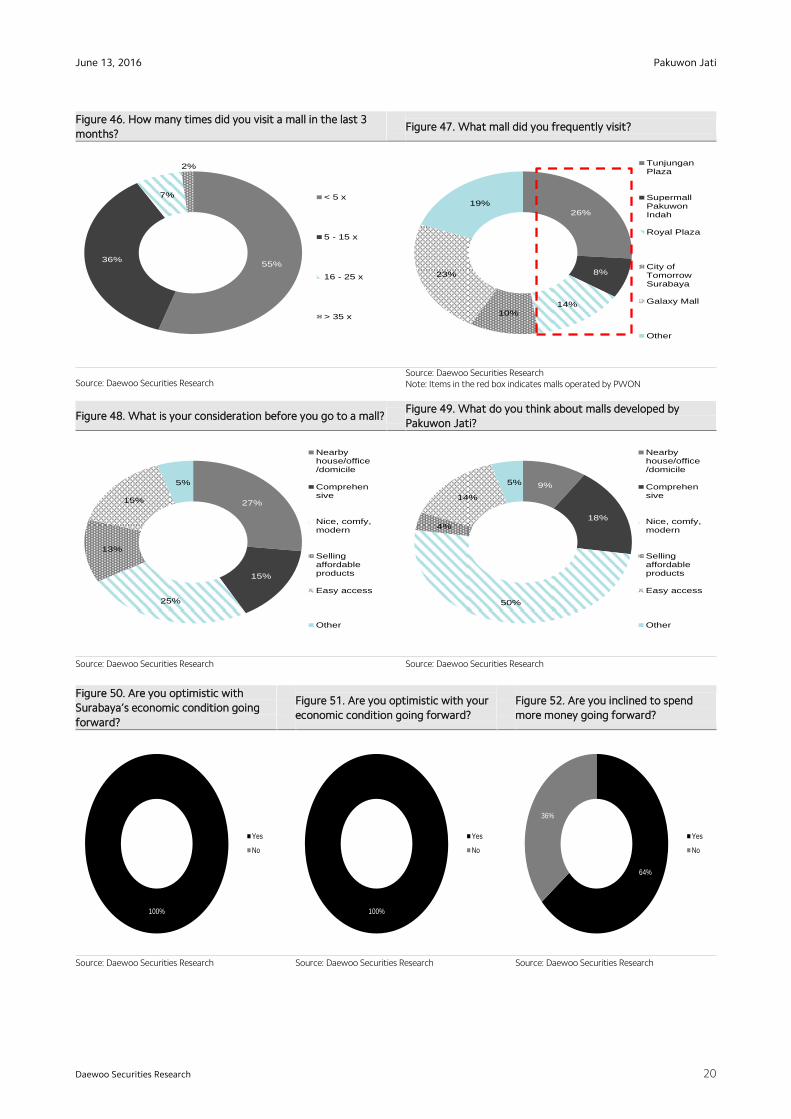
Figure 46. How many times did you visit a mall in the last 3
months? Figure 47. What mall did you frequently visit?
Source: Daewoo Securities Research Source: Daewoo Securities Research Note: Items in the red box indicates malls operated by PWON
Figure 48. What is your consideration before you go to a mall? Figure 49. What do you think about malls developed by
Pakuwon Jati?
Source: Daewoo Securities Research
Source: Daewoo Securities Research
Figure 50. Are you optimistic with
Surabaya’s economic condition going
forward?
Figure 51. Are you optimistic with your
economic condition going forward?
Figure 52. Are you inclined to spend
more money going forward?
Source: Daewoo Securities Research
Source: Daewoo Securities Research
Source: Daewoo Securities Research
55%36%
7%
2%
< 5 x
5 - 15 x
16 - 25 x
> 35 x
26%
8%
14%10%
23%
19%
TunjunganPlaza
SupermallPakuwonIndah
Royal Plaza
City ofTomorrowSurabaya
Galaxy Mall
Other
27%
15%
25%
13%
15%
5%
Nearbyhouse/office/domicile
Comprehensive
Nice, comfy,modern
Sellingaffordableproducts
Easy access
Other
9%
18%
50%
4%
14%
5%
Nearbyhouse/office/domicile
Comprehensive
Nice, comfy,modern
Sellingaffordableproducts
Easy access
Other
100%
Yes
No
100%
Yes
No
64%
36%
Yes
No
Pakuwon Jati
21
June 13, 2016
Daewoo Securities Research
Daewoo Securities Research
It is quite interesting to find out that PWON’s positioning is better in Surabaya compared to Jakarta (see figure 36 and 47). In other words, Surabayans have greater tendencies to visit malls developed by PWON over Jakartans. Our survey results show that PWON has strong footprints in Surabaya. Key takeaway from our survey is that both Jakartans and Surabayans thought PWON’s malls were comprehensive, nice, comfy and modern (figure 38 and 49) – which we consider to be clear evidence that people have positive thoughts on PWON’s malls. We also takeout the fact that Jakartans are less optimistic compared to Surabayans in viewing the economic conditions (figure 39-41 and 50-52) – which we think should place PWON on a rather firm footing compared to peers heavily concentrated in Jakarta region (figure 21 and 22).
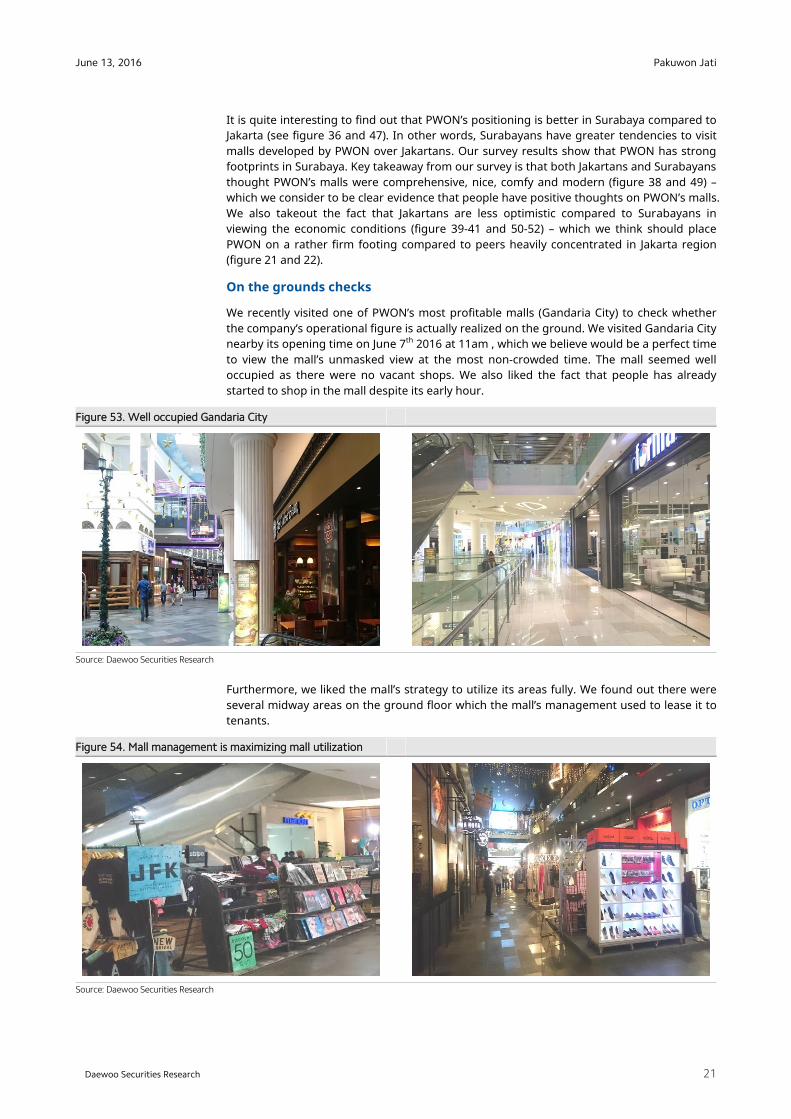
On the grounds checks
We recently visited one of PWON’s most profitable malls (Gandaria City) to check whether the company’s operational figure is actually realized on the ground. We visited Gandaria City nearby its opening time on June 7th 2016 at 11am , which we believe would be a perfect time to view the mall’s unmasked view at the most non-crowded time. The mall seemed well occupied as there were no vacant shops. We also liked the fact that people has already started to shop in the mall despite its early hour.
Figure 53. Well occupied Gandaria City
Source: Daewoo Securities Research
Furthermore, we liked the mall’s strategy to utilize its areas fully. We found out there were several midway areas on the ground floor which the mall’s management used to lease it to tenants.
Figure 54. Mall management is maximizing mall utilization
Source: Daewoo Securities Research
Pakuwon Jati
22
June 13, 2016
Daewoo Securities Research
Daewoo Securities Research
Valuations and recommendations
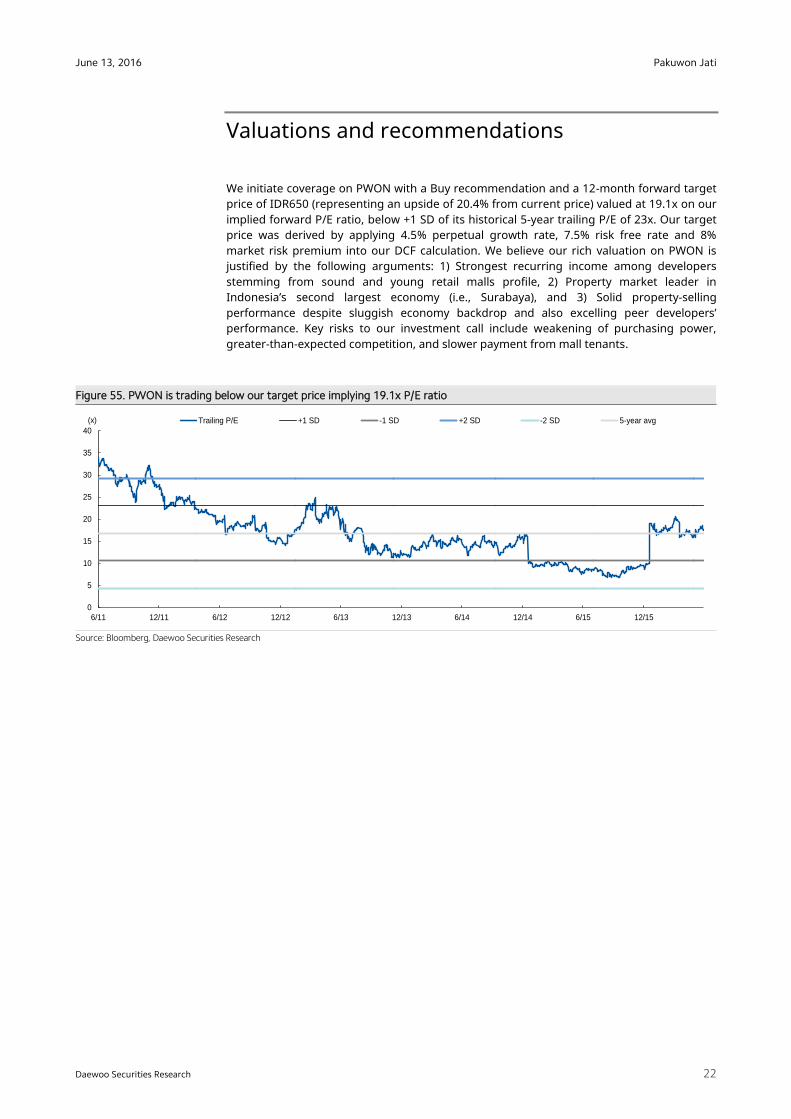
We initiate coverage on PWON with a Buy recommendation and a 12-month forward target price of IDR650 (representing an upside of 20.4% from current price) valued at 19.1x on our implied forward P/E ratio, below +1 SD of its historical 5-year trailing P/E of 23x. Our target price was derived by applying 4.5% perpetual growth rate, 7.5% risk free rate and 8% market risk premium into our DCF calculation. We believe our rich valuation on PWON is justified by the following arguments: 1) Strongest recurring income among developers stemming from sound and young retail malls profile, 2) Property market leader in Indonesia’s second largest economy (i.e., Surabaya), and 3) Solid property-selling performance despite sluggish economy backdrop and also excelling peer developers’ performance. Key risks to our investment call include weakening of purchasing power, greater-than-expected competition, and slower payment from mall tenants.
Figure 55. PWON is trading below our target price implying 19.1x P/E ratio
Source: Bloomberg, Daewoo Securities Research
0
5
10
15
20
25
30
35
40
6/11 12/11 6/12 12/12 6/13 12/13 6/14 12/14 6/15 12/15
Trailing P/E +1 SD -1 SD +2 SD -2 SD 5-year avg(x)
Pakuwon Jati
23
June 13, 2016
Daewoo Securities Research
Daewoo Securities Research
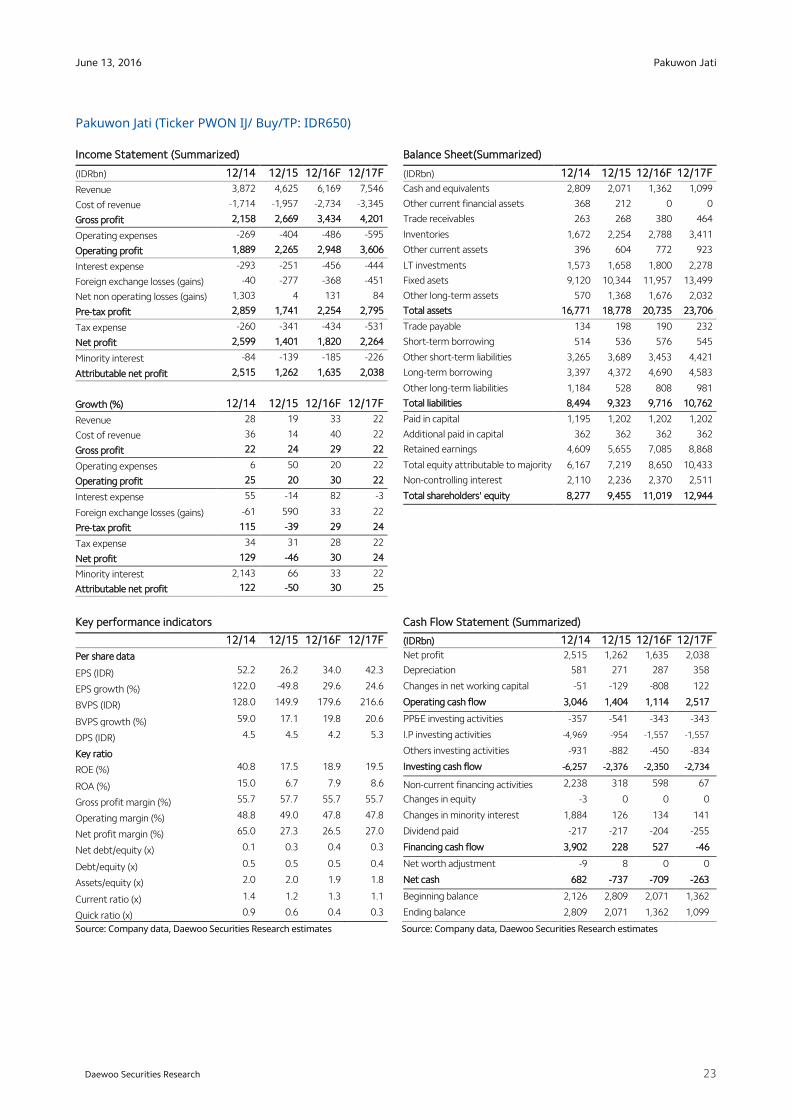
Pakuwon Jati (Ticker PWON IJ/ Buy/TP: IDR650)
Income Statement (Summarized) Balance Sheet(Summarized)
(IDRbn) 12/14 12/15 12/16F 12/17F (IDRbn) 12/14 12/15 12/16F 12/17F
Revenue 3,872 4,625 6,169 7,546 Cash and equivalents 2,809 2,071 1,362 1,099
Cost of revenue -1,714 -1,957 -2,734 -3,345 Other current financial assets 368 212 0 0
Gross profit 2,158 2,669 3,434 4,201 Trade receivables 263 268 380 464
Operating expenses -269 -404 -486 -595 Inventories 1,672 2,254 2,788 3,411
Operating profit 1,889 2,265 2,948 3,606 Other current assets 396 604 772 923
Interest expense -293 -251 -456 -444 LT investments 1,573 1,658 1,800 2,278
Foreign exchange losses (gains) -40 -277 -368 -451 Fixed asets 9,120 10,344 11,957 13,499
Net non operating losses (gains) 1,303 4 131 84 Other long-term assets 570 1,368 1,676 2,032
Pre-tax profit 2,859 1,741 2,254 2,795 Total assets 16,771 18,778 20,735 23,706
Tax expense -260 -341 -434 -531 Trade payable 134 198 190 232
Net profit 2,599 1,401 1,820 2,264 Short-term borrowing 514 536 576 545
Minority interest -84 -139 -185 -226 Other short-term liabilities 3,265 3,689 3,453 4,421
Attributable net profit 2,515 1,262 1,635 2,038 Long-term borrowing 3,397 4,372 4,690 4,583
Other long-term liabilities 1,184 528 808 981
Growth (%) 12/14 12/15 12/16F 12/17F Total liabilities 8,494 9,323 9,716 10,762
Revenue 28 19 33 22 Paid in capital 1,195 1,202 1,202 1,202
Cost of revenue 36 14 40 22 Additional paid in capital 362 362 362 362
Gross profit 22 24 29 22 Retained earnings 4,609 5,655 7,085 8,868
Operating expenses 6 50 20 22 Total equity attributable to majority 6,167 7,219 8,650 10,433
Operating profit 25 20 30 22 Non-controlling interest 2,110 2,236 2,370 2,511
Interest expense 55 -14 82 -3 Total shareholders' equity 8,277 9,455 11,019 12,944
Foreign exchange losses (gains) -61 590 33 22
Pre-tax profit 115 -39 29 24
Tax expense 34 31 28 22
Net profit 129 -46 30 24
Minority interest 2,143 66 33 22
Attributable net profit 122 -50 30 25
Key performance indicators Cash Flow Statement (Summarized)
12/14 12/15 12/16F 12/17F (IDRbn) 12/14 12/15 12/16F 12/17F
Per share data Net profit 2,515 1,262 1,635 2,038
EPS (IDR) 52.2 26.2 34.0 42.3 Depreciation 581 271 287 358
EPS growth (%) 122.0 -49.8 29.6 24.6 Changes in net working capital -51 -129 -808 122
BVPS (IDR) 128.0 149.9 179.6 216.6 Operating cash flow 3,046 1,404 1,114 2,517
BVPS growth (%) 59.0 17.1 19.8 20.6 PP&E investing activities -357 -541 -343 -343
DPS (IDR) 4.5 4.5 4.2 5.3 I.P investing activities -4,969 -954 -1,557 -1,557
Key ratio Others investing activities -931 -882 -450 -834
ROE (%) 40.8 17.5 18.9 19.5 Investing cash flow -6,257 -2,376 -2,350 -2,734
ROA (%) 15.0 6.7 7.9 8.6 Non-current financing activities 2,238 318 598 67
Gross profit margin (%) 55.7 57.7 55.7 55.7 Changes in equity -3 0 0 0
Operating margin (%) 48.8 49.0 47.8 47.8 Changes in minority interest 1,884 126 134 141
Net profit margin (%) 65.0 27.3 26.5 27.0 Dividend paid -217 -217 -204 -255
Net debt/equity (x) 0.1 0.3 0.4 0.3 Financing cash flow 3,902 228 527 -46
Debt/equity (x) 0.5 0.5 0.5 0.4 Net worth adjustment -9 8 0 0
Assets/equity (x) 2.0 2.0 1.9 1.8 Net cash 682 -737 -709 -263
Current ratio (x) 1.4 1.2 1.3 1.1 Beginning balance 2,126 2,809 2,071 1,362
Quick ratio (x) 0.9 0.6 0.4 0.3 Ending balance 2,809 2,071 1,362 1,099
Source: Company data, Daewoo Securities Research estimates Source: Company data, Daewoo Securities Research estimates
Pakuwon Jati
24
June 13, 2016
Daewoo Securities Research
Daewoo Securities Research
APPENDIX 1
Important Disclosures & Disclaimers
Analyst Certification The research analysts who prepared this report (the “Analysts”) are registered with and are subject to Indonesian securities regulations. They are neither registered as research analysts in any other jurisdiction nor subject to the laws and regulations thereof. Opinions expressed in this publication about the subject securities and companies accurately reflect the personal views of the Analysts primarily responsible for this report. PT Daewoo Securities Indonesia policy prohibits its Analysts and members of their households from owning securities of any company in the Analyst’s area of coverage, and the Analysts do not serve as an officer, director or advisory board member of the subject companies. Except as otherwise specified herein, the Analysts have not received any compensation or any other benefits from the subject companies in the past 12 months and have not been promised the same in connection with this report. No part of the compensation of the Analysts was, is, or will be directly or indirectly related to the specific recommendations or views contained in this report but, like all employees of PT Daewoo Securities Indonesia, the Analysts receive compensation that is impacted by overall firm profitability, which includes revenues from, among other business units, the institutional equities, investment banking, proprietary trading and private client division. At the time of publication of this report, the Analysts do not know or have reason to know of any actual, material conflict of interest of the Analyst or PT Daewoo Securities Indonesia except as otherwise stated herein. Disclaimers This report is published by PT Daewoo Securities Indonesia (“Daewoo”), a broker-dealer registered in the Republic of Indonesia and a member of the Indonesian Stock Exchange. Information and opinions contained herein have been compiled from sources believed to be reliable and in good faith, but such information has not been independently verified and Daewoo makes no guarantee, representation or warranty, express or implied, as to the fairness, accuracy, completeness or correctness of the information and opinions contained herein or of any translation into English from the Indonesian language. If this report is an English translation of a report prepared in the Indonesian language, the original Indonesian language report may have been made available to investors in advance of this report. Daewoo, its affiliates and their directors, officers, employees and agents do not accept any liability for any loss arising from the use hereof. This report is for general information purposes only and it is not and should not be construed as an offer or a solicitation of an offer to effect transactions in any securities or other financial instruments. The intended recipients of this report are sophisticated institutional investors who have substantial knowledge of the local business environment, its common practices, laws and accounting principles and no person whose receipt or use of this report would violate any laws and regulations or subject Daewoo and its affiliates to registration or licensing requirements in any jurisdiction should receive or make any use hereof. Information and opinions contained herein are subject to change without notice and no part of this document may be copied or reproduced in any manner or form or redistributed or published, in whole or in part, without the prior written consent of Daewoo. Daewoo, its affiliates and their directors, officers, employees and agents may have long or short positions in any of the subject securities at any time and may make a purchase or sale, or offer to make a purchase or sale, of any such securities or other financial instruments from time to time in the open market or otherwise, in each case either as principals or agents. Daewoo and its affiliates may have had, or may be expecting to enter into, business relationships with the subject companies to provide investment banking, market-making or other financial services as are permitted under applicable laws and regulations. The price and value of the investments referred to in this report and the income from them may go down as well as up, and investors may realize losses on any investments. Past performance is not a guide to future performance. Future returns are not guaranteed, and a loss of original capital may occur Distribution United Kingdom: This report is being distributed by Daewoo Securities (Europe) Ltd. in the United Kingdom only to (i) investment professionals falling within Article 19(5) of the Financial Services and Markets Act 2000 (Financial Promotion) Order 2005 (the “Order”), and (ii) high net worth companies and other persons to whom it may lawfully be communicated, falling within Article 49(2)(A) to (E) of the Order (all such persons together being referred to as “Relevant Persons”). This report is directed only at Relevant Persons. Any person who is not a Relevant Person should not act or rely on this report or any of its contents. United States: This report is distributed in the U.S. by Daewoo Securities (America) Inc., a member of FINRA/SIPC, and is only intended for major institutional investors as defined in Rule 15a-6(b)(4) under the U.S. Securities Exchange Act of 1934. All U.S. persons that receive this document by their acceptance thereof represent and warrant that they are a major institutional investor and have not received this report under any express or implied understanding that they will direct commission income to Daewoo or its affiliates. Any U.S. recipient of this document wishing to effect a transaction in any securities discussed herein should contact and place orders with Daewoo Securities (America) Inc., which accepts responsibility for the contents of this report in the U.S. The securities described in this report may not have been registered under the U.S. Securities Act of 1933, as amended, and, in such case, may not be offered or sold in the U.S. or to U.S. persons absent registration or an applicable exemption from the registration requirements. Hong Kong: This document has been approved for distribution in Hong Kong by Daewoo Securities (Hong Kong) Ltd., which is regulated by the Hong Kong Securities and Futures Commission. The contents of this report have not been reviewed by any regulatory authority in Hong Kong. This
Stock Ratings Industry Ratings Buy : Relative performance of 20% or greater Overweight : Fundamentals are favorable or improving
Trading Buy : Relative performance of 10% or greater, but with volatility Neutral : Fundamentals are steady without any material changes
Hold : Relative performance of -10% and 10% Underweight : Fundamentals are unfavorable or worsening Sell : Relative performance of -10%
* Our investment rating is a guide to the relative return of the stock versus the market over the next 12 months. * Although it is not part of the official ratings at Daewoo Securities, we may call a trading opportunity in case there is a technical or short-term material development. * The target price was determined by the research analyst through valuation methods discussed in this report, in part based on the analyst’s estimate of future earnings. * The achievement of the target price may be impeded by risks related to the subject securities and companies, as well as general market and economic conditions.
Disclosures As of the publication date, PT Daewoo Securities Indonesia and/or its affiliates do not have any special interest with the subject company and do not own 1% or more of the subject company's shares outstanding.
Pakuwon Jati
25
June 13, 2016
Daewoo Securities Research
Daewoo Securities Research
report is for distribution only to professional investors within the meaning of Part I of Schedule 1 to the Securities and Futures Ordinance of Hong Kong (Cap. 571, Laws of Hong Kong) and any rules made thereunder and may not be redistributed in whole or in part in Hong Kong to any person. All Other Jurisdictions: Customers in all other countries who wish to effect a transaction in any securities referenced in this report should contact Daewoo or its affiliates only if distribution to or use by such customer of this report would not violate applicable laws and regulations and not subject Daewoo and its affiliates to any registration or licensing requirement within such jurisdiction.
Daewoo Securities International Network
PT. Daewoo Securities Indonesia Daewoo Securities (Hong Kong) Ltd. Daewoo Securities (America) Inc. Equity Tower Building Lt.50 Sudirman Central Business District Jl. Jendral Sudirman Kav. 52-53, Jakarta Selatan Indonesia 12190
Two International Finance Centre Suites 2005-2012 8 Finance Street, Central Hong Kong, China
320 Park Avenue 31st Floor New York, NY 10022 United States
Tel: 62-21-515-1140 Tel: 85-2-2845-6332 Tel: 1-212-407-1000
Daewoo Securities (Europe) Ltd. Daewoo Securities (Singapore) Pte. Ltd. Tokyo Branch 41st Floor, Tower 42 25 Old Broad St. London EC2N 1HQ United Kingdom
Six Battery Road #11-01 Singapore, 049909
7th Floor, Yusen Building 2-3-2 Marunouchi, Chiyoda-ku Tokyo 100-0005 Japan
Tel: 44-20-7982-8000 Tel: 65-6671-9845 Tel: 81-3- 3211-5511
Beijing Representative Office Shanghai Representative Office Ho Chi Minh Representative Office 2401A, 24th Floor, East Tower, Twin Towers B-12 Jianguomenwai Avenue Chaoyang District, Beijing 100022 China
Room 38T31, 38F SWFC 100 Century Avenue Pudong New Area, Shanghai 200120 China
Suite 2103, Saigon Trade Center 37 Ton Duc Thang St, Dist. 1, Ho Chi Minh City, Vietnam
Tel: 86-10-6567-9299 Tel: 86-21-5013-6392 Tel: 84-8-3910-6000
Daewoo Investment Advisory (Beijing) Co., Ltd. Daewoo Securities (Mongolia) LLC Daewoo Securities Co. Ltd. (Seoul)
2401B, 24th Floor, East Tower, Twin Towers B-12 Jianguomenwai Avenue, Chaoyang District, Beijing 100022 China
#406, Blue Sky Tower, Peace Avenue 17 1 Khoroo, Sukhbaatar District Ulaanbaatar 14240 Mongolia
Head Office 34-3 Yeouido-dong, Yeongdeungpo-gu Seoul 150-716 Korea
Tel: 86-10-6567-9699 Tel: 976-7011-0807 Tel: 82-2-768-3026