Embed Size (px)
Citation preview
Panera Bread (NYSE: PNRA)
Jay Aurora| Tim Krauter| Shane Riemer| Michael Xu
Street Perception
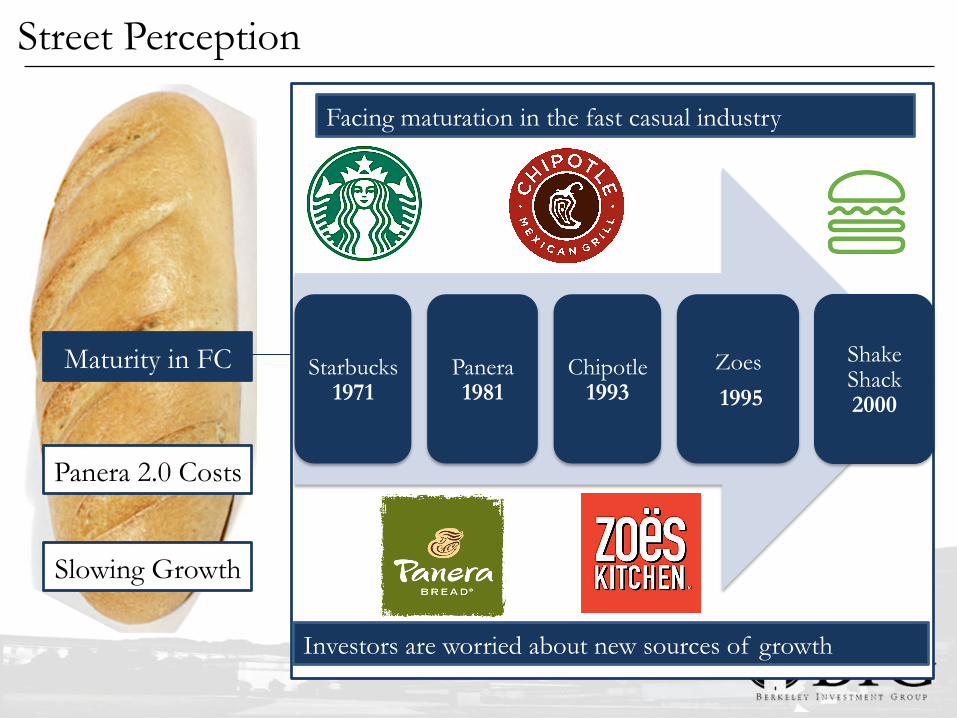
Facing maturation in the fast casual industry
Investors are worried about new sources of growth
Starbucks 1971
Panera 1981
Chipotle 1993
Zoes
1995
Shake Shack 2000
Street Perception
Slowing Growth
Maturity in FC
Panera 2.0 Costs
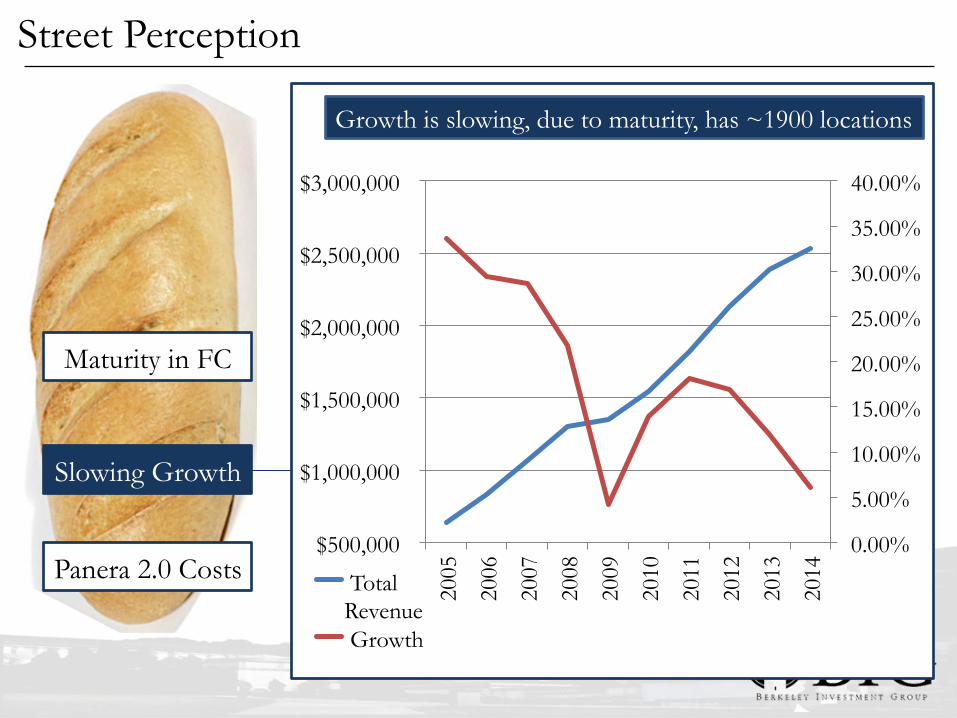
Growth is slowing, due to maturity, has ~1900 locations
0.00%
5.00%
10.00%
15.00%
20.00%
25.00%
30.00%
35.00%
40.00%
$500,000
$1,000,000
$1,500,000
$2,000,000
$2,500,000
$3,000,000
2005
2006
2007
2008
2009
2010
2011
2012
2013
2014
Total Revenue Growth
Street Perception
Panera 2.0 Costs
Maturity in FC
Slowing Growth
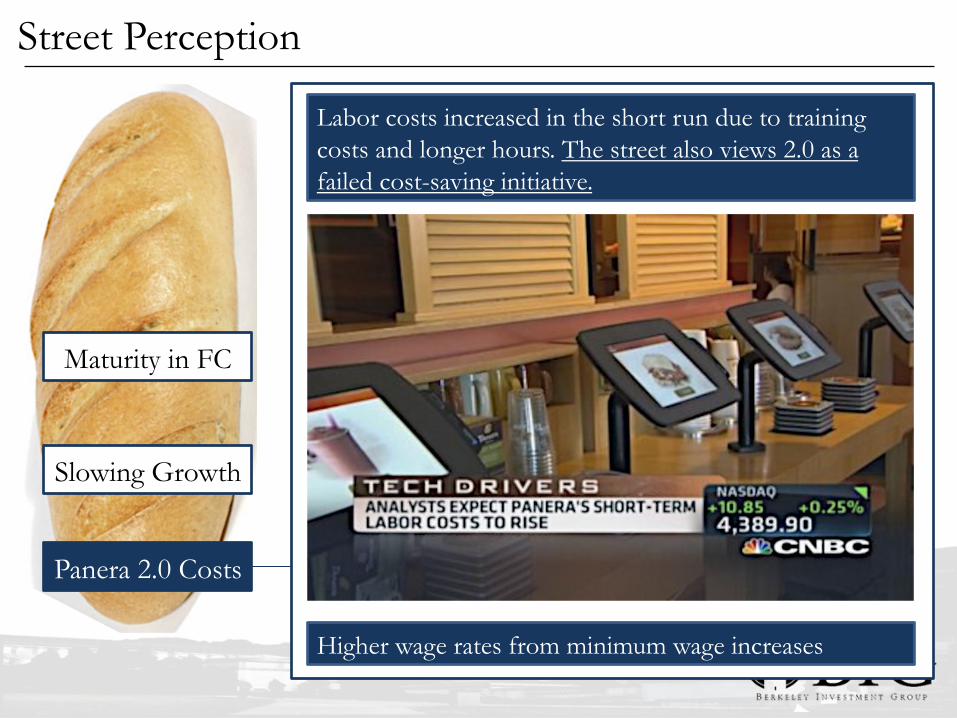
Labor costs increased in the short run due to training costs and longer hours. The street also views 2.0 as a failed cost-saving initiative.
Higher wage rates from minimum wage increases
Street Perception
Panera 2.0 Costs
Maturity in FC
Slowing Growth
Variant Perception
Franchising
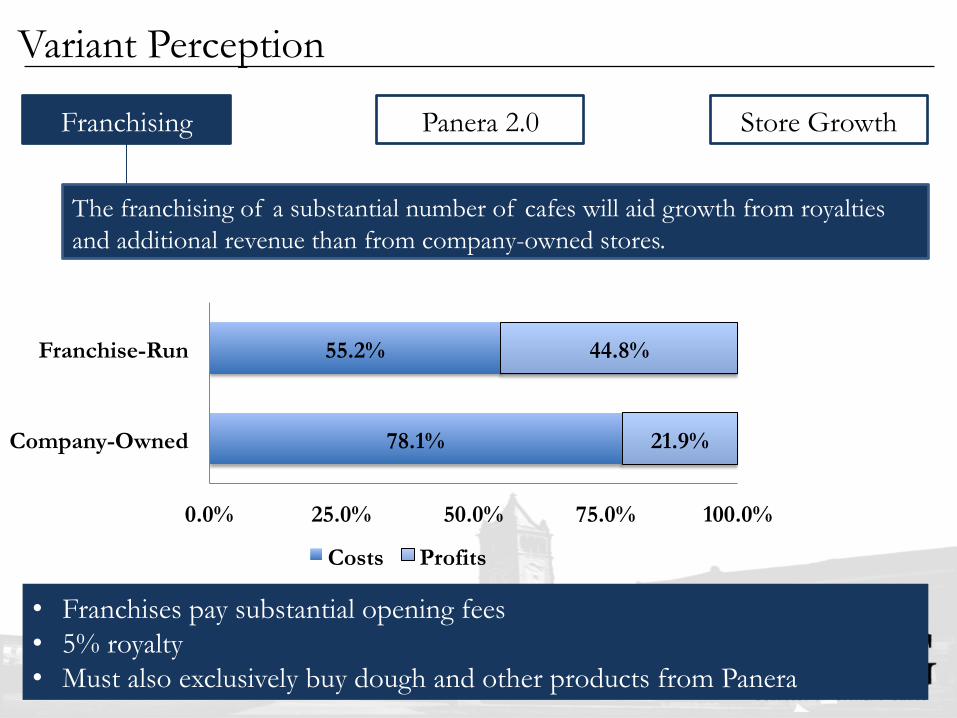
The franchising of a substantial number of cafes will aid growth from royalties and additional revenue than from company-owned stores.
Variant Perception
78.1%
55.2%
21.9%
44.8%
0.0% 25.0% 50.0% 75.0% 100.0%
Company-Owned
Franchise-Run
Costs Profits
• Franchises pay substantial opening fees • 5% royalty • Must also exclusively buy dough and other products from Panera
Store Growth Panera 2.0
Panera Bread
Franchised Cafes Company Owned Cafes
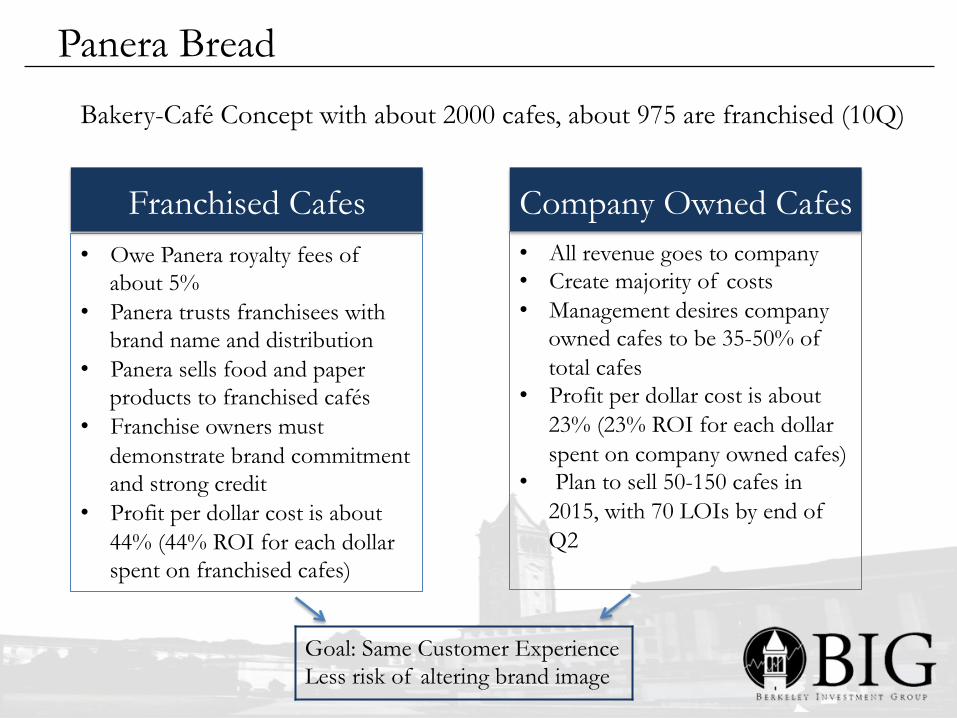
Bakery-Café Concept with about 2000 cafes, about 975 are franchised (10Q)
• Owe Panera royalty fees of about 5%
• Panera trusts franchisees with brand name and distribution
• Panera sells food and paper products to franchised cafés
• Franchise owners must demonstrate brand commitment and strong credit
• Profit per dollar cost is about 44% (44% ROI for each dollar spent on franchised cafes)
• All revenue goes to company • Create majority of costs • Management desires company
owned cafes to be 35-50% of total cafes
• Profit per dollar cost is about 23% (23% ROI for each dollar spent on company owned cafes)
• Plan to sell 50-150 cafes in 2015, with 70 LOIs by end of Q2
Goal: Same Customer Experience Less risk of altering brand image
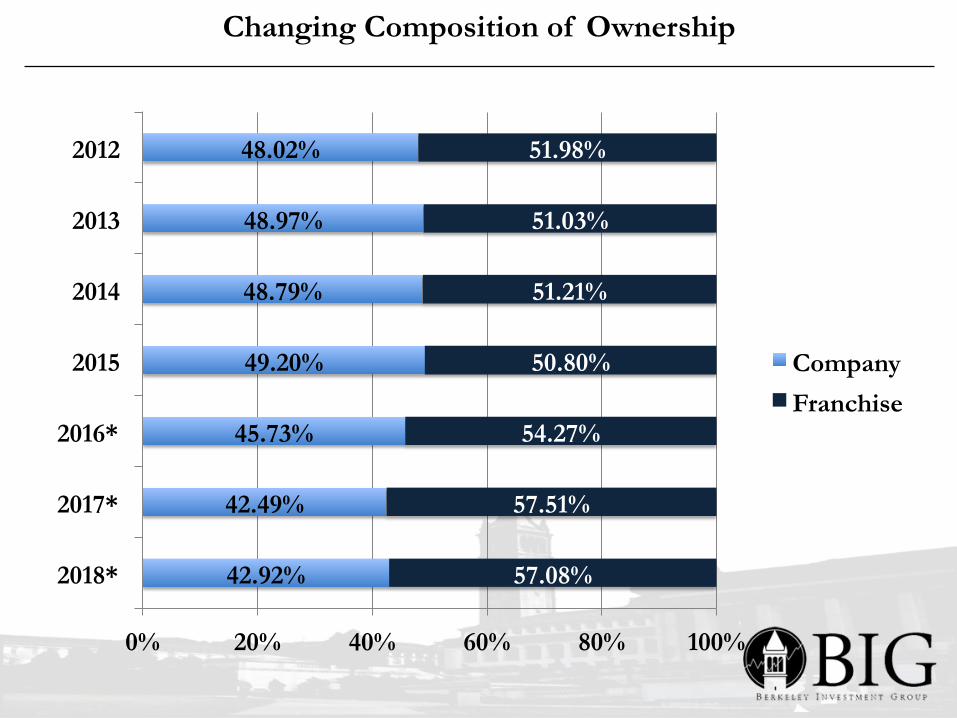
Changing Composition of Ownership
42.92%
42.49%
45.73%
49.20%
48.79%
48.97%
48.02%
57.08%
57.51%
54.27%
50.80%
51.21%
51.03%
51.98%
0% 20% 40% 60% 80% 100%
2018*
2017*
2016*
2015
2014
2013
2012
Company
Franchise
Franchising
Fundamentals
Store Growth Panera 2.0
Variant Perception

Fundamentals of Panera 2.0
Digital access initiative • Catering and delivery service using
mobile, web and kiosk access to shorten wait times and improve to-go / eat-in experiences
Goal: improve guest experience by reducing friction
Operational integrity • Using upgraded equipment and
management tools to keep up with its growing orders
Better way to order and receive orders & differentiated approach to production
Franchising
Fundamentals
Store Growth Panera 2.0
Variant Perception
History of Digital Optimization in the Restaurant Industry
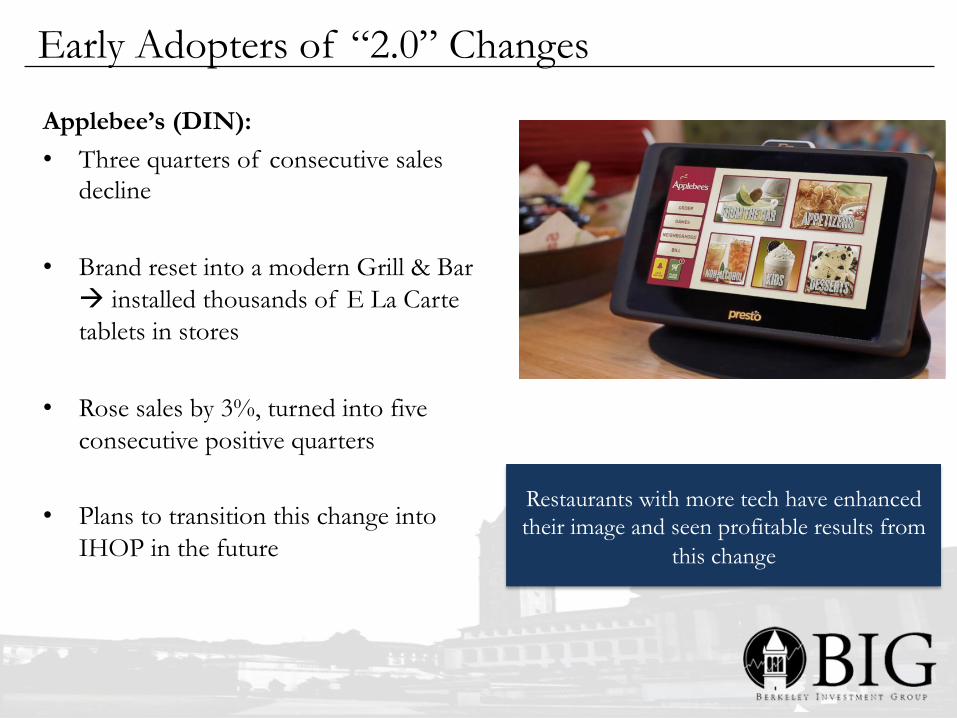
Early Adopters of “2.0” Changes
Applebee’s (DIN): • Three quarters of consecutive sales
decline
• Brand reset into a modern Grill & Bar à installed thousands of E La Carte tablets in stores
• Rose sales by 3%, turned into five
consecutive positive quarters
• Plans to transition this change into IHOP in the future
Restaurants with more tech have enhanced their image and seen profitable results from
this change
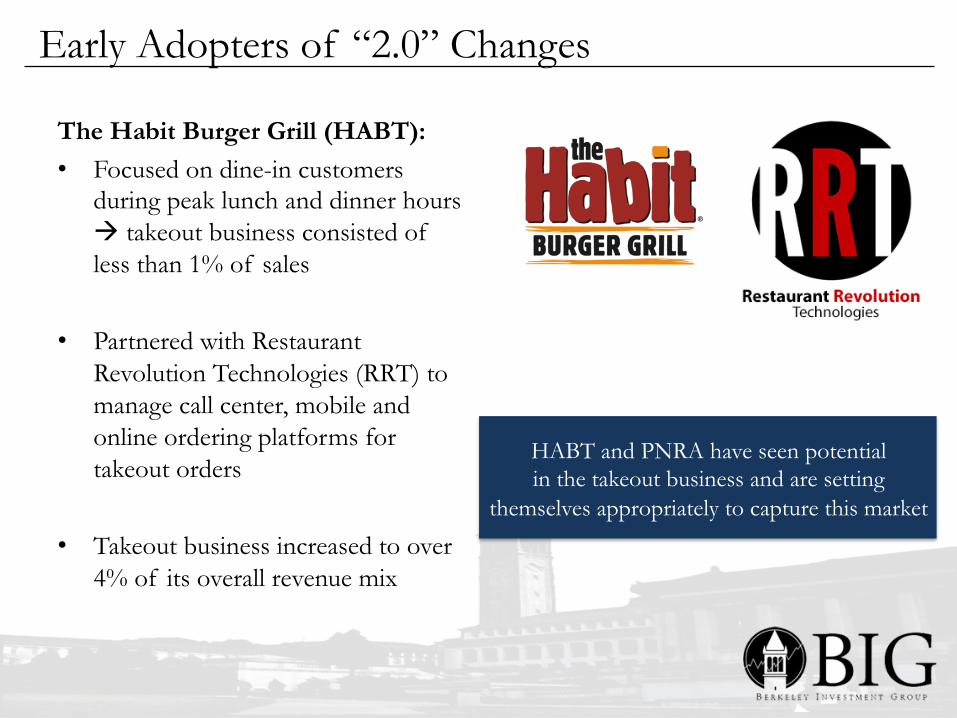
Early Adopters of “2.0” Changes
The Habit Burger Grill (HABT): • Focused on dine-in customers
during peak lunch and dinner hours à takeout business consisted of less than 1% of sales
• Partnered with Restaurant Revolution Technologies (RRT) to manage call center, mobile and online ordering platforms for takeout orders
• Takeout business increased to over 4% of its overall revenue mix
HABT and PNRA have seen potential in the takeout business and are setting
themselves appropriately to capture this market
Franchising
Fundamentals
Store Growth Panera 2.0
Variant Perception
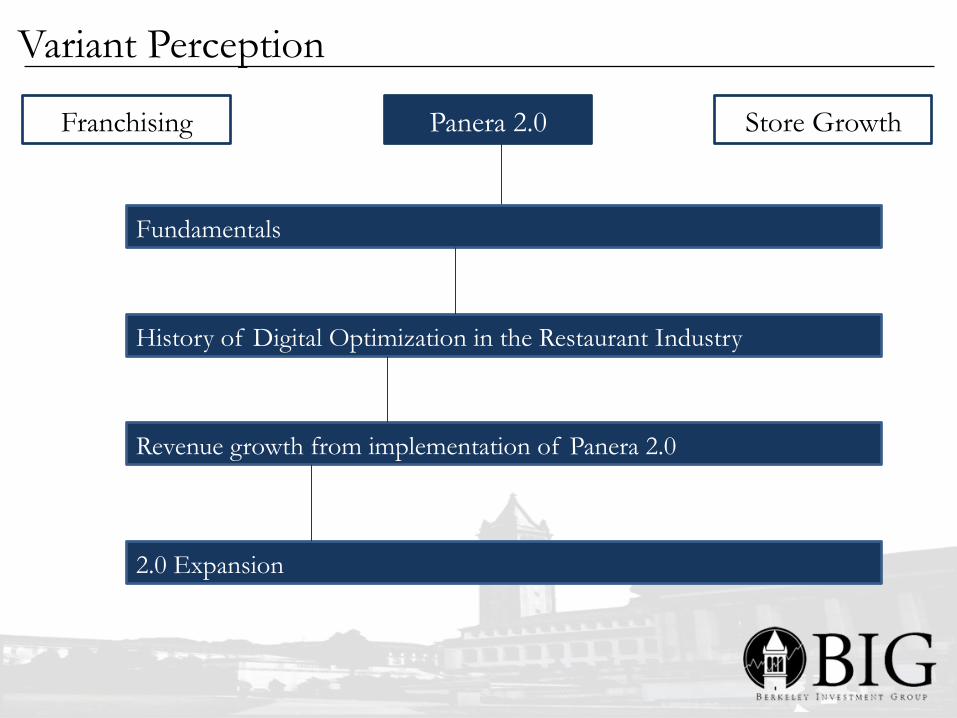
Revenue growth from implementation of Panera 2.0
History of Digital Optimization in the Restaurant Industry
Panera 2.0 as a Revenue Driver (cont.)
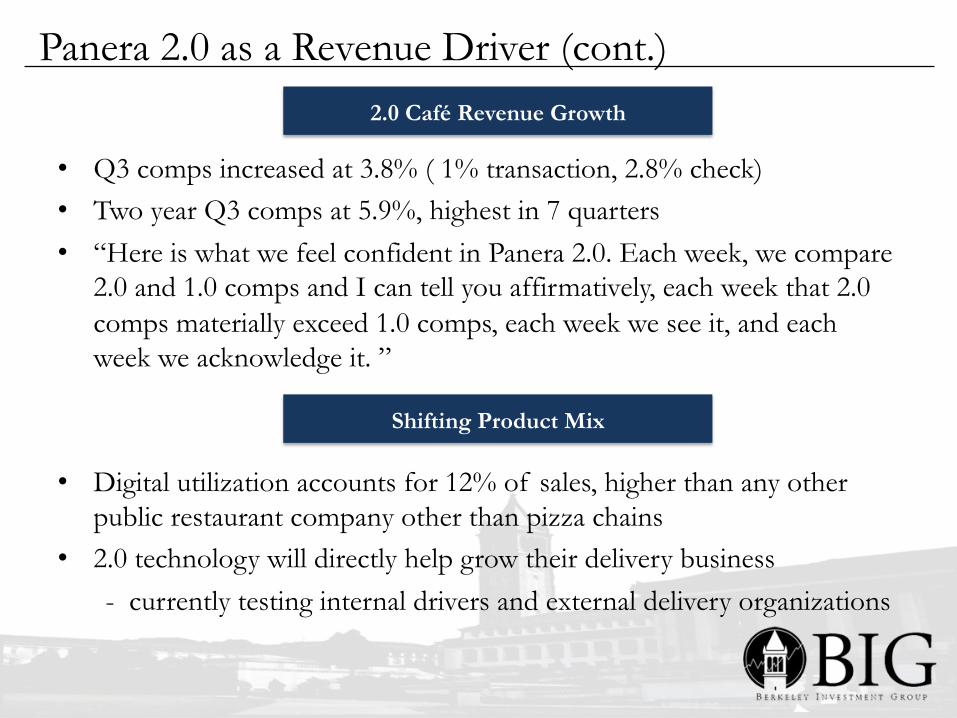
• Q3 comps increased at 3.8% ( 1% transaction, 2.8% check) • Two year Q3 comps at 5.9%, highest in 7 quarters • “Here is what we feel confident in Panera 2.0. Each week, we compare
2.0 and 1.0 comps and I can tell you affirmatively, each week that 2.0 comps materially exceed 1.0 comps, each week we see it, and each week we acknowledge it. ”
2.0 Café Revenue Growth
• Digital utilization accounts for 12% of sales, higher than any other public restaurant company other than pizza chains
• 2.0 technology will directly help grow their delivery business - currently testing internal drivers and external delivery organizations
Shifting Product Mix
Panera 2.0 as a Revenue Driver
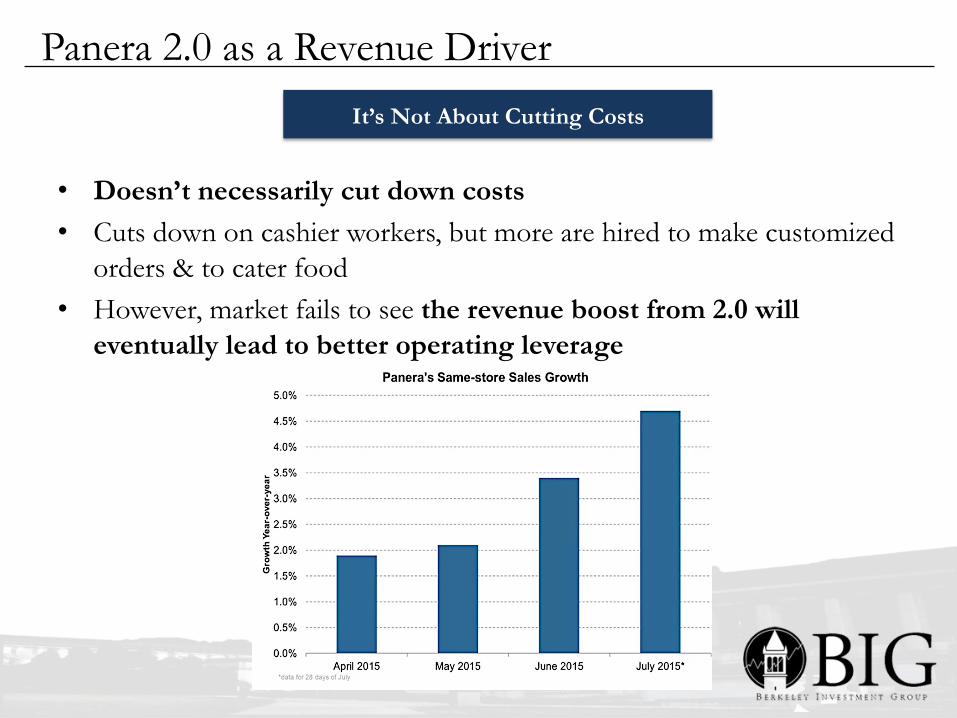
• Doesn’t necessarily cut down costs • Cuts down on cashier workers, but more are hired to make customized
orders & to cater food • However, market fails to see the revenue boost from 2.0 will
eventually lead to better operating leverage
It’s Not About Cutting Costs
Franchising Store Growth Panera 2.0
Variant Perception
2.0 Expansion
Fundamentals
Revenue growth from implementation of Panera 2.0
History of Digital Optimization in the Restaurant Industry
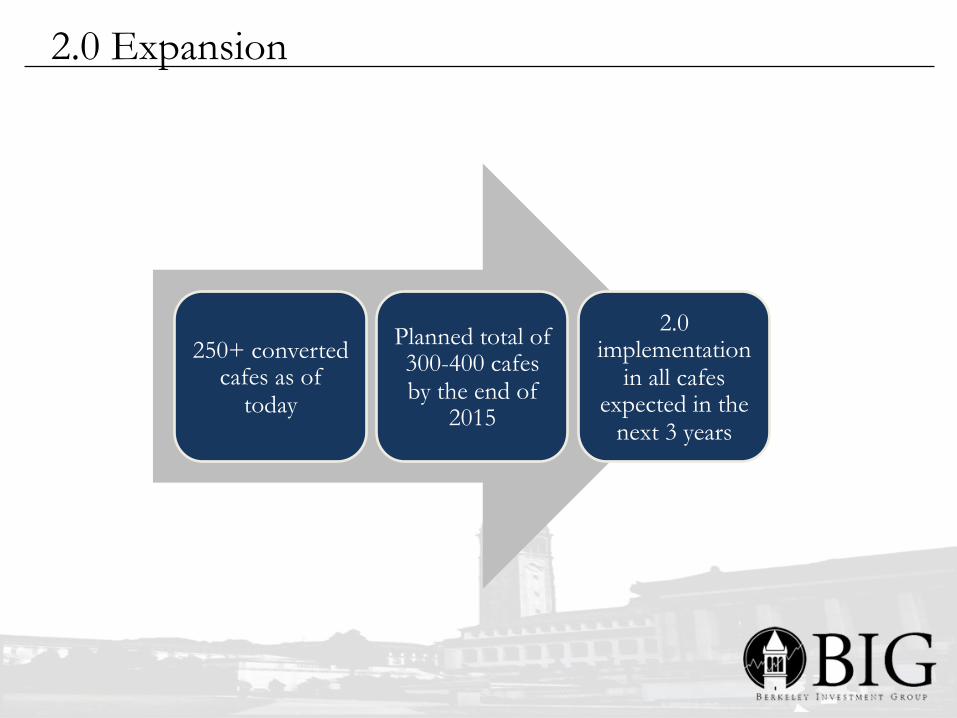
2.0 Expansion
250+ converted cafes as of
today
Planned total of 300-400 cafes by the end of
2015
2.0 implementation
in all cafes expected in the
next 3 years
Franchising
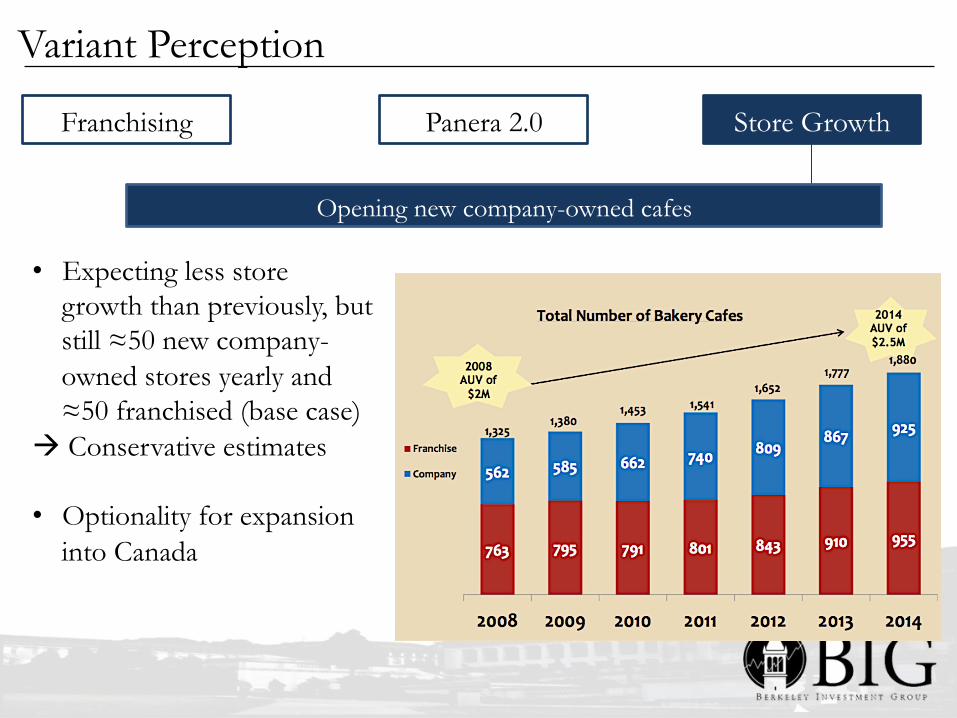
Opening new company-owned cafes
Store Growth Panera 2.0
Variant Perception
• Expecting less store growth than previously, but still ≈50 new company-owned stores yearly and ≈50 franchised (base case)
à Conservative estimates
• Optionality for expansion into Canada
Variant Perception
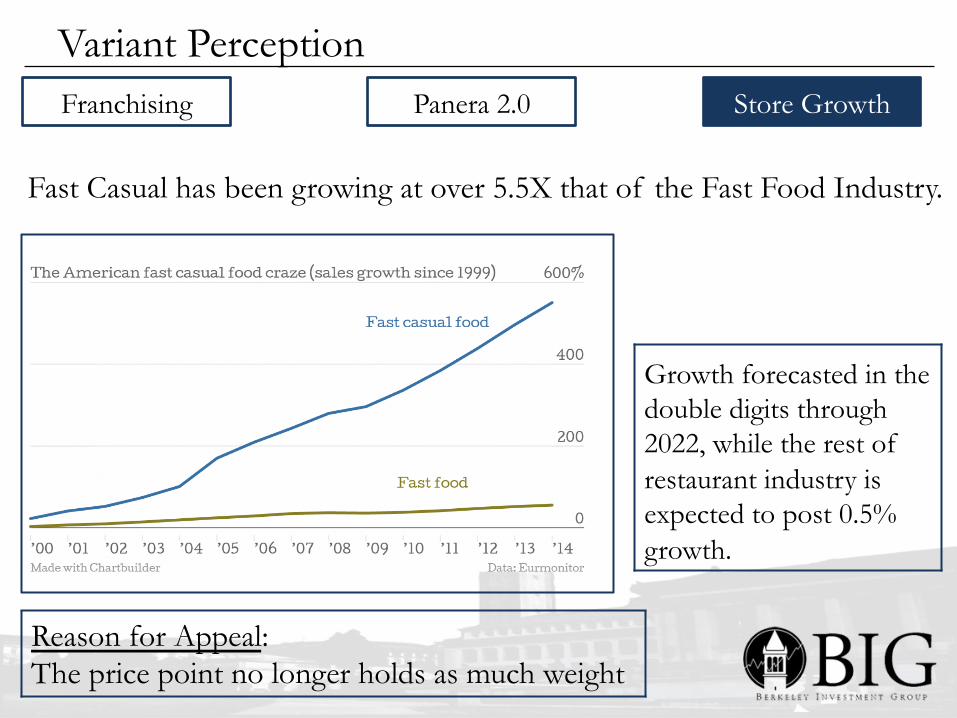
Fast Casual has been growing at over 5.5X that of the Fast Food Industry.
Growth forecasted in the double digits through 2022, while the rest of restaurant industry is expected to post 0.5% growth.
Reason for Appeal: The price point no longer holds as much weight
Franchising Store Growth Panera 2.0
Variant Perception Franchising Store Growth Panera 2.0
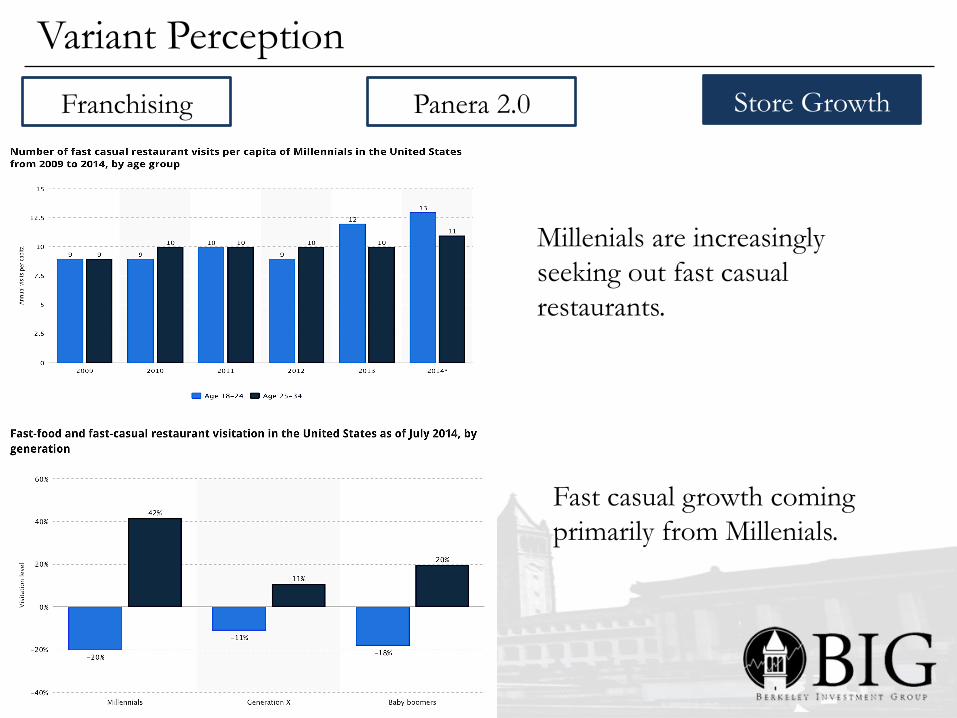
Millenials are increasingly seeking out fast casual restaurants.
Fast casual growth coming primarily from Millenials.
Franchising Store Growth Panera 2.0
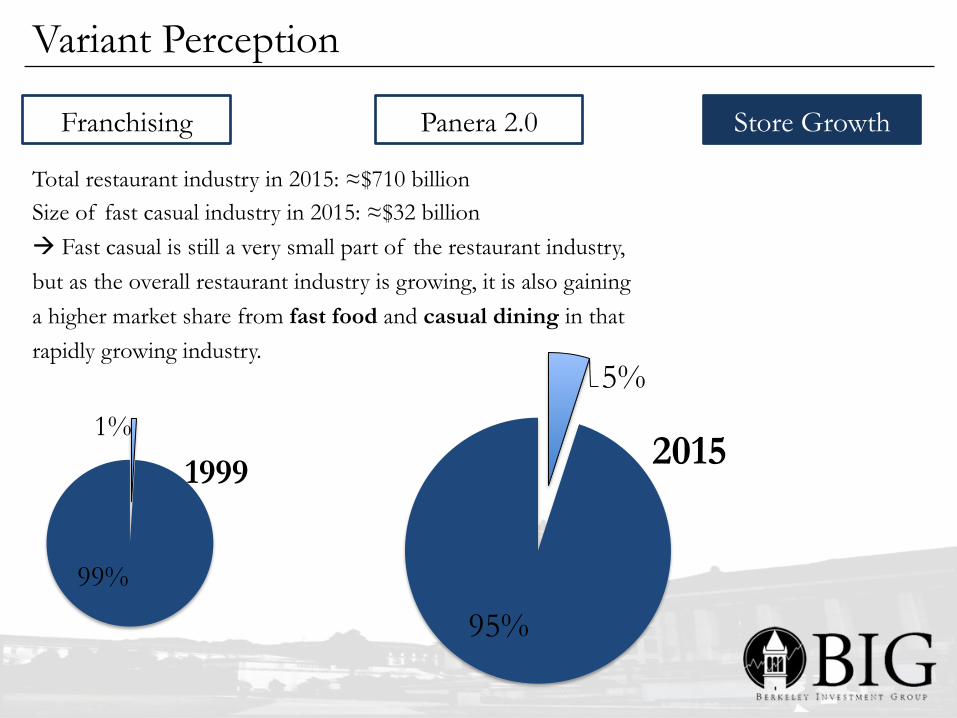
Total restaurant industry in 2015: ≈$710 billion Size of fast casual industry in 2015: ≈$32 billion à Fast casual is still a very small part of the restaurant industry, but as the overall restaurant industry is growing, it is also gaining a higher market share from fast food and casual dining in that rapidly growing industry.
1%
99%
1999
5%
95%
2015
Variant Perception

Valuation & Recommendation
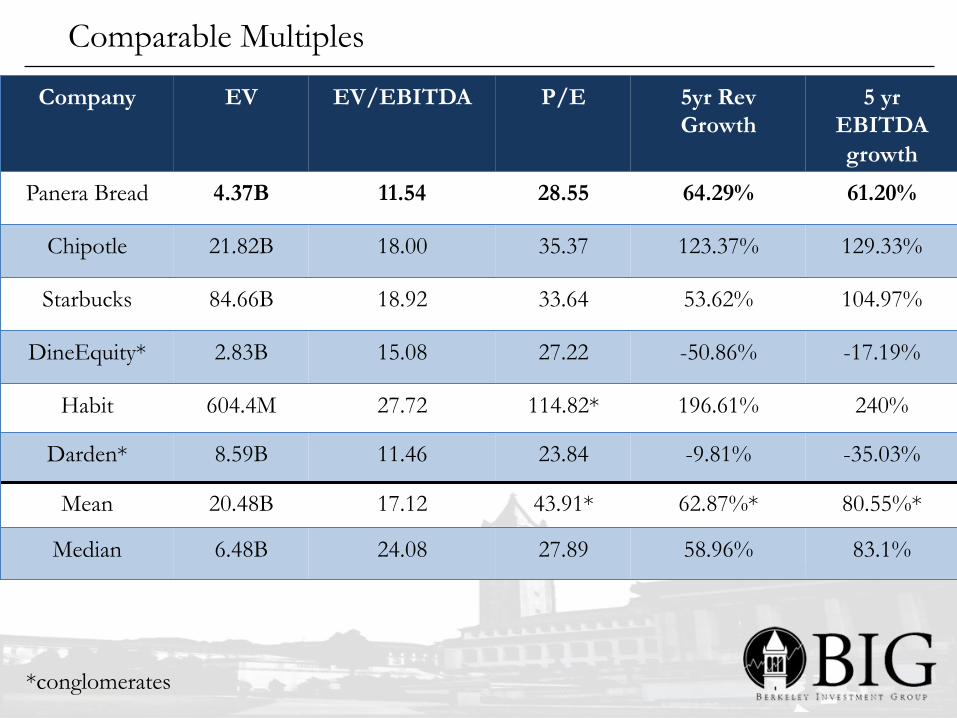
Company EV EV/EBITDA P/E 5yr Rev Growth
5 yr EBITDA growth
Panera Bread 4.37B 11.54 28.55 64.29% 61.20%
Chipotle 21.82B 18.00 35.37 123.37% 129.33%
Starbucks 84.66B 18.92 33.64 53.62% 104.97%
DineEquity* 2.83B 15.08 27.22 -50.86% -17.19%
Habit 604.4M 27.72 114.82* 196.61% 240%
Darden* 8.59B 11.46 23.84 -9.81% -35.03%
Mean 20.48B 17.12 43.91* 62.87%* 80.55%*
Median 6.48B 24.08 27.89 58.96% 83.1%
*conglomerates
Comparable Multiples
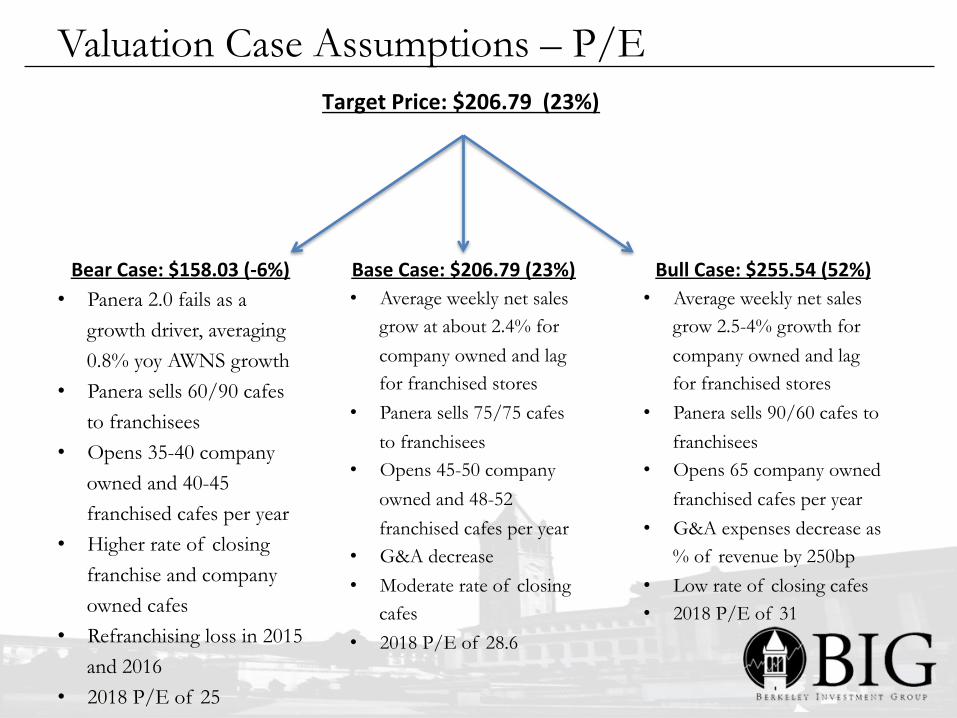
Valuation Case Assumptions – P/E Target Price: $206.79 (23%)
Bear Case: $158.03 (-‐6%) • Panera 2.0 fails as a
growth driver, averaging 0.8% yoy AWNS growth
• Panera sells 60/90 cafes to franchisees
• Opens 35-40 company owned and 40-45 franchised cafes per year
• Higher rate of closing franchise and company owned cafes
• Refranchising loss in 2015 and 2016
• 2018 P/E of 25
Base Case: $206.79 (23%) • Average weekly net sales
grow at about 2.4% for company owned and lag for franchised stores
• Panera sells 75/75 cafes to franchisees
• Opens 45-50 company owned and 48-52 franchised cafes per year
• G&A decrease • Moderate rate of closing
cafes • 2018 P/E of 28.6
Bull Case: $255.54 (52%) • Average weekly net sales
grow 2.5-4% growth for company owned and lag for franchised stores
• Panera sells 90/60 cafes to franchisees
• Opens 65 company owned franchised cafes per year
• G&A expenses decrease as % of revenue by 250bp
• Low rate of closing cafes • 2018 P/E of 31
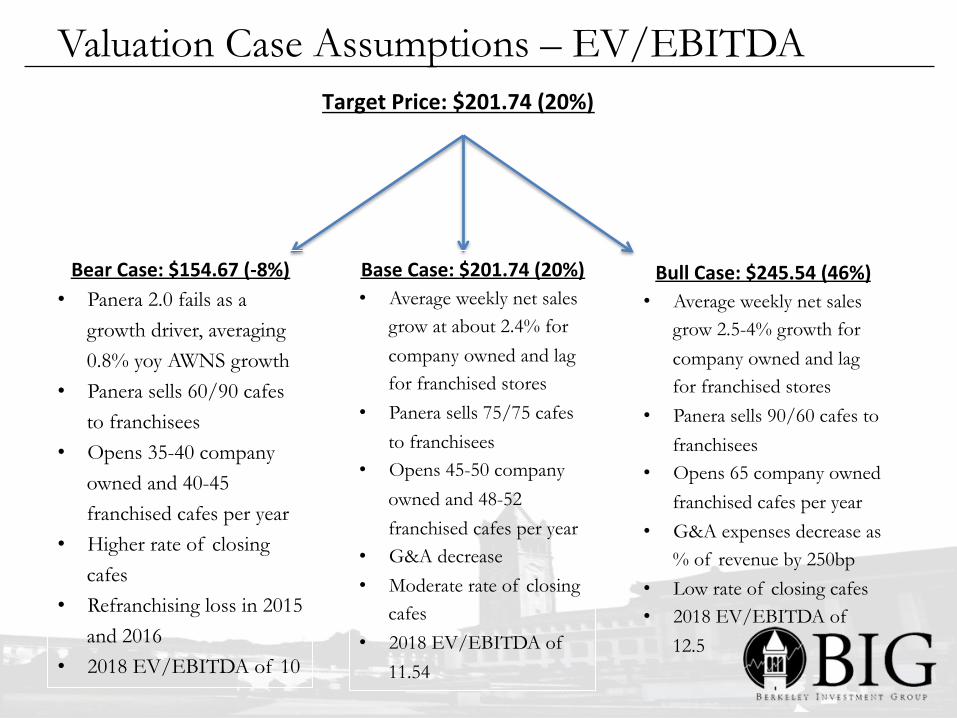
Valuation Case Assumptions – EV/EBITDA Target Price: $201.74 (20%)
Bear Case: $154.67 (-‐8%) • Panera 2.0 fails as a
growth driver, averaging 0.8% yoy AWNS growth
• Panera sells 60/90 cafes to franchisees
• Opens 35-40 company owned and 40-45 franchised cafes per year
• Higher rate of closing cafes
• Refranchising loss in 2015 and 2016
• 2018 EV/EBITDA of 10
Base Case: $201.74 (20%) • Average weekly net sales
grow at about 2.4% for company owned and lag for franchised stores
• Panera sells 75/75 cafes to franchisees
• Opens 45-50 company owned and 48-52 franchised cafes per year
• G&A decrease • Moderate rate of closing
cafes • 2018 EV/EBITDA of
11.54
Bull Case: $245.54 (46%) • Average weekly net sales
grow 2.5-4% growth for company owned and lag for franchised stores
• Panera sells 90/60 cafes to franchisees
• Opens 65 company owned franchised cafes per year
• G&A expenses decrease as % of revenue by 250bp
• Low rate of closing cafes • 2018 EV/EBITDA of
12.5
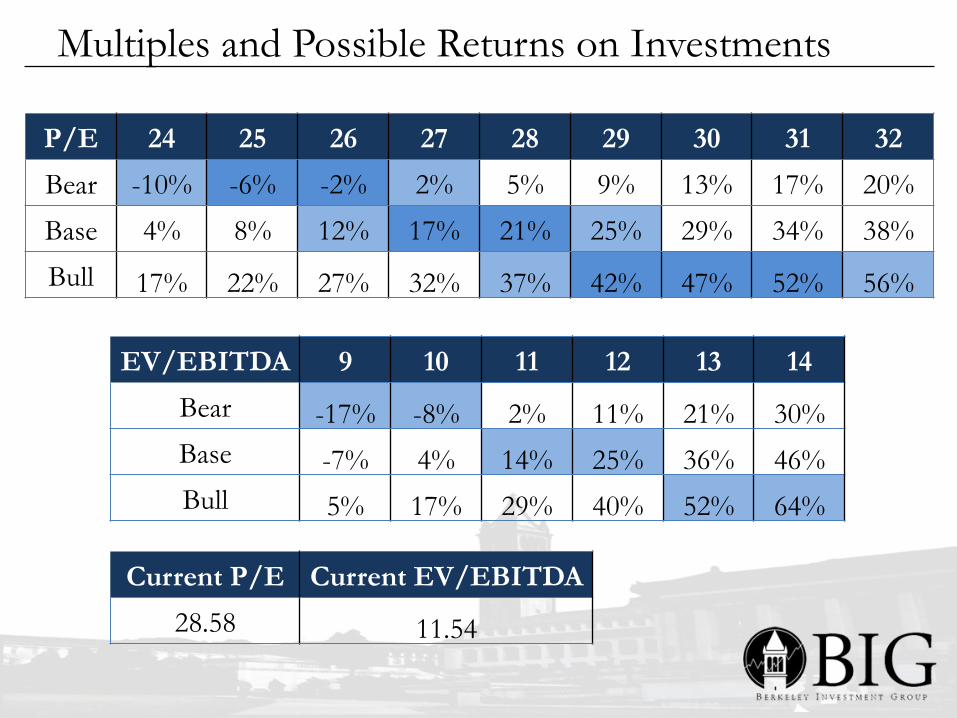
Multiples and Possible Returns on Investments
P/E 24 25 26 27 28 29 30 31 32
Bear -10% -6% -2% 2% 5% 9% 13% 17% 20%
Base 4% 8% 12% 17% 21% 25% 29% 34% 38%
Bull 17% 22% 27% 32% 37% 42% 47% 52% 56%
EV/EBITDA 9 10 11 12 13 14
Bear -17% -8% 2% 11% 21% 30% Base -7% 4% 14% 25% 36% 46% Bull 5% 17% 29% 40% 52% 64%
Current P/E Current EV/EBITDA
28.58 11.54
We recommend a long position using 5-7% of the portfolio to purchase Panera Bread for an expected
20% return.
Recommendation and Q&A
Questions?
Appendix
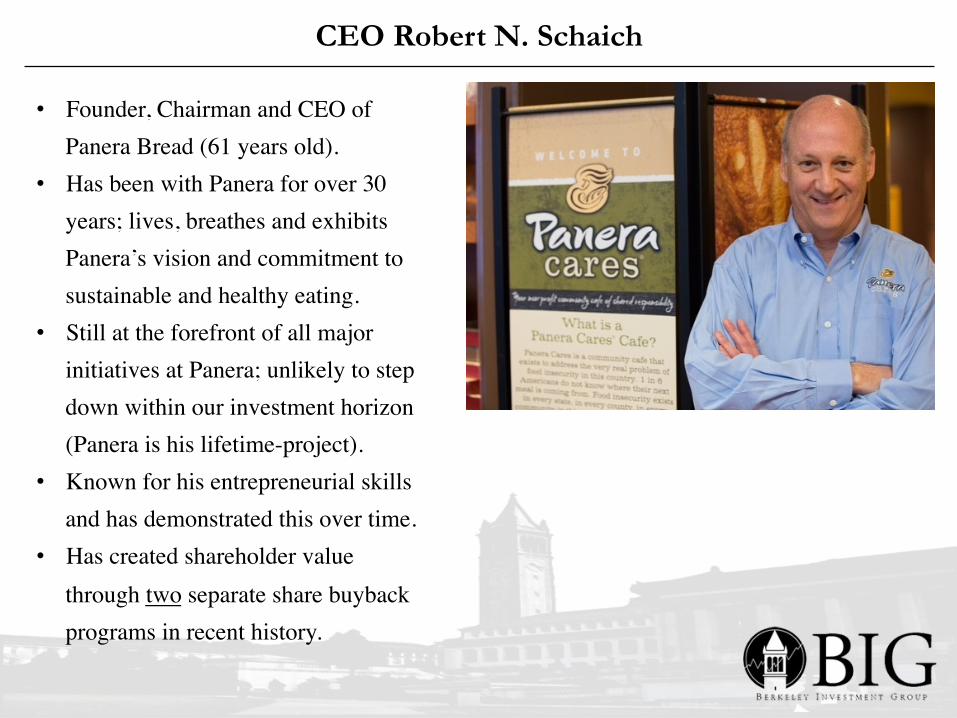
CEO Robert N. Schaich
• Founder, Chairman and CEO of Panera Bread (61 years old).
• Has been with Panera for over 30 years; lives, breathes and exhibits Panera’s vision and commitment to sustainable and healthy eating.
• Still at the forefront of all major initiatives at Panera; unlikely to step down within our investment horizon (Panera is his lifetime-project).
• Known for his entrepreneurial skills and has demonstrated this over time.
• Has created shareholder value through two separate share buyback programs in recent history.
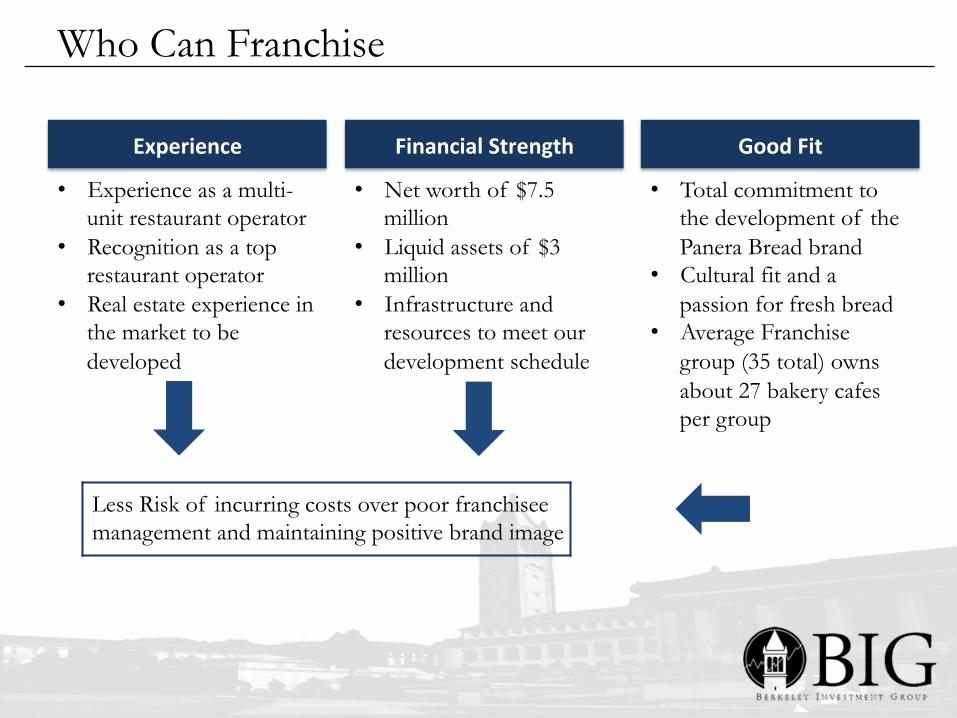
Who Can Franchise
Experience Financial Strength Good Fit
• Experience as a multi-unit restaurant operator
• Recognition as a top restaurant operator
• Real estate experience in the market to be developed
• Net worth of $7.5 million
• Liquid assets of $3 million
• Infrastructure and resources to meet our development schedule
• Total commitment to the development of the Panera Bread brand
• Cultural fit and a passion for fresh bread
• Average Franchise group (35 total) owns about 27 bakery cafes per group
Less Risk of incurring costs over poor franchisee management and maintaining positive brand image