Embed Size (px)
Citation preview
NASA/TM-2000-210289
Parametric Weight Comparison ofAdvanced Metallic, Ceramic Tile, andCeramic Blanket Thermal Protection
Systems
David E. Myers, Carl J. Martin, and Max L. Blosser
Langley Research Center, Hampton, Virginia
National Aeronautics and
Space Administration
Langley Research CenterHampton, Virginia 23681-2199
June 2000
https://ntrs.nasa.gov/search.jsp?R=20000062016 2020-06-20T18:11:26+00:00Z
The use of trademarks or names of manufacturers in the report is for accurate reporting and does not
constitute an official endorsement, either expressed or implied, of such products or manufacturers by theNational Aeronautics and Space Administration or the U.S. Army.
Available from:
NASA (?enter for AeroSpace Information (CASI)7121 Standard Drive
Hanover, MD 21076-1320
(301) 621-0390
National Technical Information Service (NTIS)5285 Port Royal Road
Springfield, VA 22161-2171(703) 605-6000
ABSTRACT
A parametric weight assessment of advanced metallic panel,ceramic blanket, and ceramic tile thermal protection systems (TPS)
was conducted using an implicit, one-dimensional (l-D)finite
element sizing code. This sizing code contained models to account
for coatings, fasteners, adhesives, and strain isolation pads.
Atmospheric entry heating profiles for two vehicles, the Access to
Space (ATS) vehicle and a proposed Reusable Launch Vehicle
(RLV), were used to ensure that the trends were not unique to a
certain trajectory. Ten TPS concepts were compared for a range of
applied heat loads and substructural heat capacities to identify
general trends. This study found the blanket TPS concepts have the
lightest weights over the majority of their applicable ranges, and
current technology ceramic tiles and metallic TPS concepts have
similar weights. A proposed, state-of-the-art metallic system which
uses a higher temperature alloy and efficient multilayer insulation
was predicted to be significantly lighter than the ceramic tile
systems and approaches blanket TPS weights for higher integrated
heat loads.
SYMBOL LIST
Up
Cp
k
P
Q
q
T
TRaa
t
txl
tx2
E
P
Total Structural Heat Capacity, Btu/ft2-°R
Specific Heat Capacity, Btu/lb-°R
Thermal Conductivity, Btu/ft-s-°R
Pressure, lb/fl 2
Total Unit Heat Load, Btu/ft 2
Heat Flux, Btu/ft2-s
Temperature, °R
Radiation Equilibrium Temperature, °F
Structural or Insulation Thickness, in. or ft.
Inner Insulation on a TPS Concept, in.
Outer Insulation on a TPS Concept, in.
Emissivity
Structural Density, lb/fl 3
INTRODUCTION
A number of reusable hypersonic vehicles are being proposed and studied to augment the current
Space Shuttle. Proposed vehicles include the Reusable Launch Vehicle (RLV) 1, military spaceplane 2,
spaceplanes for tourism 3, space trucks 4, suborbital package delivery vehicles 5, and hypersonic
airbreathing vehicles 6. One of the key technologies required by all of these vehicles is a reusable, low
maintenance, light weight thermal protection system (TPS). Although the primary function of a TPS
is to protect the vehicle from aerodynamic heating, the operational capability and system weight also
have significant impact on vehicle performance. For commercial viability, the TPS must minimize
life cyclecoststo enabledeliveryof commercialpayloadsat reasonablecost. For militaryapplications,theTPSmustenablehighperformance,rapidresponse,andrapidturnaroundunderadverseconditions.
ThemostextensiveexperiencewithreusableTPSiswiththeceramictileandblanketTPSontheSpaceShuttleorbiter.AlthoughtheorbiterTPSdoesanexcellentjob of protectingthevehiclefromaerodynamicheating,morethan40,000workhours7areexpendedto refurbishtheTPSbetweenflights. Becauseof thefragilenatureof theorbitercurrentTPS,theorbitercannotfly throughrain,andgreatcaremustbetakenin routinemaintenanceto avoiddamagingtheTPS.Suchfragile,highmaintenanceTPSis clearlyunacceptablefor futurecommercialandrapidturnaroundhypersonicvehicles.
Toachievethegoalsof lowlifecyclecostandrapidturnaround,TPSforfuturereusablevehiclesmustberobustandlowmaintenance,yetefficientlyprotectthevehiclesfromaerodynamicheating.TheTPSmustsurvivetheoperationalenvironmentwithminimalrefurbishment.Thatenvironmentincludeslow-andhigh-velocityimpact(e.g.droppedtoolsduringmaintenanceproceduresandorbitaldebris,respectively);rain;andaerothermal,acoustic,andthermal-mechanicalloads.In addition,theTPSshouldbeeasytoinspect,maintain,andrepair;shouldnotrequirewaterproofingbetweenflights;andshouldberuggedanddamagetolerant.Of course,anoverridingconcernfor anyTPSis systemweight. TPSweightis particularlyimportantfor single-stage-to-orbitvehicleswhichhavelargesurfaceareasrequiringthermalprotection.ThereisgenerallyatradeoffbetweenTPSdurabilityandweight.
A varietyof reusableTPSconceptsarebeingdevelopedto addresstherequirementsof futurehypersonicvehicles.Developmentof improvedceramicTPSis beingledby theNASAAmesResearchCenter8. Ceramictiles,suchasaluminaenhancedthermalbarrier(AETB)9withtoughenedunipiecefibrousinsulation(TUFI)andreactioncuredglass(RCG)coatings,havebeendevelopedtobesignificantlystrongerandmoreresistantto rainerosionthanthecurrentShuttletiles. Tailorableadvancedblanketinsulation(TABI)_°,alsodevelopedbyNASAAmes,isbeingproposedasacheapermoreeasilyintegratedandinstalledreplacementfor tilesoverlargeareasoffuturevehicles.MetallicTPSrepresentanotherpromisingalternativereusableconcept.Muchof thedevelopmentof metallicTPSIt isbeingledbytheNASALangleyResearchCenter(LaRC).Conceptsdevelopmentproceededfromearlystand-offheatshieldstotitaniummultiwallconcepts(TIMW)12toprepackagedsuperalloyhoneycombsandwichpanels(SA/HC)_3.Thedetaileddesignandfabricationof theTIMW andSA/HCTPSconceptswereperformedbyRohrIncorporated(nowB. F. Goodrich Aerospace). The
SA/HC TPS was further improved and tested under a recent cooperative agreement _ between
McDonnell Douglas Aerospace and the NASA LaRC. A derivative of the SA/HC concept, developedby B. F. Goodrich, is the primary TPS on the X-331, an experimental RLV technology demonstrator
vehicle (Appendix A).
Selection of the optimum TPS for a particular vehicle is a complex and challenging task thatrequires consideration of not only weight, but also operability, maintenance, durability, initial cost,
life-cycle cost, and integration with the vehicle structures, including cryogenic propellant tanks. The
current paper undertakes a much less ambitious task: weight comparisons among several TPS
concepts using a one-dimensional, transient TPS sizing code. No structural resizing is performed in
the current study. Component dimensions from existing designs are used. Three families of TPS are
considered: metallic panels, rigid ceramic tiles, and flexible ceramic blankets. This includes current
Shuttle TPS, advanced TPS which have been fabricated and tested, and proposed TPS concepts which
incorporate improved materials and designs. For this study, the TPS is assumed to be directly
attached to a smooth, adiabatic structure and is sized using entry heating profiles representative of
future reusable reentry vehicles. The material properties and assumptions used in the analysis are
documented in this paper. Key parameters, such as total heat load and structural heat capacity, are
varied to obtain TPS weight comparisons over a wide range of conditions.
ANALYSIS
This section describes the basic assumptions and analytical methods used in the parametric study
of TPS weights. Included are details of the simplified thermal problem analyzed, the one-dimensional
TPS sizing code used, and model verification studies performed. Further details are included in the
appendices. Appendix B includes the comparisons of the 1-D analysis model results with 2-D detailed
model results for all the TPS concepts, Appendix C includes the material properties used in the
thermal models, and Appendix D includes the component weight models for the TPS concepts.
Simplified Thermal Model
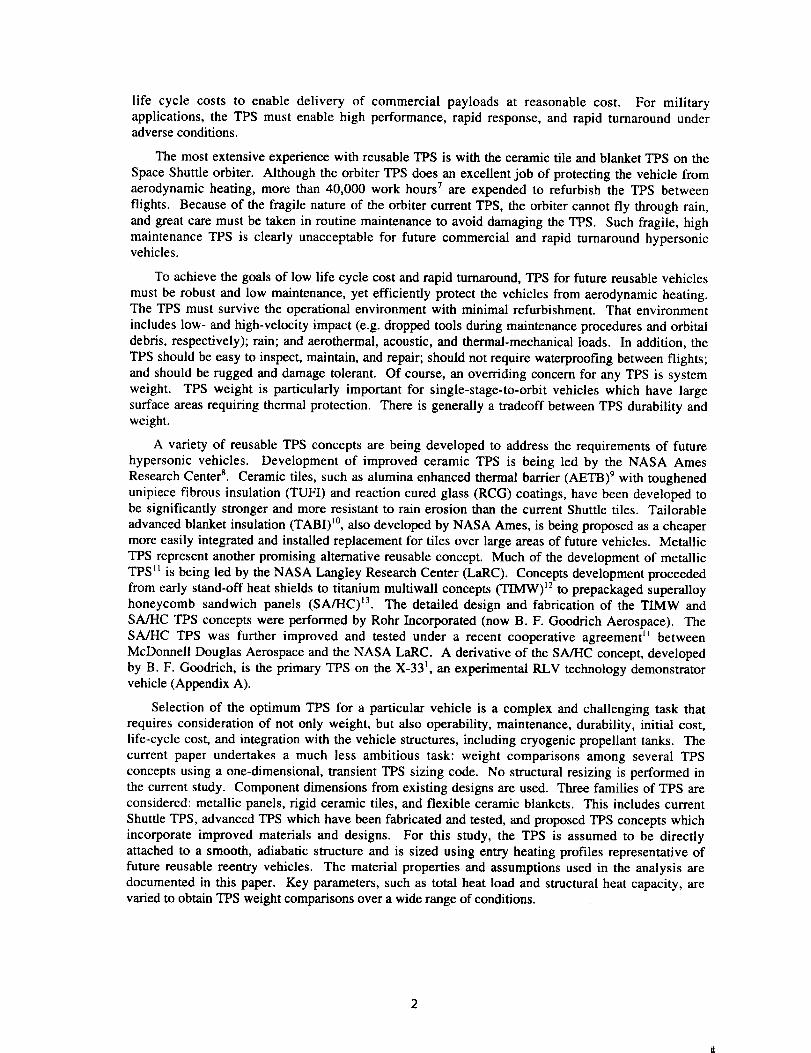
The idealized TPS and structure combination considered in this study is shown in figure 1. This
simplified arrangement was selected so that the performance of the various thermal protection systems
could be directly compared. The TPS is directly attached to an underlying 0.1 inch-thick aluminum
structure. A transient heat flux profile is applied to the outer surface of the TPS, and the inner surface
of the structure is assumed to be adiabatic, or perfectly insulated. The structure is limited to a
maximum temperature of 300 °F, and the minimum required thermal protection system thickness, t, is
determined, or sized, to satisfy this temperature limit.
T-t
300°F
max. /
Aluminum Structure
Figure 1. Simplified thermal model of TPS sizing problem.
One-dimensional (l-D) TPS Sizing Code
A thermal protection system sizing code was used to determine the required TPS thickness and
resulting weight. The TPS sizing code uses a nonlinear, implicit, one-dimensional, transient, finite
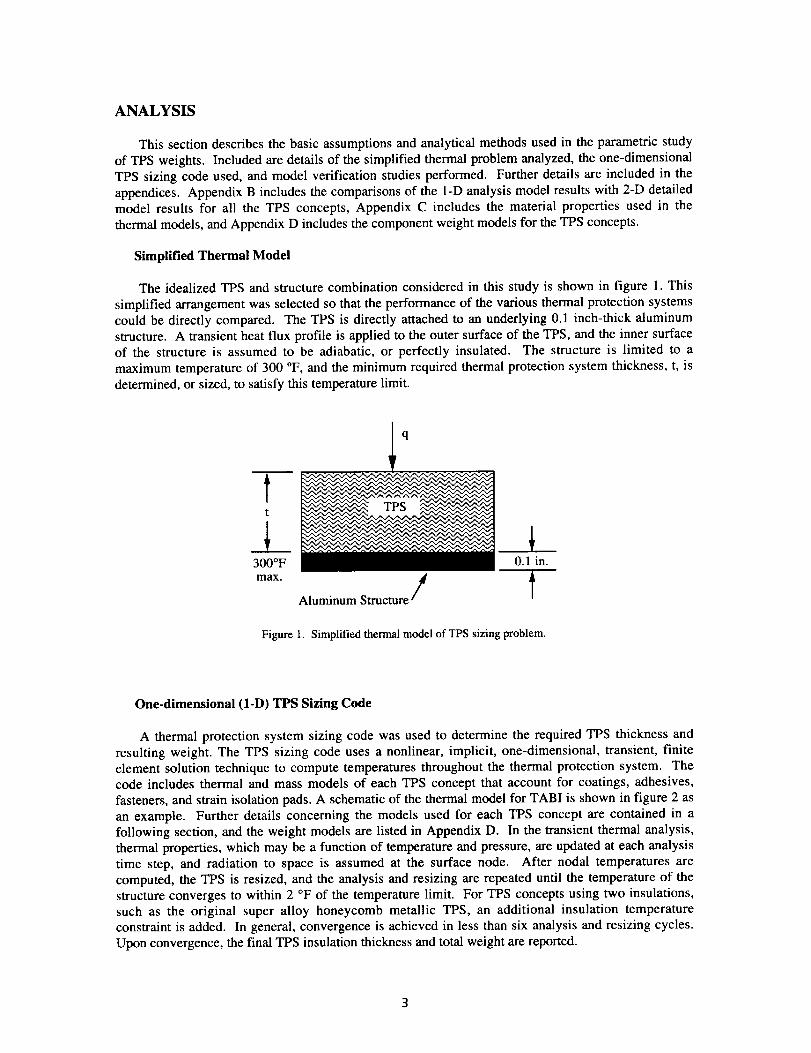
element solution technique to compute temperatures throughout the thermal protection system. Thecode includes thermal and mass models of each TPS concept that account for coatings, adhesives,
fasteners, and strain isolation pads. A schematic of the thermal model for TABI is shown in figure 2 as
an example. Further details concerning the models used for each TPS concept are contained in a
following section, and the weight models are listed in Appendix D. In the transient thermal analysis,
thermal properties, which may be a function of temperature and pressure, are updated at each analysis
time step, and radiation to space is assumed at the surface node. After nodal temperatures are
computed, the TPS is resized, and the analysis and resizing are repeated until the temperature of the
structure converges to within 2 °F of the temperature limit. For TPS concepts using two insulations,
such as the original super alloy honeycomb metallic TPS, an additional insulation temperatureconstraint is added. In general, convergence is achieved in less than six analysis and resizing cycles.
Upon convergence, the final TPS insulation thickness and total weight are reported.
C9 Coating and
Outer Fabric (lumped) ,,_
Corrugations (smeared)
_Structure, Inner Fabric,
and RTV (lumped)
Figure 2. Conversion of a TPS concept to its thermal model
Two-dimensional (2-D) Finite Element Analysis and Comparison with 1-D Results
The TPS sizing code predicts the overall TPS thermal performance using simple, one-dimensional
models. The validity of the simplifications used in the 1-D thermal analysis models was investigated
by comparing the results with those from more elaborate 2-D Engineering Analysis Language (EAL) 14
finite element analyses. The 2-D models used the same material properties as the 1-D models, but
included more geometric detail. For verification purposes, each TPS concept was sized using the 1-D
sizing code which also predicted temperatures through the TPS and structure. A 2-D model was then
constructed and analyzed using the same TPS and structural thicknesses. The temperatures,
particularly the structure temperature which drives the TPS sizing, were compared to check the
accuracy of the l-D models.
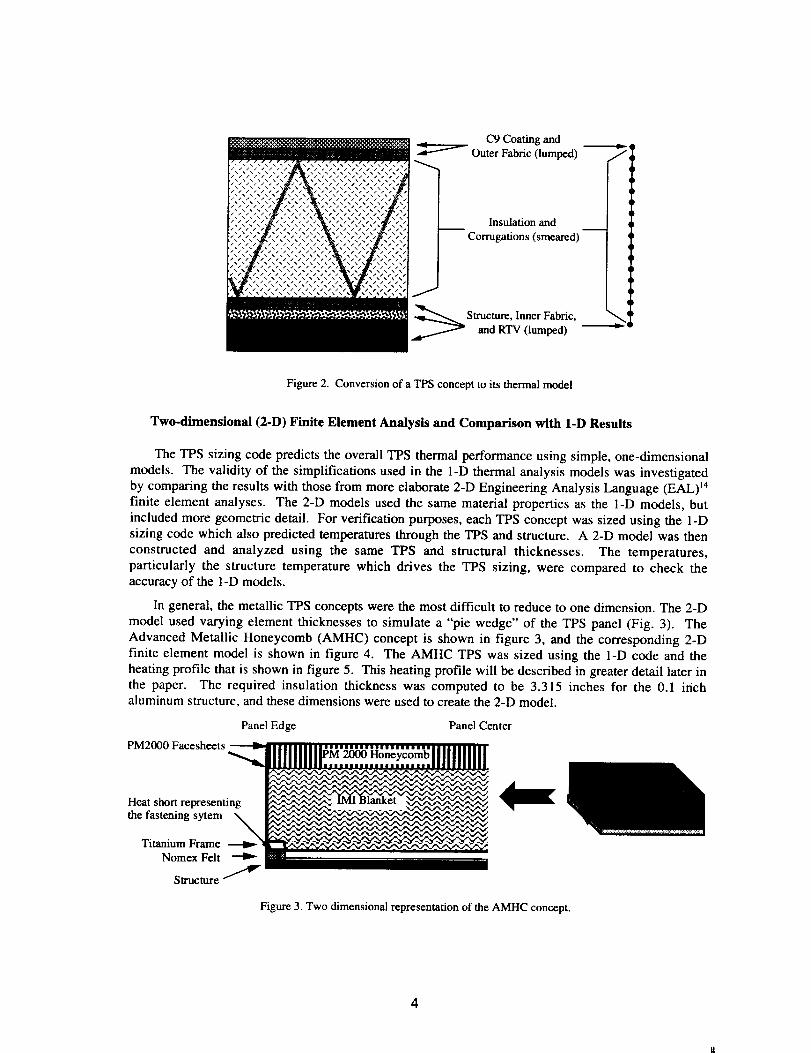
In general, the metallic TPS concepts were the most difficult to reduce to one dimension. The 2-D
model used varying element thicknesses to simulate a "pie wedge" of the TPS panel (Fig. 3). The
Advanced Metallic Honeycomb (AMHC) concept is shown in figure 3, and the corresponding 2-D
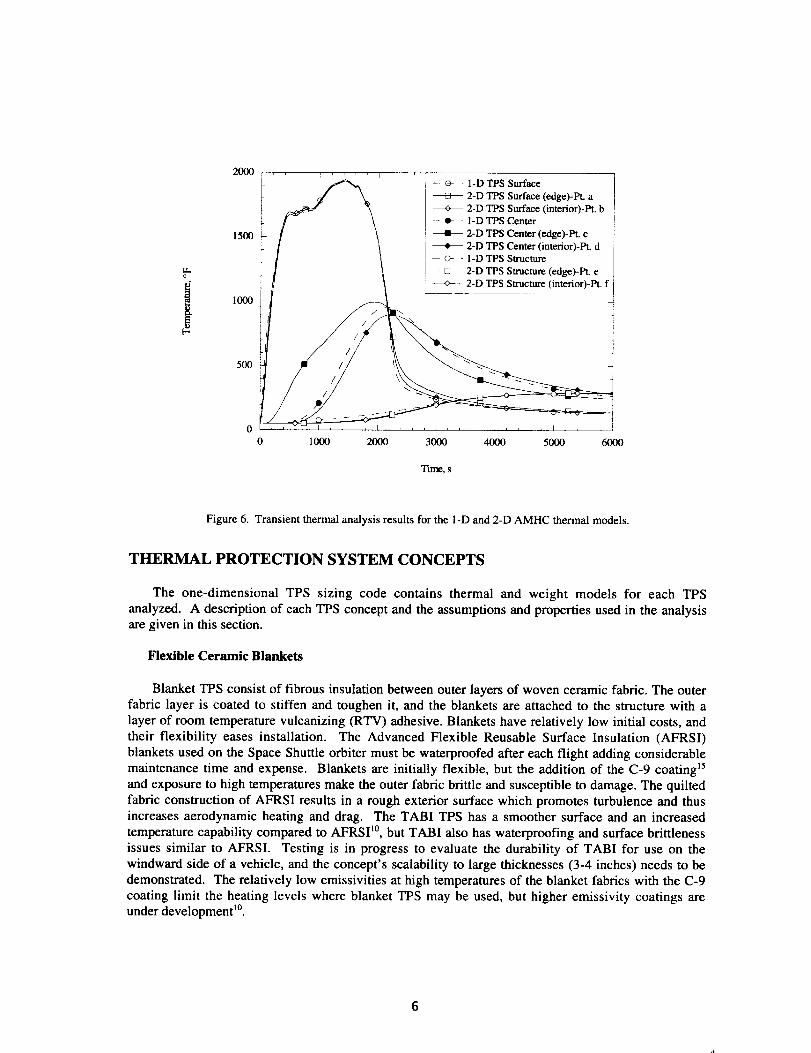
finite element model is shown in figure 4. The AMHC TPS was sized using the 1-D code and the
heating profile that is shown in figure 5. This heating profile will be described in greater detail later in
the paper. The required insulation thickness was computed to be 3.315 inches for the 0.1 inch
aluminum structure, and these dimensions were used to create the 2-D model.
Panel Edge Panel Center
PM2000 Facesheets
Heat short representing
the fastening sytem
Titanium Frame
Nomex Felt
Structure
Figure 3. Two dimensional representation of the AMHC concept.
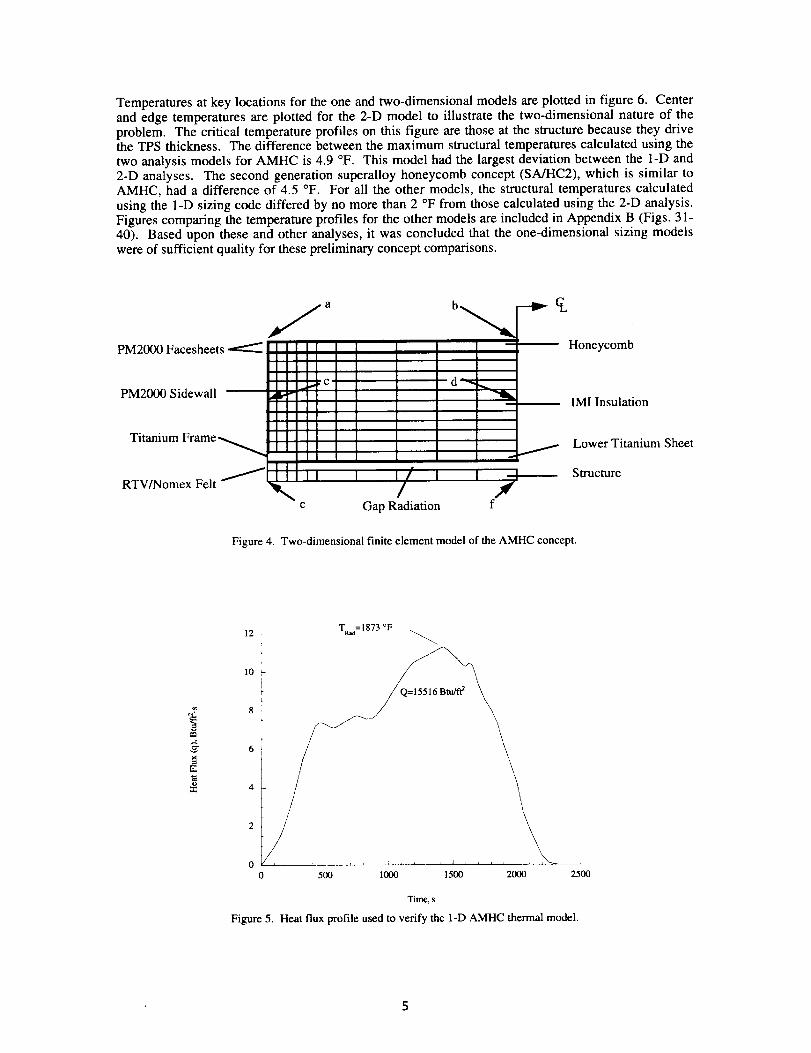
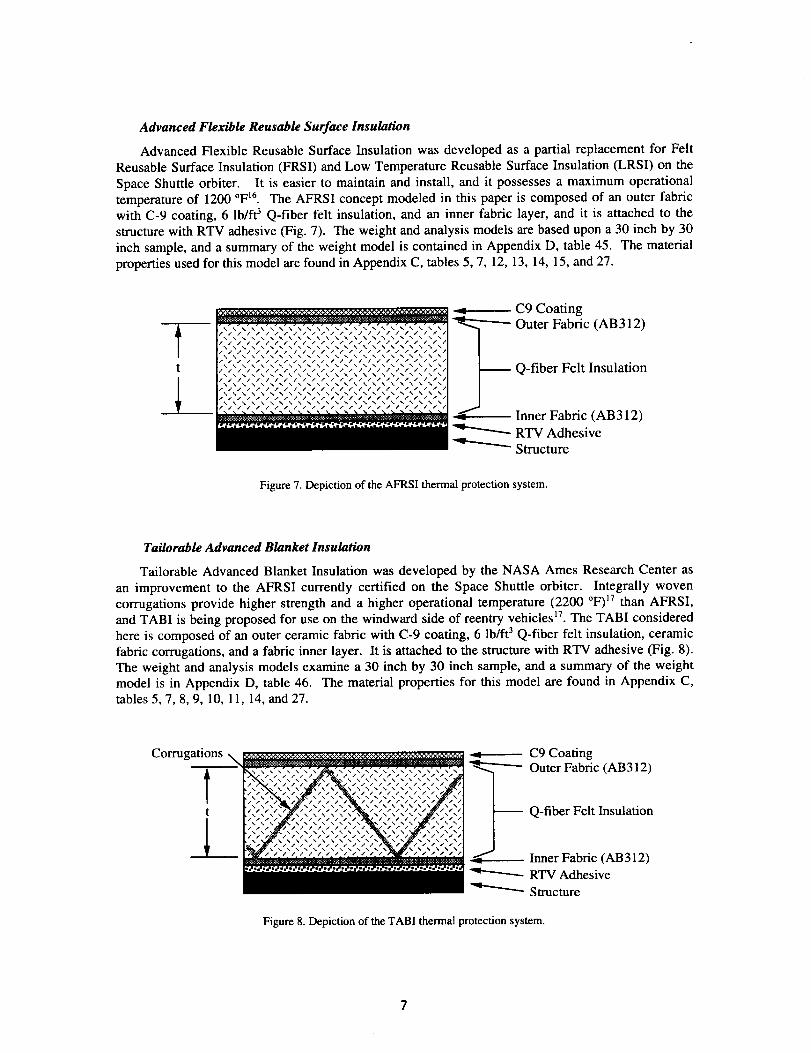
Temperatures at key locations for the one and two-dimensional models are plotted in figure 6. Centerand edge temperatures are plotted for the 2-D model to illustrate the two-dimensional nature of theproblem. The critical temperature profiles on this figure are those at the structure because they drivethe TPS thickness. The difference between the maximum structural temperatures calculated using the
two analysis models for AMHC is 4.9 °F. This model had the largest deviation between the l-D and2-D analyses. The second generation superalloy honeycomb concept (SA/HC2), which is similar toAMHC, had a difference of 4.5 °F. For all the other models, the structural temperatures calculated
using the l-D sizing code differed by no more than 2 °F from those calculated using the 2-D analysis.Figures comparing the temperature profiles for the other models are included in Appendix B (Figs. 31-40). Based upon these and other analyses, it was concluded that the one-dimensional sizing modelswere of sufficient quality for these preliminary concept comparisons.
PM2000 Facesheets
jaHoneycomb
c d--,PM2000 Sidewall • L--
IMI Insulation
Titanium
RTV/Nomex Felt
/ Lower Titanium Sheet
II i i --i_ Structure
e Gap Radiation f
Figure 4. Two-dimensional finite element model of the AMHC concept.
12
10
T a=1873 °F
0 500 1000 1500 2000 2500
Time, s
Figure 5. Heat flux profile used to verify the 1-D AMHC thermal model.
tLo
2000 Fi
f /
, _ F- L J
1500
1000
50O
00
- 1-D TPS Surface
--o-- 2-D TPS Surface (edge)-Pt. a---¢_ 2-D TPS Surface (interior)-Pt. b- o I-D TPS Center
2-D TPS Center (edge)-Pt. c2-D TPS Center (interior)-Pt. d
-- (3- - 1-D TPS Structure
] _ 2-D TPS Structure (edge)-Pt. ei
-_c,-- 2-D TPS Structure (interior)-Pt. f
1_ 2_ 3_ 4000 5_ 6000
Time, s
Figure 6. Transient thermal analysis results for the I-D and 2-D AMHC thermal models.
THERMAL PROTECTION SYSTEM CONCEPTS
The one-dimensional TPS sizing code contains thermal and weight models for each TPSanalyzed. A description of each TPS concept and the assumptions and properties used in the analysisare given in this section.
Flexible Ceramic Blankets
Blanket TPS consist of fibrous insulation between outer layers of woven ceramic fabric. The outerfabric layer is coated to stiffen and toughen it, and the blankets are attached to the structure with alayer of room temperature vulcanizing (RTV) adhesive. Blankets have relatively low initial costs, andtheir flexibility eases installation. The Advanced Flexible Reusable Surface Insulation (AFRSI)blankets used on the Space Shuttle orbiter must be waterproofed after each flight adding considerablemaintenance time and expense. Blankets are initially flexible, but the addition of the C-9 coating 15and exposure to high temperatures make the outer fabric brittle and susceptible to damage. The quiltedfabric construction of AFRSI results in a rough exterior surface which promotes turbulence and thusincreases aerodynamic heating and drag. The TABI TPS has a smoother surface and an increasedtemperature capability compared to AFRSI I°, but TABI also has waterproofing and surface brittlenessissues similar to AFRSI. Testing is in progress to evaluate the durability of TABI for use on thewindward side of a vehicle, and the concept's scalability to large thicknesses (3-4 inches) needs to bedemonstrated. The relatively low emissivities at high temperatures of the blanket fabrics with the C-9coating limit the heating levels where blanket TPS may be used, but higher emissivity coatings areunder development 1°.
Advanced Flexible Reusable Surface Insulation
Advanced Flexible Reusable Surface Insulation was developed as a partial replacement for Felt
Reusable Surface Insulation (FRSI) and Low Temperature Reusable Surface Insulation (LRSI) on the
Space Shuttle orbiter. It is easier to maintain and install, and it possesses a maximum operational
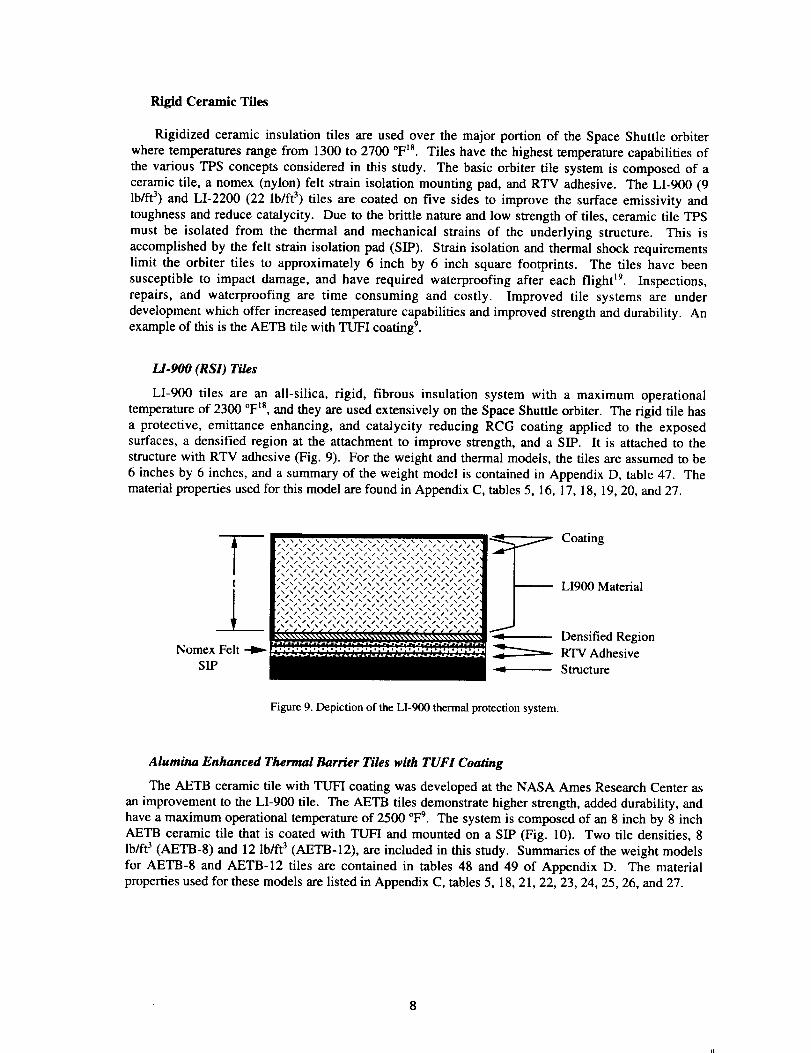
temperature of 1200 °F16. The AFRSI concept modeled in this paper is composed of an outer fabricwith C-9 coating, 6 lb/ft 3 Q-fiber felt insulation, and an inner fabric layer, and it is attached to the
structure with RTV adhesive (Fig. 7). The weight and analysis models are based upon a 30 inch by 30
inch sample, and a summary of the weight model is contained in Appendix D, table 45. The material
properties used for this model are found in Appendix C, tables 5, 7, 12, 13, 14, 15, and 27.
7t
C9 Coating
_ Outer Fabric (AB312)
Q-fiber Felt Insulation
Inner Fabric (AB312)RTV Adhesive
Structure
Figure 7. Depiction of the AFRSI thermal protection system.
Tailorable Advanced Blanket Insulation
Tailorable Advanced Blanket Insulation was developed by the NASA Ames Research Center as
an improvement to the AFRSI currently certified on the Space Shuttle orbiter. Integrally wovencorrugations provide higher strength and a higher operational temperature (2200 °F)17 than AFRSI,
and TABI is being proposed for use on the windward side of reentry vehicles 17. The TABI considered
here is composed of an outer ceramic fabric with C-9 coating, 6 lb/ft 3 Q-fiber felt insulation, ceramic
fabric corrugations, and a fabric inner layer. It is attached to the structure with RTV adhesive (Fig. 8).
The weight and analysis models examine a 30 inch by 30 inch sample, and a summary of the weight
model is in Appendix D, table 46. The material properties for this model are found in Appendix C,
tables 5, 7, 8, 9, 10, 11, 14, and 27.
Corrugations C9 Coating
Outer Fabric (AB312)
Q-fiber Felt Insulation
Inner Fabric (AB312)
RTV Adhesive
Structure
Figure 8. Depiction of the TABI thermal protection system.
RigidCeramicTiles
Rigidized ceramic insulation tiles are used over the major portion of the Space Shuttle orbiter
where temperatures range from 1300 to 2700 °F ts. Tiles have the highest temperature capabilities of
the various TPS concepts considered in this study. The basic orbiter tile system is composed of a
ceramic tile, a nomex (nylon) felt strain isolation mounting pad, and RTV adhesive. The LI-900 (9
lb/ft 3) and LI-2200 (22 lb/ft 3) tiles are coated on five sides to improve the surface emissivity and
toughness and reduce catalycity. Due to the brittle nature and low strength of tiles, ceramic tile TPS
must be isolated from the thermal and mechanical strains of the underlying structure. This is
accomplished by the felt strain isolation pad (SIP). Strain isolation and thermal shock requirementslimit the orbiter tiles to approximately 6 inch by 6 inch square footprints. The tiles have been
susceptible to impact damage, and have required waterproofing after each flight tg. Inspections,
repairs, and waterproofing are time consuming and costly. Improved tile systems are under
development which offer increased temperature capabilities and improved strength and durability. Anexample of this is the AETB tile with TUFI coating 9.
LI-900 (RSI) Tiles
LI-900 tiles are an all-silica, rigid, fibrous insulation system with a maximum operationaltemperature of 2300 °F_8, and they are used extensively on the Space Shuttle orbiter. The rigid tile has
a protective, emittance enhancing, and catalycity reducing RCG coating applied to the exposedsurfaces, a densified region at the attachment to improve strength, and a SIP. It is attached to the
structure with RTV adhesive (Fig. 9). For the weight and thermal models, the tiles are assumed to be
6 inches by 6 inches, and a summary of the weight model is contained in Appendix D, table 47. The
material properties used for this model are found in Appendix C, tables 5, 16, 17, 18, 19, 20, and 27.
m
Nomex Felt
SIP
liiiiiiiiiiiiiiiiiiii!iiiiiiiiiiiiiiiiiiiiiiii!il :oatnLI900 Material
Densified RegionRTV Adhesive
Structure
Figure 9. Depiction of the LI-900 thermal protection system.
Alumina Enhanced Thermal Barrier Tiles with TUFI Coating
The AETB ceramic tile with TUFI coating was developed at the NASA Ames Research Center as
an improvement to the LI-900 tile. The AETB tiles demonstrate higher strength, added durability, andhave a maximum operational temperature of 2500 °1='9. The system is composed of an 8 inch by 8 inch
AETB ceramic tile that is coated with TUFI and mounted on a SIP (Fig. 10). Two tile densities, 8
lb/ft 3 (AETB-8) and 12 lb/ft 3 (AETB-12), are included in this study. Summaries of the weight models
for AETB-8 and AETB-12 tiles are contained in tables 48 and 49 of Appendix D. The material
properties used for these models are listed in Appendix C, tables 5, 18, 21, 22, 23, 24, 25, 26, and 27.
8
tt
Nomex Felt
SIP
TUFI Coating
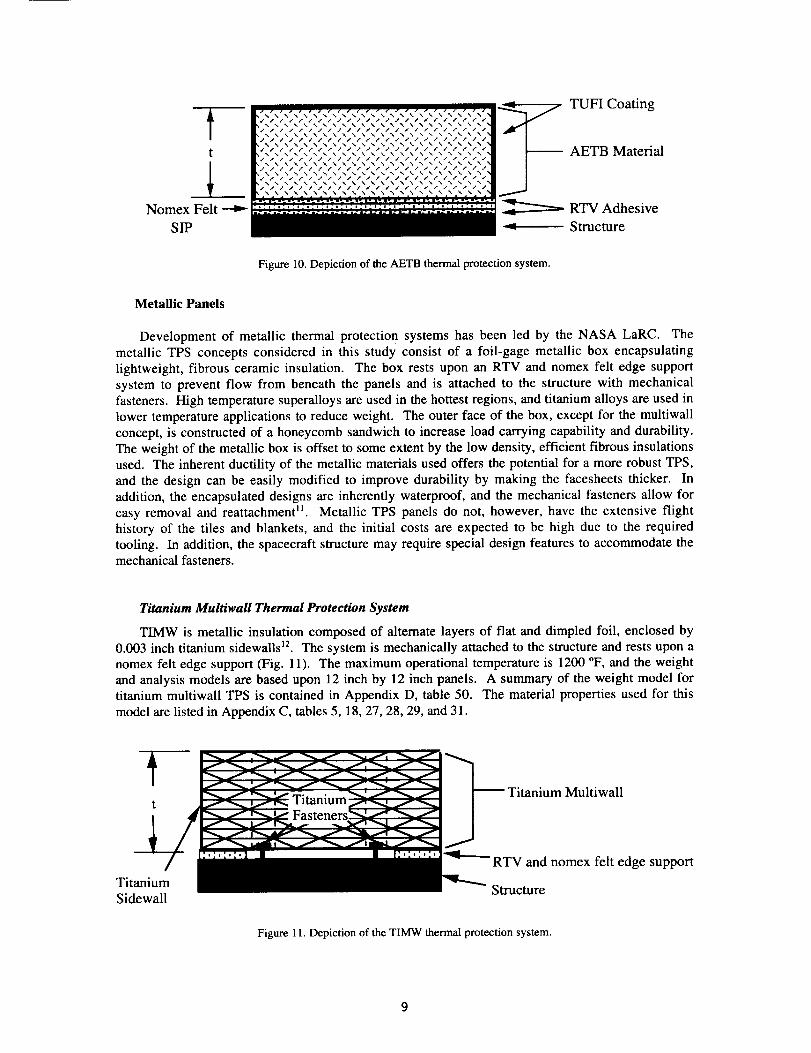
AETB Material
Structure
Figure 10. Depiction of the AETB thermal protection system.
Metallic Panels
Development of metallic thermal protectio n systems has been led by the NASA LaRC. The
metallic TPS concepts considered in this study consist of a foil-gage metallic box encapsulating
lightweight, fibrous ceramic insulation. The box rests upon an RTV and nomex felt edge support
system to prevent flow from beneath the panels and is attached to the structure with mechanical
fasteners. High temperature superalloys are used in the hottest regions, and titanium alloys are used in
lower temperature applications to reduce weight. The outer face of the box, except for the multiwall
concept, is constructed of a honeycomb sandwich to increase load carrying capability and durability.
The weight of the metallic box is offset to some extent by the low density, efficient fibrous insulations
used. The inherent ductility of the metallic materials used offers the potential for a more robust TPS,
and the design can be easily modified to improve durability by making the facesheets thicker. In
addition, the encapsulated designs are inherently waterproof, and the mechanical fasteners allow for
easy removal and reattachment _. Metallic TPS panels do not, however, have the extensive flight
history of the tiles and blankets, and the initial costs are expected to be high due to the required
tooling. In addition, the spacecraft structure may require special design features to accommodate themechanical fasteners.
Titanium Multiwafl Thermal Protection System
TIMW is metallic insulation composed of alternate layers of flat and dimpled foil, enclosed by
0.003 inch titanium sidewalls _. The system is mechanically attached to the structure and rests upon a
nomex felt edge support (Fig. 11). The maximum operational temperature is 1200 °F, and the weight
and analysis models are based upon 12 inch by 12 inch panels. A summary of the weight model fortitanium multiwall TPS is contained in Appendix D, table 50. The material properties used for this
model are listed in Appendix C, tables 5, 18, 27, 28, 29, and 31.
-- Titanium Multiwall
RTV and nomex felt edge support
Titanium StructureSidewall
Figure 11. Depiction of the TIMW thermal protection system.
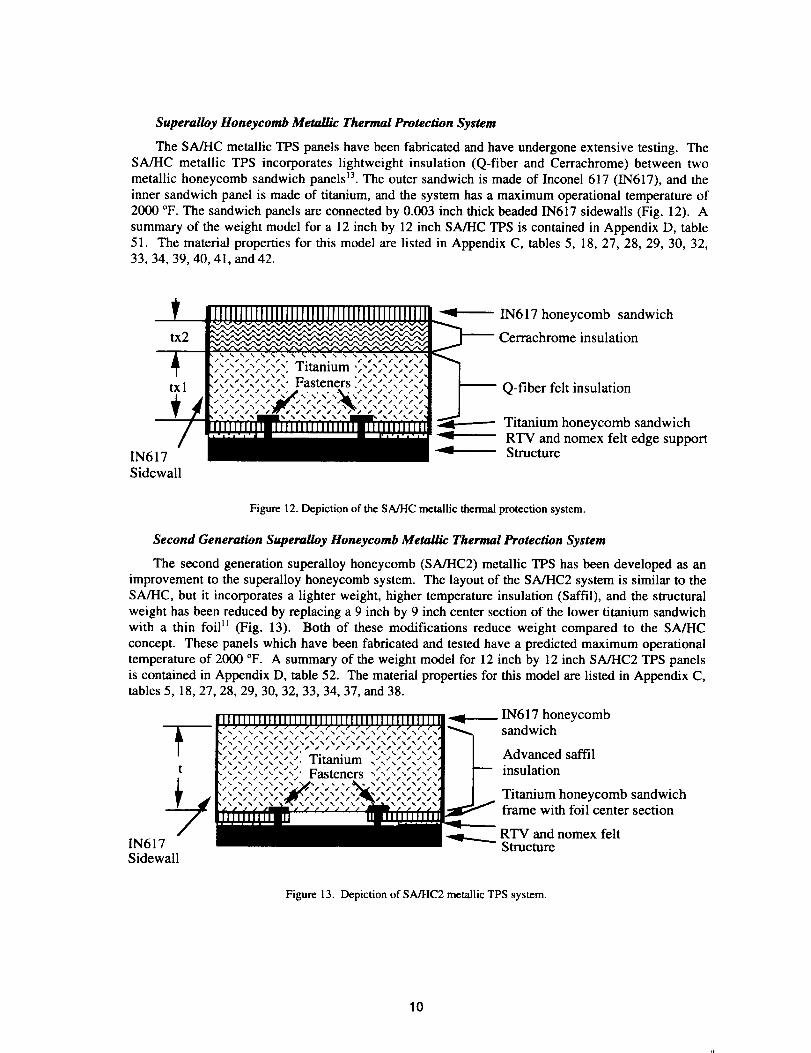
Superalloy Honeycomb Metallic Thermal Protection System
The SA/HC metallic TPS panels have been fabricated and have undergone extensive testing. TheSA/HC metallic TPS incorporates lightweight insulation (Q-fiber and Cerrachrome) between two
metallic honeycomb sandwich panels _3. The outer sandwich is made of Inconel 617 (IN617), and the
inner sandwich panel is made of titanium, and the system has a maximum operational temperature of
2000 °F. The sandwich panels are connected by 0.003 inch thick beaded IN617 sidewalls (Fig. 12). A
summary of the weight model for a 12 inch by 12 inch SA/HC TPS is contained in Appendix D, table
51. The material properties for this model are listed in Appendix C, tables 5, 18, 27, 28, 29, 30, 32,33, 34, 39, 40, 41, and 42.
IHHHHIIIIIIIIIIIIIIIIIIIIIIIIIIIIIIIIIII _ IN617 honeycomb sandwich
tx2 _f___f..__f__vffffff _ _ff _...]__.._ Cerrachrome insulation
txl- ['"'"'"'"'"'_'"' Fasteners :',","_','_,",'_1 _ N fil-_r _c,_b i .... lmt;nr,
Titanium honeycomb sandwich-_ RTV and nomex felt edge support
IN617 -.4_ Structure
Sidewall
Figure 12. Depiction of the SA/HC metallic thermal protection system.
Second Generation Superalloy Honeycomb Metallic Thermal Protection System
The second generation superalloy honeycomb (SA/HC2) metallic TPS has been developed as an
improvement to the superalloy honeycomb system. The layout of the SA/I-IC2 system is similar to the
SA/HC, but it incorporates a lighter weight, higher temperature insulation (Saffil), and the structural
weight has been reduced by replacing a 9 inch by 9 inch center section of the lower titanium sandwich
with a thin foil 11 (Fig. 13). Both of these modifications reduce weight compared to the SAJHC
concept. These panels which have been fabricated and tested have a predicted maximum operational
temperature of 2000 °F. A summary of the weight model for 12 inch by 12 inch SA/HC2 TPS panels
is contained in Appendix D, table 52. The material properties for this model are listed in Appendix C,tables 5, 18, 27, 28, 29, 30, 32, 33, 34, 37, and 38.
1N617Sidewall
IN617 honeycombsandwich
Advanced saffil
insulation
Titanium honeycomb sandwichframe with foil center section
RTV and nomex feltStructure
Figure 13. Depiction of SA/HC2 metallic TPS system.
10
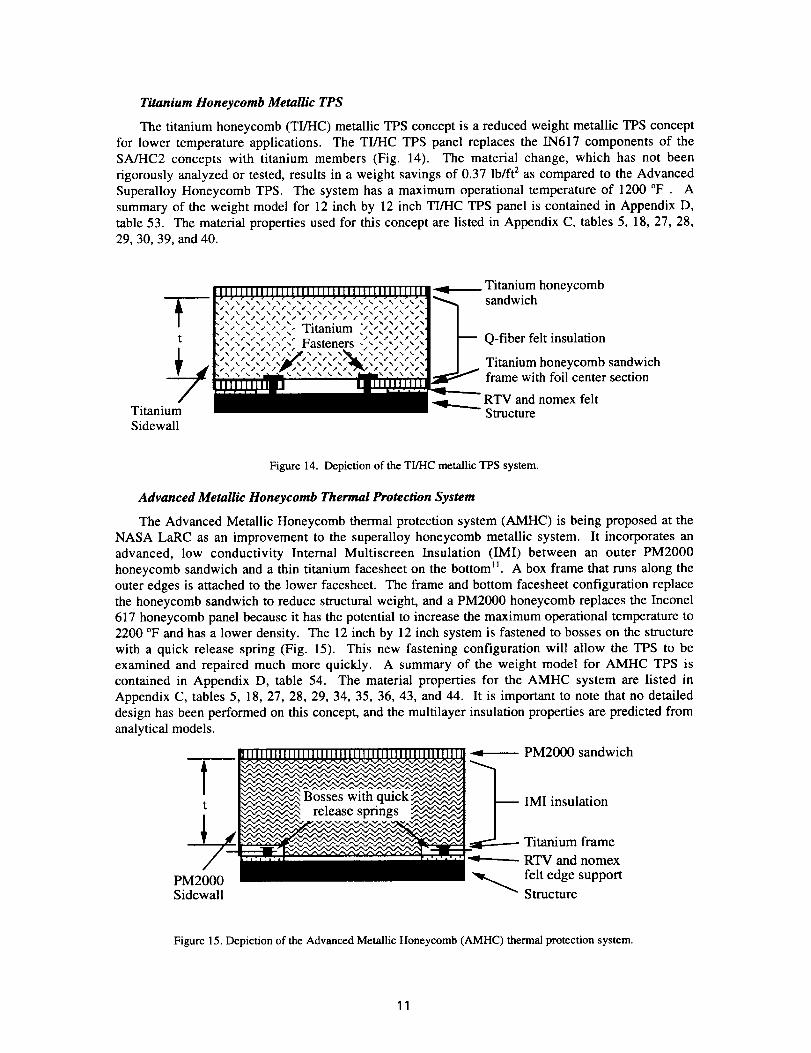
Titanium Honeycomb Metallic TPS
The titanium honeycomb (TI/HC) metallic TPS concept is a reduced weight metallic TPS concept
for lower temperature applications. The TI/HC TPS panel replaces the IN617 components of the
SA/HC2 concepts with titanium members (Fig. 14). The material change, which has not been
rigorously analyzed or tested, results in a weight savings of 0.37 lb/ft 2 as compared to the Advanced
Superalloy Honeycomb TPS. The system has a maximum operational temperature of 1200 °F. A
summary of the weight model for 12 inch by 12 inch TI/HC TPS panel is contained in Appendix D,
table 53. The material properties used for this concept are listed in Appendix C, tables 5, 18, 27, 28,
29, 30, 39, and 40.
Titanium honeycombsandwich
t
Titanium
Sidewall
Q-fiber felt insulation
Titanium honeycomb sandwichframe with foil center section
RTV and nomex feltStructure
Figure 14. Depiction of the TI/HC metallic TPS system.
Advanced Metallic Honeycomb Thermal Protection System
The Advanced Metallic Honeycomb thermal protection system (AMHC) is being proposed at the
NASA LaRC as an improvement to the superalloy honeycomb metallic system. It incorporates an
advanced, low conductivity Internal Multiscreen Insulation (IMI) between an outer PM2000
honeycomb sandwich and a thin titanium facesheet on the bottom 11. A box frame that runs along the
outer edges is attached to the lower facesheet. The frame and bottom facesheet configuration replace
the honeycomb sandwich to reduce structural weight, and a PM2000 honeycomb replaces the Inconel
617 honeycomb panel because it has the potential to increase the maximum operational temperature to
2200 °F and has a lower density. The 12 inch by 12 inch system is fastened to bosses on the structure
with a quick release spring (Fig. 15). This new fastening configuration will allow the TPS to be
examined and repaired much more quickly. A summary of the weight model for AMHC TPS is
contained in Appendix D, table 54. The material properties for the AMHC system are listed in
Appendix C, tables 5, 18, 27, 28, 29, 34, 35, 36, 43, and 44. It is important to note that no detailed
design has been performed on this concept, and the multilayer insulation properties are predicted from
analytical models.
PM2000 sandwich
t IMI insulation
Titanium frame
- RTV and nomex
PM2000 _ felt edge supportSidewall Structure
Figure 15. Depiction of the Advanced Metallic Honeycomb (AMHC) thermal protection system.
11
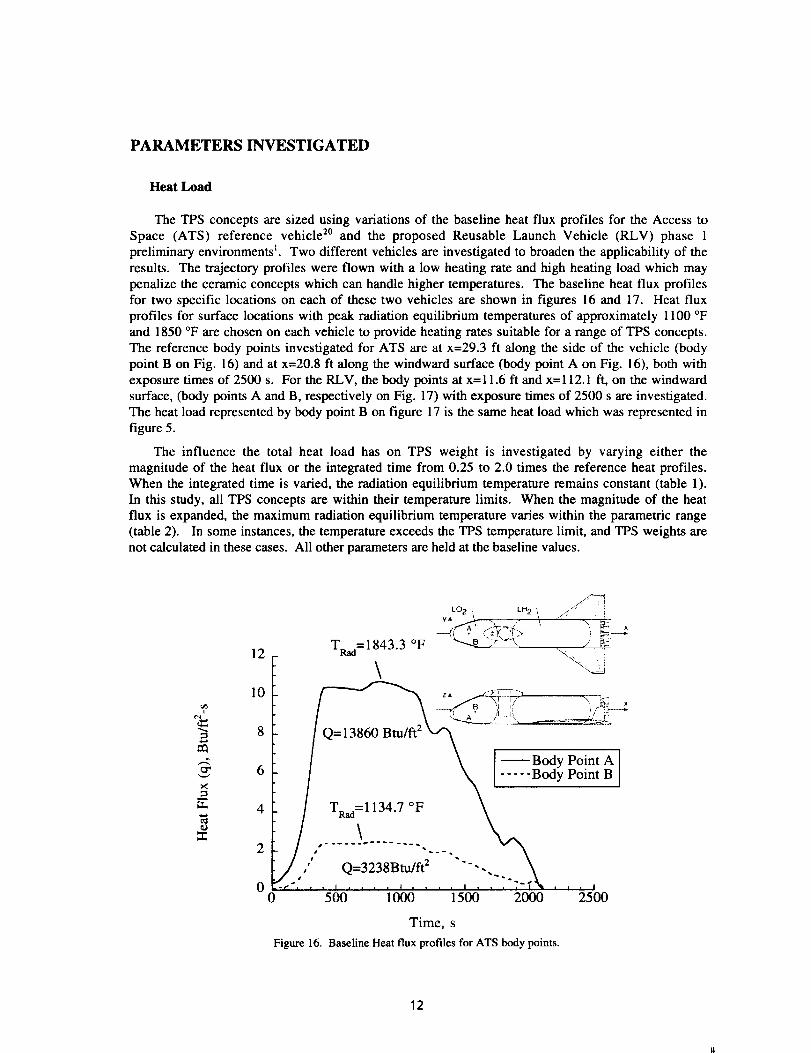
PARAMETERS INVESTIGATED
Heat Load
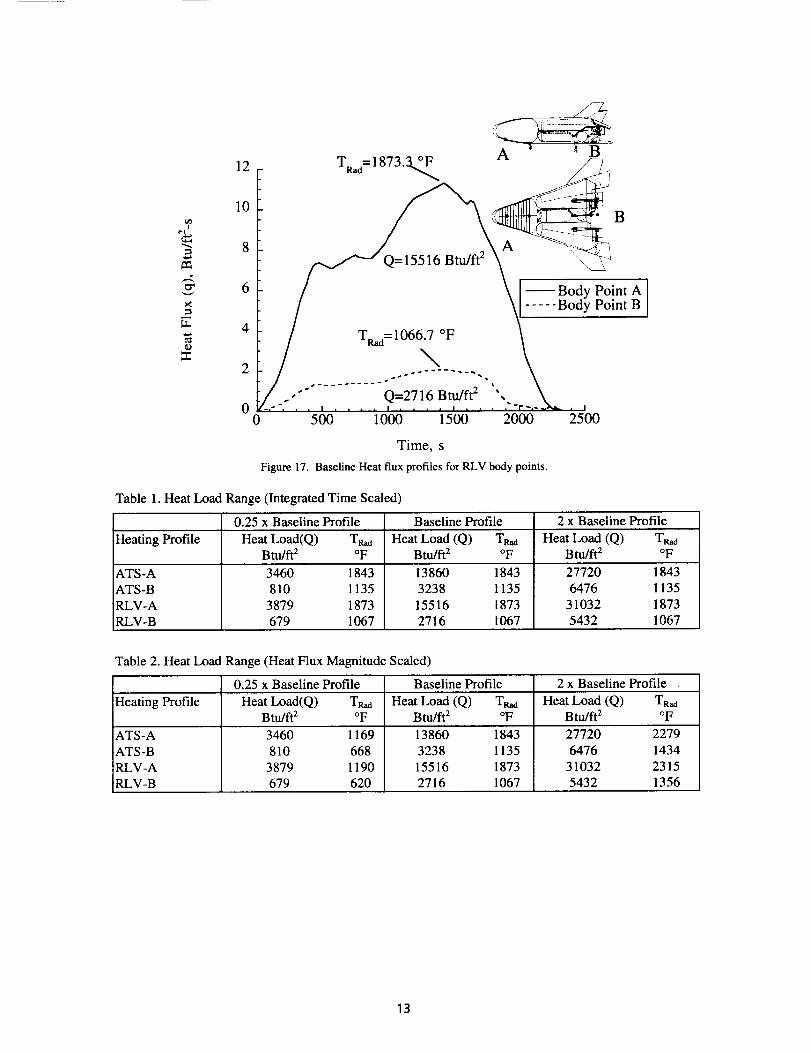
The TPS concepts are sized using variations of the baseline heat flux profiles for the Access toSpace (ATS) reference vehicle 2° and the proposed Reusable Launch Vehicle (RLV) phase 1preliminary environments t. Two different vehicles are investigated to broaden the applicability of theresults. The trajectory profiles were flown with a low heating rate and high heating load which maypenalize the ceramic concepts which can handle higher temperatures. The baseline heat flux profilesfor two specific locations on each of these two vehicles are shown in figures 16 and 17. Heat fluxprofiles for surface locations with peak radiation equilibrium temperatures of approximately 1100 °Fand 1850 °F are chosen on each vehicle to provide heating rates suitable for a range of TPS concepts.The reference body points investigated for ATS are at x=29.3 ft along the side of the vehicle (bodypoint B on Fig. 16) and at x=20.8 ft along the windward surface (body point A on Fig. 16), both withexposure times of 2500 s. For the RLV, the body points at x=l 1.6 ft and x=112.1 ft, on the windwardsurface, (body points A and B, respectively on Fig. 17) with exposure times of 2500 s are investigated.
The heat load represented by body point B on figure 17 is the same heat load which was represented infigure 5.
The influence the total heat load has on TPS weight is investigated by varying either themagnitude of the heat flux or the integrated time from 0.25 to 2.0 times the reference heat profiles.When the integrated time is varied, the radiation equilibrium temperature remains constant (table 1).In this study, all TPS concepts are within their temperature limits. When the magnitude of the heatflux is expanded, the maximum radiation equilibrium temperature varies within the parametric range(table 2). In some instances, the temperature exceeds the TPS temperature limit, and TPS weights arenot calculated in these cases. All other parameters are held at the baseline values.
o"
12
10
6
4
2
0
L02"_ LH2-\ /'_" :i
Ta_d=1843.3 °F _-....g_:;_"_% . .} _
/ \ ), .i:i
/ Q= 13860 Btu/ft2 _., _'_-_--__ .... --_i.
] \ [_Body Point A
_/ T2_.=. __iiiiii.2. _ody Point B,' __
0 500 1000 1500 2000 2500
Time, s
Figure 16. Baseline Heat flux profiles for ATS body points.
12
I
t_
ZZ
12
10
6
4
2
0
T =1873.3 °F A B
• "i B
[- / \ [--Body Poln _ A
0 500 1000 1500 2000 2500
Time, s
Figure 17. Baseline Heat flux profiles for RLV body points.
Table 1. Heat Load Range (Integrated Time Scaled)
0.25 x Baseline Profile Baseline Profile 2 x Baseline Profile
Heating Profile Heat Load(Q) TR_ Heat Load (Q) TRod Heat Load (Q) T_dBtu/ft 2 °F Btu/ft 2 °F Btu/ft 2 °F
ATS-A 3460 1843 13860 1843 27720 1843
ATS-B 810 1135 3238 1135 6476 1135
RLV-A 3879 1873 15516 1873 31032 1873
RLV-B 679 1067 2716 1067 5432 1067
Table 2. Heat Load Range (Heat Flux Magnitude Scaled)
0.25 x Baseline Profile Baseline Profile 2 x Baseline Profile
Heating Profile Heat Load(Q) Tp,_d Heat Load (Q) TR_ Heat Load (Q) TRa d
Btu/ft 2 °F Btu/ft 2 °F Btu/ft 2 °F
ATS-A 3460 1169 13860 1843 27720 2279
ATS-B 810 668 3238 1135 6476 1434
RLV-A 3879 1190 15516 1873 31032 2315
RLV-B 679 620 2716 1067 5432 1356
13
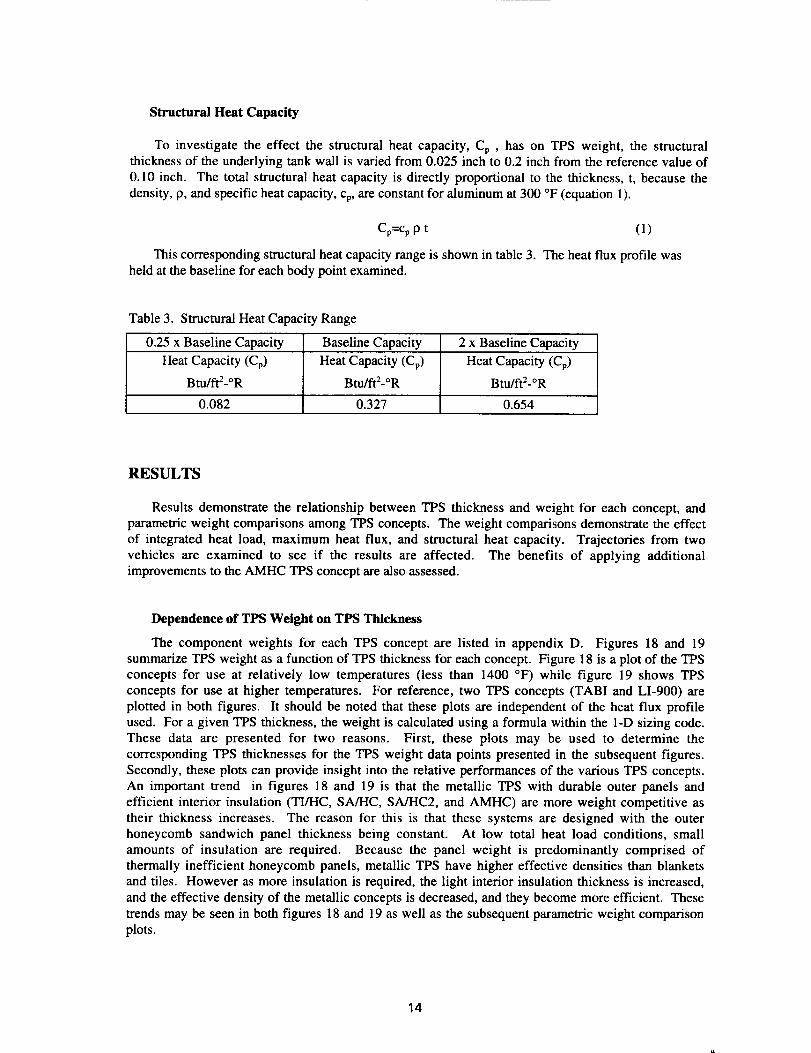
StructuralHeatCapacity
To investigate the effect the structural heat capacity, Cp , has on TPS weight, the structuralthickness of the underlying tank wall is varied from 0.025 inch to 0.2 inch from the reference value of
0.10 inch. The total structural heat capacity is directly proportional to the thickness, t, because the
density, p, and specific heat capacity, Cp, are constant for aluminum at 300 °F (equation 1).
Cp=cp p t (1)
This corresponding structural heat capacity range is shown in table 3. The heat flux profile washeld at the baseline for each body point examined.
Table 3. Structural Heat Capacity Range
0.25 x Baseline Capacity Baseline Capacity 2 x Baseline Capacity
Heat Capacity (Cp) Heat Capacity (Cp) Heat Capacity (Cp)
Btu/ft2-°R Btu/ft2-°R Btu/ft2_°R
0.082 0.327 0.654
RESULTS
Results demonstrate the relationship between TPS thickness and weight for each concept, and
parametric weight comparisons among TPS concepts. The weight comparisons demonstrate the effect
of integrated heat load, maximum heat flux, and structural heat capacity. Trajectories from two
vehicles are examined to see if the results are affected. The benefits of applying additionalimprovements to the AMHC TPS concept are also assessed.
Dependence of TPS Weight on TPS Thickness
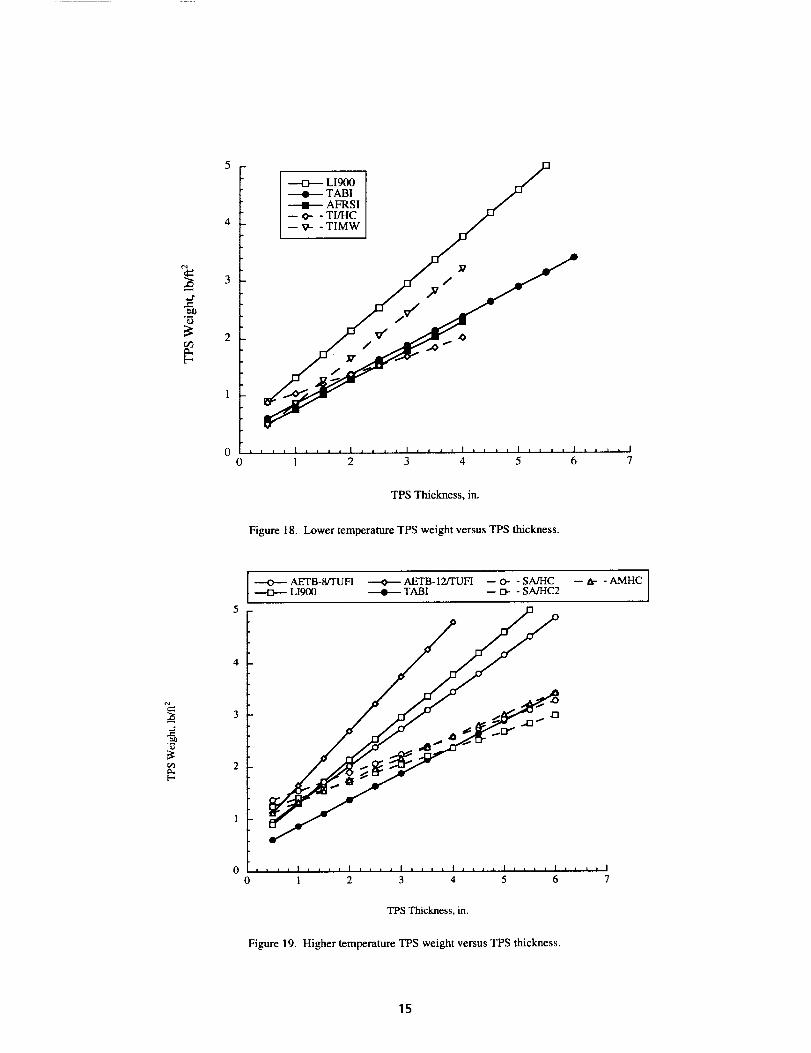
The component weights for each TPS concept are listed in appendix D. Figures 18 and 19
summarize TPS weight as a function of TPS thickness for each concept. Figure 18 is a plot of the TPS
concepts for use at relatively low temperatures (less than 1400 °F) while figure 19 shows TPS
concepts for use at higher temperatures. For reference, two TPS concepts (TABI and LI-900) are
plotted in both figures. It should be noted that these plots are independent of the heat flux profile
used. For a given TPS thickness, the weight is calculated using a formula within the 1-D sizing code.
These data are presented for two reasons. First, these plots may be used to determine the
corresponding TPS thicknesses for the TPS weight data points presented in the subsequent figures.
Secondly, these plots can provide insight into the relative performances of the various TPS concepts.
An important trend in figures 18 and 19 is that the metallic TPS with durable outer panels and
efficient interior insulation (TI/HC, SA/HC, SA/HC2, and AMHC) are more weight competitive as
their thickness increases. The reason for this is that these systems are designed with the outer
honeycomb sandwich panel thickness being constant. At low total heat load conditions, small
amounts of insulation are required. Because the panel weight is predominantly comprised of
thermally inefficient honeycomb panels, metallic TPS have higher effective densities than blankets
and tiles. However as more insulation is required, the light interior insulation thickness is increased,
and the effective density of the metallic concepts is decreased, and they become more efficient. These
trends may be seen in both figures 18 and 19 as well as the subsequent parametric weight comparison
plots.
14
,.c
oo 1 2 3 4 5 6 7
TPS Thickness, in.
Figure 18. Lower temperature TPS weight versus TPS thickness.
---<>--- AETB-8/TUFl ----0---- AETB-12/TUFI -- O- - SA/HC
+ LIgO0 --4---- TABI -- IZV - SA/HC2
_.03
1
0
e-
tt_
[..
tjlllllltiijtll,,,_lJ_,_l,,tal,,_l
0 1 2 3 4 5 6 7
TPS Thickness, in.
Figure 19. Higher temperature TPS weight versus TPS thickness.
15
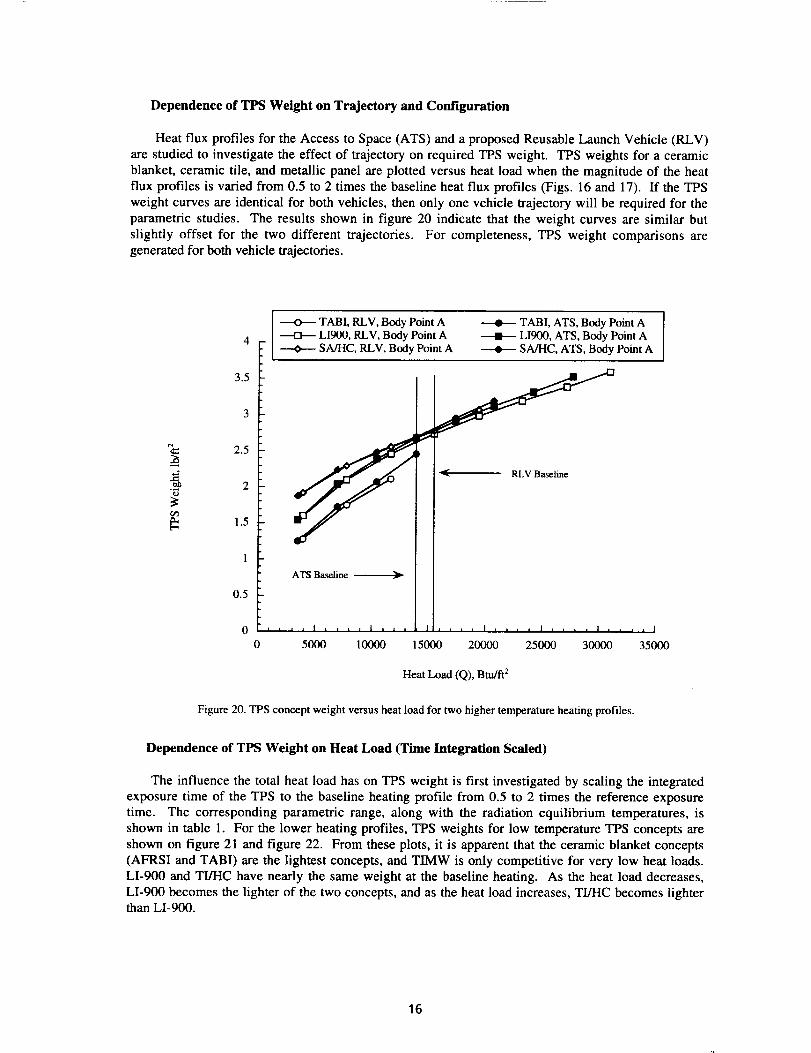
Dependenceof TPSWeightonTrajectoryandConfiguration
Heat flux profiles for the Access to Space (ATS) and a proposed Reusable Launch Vehicle (RLV)
are studied to investigate the effect of trajectory on required TPS weight. TPS weights for a ceramic
blanket, ceramic tile, and metallic panel are plotted versus heat load when the magnitude of the heat
flux profiles is varied from 0.5 to 2 times the baseline heat flux profiles (Figs. 16 and 17). If the TPS
weight curves are identical for both vehicles, then only one vehicle trajectory will be required for the
parametric studies. The results shown in figure 20 indicate that the weight curves are similar but
slightly offset for the two different trajectories. For completeness, TPS weight comparisons aregenerated for both vehicle trajectories.
e_
2.5
¢-2
1.5
I ---O-- TAB1, RLV, Body Point ALI900, RLV, Body Point A
---O--- SA/HC, RLV, Body Point A
I
TABI, ATS, Body Point A [LI900, ATS, Body Point A ISA/HC, ATS, Body Point A
3.5
0.5
ATS Baseline
0 J , , , I ..... I I
0 5000 3500010000 15000 20000 25000 30000
Heat Load (Q), Btu/fi 2
Figure 20. TPS concept weight versus heat load for two higher temperature heating prof'des.
Dependence of TPS Weight on Heat Load (Time Integration Scaled)
The influence the total heat load has on TPS weight is first investigated by scaling the integratedexposure time of the TPS to the baseline heating profile from 0.5 to 2 times the reference exposure
time. The corresponding parametric range, along with the radiation equilibrium temperatures, is
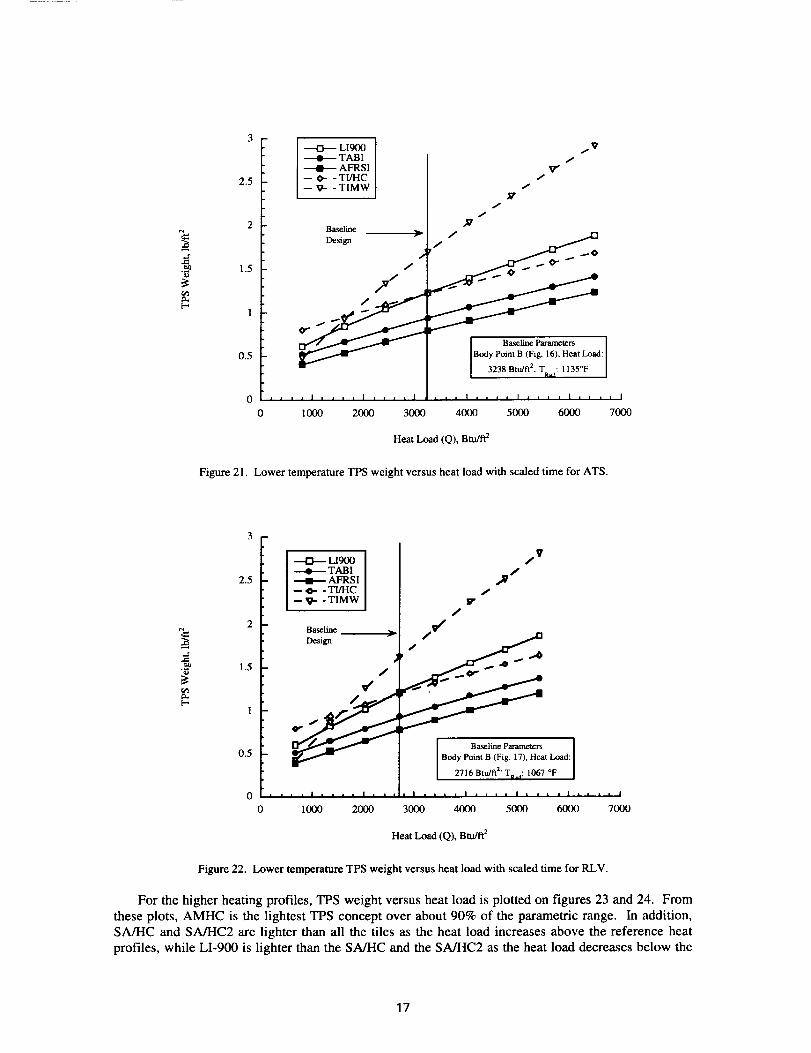
shown in table 1. For the lower heating profiles, TPS weights for low temperature TPS concepts are
shown on figure 21 and figure 22. From these plots, it is apparent that the ceramic blanket concepts
(AFRSI and TABI) are the lightest concepts, and TIMW is only competitive for very low heat loads.
LI-900 and TI/HC have nearly the same weight at the baseline heating. As the heat load decreases,
LI-900 becomes the lighter of the two concepts, and as the heat load increases, TI/HC becomes lighterthan LI-900.
16
._r
o_
i-
2.5
1.5
0.5
0 I I I
0
+ LI900+ TABI+ AFRSI-- _- - TI/HC-- v- - TIMW
J
f
f
v"f
/ Vf
Baseline _ . f
_'_/ Body Point B (Fig. 16). Heat Load:[
ir 3238 BtLfft2, Taaa: 1135°F I
1000 2000 3000 4000 5000 6000 7000
Heat Load (Q), Btu/ft 2
Figure 21. Lower temperature TPS weight versus heat load with scaled time for ATS.
q=
r_
3 F @ LIg00
TABI2.5 + AFRSI
-- O- - TI/HC-- V" - TIMW
2 Baseline
Design r
1.5 / J
4,
0.5
0 Illl|lll°l'l'
0 1000 2000
/V
,,n /
lIT j
Baseline Parameters I
Body Point B (Fig. 17), Heat Load: I
2716 Btu/ft 2' Tl,a: 1067 °F ]
3000 4000 5000 6000 7000
Heat Load (Q), Btu/ft 2
Figure 22. Lower temperature TPS weight versus heat load with scaled time for RLV.
For the higher heating profiles, TPS weight versus heat load is plotted on figures 23 and 24. Fromthese plots, AMHC is the lightest TPS concept over about 90% of the parametric range. In addition,SA/HC and SA/HC2 are lighter than all the tiles as the heat load increases above the reference heatprofiles, while LI-900 is lighter than the SA/HC and the SA/HC2 as the heat load decreases below the
17
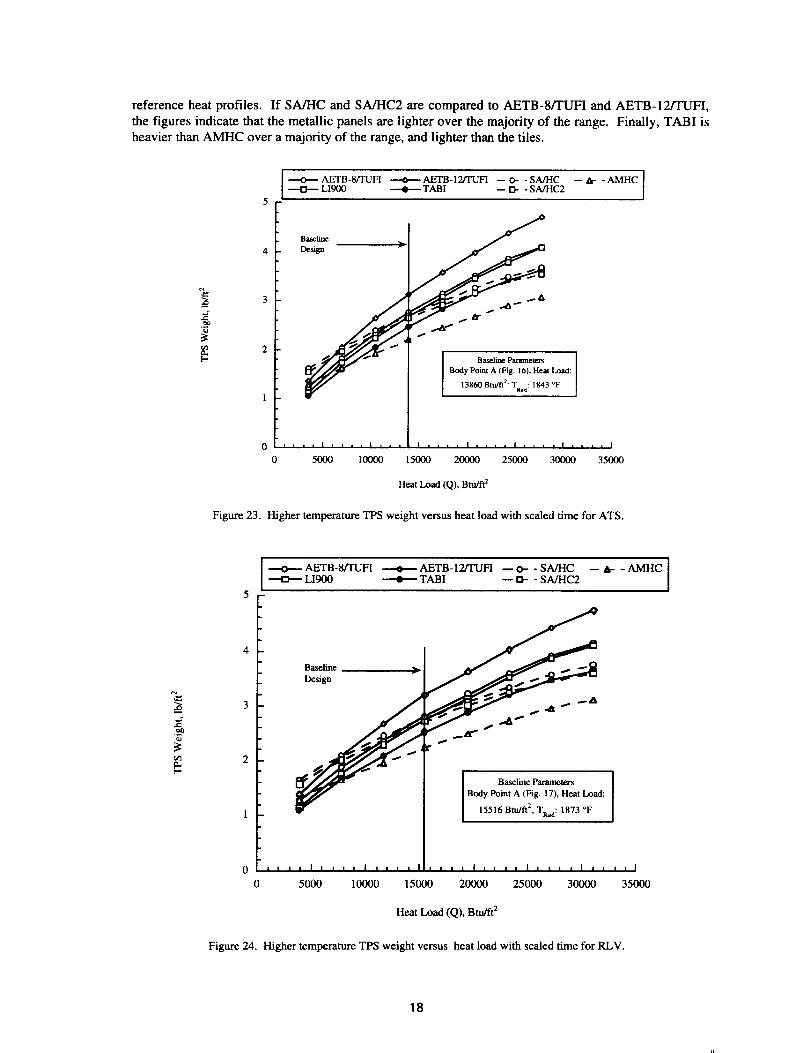
referenceheatprofiles.If SA/HCandSA/HC2arecomparedto AETB-8fFUFI and AETB-12/TUFI,
the figures indicate that the metallic panels are lighter over the majority of the range. Finally, TABI isheavier than AMHC over a majority of the range, and lighter than the tiles.
__ 3
2[..
----o-_AETI3-8/I'UFI -.--O---AETB-12/TUFI --O- -SA/HC --h- -AMHC----.O-.- LI900 ---4t--- TABI -- 13- - SA/HC2
5OOO 10000
Design
"" Baseline Parameters [Body Point A (Fig. 16), Heat Load:
13860 Btu/fi 2' TR,d: 1843 °F
I i I i i I a i i i I i i i i I , _ L _ I
15000 20000 25000 30000 35000
Heat Load (Q), Btu/ft 2
Figure 23. Higher temperature TPS weight versus heat load with scaled time for ATS.
¢-_0
o_
I
+AETB-8/TUFI .--o---AETB-12gFUFI --o-- -SA/HC -- A-- -AMHC ILI900 _ TABI m D- - SA/HC2 I
BaselineDesign
i , s , I , , , , I , . , . I
0 5000 10000
r
Baseline Parameters
Body Point A (Fig. 17), Heat Load:
15516 BR1/ft 2, TRaa: 1873 °F
I I I I I ' ' ' ' I ' ' ' , I * , ' ' I
15000 20000 25000 30000 35000
Heat Load (Q), Btu/ft 2
Figure 24. Higher temperature TPS weight versus heat load with scaled time for RLV.
18
Dependence of TPS Weight on Heat Load (Maximum Heat Flux Scaled)
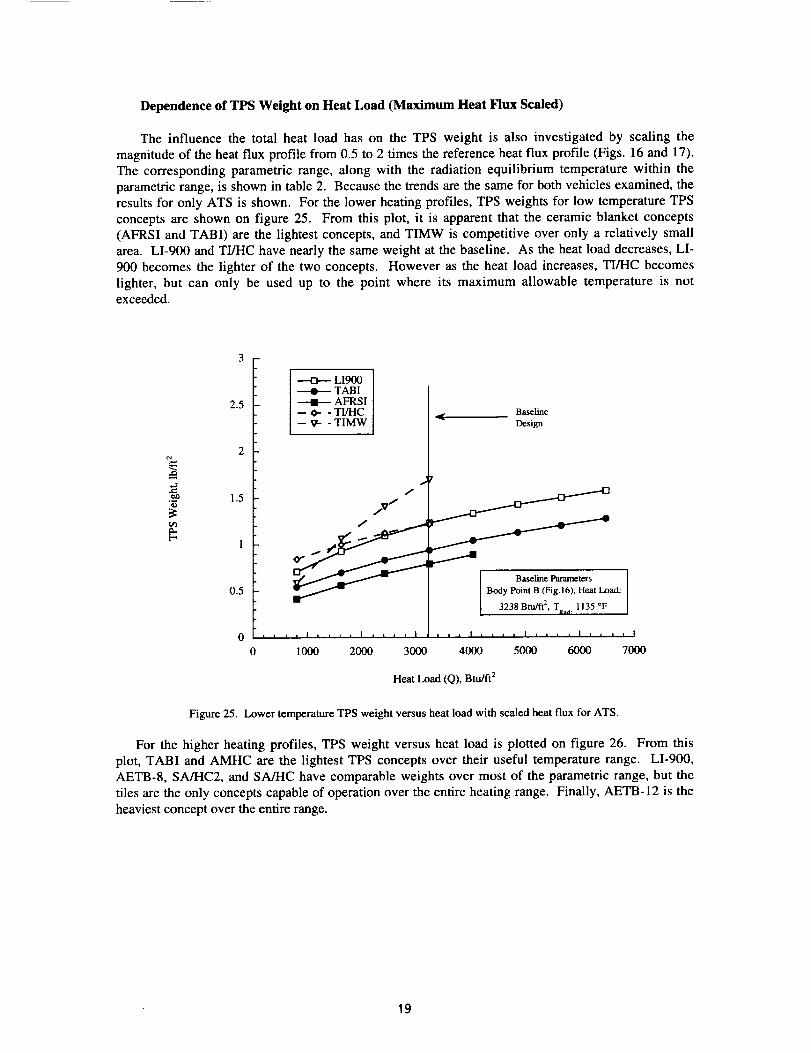
The influence the total heat load has on the TPS weight is also investigated by scaling the
magnitude of the heat flux profile from 0.5 to 2 times the reference heat flux profile (Figs. 16 and 17).
The corresponding parametric range, along with the radiation equilibrium temperature within the
parametric range, is shown in table 2. Because the trends are the same for both vehicles examined, the
results for only ATS is shown. For the lower heating profiles, TPS weights for low temperature TPS
concepts are shown on figure 25. From this plot, it is apparent that the ceramic blanket concepts
(AFRSI and TABI) are the lightest concepts, and TIMW is competitive over only a relatively small
area. LI-900 and TI/HC have nearly the same weight at the baseline. As the heat load decreases, LI-
900 becomes the lighter of the two concepts. However as the heat load increases, TI/HC becomes
lighter, but can only be used up to the point where its maximum allowable temperature is notexceeded.
.ite_
r,¢)
2.5
1.5
0.5
---D--- LI900TABI
+ AFRSI-- O- - TI/HC-- V- - TIMW
J
/
/v /
0 l I I I I I ' ' ' I , _ _ , I
0 1000 2000 3000
Basclinc
Design
, , I , , , , I , , , , I , , , , I
4000 5000 6000 7000
Heat Load (Q), Btu/ft 2
Figure 25. Lower temperature TPS weight versus heat load with scaled heat flux for ATS.
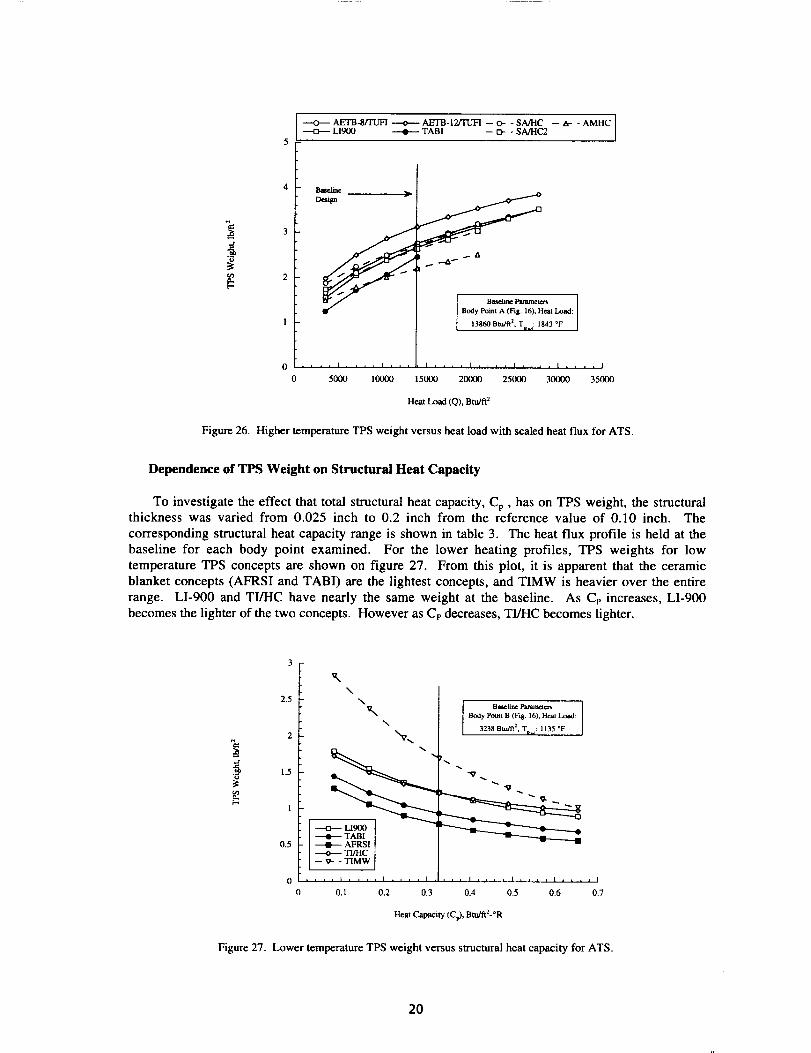
For the higher heating profiles, TPS weight versus heat load is plotted on figure 26. From this
plot, TABI and AMHC are the lightest TPS concepts over their useful temperature range. LI-900,
AETB-8, SA/HC2, and SA/HC have comparable weights over most of the parametric range, but the
tiles are the only concepts capable of operation over the entire heating range. Finally, AETB-12 is the
heaviest concept over the entire range.
19
3
IAETB-8/TUFI ----.o--- AETB-12/TUFI -- o- - SA/HC -- h- - AMHC [
----I:1--- LlgOO ---o-- TABI -- 13- - SA/HC2 I
Basedme
Design
.... I .... I , , ,
5O00
Body Point A (Fig. 16), Heat Load:
13860 Bm/t_2, Till: 1843 °F
10000 15000 20000 25000 30000 35000
Heat Load (Q), Btu/fi 2
Figure 26. Higher temperature TPS weight versus heat load with scaled heat flux for ATS.
Dependence of TPS Weight on Structural Heat Capacity
To investigate the effect that total structural heat capacity, Cp, has on TPS weight, the structuralthickness was varied from 0.025 inch to 0.2 inch from the reference value of 0.10 inch. The
corresponding structural heat capacity range is shown in table 3. The heat flux profile is held at thebaseline for each body point examined. For the lower heating profiles, TPS weights for low
temperature TPS concepts are shown on figure 27. From this plot, it is apparent that the ceramic
blanket concepts (AFRSI and TABI) are the lightest concepts, and TIMW is heavier over the entire
range. LI-900 and TI/HC have nearly the same weight at the baseline. As Cp increases, LI-900
becomes the lighter of the two concepts. However as Cp decreases, TI/HC becomes lighter.
1.5
1
0.5
3
I"\
2.5 \
v,,\
---_-- LIg00 I
_ TABIAFRSI
------o---- TI/HC-- v- - TIMW
, , , _ i .... i .... i
0,1 0.2 0.3
I Beieline _ IBody Point B (Fig. 16). Hem Load:
3238 Btu/ft 2, Tl¢_: 1135 OF
, , , I , i i i I i i i i I i t t i i
0.4 0.5 0,6 0.7
Heat Capacity (Cr), Btu/ft2-°R
Figure 27. Lower temperature TPS weight versus structural heat capacity for ATS.
20
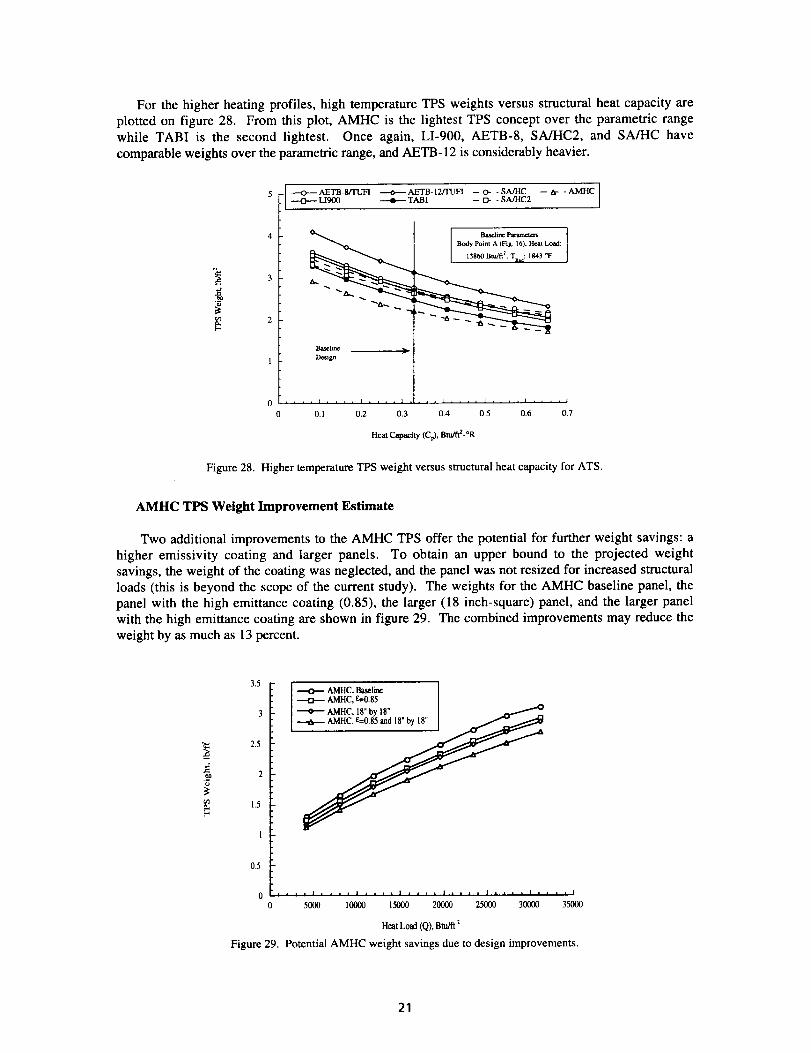
Forthehigherheatingprofiles,hightemperatureTPSweightsversusstructuralheatcapacityareplottedonfigure28. Fromthisplot,AMHCis thelightestTPSconceptovertheparametricrangewhileTABI is the secondlightest. Onceagain,LI-900,AETB-8,SA/HC2,andSA/HChavecomparableweightsovertheparametricrange,andAETB-12isconsiderablyheavier.
3
2
---O---AETB-StTUFI ---O.---AETB-12/I'UFI --o- -SA/HC --6- -AMHC+ ug00 ----o---- TAB[ -- [3- - SA/HC2
Bod,PL72;,;
D_ign
.... I .... I ........ I .... I .... I .... t
0.1 0.2 0.3 0.4 0.5 0.6 0.7
Heat Capacity (Cr), Bm/fl2-°R
Figure 28. Higher temperature TPS weight versus structural heat capacity for ATS.
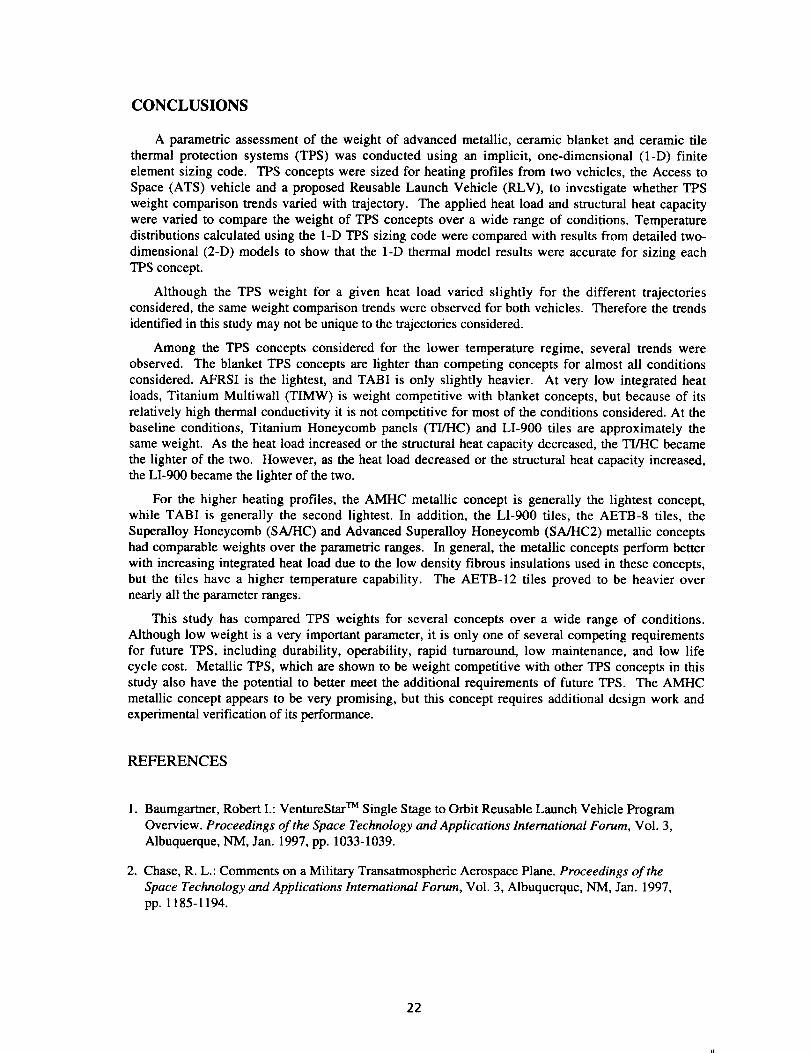
AMHC TPS Weight Improvement Estimate
Two additional improvements to the AMHC TPS offer the potential for further weight savings: a
higher emissivity coating and larger panels. To obtain an upper bound to the projected weightsavings, the weight of the coating was neglected, and the panel was not resized for increased structural
loads (this is beyond the scope of the current study). The weights for the AMHC baseline panel, the
panel with the high emittance coating (0.85), the larger (18 inch-square) panel, and the larger panel
with the high emittance coating are shown in figure 29. The combined improvements may reduce the
weight by as much as 13 percent.
3.5
3
2.5
2
1.5
1
0.5
0
I
-----o--- AMHC, Baseline [-----o--- AMHC, _=0.85
-----O-- AMHC, 18' by 18" I
, * * , I J i t t I i . , , I .... I • , , , I , . . , I , , • , I
5000 10000 15000 20000 25000 30000 35000
Heat Load (Q), Btu/ft
Figure 29. Potential AMHC weight savings due to design improvements.
21
CONCLUSIONS
A parametric assessment of the weight of advanced metallic, ceramic blanket and ceramic tile
thermal protection systems (TPS) was conducted using an implicit, one-dimensional (I-D) finite
element sizing code. TPS concepts were sized for heating profiles from two vehicles, the Access to
Space (ATS) vehicle and a proposed Reusable Launch Vehicle (RLV), to investigate whether TPS
weight comparison trends varied with trajectory. The applied heat load and structural heat capacity
were varied to compare the weight of TPS concepts over a wide range of conditions. Temperature
distributions calculated using the 1-D TPS sizing code were compared with results from detailed two-
dimensional (2-D) models to show that the 1-D thermal model results were accurate for sizing eachTPS concept.
Although the TPS weight for a given heat load varied slightly for the different trajectoriesconsidered, the same weight comparison trends were observed for both vehicles. Therefore the trends
identified in this study may not be unique to the trajectories considered.
Among the TPS concepts considered for the lower temperature regime, several trends were
observed. The blanket TPS concepts are lighter than competing concepts for almost all conditions
considered. AFRSI is the lightest, and TABI is only slightly heavier. At very low integrated heat
loads, Titanium Multiwall (TIMW) is weight competitive with blanket concepts, but because of its
relatively high thermal conductivity it is not competitive for most of the conditions considered. At the
baseline conditions, Titanium Honeycomb panels (TI/HC) and LI-900 tiles are approximately thesame weight. As the heat load increased or the structural heat capacity decreased, the TI/HC became
the lighter of the two. However, as the heat load decreased or the structural heat capacity increased,the LI-900 became the lighter of the two.
For the higher heating profiles, the AMHC metallic concept is generally the lightest concept,while TABI is generally the second lightest. In addition, the LI-900 tiles, the AETB-8 tiles, the
Superalloy Honeycomb (SA/HC) and Advanced Superalloy Honeycomb (SA/HC2) metallic concepts
had comparable weights over the parametric ranges. In general, the metallic concepts perform better
with increasing integrated heat load due to the low density fibrous insulations used in these concepts,but the tiles have a higher temperature capability. The AETB-12 tiles proved to be heavier over
nearly all the parameter ranges.
This study has compared TPS weights for several concepts over a wide range of conditions.
Although low weight is a very important parameter, it is only one of several competing requirements
for future TPS, including durability, operability, rapid turnaround, low maintenance, and low life
cycle cost. Metallic TPS, which are shown to be weight competitive with other TPS concepts in this
study also have the potential to better meet the additional requirements of future TPS. The AMHC
metallic concept appears to be very promising, but this concept requires additional design work and
experimental verification of its performance.
REFERENCES
1. Baumgartner, Robert I.: VentureStar TM Single Stage to Orbit Reusable Launch Vehicle Program
Overview. Proceedings of the Space Technology and Applications International Forum, Vol. 3,
Albuquerque, NM, Jan. 1997, pp. 1033-1039.
2. Chase, R. L.: Comments on a Military Transatmospheric Aerospace Plane. Proceedings of the
Space Technology and Applications International Forum, Vol. 3, Albuquerque, NM, Jan. 1997,
pp. 1185-1194.
22
3. Penn,JayP.;andLindley,CharlesA.:SpaceTourismOptimizedReusableSpaceplaneDesign.Proceedings of the Space Technology and Applications International Forum, Vol. 3, Albuquerque,
NM, Jan. 1997, pp. 1073-1090.
4. Cook, Layne M.; and Ball, Jim: High-Alpha Space Trucks. Proceedings of the Space Technology
and Applications International Forum, Vol. 3, Albuquerque, NM, Jan. 1997, pp. 1119-1124.
5. Andrews, Dana; Pads, Steve; and Rubeck, Mark: Suborbital Freight Delivery Concept Exploration.
Proceedings of the Space Technology and Applications International Forum, Vol. 3, Albuquerque,
NM, Jan. 1997, pp. 1025-1031.
. Hunt, James L.; Lockwood, Mary Kae; Petley, Dennis H.; and Pegg, Robert J.: Hypersonic
Airbreathing Vehicle Visions and Enhancing Technologies. Proceedings of the Space Technology
and Applications International Forum, Vol. 3, Albuquerque, NM, Jan. 1997, pp. 1285-1295.
, Morris, W. D.; White, N. H.; and Ebeling, C. E.: Analysis of Shuttle Orbiter Reliability and
Maintainability Data for Conceptual Studies. AIAA Paper 96-4245, AIAA Space Programs and
Technology Conference, Huntsville, AL, Sept. 24-26, 1996.
8. Rasky, Daniel J.: Advanced Ceramic Matrix Composites for TPS. Current Technology for Thermal
Protection Systems. NASA Conference Publication 3157, 1992, pp. 43-62.
. Hinkle, Karrie A.; Staszak, Paul R.; and Watts, E. T.: Advanced Ceramic Materials Development
and Testing. AIAA Paper 96-1527, 37th Structures, Structural Dynamics, and Materials
Conference, 1996, pp. 525-530.
10. Lu, I. Tina: TABI - The Lightweight Durable Thermal Protection System for Future Reusable
Launch Vehicles. AIAA Paper 96-1426, 37th Structures, Structural Dynamics, and Materials
Conference, 1996, pp. 957-961.
11. Blosser, M. L.: Development of Metallic Thermal Protection Systems for the Reusable Launch
Vehicle. Proceedings of the Space Technology and Applications International Forum, Vol. 3,
Albuquerque, NM, Jan. 1997, pp. 1125-1143. Also published as NASA TM X-110296, Oct.1996.
12. Jackson, L.R.; and Dixon, S. C.: A Design Assessment of Multiwall, Metallic Stand-off, and RSI
Reusable Thermal Protection Systems Including Space Shuttle Application. NASA TM X-81780,1980.
13. Blair, W.; Meaney, J. E.; and Rosenthal, H. A.: Fabrication of Prepackaged Superalloy
Honeycomb Thermal Protection System (TPS) Panels. NASA CR-15646, Oct. 1985.
14. Whetstone, W. D.: EISI-EAL Engineering Analysis Language Reference Manual, System Level
312. Engineeringing Information Systems, Incorporated, San Jose, 1983.
15. TPSX: Thermal Protection Systems Expert and Material Database, Vers. 1.1, Rev. Feb. 1998.
http://asm.arc.nasa.gov/tpsx 11.shtml Accessed Jan 18, 2000.
16. Cleland, John; and Iannetti, Francesco: Thermal Protection System of the Space Shuttle, NASA
CR- 4227, 1989.
17. Chiu, S. Amanda; and Pitts, William C.: Reusable Surface Insulation for Reentry Spacecraft.
AIAA Paper 91-0695, 29th Aerospace Sciences Meeting, Jan. 1991.
23
18.Williams,S.D.;andCurry,DonaldM.: Thermal Protection Materials, Thermophysical PropertyData. NASA Reference Publication 1289, 1992.
19. Korb, L. J.; Marant, C. A.; Calland, R. M.; and Thatcher, C. S.: The Shuttle Orbiter Thermal
Protection System. American Ceramic Society Bulletin, Vol. 60, No. 11, 1981, pp. 1188-1193.
20. Access to Space Advanced Technology Team Final Report. NASA Langley Research Center,
Vol.3 Design Data, July 1993.
21. Bouslog, S. A.; Moore, B.; Lawson, I.; and Sawyer, J. W.: X-33 Metallic TPS Tests in NASA-
LaRC High Temperature Tunnel. AIAA Paper 99-1045, 37th AIAA Aerospace Sciences Meetingand Exhibit, Jan. 1999.
22. Gorton, M.P.; Shideler, J. L.; and Webb, G. L.: Static and Aerothermal Tests ofa Superalloy
Honeycomb Prepackaged Thermal Protection System. NASA TP-3257, 1993.
23. Blair, W.; Meaney, J. E.; and Rosenthal, H. A.: Re-Design of Titanium Multi-Wall Thermal
Protection System Test Panels. NASA CR- 172247, 1984.
24. Aerospace Structural Metals Handbook, CINDAS/USAF CRDA Handbooks Operation.
Purdue University, West Lafayette, IN, 1994.
24
APPENDIX A
METALLIC THERMAL PROTECTION SYSTEM FOR THE X-33
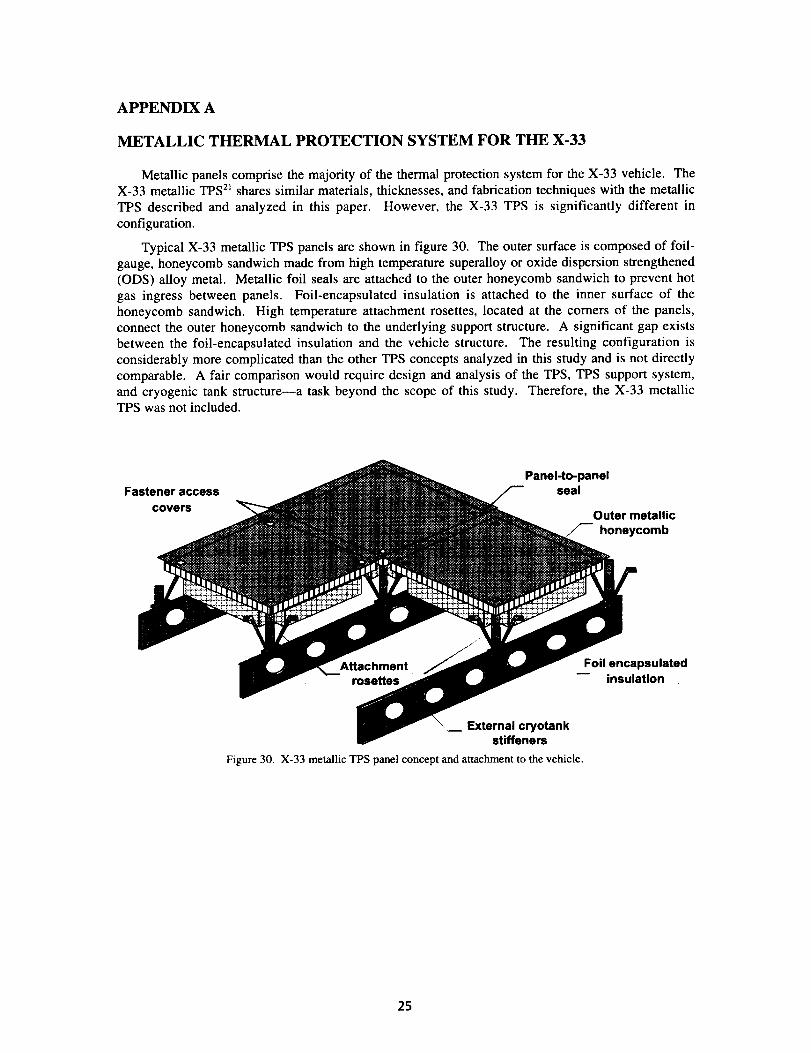
Metallic panels comprise the majority of the thermal protection system for the X-33 vehicle. The
X-33 metallic TPS 2_ shares similar materials, thicknesses, and fabrication techniques with the metallic
TPS described and analyzed in this paper. However, the X-33 TPS is significantly different in
configuration.
Typical X-33 metallic TPS panels are shown in figure 30. The outer surface is composed of foil-
gauge, honeycomb sandwich made from high temperature superalloy or oxide dispersion strengthened
(ODS) alloy metal. Metallic foil seals are attached to the outer honeycomb sandwich to prevent hot
gas ingress between panels. Foil-encapsulated insulation is attached to the inner surface of the
honeycomb sandwich. High temperature attachment rosettes, located at the corners of the panels,
connect the outer honeycomb sandwich to the underlying support structure. A significant gap exists
between the foil-encapsulated insulation and the vehicle structure. The resulting configuration is
considerably more complicated than the other TPS concepts analyzed in this study and is not directly
comparable. A fair comparison would require design and analysis of the TPS, TPS support system,
and cryogenic tank structure--a task beyond the scope of this study. Therefore, the X-33 metallicTPS was not included.
Fastener access
covers
Panel-to-panelseal
Outer metallic
honeycomb
Foil encapsulatedinsulation
m External cryotankstiffeners
Figure 30. X-33 metallic TPS panel concept and attachment to the vehicle.
25
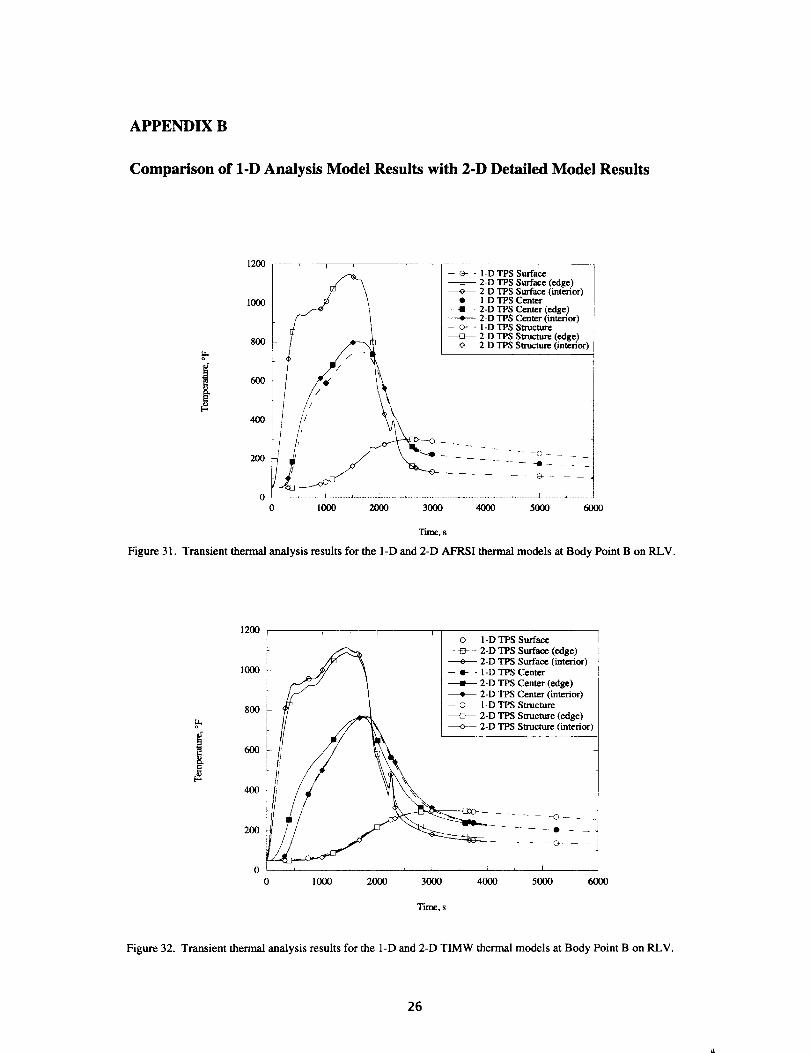
APPENDIX B
Comparison of 1-D Analysis Model Results with 2-D Detailed Model Results
1200
1000
8OO
6OO
4OO
2OO
-- O- - I-D TPS Surface"'_ + 2-D TPS Surface (edge)
f2 \ + 2-D TPS Surface (interior)_ _ \ o I-D TPS Center
/'_ t + 2-D TPS Center (edge)f" _ + 2-D TPS Center (interior)
_ -- o- - I-D TPS StructareL /_ _ _ + 2-D TPS Structure (edge)
+-++++o++,
0 111110 2000 3000 401)0 5000 61100
Tifflc, s
Figure 31. Transient thermal analysis results for the 1-D and 2-D AFRSI thermal models at Body Point B on RLV.
1200
1000
8OO
u. to
i 600 i-_
400-
20O
to
0
t [-- o- - I-D TPS Surface
+ 2-D TPS Surfaoe (edge)
+ 2-D TPS Surface (inteafior)-- O- - I-D TPS Center+ 2-D TPS Center (edge)+ 2-D TPS Center (interior)- o I-D TPS Structure+ 2-D TPS Structure (edge)
/ __ 2-0 TPS Structure (interior_ •
c-- -- i/
1000 2000 3000 4000 5000 6000
Ti/I_, s
Figure 32. Transient thermal analysis results for the 1-D and 2-D TIMW thermal models at Body Point B on RLV.
26
8.[-
1200
1000
800
600
400
200
- o- 1-D TPS Surface
_ .... 2-D TPS Surface (edge)----o---- 2-D TPS Surface (interior)
e I-DTPS Center+ 2-D TPS Center (edge)
-- 2-D TPS Center (interior)- o- - 1-D TPS Structure
2-D TPS Structure (edge)
2-D TPS S_'ucture (interior)
/
0 1000 2000 3000 4000 5000 6000
Time, s
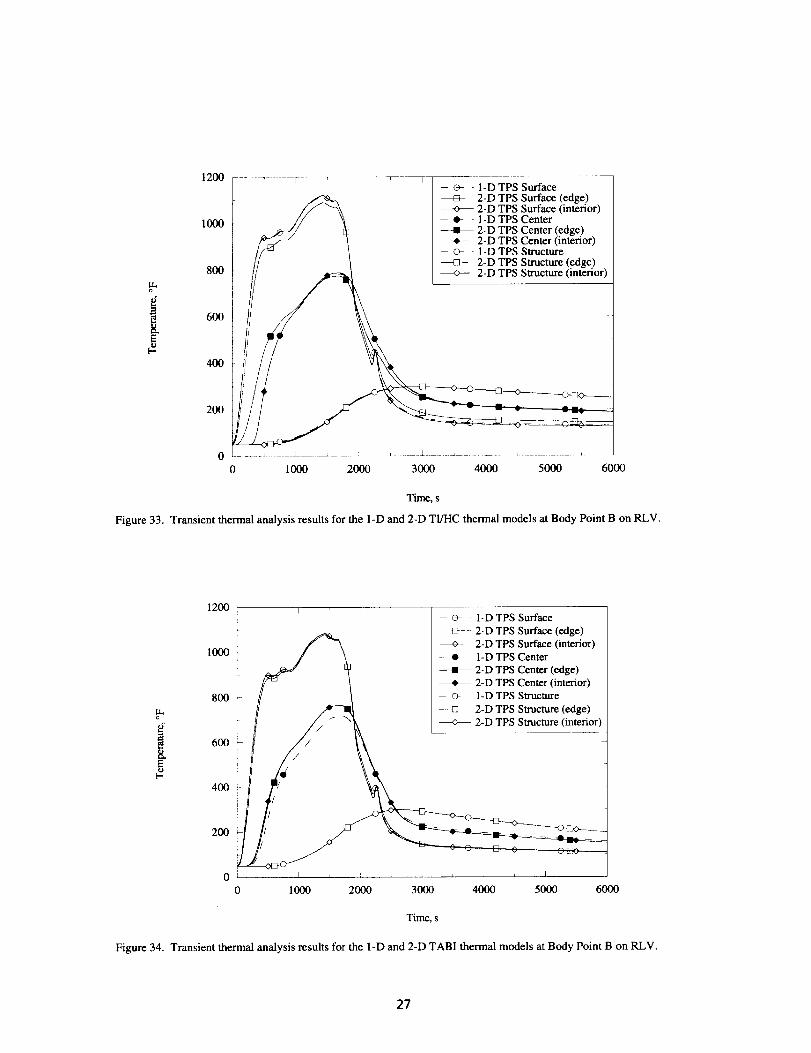
Figure 33. Transient thermal analysis results for the 1-D and 2-D TI/HC thermal models at Body Point B on RLV.
o
[-
1200
1000
800
i
1-D TPS Surface
--+-5--- 2-D TPS Surface (edge)
---_-- 2-D TPS Surface (interior)
.... o l-D TPS Center
2-D TPS Center (edge)
2-D TPS Center (interior)
- o- 1-D TPS Structure
--_ 2-D TPS Structure (edge)
_" _ _ 2_DTpS Structure(interior)
600 _- // _\
400 [ /_// _
0 1000 2000 3000 4000 5000 601)0
Time, s
Figure 34. Transient thermal analysis results for the 1-D and 2-D TABI thermal models at Body Point B on RLV.
27
o_
I-
2500
2OOO
1500
lO00
5OO
-- _- - 1-D TPS Surface
+ 2-D TPS Surface (edge)+ 2-D TPS Surface (interior)
i- o- 1-D TPS Center
r _ + 2-D TPS Center (edge)i / \ ---0-- 2-D TPS Center (interior)_ _ / _ o_ I-D TPS Structure
_ \ ---<3--- 2-D TPS Structure (edge.)
0 1000 2000 3000 4000 5000 6000
Time, s
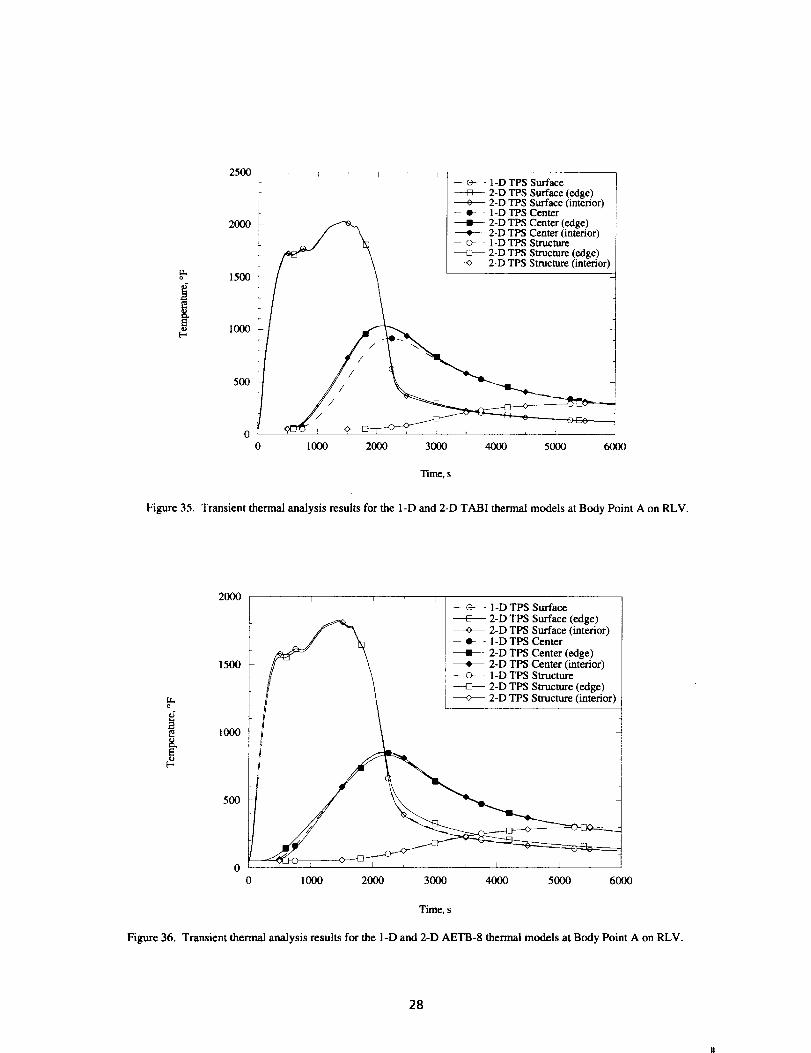
Figure 35. Transient thermal analysis results for the 1-D and 2-D TABI thermal models at Body Point A on RLV.
¢;
[..
2000 [ I i
-- _ - I-D TPS Surface
2-D TPS Surface (edge)+ 2-D TPS Surface (interior)
J _ -- _ - I-D TPS Center-_ ! + 2-D TPS Center (edge)
1500 //F_ \ i + 2-D TPS Center (interior)
[/ \ - o- 1-D TPS Structure/ i ---E_ 2-D TPS Structure (edge)
0 i L , I , I i ,
0 1000 2000 3000 4000 5000 6000
Time, s
Figure 36. Transient thermal analysis results for the I-D and 2-D AETB-8 thermal models at Body Point A on RLV.
28
E
2000 -- • T ?--- T _ 7-- _- - I-D TPS Surface
+ 2-D TPS Surface (edge)
_ _k - -o_ 2-D TPS Surface (interior)
_ __/)¢ _ -- _ - 1-D TPS Center
; _ \ -i 2-D TPS Center (edge)
1500 _- // \ ----¢--- 2-D TPS Center (interior)
! // \ - 0 1-D TPS Structure
i _ l _ 2-D TPS Structure (edge)
0 1000 2000 3000 4000 5000 6000
Time, s
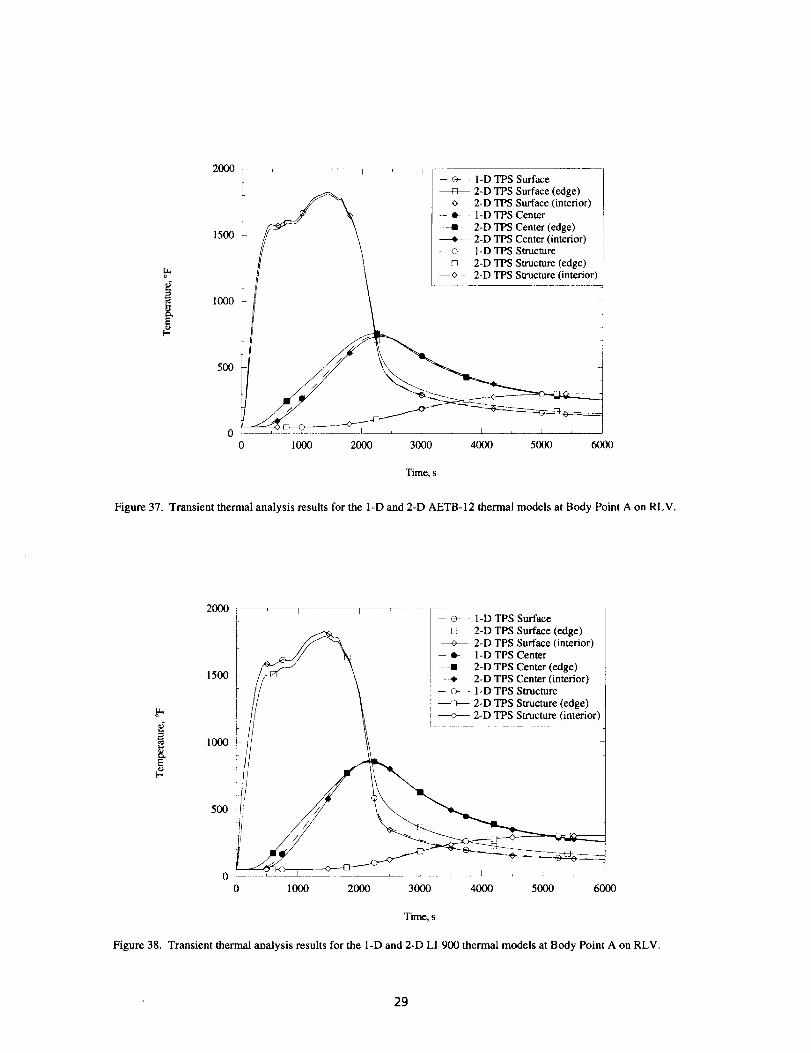
Figure 37. Transient thermal analysis results for the I-D and 2-D AETB-12 thermal models at Body Point A on RLV.
¢.
2000
1500
1000
500
1 F T
/
2-D TPS Surface (edge)
|_o--- 2-D TPS Surface (interior)
It- 1-D TPS Centerl--I- 2-D TPS Center (edge)
--_ 2-D TPS Center (interior)- o- - I-D TPS Structure
--_---- 2-D TPS Structure (edge)
+ 2-D TPS Structure (interior)
1000 2000 3000 4000 5000 6000
Time, s
Figure 38. Transient thermal analysis results for the 1-D and 2-D LI-900 thermal models at Body Point A on RLV.
29
! - @- - 1-D TPS Surface2-D TPS Surface (edge)
_ 2-D TPS Surface (interior)-- o- - 1-D TPS Center
i _ _ _ + 2-D TPS Center (edge)_ _ \ ---*--- 2-D TPS Center (interior)
1500 i ] \ -- o- - I-DTPS Structure
i I \ _ 2-D TPS Structure (edge)
,_ /f \ .
1000 2 / \
500
0
0 1000 2000 3000 4000 5000 6000
Time, s
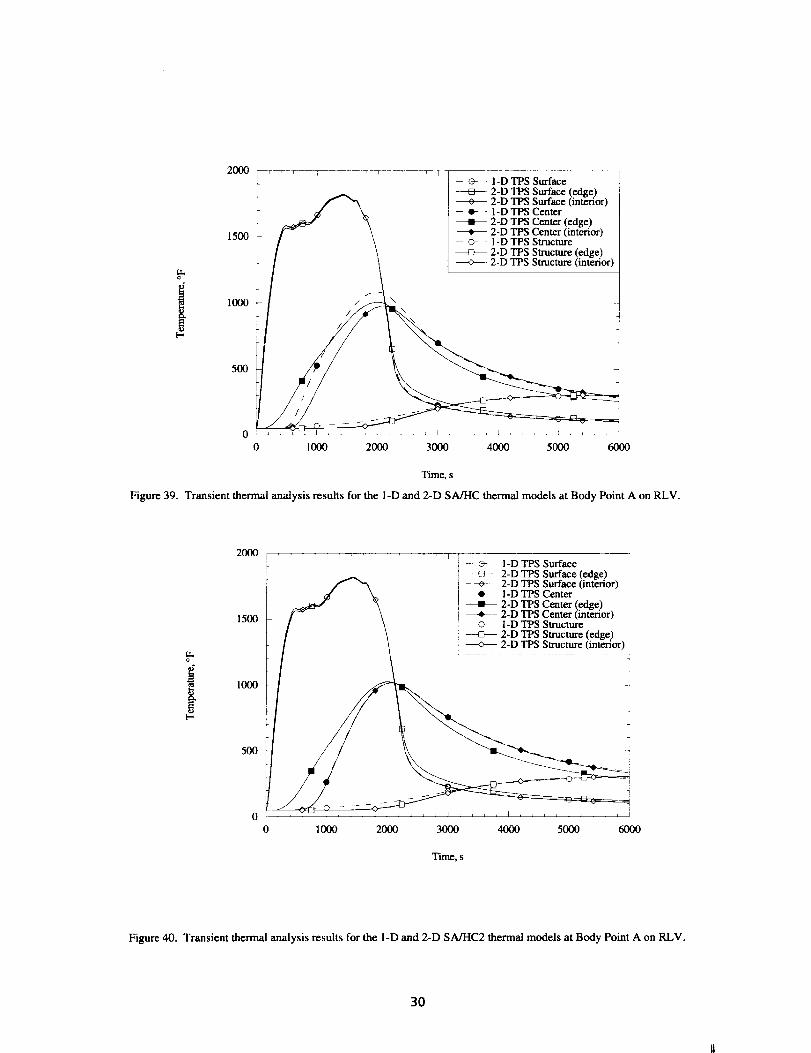
Figure 39. Transient thermal analysis results for the I-D and 2-D SA/HC thermal models at Body Point A on RLV.
[-
2000 i . , ' ' i
-- o- 1-D TPS Surface
- _--- 2-D TPS Surface (.edge) .
---o--- 2-D TPS Surface _mtenor)-- o- - I-D TPS Center
_ _ _ ----In 2-D TPS Center (edge)\ -*-- 2-D TPS Center (interior)
1500 [ \ & IID TPS StructureI \ _ 2-D TPS Structure (edge)
1000/ _ _ 2-'-D-fP-S S -t_--cture (int_--°_-!
500
0
0 1000 2000 3000 4000 5000 6000
Time, s
Figure 40. Transient thermal analysis results for the I-D and 2-D SA/HC2 thermal models at Body Point A on RLV.
30
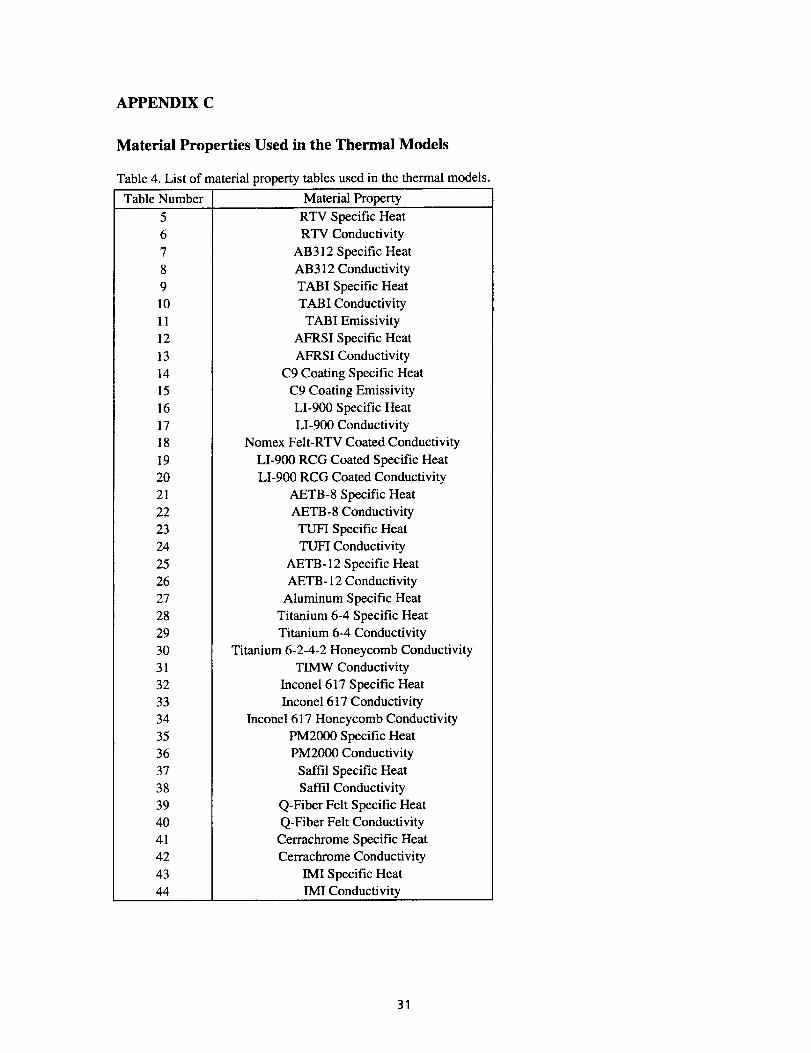
APPENDIX C
Material Properties Used in the Thermal Models
Table 4. List of material property tables used in the thermal models.
Table Number Material Property
5
6
7
8
9
10
11
12
13
14
15
16
17
18
19
20
21
22
23
24
25
26
27
28
29
30
31
32
33
34
35
36
37
38
39
40
41
42
43
44
RTV Specific Heat
RTV Conductivity
AB312 Specific Heat
AB312 Conductivity
TABI Specific Heat
TABI Conductivity
TABI Emissivity
AFRSI Specific Heat
AFRSI Conductivity
C9 Coating Specific Heat
C9 Coating Emissivity
LI-900 Specific Heat
LI-900 Conductivity
Nomex Felt-RTV Coated Conductivity
LI-900 RCG Coated Specific Heat
LI-900 RCG Coated Conductivity
AETB-8 Specific Heat
AETB-8 Conductivity
TUFI Specific Heat
TUFI Conductivity
AETB- 12 Specific Heat
AETB- 12 Conductivity
Aluminum Specific Heat
Titanium 6-4 Specific Heat
Titanium 6-4 Conductivity
Titanium 6-2-4-2 Honeycomb Conductivity
TIMW Conductivity
Inconel 617 Specific Heat
Inconel 617 Conductivity
Inconel 617 Honeycomb Conductivity
PM2000 Specific Heat
PM2000 Conductivity
Saffil Specific Heat
Saffil Conductivity
Q-Fiber Felt Specific Heat
Q-Fiber Felt Conductivity
Cerrachrome Specific Heat
Cerrachrome Conductivity
IMI Specific Heat
IMI Conductivity
31
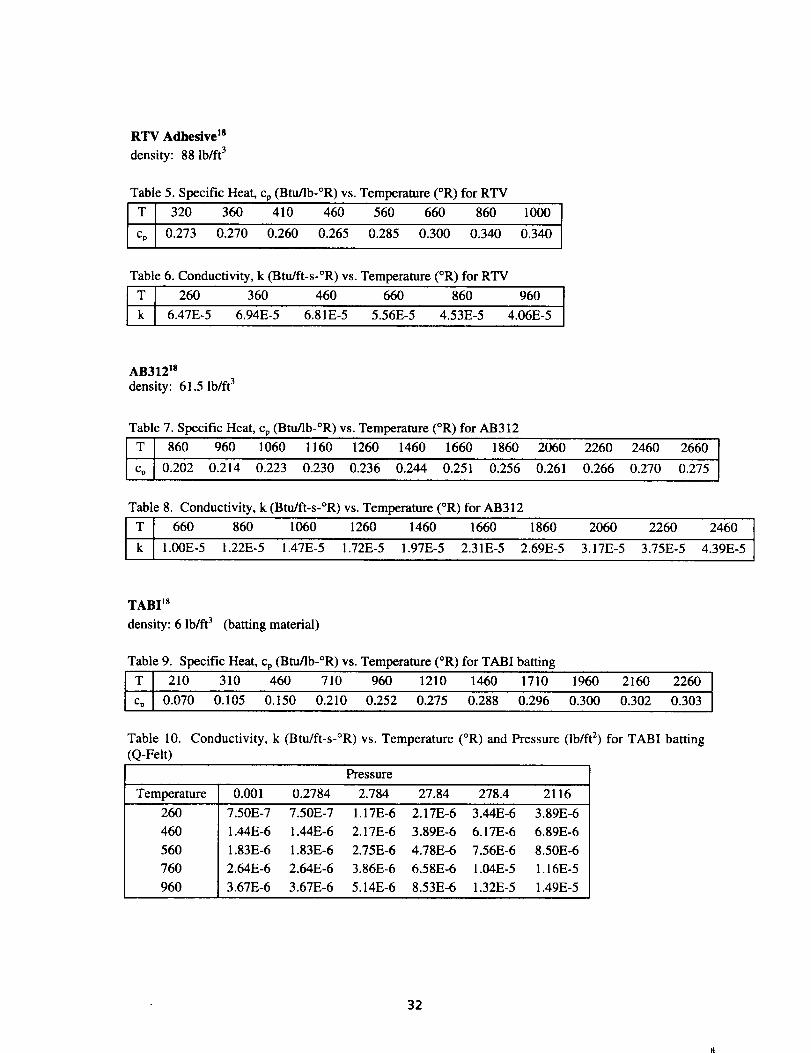
RTVAdhesiveTM
density: 88 lb/ft 3
Table 5. Specific Heat, Cp (Btu/lb-°R) vs. Temperature (°R) for RTV
T 320 360 410 460 560 660 860 1000
% 0.273 0.270 0.260 0.265 0.285 0.300 0.340 0.340
Table 6. Conductivity, k (Btu/ft-s-°R) vs. Temperature (°R) for RTV
T 260 360 460 660 860 960
k 6.47E-5 6.94E-5 6.81E-5 5.56E-5 4.53E-5 4.06E-5
AB312 Is
density: 61.5 lb/ft 3
Table 7. Specific Heat, cp (Btu/lb-°R) vs. Temperature (°R) for AB312
T 860 960 1060 1160 1260 1460 1660 1860 2060 2260 2460 2660
% 0.202 0.214 0.223 0.230 0.236 0.244 0.251 0.256 0.261 0.266 0.270 0.275
Table 8. Conductivity, k (BUdft-s-°R) vs. Temperature (°R) for AB312
T 660 860 1060 1260 1460 1660 1860 2060 2260 2460
k 1.00E-5 1.22E-5 1.47E-5 1.72E-5 1.97E-5 2.31E-5 2.69E-5 3.17E-5 3,75E-5 4.39E-5
TABI js
density: 6 lb/ft 3 (batting material)
Table 9. Specific Heat, cp (Btu/lb-°R) vs. Temperature (°R) for TABI batting
T 210 310 460 710 960 1210 1460 1710 1960 2160 2260
% 0.070 0.105 0.150 0.210 0.252 0.275 0.288 0.296 0.300 0.302 0.303
Table 10. Conductivity, k (Btu/ft-s-°R) vs. Temperature (°R) and Pressure (lb/ft 2) for TABI batting
(Q-Felt)
Pressure
Temperature 0.001 0.2784 2.784 27.84 278.4 2116
260
460
560
760
960
7.50E-7 7.50E-7 1.17E-6 2.17E-6 3.44E-6 3.89E-6
1.44E-6 1.44E-6 2.17E-6 3.89E-6 6.17E-6 6.89E-6
1.83E-6 1.83E-6 2.75E-6 4.78E-6 7.56E-6 8.50E-6
2.64E-6 2.64E-6 3.86E-6 6.58E-6 1.04E-5 1.16E-5
3.67E-6 3.67E-6 5.14E-6 8.53E-6 1.32E-5 1.49E-5
32
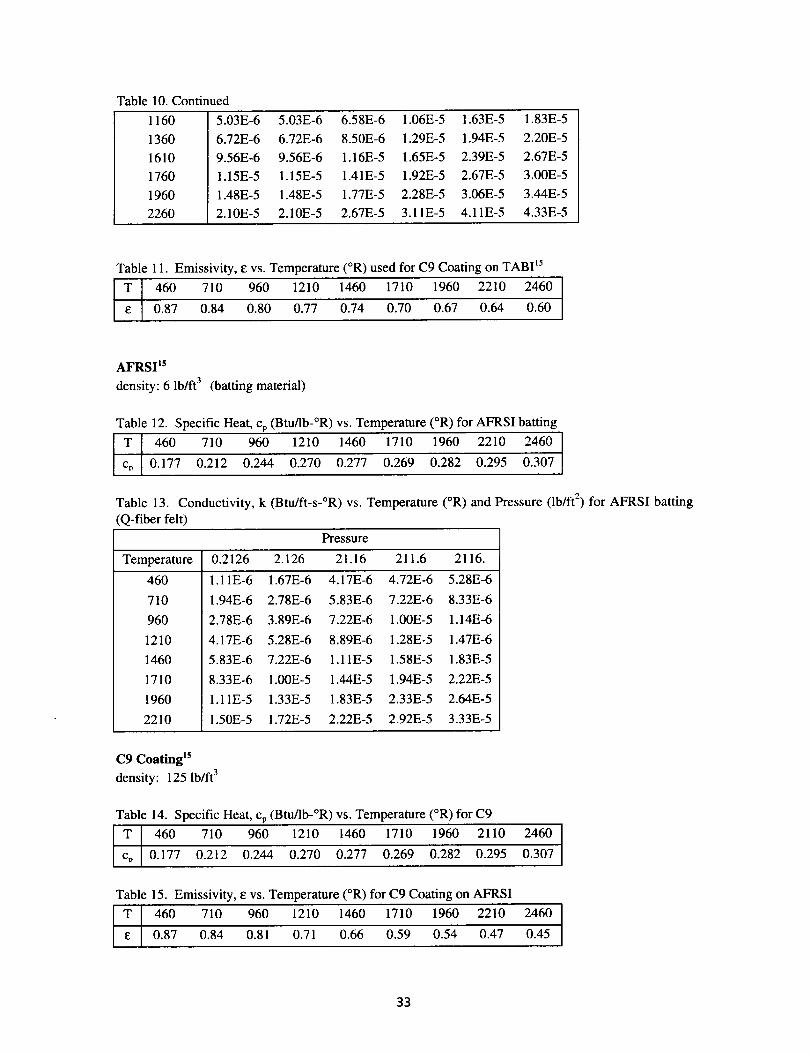
Table10.Continued116013601610176019602260
5.03E-6 5.03E-6 6.58E-6 1.06E-5 1.63E-5 1.83E-56.72E-6 6.72E-6 8.50E-6 1.29E-5 1.94E-5 2.20E-59.56E-6 9.56E-6 1.16E-5 1.65E-5 2.39E-5 2.67E-51.15E-5 1.15E-5 1.41E-5 1.92E-5 2.67E-5 3.00E-51.48E-5 1.48E-5 1.77E-5 2.28E-5 3.06E-5 3.44E-52.10E-5 2.10E-5 2.67E-5 3.11E-5 4.11E-5 4.33E-5
Table11.Emissivi_,Evs.Temperature(°R)usedforC9CoatingonTAB115T 460 710 960 1210 1460 1710 1960 2210 2460
0.87 0.84 0.80 0.77 0.74 0.70 0.67 0.64 0.60
AFRSI is
density: 6 lb/ft 3 (batting material)
Table 12. Specific Heat, cp(Btu_b-°R)vs. Temperature(°R)forAFRSIbatting
T 460 710 960 1210 1460 1710 1960 2210 2460
c o 0.177 0.212 0.244 0.270 0.277 0.269 0.282 0.295 0.307
Table 13.
(Q-fiber felt)
Conductivity, k (Btu/ft-s-°R) vs. Temperature (°R) and Pressure (lb/ft 2) for AFRSI batting
Pressure
Temperature 0.2126 2.126 21.16 211.6 2116.
1.11E-6 1.67E-6 4.17E-6 4.72E-6 5.28E-6
1.94E-6 2.78E-6 5.83E-6 7.22E-6 8.33E-6
2.78E-6 3.89E-6 7.22E-6 1.00E-5 1.14E-6
4.17E-6 5.28E-6 8.89E-6 1.28E-5 1.47E-6
5.83E-6 7.22E-6 1.11E-5 1.58E-5 1.83E-5
8.33E-6 1.00E-5 1.44E-5 1.94E-5 2.22E-5
1.I1E-5 1.33E-5 1.83E-5 2.33E-5 2.64E-5
1.50E-5 1.72E-5 2.22E-5 2.92E-5 3.33E-5
46O
710
960
1210
1460
1710
1960
2210
C9 Coating TM
density: 125 lb/ft 3
Table 14. Specific Heat, Cp (Btu/lb-°R) vs. Temperature (°R) for C9
T 460 710 960 1210 1460 1710 1960 2110 2460
% 0.177 0.212 0.244 0.270 0.277 0.269 0.282 0.295 0.307
Table 15. Emissivity, e vs. Temperature (°R) for C9 Coating on AFRSI
T 460 710 960 1210 1460 1710 1960 2210 2460
e 0.87 0.84 0.81 0.71 0.66 0.59 0.54 0.47 0.45
33
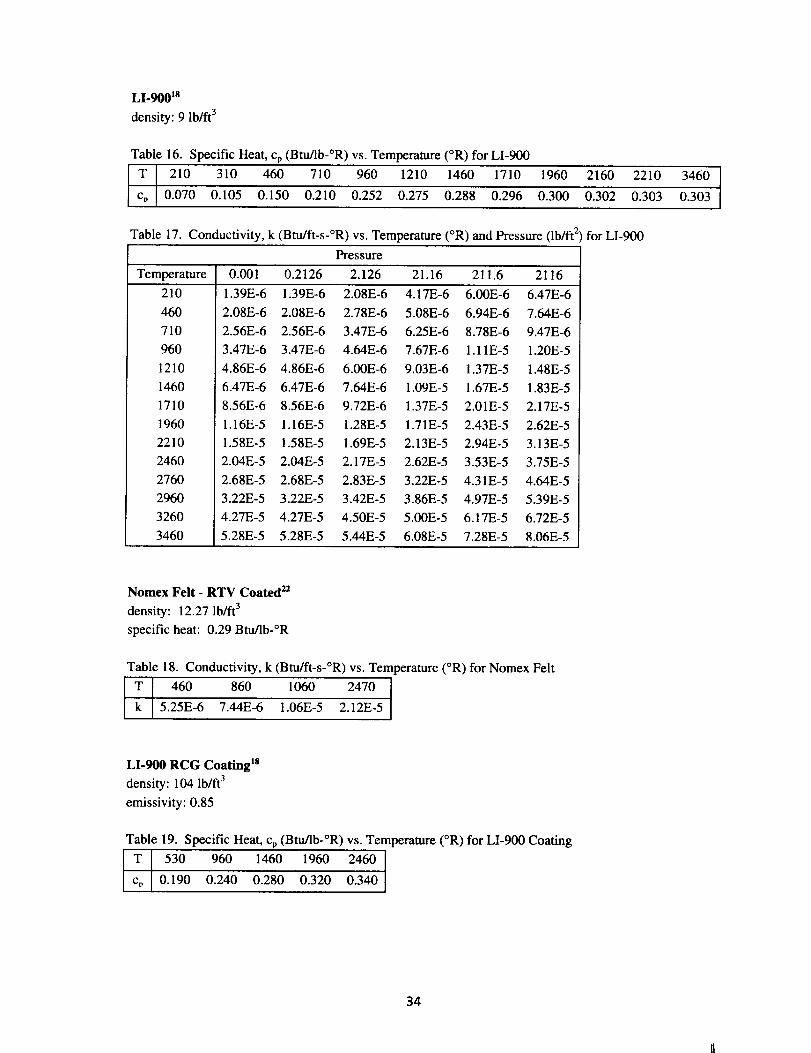
LI-900 m
density: 9 lb/ft 3
Table 16. Specific Heat, cp (Btu/lb-°R) vs. Temperature (°R) for LI-900
T 210 310 460 710 960 1210 1460 1710 1960 2160 2210 3460
c D 0.070 0.105 0.150 0.210 0.252 0.275 0.288 0.296 0.300 0.302 0.303 0.303
Table 17. Conductivity, k (Btu/ft-s-°R) vs. Temperature (°R) and Pressure (lb/ft 2) for LI-900
Pressure
Temperature 0.001 0.2126 2.126 21.16 211.6 2116
210
460
710
96O
1210
1460
1710
1960
2210
2460
2760
2960
3260
3460
1.39E-6 1.39E-6 2.08E-6 4.17E-6 6.00E-6 6.47E-6
2.08E-6 2.08E-6 2.78E-6 5.08E-6 6.94E-6 7.64E-6
2.56E-6 2.56E-6 3.47E-6 6.25E-6 8.78E-6 9.47E-6
3.47E-6 3.47E-6 4.64E-6 7.67E-6 1.11E-5 1.20E-5
4.86E-6 4.86E-6 6.00E-6 9.03E-6 1.37E-5 1.48E-5
6.47E-6 6.47E-6 7.64E-6 1.09E-5 1.67E-5 1.83E-5
8.56E-6 8.56E-6 9.72E-6 1.37E-5 2.01E-5 2.17E-5
1.16E-5 1.16E-5 1.28E-5 1.71E-5 2.43E-5 2.62E-5
1.58E-5 1.58E-5 1.69E-5 2.13E-5 2.94E-5 3.13E-5
2.04E-5 2.04E-5 2.17E-5 2.62E-5 3.53E-5 3.75E-5
2.68E-5 2.68E-5 2.83E-5 3.22E-5 4.31E-5 4.64E-5
3.22E-5 3.22E-5 3.42E-5 3.86E-5 4.97E-5 5.39E-5
4.27E-5 4.27E-5 4.50E-5 5.00E-5 6.17E-5 6.72E-5
5.28E-5 5.28E-5 5.44E-5 6.08E-5 7.28E-5 8.06E-5
Nomex Felt - RTV Coated 22
density: 12.27 lb/ft 3
specific heat: 0.29 Btu/lb-°R
Table 18. Conductivity, k (Btu/ft-s-°R) vs. Temperature (°R) for Nomex Felt
T 460 860 1060 2470
k 5.25E-6 7.44E-6 1.06E-5 2.12E-5
LI-900 RCG Coating TM
density: 104 lb/ft 3
emissivity: 0.85
Table 19. Specific Heat, Cp (Btu/lb-°R) vs. Temperature (°R) for LI-900 Coating
T 530 960 1460 1960 2460
cp 0.190 0.240 0.280 0.320 0.340
34
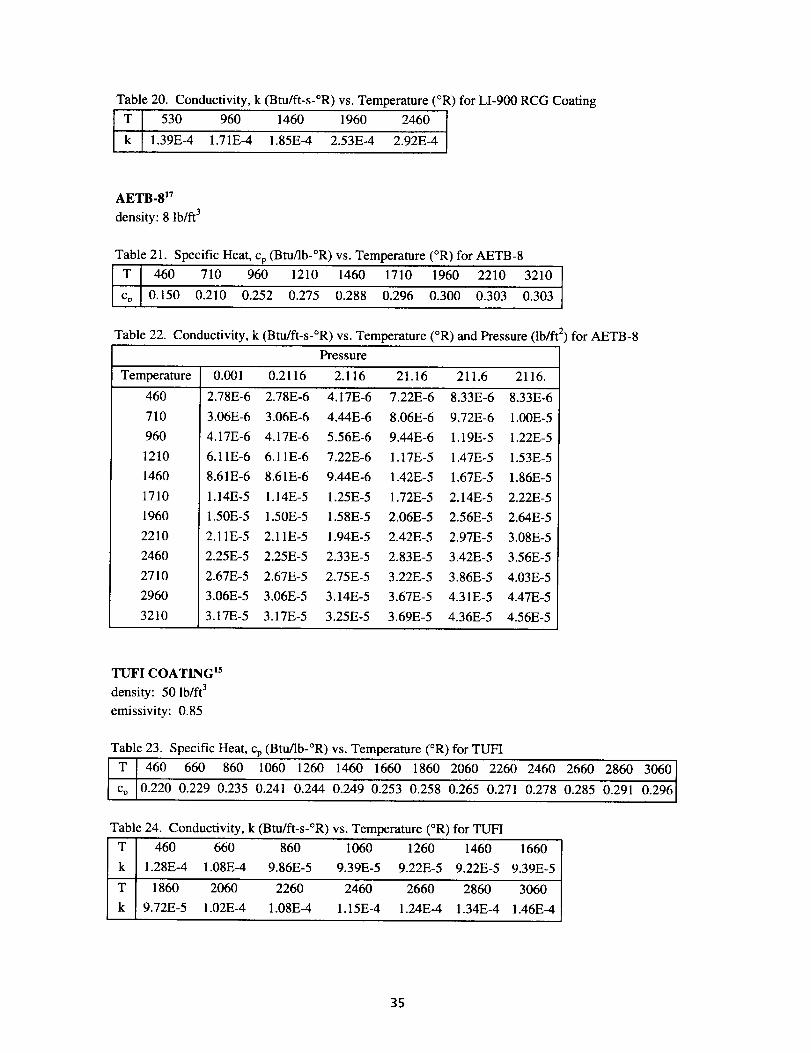
Table20.Conductivity, k (Btu/ft-s-°R) vs. Temperature (°R) for LI-900 RCG Coating
T 530 960 1460 1960 2460
k 1.39E-4 1.71E-4 1.85E-4 2.53E-4 2.92E-4
AETB-817
density: 8 lb/ft 3
Table 21. Specific Heat, Cp (Btu/lb-°R) vs. Temperature (°R) for AETB-8
T 460 710 960 1210 1460 1710 1960 2210 3210
c o 0.150 0.210 0.252 0.275 0.288 0.296 0.300 0.303 0.303
Table 22. Conductivity, k (Btu/ft-s-°R) vs. Temperature (°R) and Pressure (lb/ft 2) for AETB-8
Pressure
Temperature 0.001 0.2116 2.116 21.16 211.6 2116.
460
710
960
1210
1460
1710
1960
2210
2460
2710
2960
3210
2.78E-6 2.78E-6 4.17E-6 7.22E-6 8.33E-6 8.33E-6
3.06E-6 3.06E-6 4.44E-6 8.06E-6 9.72E-6 1.00E-5
4.17E-6 4.17E-6 5.56E-6 9.44E-6 1.19E-5 1.22E-5
6.11E-6 6.11E-6 7.22E-6 1.17E-5 1.47E-5 1.53E-5
8.61E-6 8.61E-6 9.44E-6 1.42E-5 1.67E-5 1.86E-5
1.14E-5 1.14E-5 1.25E-5 1.72E-5 2.14E-5 2.22E-5
1.50E-5 1.50E-5 1.58E-5 2.06E-5 2.56E-5 2.64E-5
2.11E-5 2.11E-5 1.94E-5 2.42E-5 2.97E-5 3.08E-5
2.25E-5 2.25E-5 2.33E-5 2.83E-5 3.42E-5 3.56E-5
2.67E-5 2.67E-5 2.75E-5 3.22E-5 3.86E-5 4.03E-5
3.06E-5 3.06E-5 3.14E-5 3.67E-5 4.31E-5 4.47E-5
3.17E-5 3.17E-5 3.25E-5 3.69E-5 4.36E-5 4.56E-5
TUFI COATING 15
density: 50 lb/ft 3
emissivity: 0.85
Table 23. Specific Heat, cp (Btu/lb-°R) vs. Temperature (°R) for TUFI
T 460 660 860 1060 1260 1460 1660 1860 2060 2260 2460 2660 2860 3060
cD 0.220 0.229 0.235 0.241 0.244 0.249 0.253 0.258 0.265 0.271 0.278 0.285 0.291 0.296
Table 24. Conductivity, k (Btu/ft-s-°R) vs. Temperature (°R) for TUFI
T 460 660 860 1060 1260 1460 1660
k 1.28E-4 1.08E-4 9.86E-5 9.39E-5 9.22E-5 9.22E-5 9.39E-5
T 1860 2060 2260 2460 2660 2860 3060
k 9.72E-5 1.02E-4 1.08E-4 1.15E-4 1.24E-4 1.34E-4 1.46E-4
35
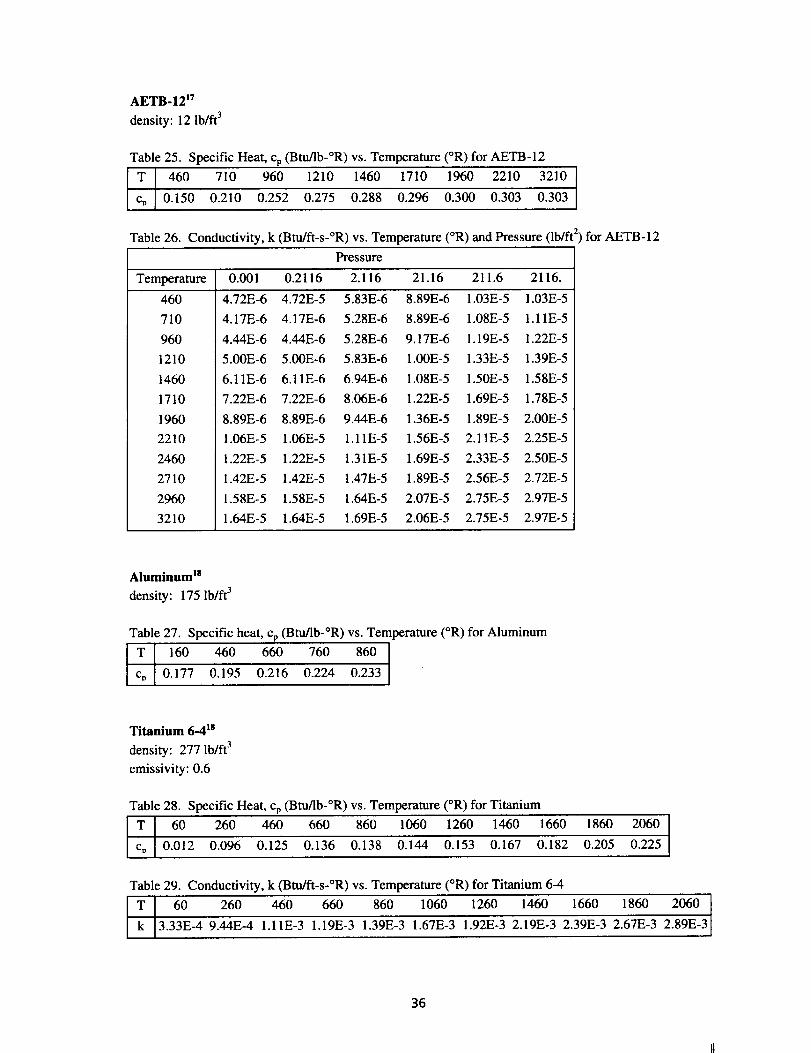
AETB-1217density:12 lb/ft 3
Table 25. Specific Heat, cp (Btu/lb-°R) vs. Temperature (°R) for AETB-12
T 460 710 960 1210 1460 1710 1960 2210 3210
c D 0.150 0.210 0.252 0.275 0.288 0.296 0.300 0.303 0.303
Table 26. Conductivity, k (Btu/ft-s-°R) vs. Temperature (°R) and Pressure (lb/ft 2) for AETB-12
Pressure
Temperature 0.001 0.2116 2.116 21.16 211.6 2116.
460
710
960
1210
1460
1710
1960
2210
2460
2710
2960
3210
4.72E-6 4.72E-5 5.83E-6 8.89E-6 1.03E-5 1.03E-5
4.17E-6 4.17E-6 5.28E-6 8.89E-6 1.08E-5 1.11E-5
4.44E-6 4.44E-6 5.28E-6 9.17E-6 1.19E-5 1.22E-5
5.00E-6 5.00E-6 5.83E-6 1.00E-5 1.33E-5 1.39E-5
6.11E-6 6.11E-6 6.94E-6 1.08E-5 1.50E-5 1.58E-5
7.22E-6 7.22E-6 8.06E-6 1.22E-5 1.69E-5 1.78E-5
8.89E-6 8.89E-6 9.44E-6 1.36E-5 1.89E-5 2.00E-5
1.06E-5 1.06E-5 1.11E-5 1.56E-5 2.11E-5 2.25E-5
1.22E-5 1.22E-5 1.31E-5 1.69E-5 2.33E-5 2.50E-5
1.42E-5 1.42E-5 1.47E-5 1.89E-5 2.56E-5 2.72E-5
1.58E-5 1.58E-5 1.64E-5 2.07E-5 2.75E-5 2.97E-5
1.64E-5 1.64E-5 1.69E-5 2.06E-5 2.75E-5 2.97E-5
Aluminum Is
density: 175 lb/ft 3
Table 27. Specific heat, cp (Btu/lb-°R) vs. Tern
T 160 460 660 760 860
c D 0.177 0.195 0.216 0.224 0.233
_erature (°R) for Aluminum
Titanium 6-4 Is
density: 277 lb/ft 3
emissivity: 0.6
Table 28. Specific Heat, Cp (Btu/lb-°R) vs. Temperature (°R) for Titanium
T 60 260 460 660 860 1060 1260 1460 1660 1860 2060
% 0.012 0.096 0.125 0.136 0.138 0.144 0.153 0.167 0.182 0.205 0.225
Table 29. Conductivity, k (Btu/ft-s-°R) vs. Temperature (°R) for Titanium 6-4
T 60 260 460 660 860 1060 1260 1460 1660 1860 2060
k 3.33E-4 9.44E-4 1.11E-3 1.19E-3 1.39E-3 1.67E-3 1.92E-3 2.19E-3 2.39E-3 2.67E-3 2.89E-3
36
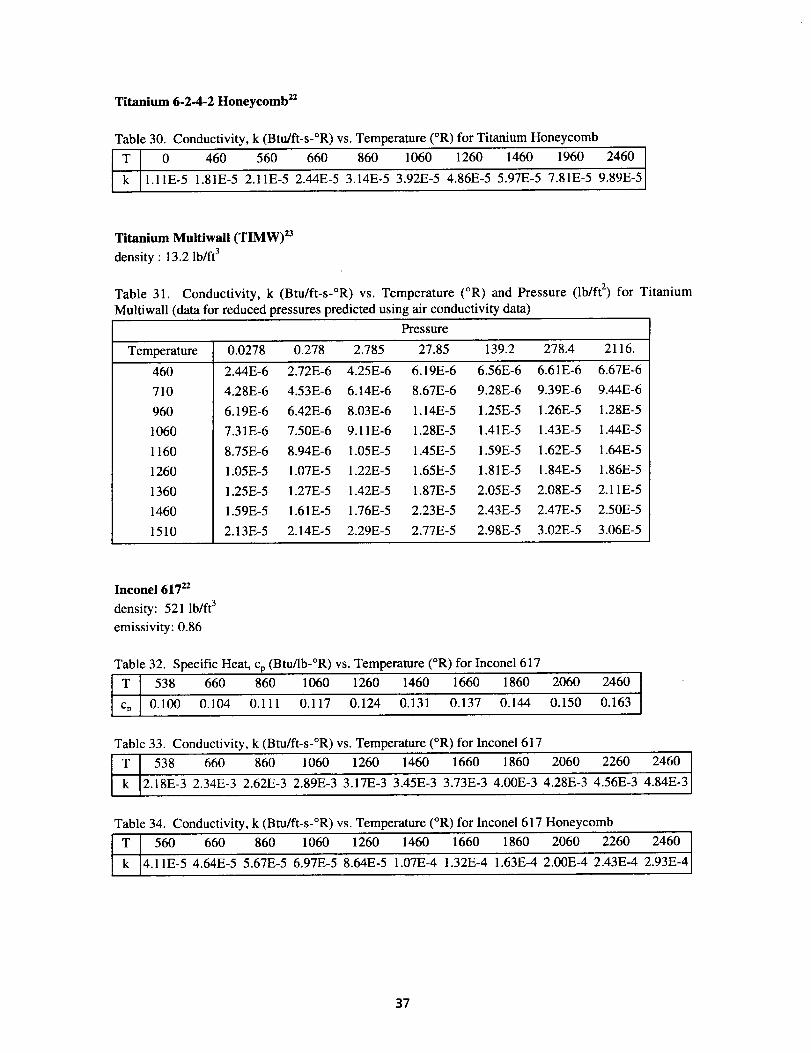
Titanium 6-2-4-2 Honeycomb z2
Table 30. Conductivity, k (Btu/ft-s-°R) vs. Temperature (°R) for Titanium Honeycomb
T 0 460 560 660 860 1060 1260 1460 1960 2460
k 1.11E-5 1.81E-5 2.11E-5 2.44E-5 3.14E-5 3.92E-5 4.86E-5 5.97E-5 7.81E-5 9.89E-5
Titanium Multiwail (TIMW) 2a
density : 13.2 lb/ft 3
Table 31. Conductivity, k (Btu/ft-s-°R) vs. Temperature (°R) and Pressure (lb/ft 2) for Titanium
Multiwall (data for reduced pressures predicted using air conductivity data)
Pressure
Temperature 0.0278 0.278 2.785 27.85 139.2 278.4 2116.
460
710
960
1060
1160
1260
1360
1460
1510
2.44E-6 2.72E-6 4.25E-6 6.19E-6 6.56E-6 6.61E-6 6.67E-6
4.28E-6 4.53E-6 6.14E-6 8.67E-6 9.28E-6 9.39E-6 9.44E-6
6.19E-6 6.42E-6 8.03E-6 1.14E-5 1.25E-5 1.26E-5 1.28E-5
7.31E-6 7.50E-6 9.11E-6 1.28E-5 1.41E-5 1.43E-5 1.44E-5
8.75E-6 8.94E-6 1.05E-5 1.45E-5 1.59E-5 1.62E-5 1.64E-5
1.05E-5 1.07E-5 1.22E-5 1.65E-5 1.81E-5 1.84E-5 1.86E-5
1.25E-5 1.27E-5 1.42E-5 1.87E-5 2.05E-5 2.08E-5 2.11E-5
1.59E-5 1.61E-5 1.76E-5 2.23E-5 2.43E-5 2.47E-5 2.50E-5
2.13E-5 2.14E-5 2.29E-5 2.77E-5 2.98E-5 3.02E-5 3.06E-5
lneonel 617 _a
density: 521 lb/ft 3
emissivity: 0.86
Table 32. Specific Heat, cp (Btu/lb-°R) vs. Temperature (°R) for Inconel 617
T 538 660 860 1060 1260 1460 1660 1860 2060 2460
cD 0.100 0.104 0.111 0.117 0.124 0.131 0.137 0.144 0.150 0.163
Table 33. Conductivity, k (Btu/ft-s-°R) vs. Temperature (°R) for Inconel 617
T 538 660 860 1060 1260 1460 1660 1860 2060 2260 2460
k 2.18E-3 2.34E-3 2.62E-3 2.89E-3 3.17E-3 3.45E-3 3.73E-3 4.00E-3 4.28E-3 4.56E-3 4.84E-3
Table 34. Conductivity, k (Btu/ft-s-°R) vs. Temperature (°R) for Inconel 617 Honeycomb
T 560 660 860 1060 1260 1460 1660 1860 2060 2260 2460
k 4.11E-5 4.64E-5 5.67E-5 6.97E-5 8.64E-5 1.07E-4 1.32E-4 1.63E-4 2.00E-4 2.43E-4 2.93E-4
37
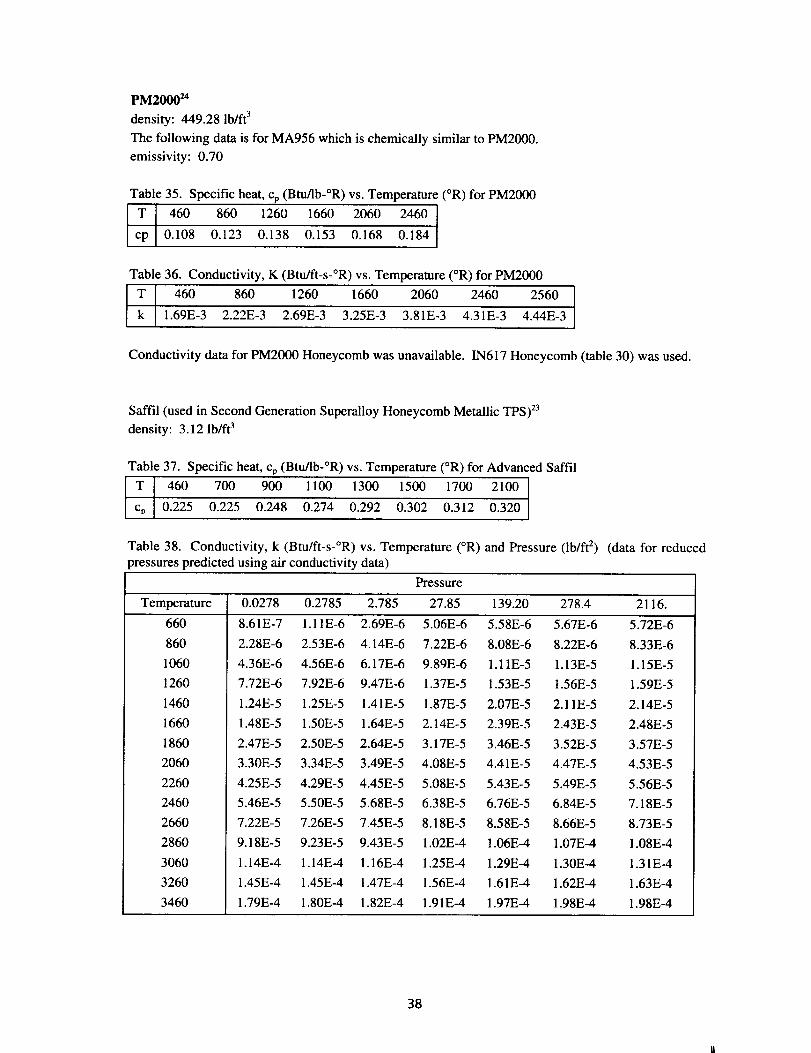
PM200024
density: 449.28 lb/ft 3
The following data is for MA956 which is chemically similar to PM2000.
emissivity: 0.70
Table 35. Specific heat, cp (Btu/lb-°R) vs. Temperature (°R) for PM2000
T 460 860 1260 1660 2060 2460
cp 0.108 0.123 0.138 0.153 0.168 0.184
Table 36. Conductivity, K (Btu/ft-s-°R) vs. Temperature (°R) for PM2000
T 460 860 1260 1660 2060 2460 2560
k 1.69E-3 2.22E-3 2.69E-3 3.25E-3 3.81E-3 4.31E-3 4.44E-3
Conductivity data for PM2000 Honeycomb was unavailable. IN617 Honeycomb (table 30) was used.
Saffil (used in Second Generation Superalloy Honeycomb Metallic TPS) 23
density: 3.12 lb/ft 3
Table 37. Specific heat, Cp (Btu/lb-°R) vs. Temperature (°R) for Advanced Saffil
T 460 700 900 1100 1300 1500 1700 2100
% 0.225 0.225 0.248 0.274 0.292 0.302 0.312 0.320
Table 38. Conductivity, k (Btu/ft-s-°R) vs. Temperature (°R) and Pressure (lb/ft 2) (data for reduced
pressures predicted using air conductivity data)
Pressure
Temperature 0.0278 0.2785 2.785 27.85 139.20 278.4 2116.
660
860
1060
1260
1460
1660
1860
2060
2260
2460
2660
2860
3060
3260
3460
8.61E-7 1.11E-6 2.69E-6 5.06E-6 5.58E-6 5.67E-6 5.72E-6
2.28E-6 2.53E-6 4.14E-6 7.22E-6 8.08E-6 8.22E-6 8.33E-6
4.36E-6 4.56E-6 6.17E-6 9.89E-6 1.11E-5 1.13E-5 1.15E-5
7.72E-6 7.92E-6 9.47E-6 1.37E-5 1.53E-5 1.56E-5 1.59E-5
1.24E-5 1.25E-5 1.41E-5 1.87E-5 2.07E-5 2.11E-5 2.14E-5
1.48E-5 1.50E-5 1.64E-5 2.14E-5 2.39E-5 2.43E-5 2.48E-5
2.47E-5 2.50E-5 2.64E-5 3.17E-5 3.46E-5 3.52E-5 3.57E-5
3.30E-5 3.34E-5 3.49E-5 4.08E-5 4.41E-5 4.47E-5 4.53E-5
4.25E-5 4.29E-5 4.45E-5 5.08E-5 5.43E-5 5.49E-5 5.56E-5
5.46E-5 5.50E-5 5.68E-5 6.38E-5 6.76E-5 6.84E-5 7.18E-5
7.22E-5 7.26E-5 7.45E-5 8.18E-5 8.58E-5 8.66E-5 8.73E-5
9.18E-5 9.23E-5 9.43E-5 1.02E-4 1.06E-4 1.07E-4 1.08E-4
1.14E-4 1.14E-4 1.16E-4 1.25E-4 1.29E-4 1.30E-4 1.31E-4
t .45E-4 1.45E-4 1.47E-4 1.56E-4 1.61E-4 1.62E-4 1.63E-4
1.79E-4 1.80E-4 1.82E-4 1.91E-4 1.97E-4 1.98E-4 1.98E-4
38
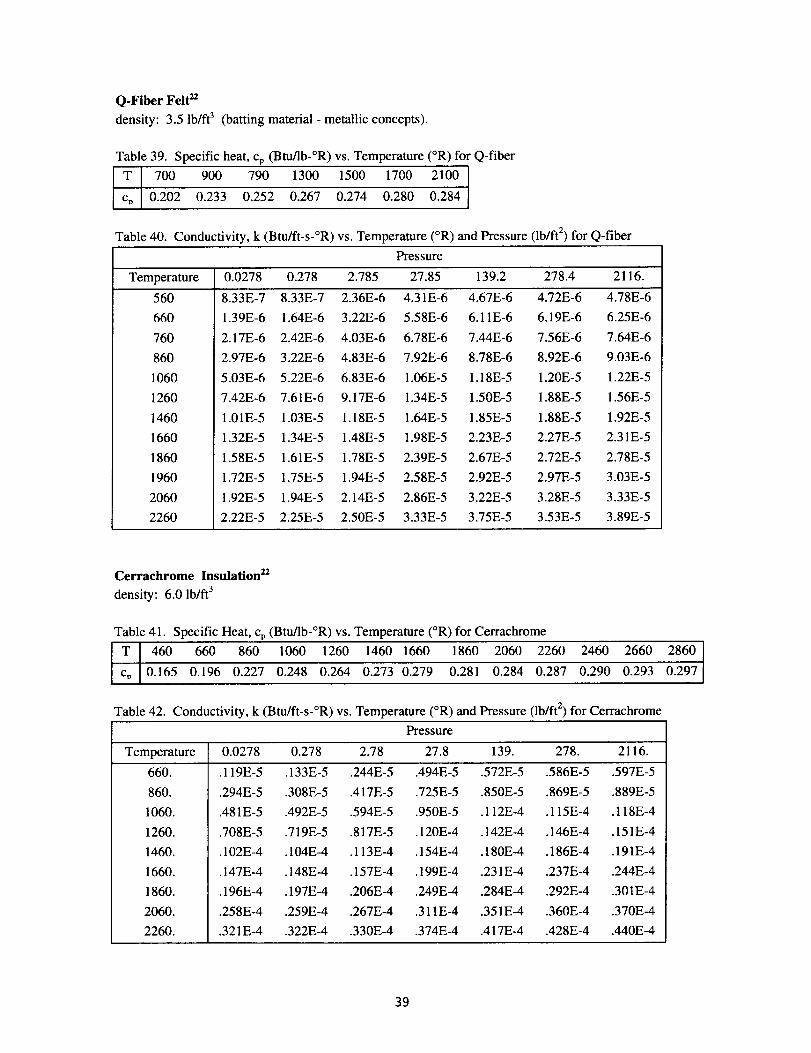
Q-FiberFelt 2z
density: 3.5 lb/ft 3 (batting material - metallic concepts).
Table 39. Specific heat, cp (Btu/lb-°R) vs. Temperature (°R) for Q-fiber
T 700 900 790 1300 1500 1700 2100
cD 0.202 0.233 0.252 0.267 0.274 0.280 0.284
Table 40. Conductivity, k (Btu/ft-s-°R) vs. Temperature (°R) and Pressure (lb/ft 2) for Q-fiber
Pressure
Temperature 0.0278 0.278 2.785 27.85 139.2 278.4 2116.
560
660
760
860
1060
1260
1460
1660
1860
1960
2060
2260
8.33E-7 8.33E-7 2.36E-6 4.31E-6 4.67E-6 4.72E-6 4.78E-6
1.39E-6 1.64E-6 3.22E-6 5.58E-6 6.11E-6 6.19E-6 6.25E-6
2.17E-6 2.42E-6 4.03E-6 6.78E-6 7.44E-6 7.56E-6 7.64E-6
2.97E-6 3.22E-6 4.83E-6 7.92E-6 8.78E-6 8.92E-6 9.03E-6
5.03E-6 5.22E-6 6.83E-6 1.06E-5 1.18E-5 1.20E-5 1.22E-5
7.42E-6 7.61E-6 9.17E-6 1.34E-5 1.50E-5 1.88E-5 1.56E-5
1.01E-5 1.03E-5 1.18E-5 1.64E-5 1.85E-5 1.88E-5 1.92E-5
1.32E-5 1.34E-5 1.48E-5 1.98E-5 2.23E-5 2.27E-5 2.3 IE-5
1.58E-5 1.61E-5 1.78E-5 2.39E-5 2.67E-5 2.72E-5 2.78E-5
1.72E-5 1.75E-5 1.94E-5 2.58E-5 2.92E-5 2.97E-5 3.03E-5
1.92E-5 1.94E-5 2.14E-5 2.86E-5 3.22E-5 3.28E-5 3.33E-5
2.22E-5 2.25E-5 2.50E-5 3.33E-5 3.75E-5 3.53E-5 3.89E-5
Cerrachrome Insulation 22
density: 6.0 lb/ft 3
Table 41. Specific Heat, Cp(Btu/lb-°R) vs. Temperature (°R) for Cerrachrome
T 460 660 860 1060 1260 1460 1660 1860 2060 2260 2460 2660 2860
% 0.165 0.196 0.227 0.248 0.264 0.273 0.279 0.281 0.284 0.287 0.290 0.293 0.297
Table 42. Conductivity, k (Btu/ft-s-°R) vs. Temperature (°R) and Pressure (lb/ft 2) for Cerrachrome
Pressure
Temperature 0.0278 0.278 2.78 27.8 139. 278. 2116.
660.
860.
1060.
1260.
1460.
1660.
1860.
2060.
2260.
.119E-5 .133E-5 .244E-5 .494E-5 .572E-5 .586E-5 .597E-5
.294E-5 .308E-5 .417E-5 .725E-5 .850E-5 .869E-5 .889E-5
.481E-5 .492E-5 .594E-5 .950E-5 .112E-4 .115E-4 .118E-4
.708E-5 .719E-5 .817E-5 .120E-4 .142E-4 .146E-4 .151E-4
.102E-4 .104E-4 .113E-4 .154E-4 .180E-4 .186E-4 .191E-4
.147E-4 .148E-4 .157E-4 .199E-4 .231E-4 .237E-4 .244E-4
.196E-4 .197E-4 .206E-4 .249E-4 .284E-4 .292E-4 .301E-4
.258E-4 .259E-4 .267E-4 .311E-4 .351E-4 .360E-4 .370E-4
.321E-4 .322E-4 .330E-4 .374E-4 .417E-4 .428E-4 .440E-4
39
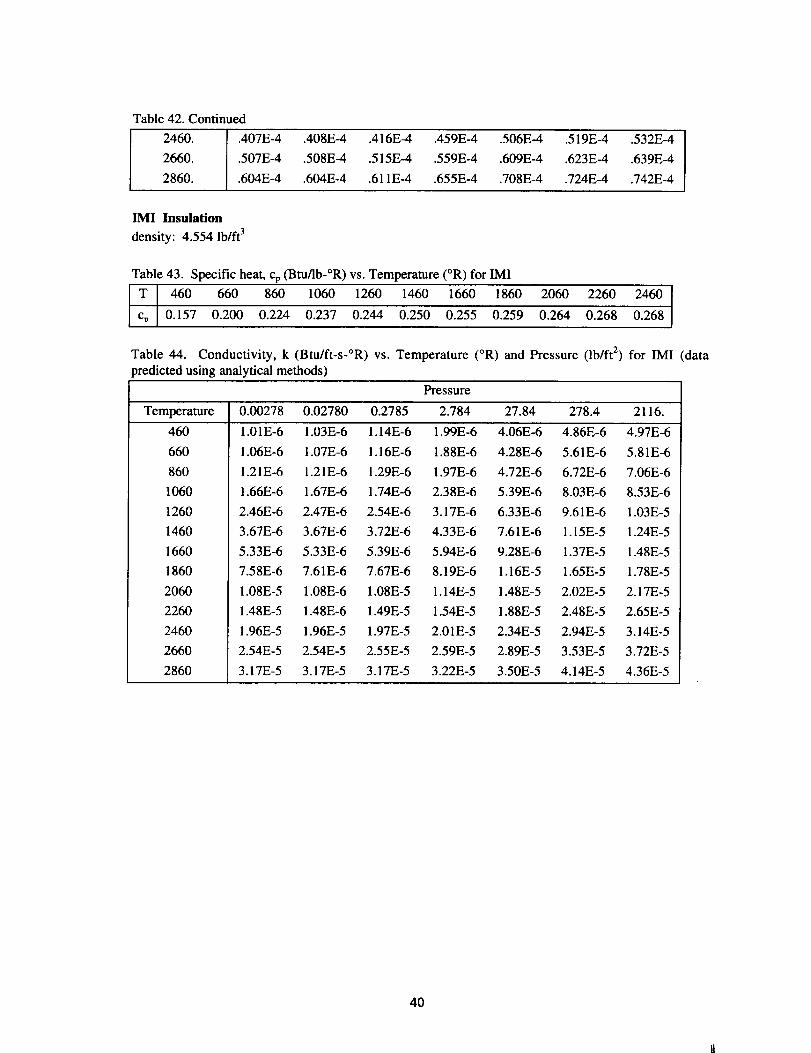
Table42.Continued2460.2660.2860.
.407E-4 .408E-4 .416E-4 .459E-4 .506E-4 .519E-4 .532E-4
.507E-4 .508E-4 .515E-4 .559E-4 .609E-4 .623E-4 .639E-4
.604E-4 .604E-4 .6tlE-4 .655E-4 .708E-4 .724E-4 .742E-4
IMI Insulation
density: 4.554 lb/ft 3
Table 43. Specific heat, cp(Btu/lb-°R)vs. Tempemture(°R)forIMI
T 460 660 860 1060 1260 1460 1660 1860 2060 2260 2460
c, 0.157 0.200 0.224 0.237 0.244 0.250 0.255 0.259 0.264 0.268 0.268
Table 44. Conductivity, k (Btu/ft-s-°R) vs. Temperature (°R) and Pressure (lb/ft 2) for IMI (data
_redicted using analytical methods)
Pressure
Temperature 0.00278 0.02780 0.2785 2.784 27.84 278.4 2116.
460
660
860
1060
1260
1460
1660
1860
2060
2260
2460
2660
2860
1.01E-6 1.03E-6 1.14E-6 1.99E-6 4.06E-6 4.86E-6 4.97E-6
1.06E-6 1.07E-6 1.16E-6 1.88E-6 4.28E-6 5.61E-6 5.81E-6
1.21E-6 1.21E-6 1.29E-6 1.97E-6 4.72E-6 6.72E-6 7.06E-6
1.66E-6 1.67E-6 1.74E-6 2.38E-6 5.39E-6 8.03E-6 8.53E-6
2.46E-6 2.47E-6 2.54E-6 3.17E-6 6.33E-6 9.61E-6 1.03E-5
3.67E-6 3.67E-6 3.72E-6 4.33E-6 7.61E-6 1.15E-5 1.24E-5
5.33E-6 5.33E-6 5.39E-6 5.94E-6 9.28E-6 1.37E-5 1.48E-5
7.58E-6 7.61E-6 7.67E-6 8.19E-6 1.16E-5 1.65E-5 1.78E-5
1.08E-5 1.08E-6 1.08E-5 1.14E-5 1.48E-5 2.02E-5 2.17E-5
1.48E-5 1.48E-6 1.49E-5 1.54E-5 1.88E-5 2.48E-5 2.65E-5
1.96E-5 1.96E-5 1.97E-5 2.01E-5 2.34E-5 2.94E-5 3.14E-5
2.54E-5 2.54E-5 2.55E-5 2.59E-5 2.89E-5 3.53E-5 3.72E-5
3.17E-5 3.17E-5 3.17E-5 3.22E-5 3.50E-5 4.14E-5 4.36E-5
40
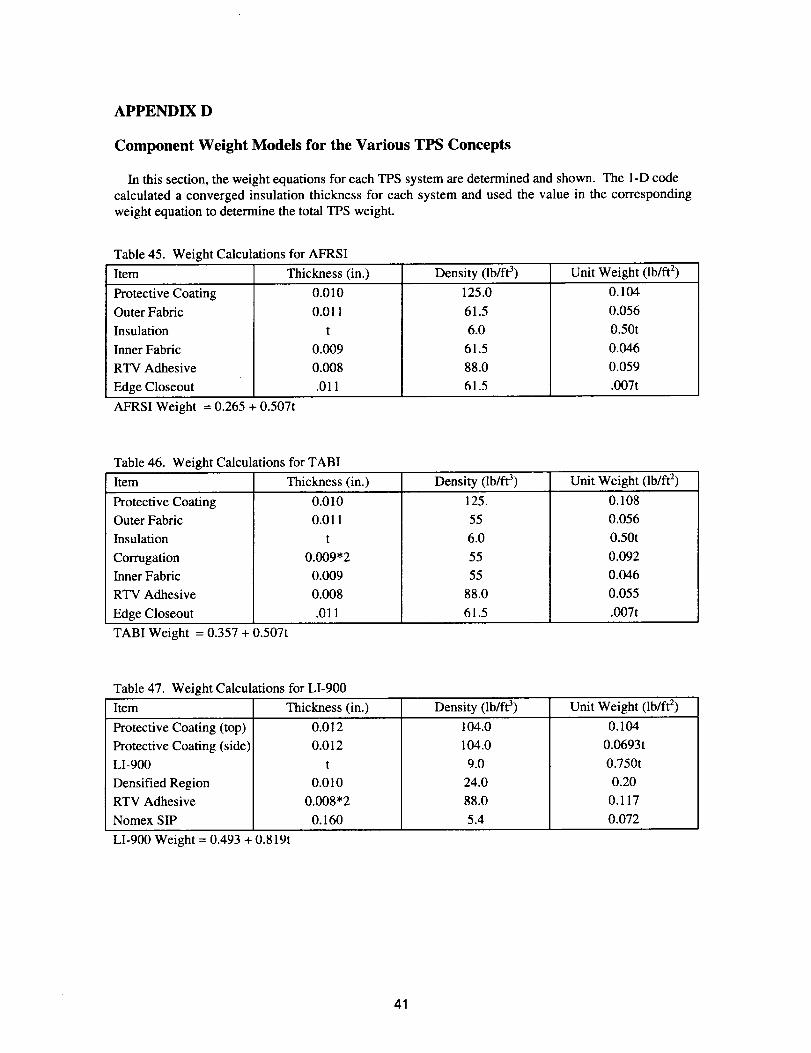
APPENDIX D
Component Weight Models for the Various TPS Concepts
In this section, the weight equations for each TPS system are determined and shown. The 1-D code
calculated a converged insulation thickness for each system and used the value in the corresponding
weight equation to determine the total TPS weight.
Table 45. Weight Calculations for AFRSI
Item Thickness (in.) Density (lb/ft 3) Unit Weight (lb/ft 2)
Protective Coating
Outer Fabric
Insulation
Inner Fabric
RTV Adhesive
Edge Closeout
0.010
0.011
t
0.009
0.008
.011
125.0
61.5
6.0
61.5
88.0
61.5
0.104
0.056
0.50t
0.046
0.059
.007t
AFRSI Weight = 0.265 + 0.507t
Table 46. Weight Calculations for TABI
Item Thickness (in.) Density (lb/ft 3)
Protective Coating
Outer Fabric
Insulation
Corrugation
Inner Fabric
RTV Adhesive
Edge Closeout
0.010
0.011
t
0.009*2
0.009
0.008
.011
125.
55
6.0
55
55
88.0
61.5
Unit Weight (lb/ft 2)
0.108
0.056
0.50t
0.092
0.046
0.055
.007t
TABI Weight = 0.357 + 0.507t
Table 47. Weight Calculations for LI-900
Item Thickness (in.) Density (lb/ft 3) Unit Weight (lb/ft 2)
Protective Coating (top)
Protective Coating (side)
LI-900
Densified Region
RTV Adhesive
Nomex SIP
0.012
0.012
t
0.010
0.008*2
0.160
104.0
104.0
9.0
24.0
88.0
5.4
0.104
0.0693t
0.750t
0.20
0.117
0.072
LI-900 Weight = 0.493 + 0.819t
41
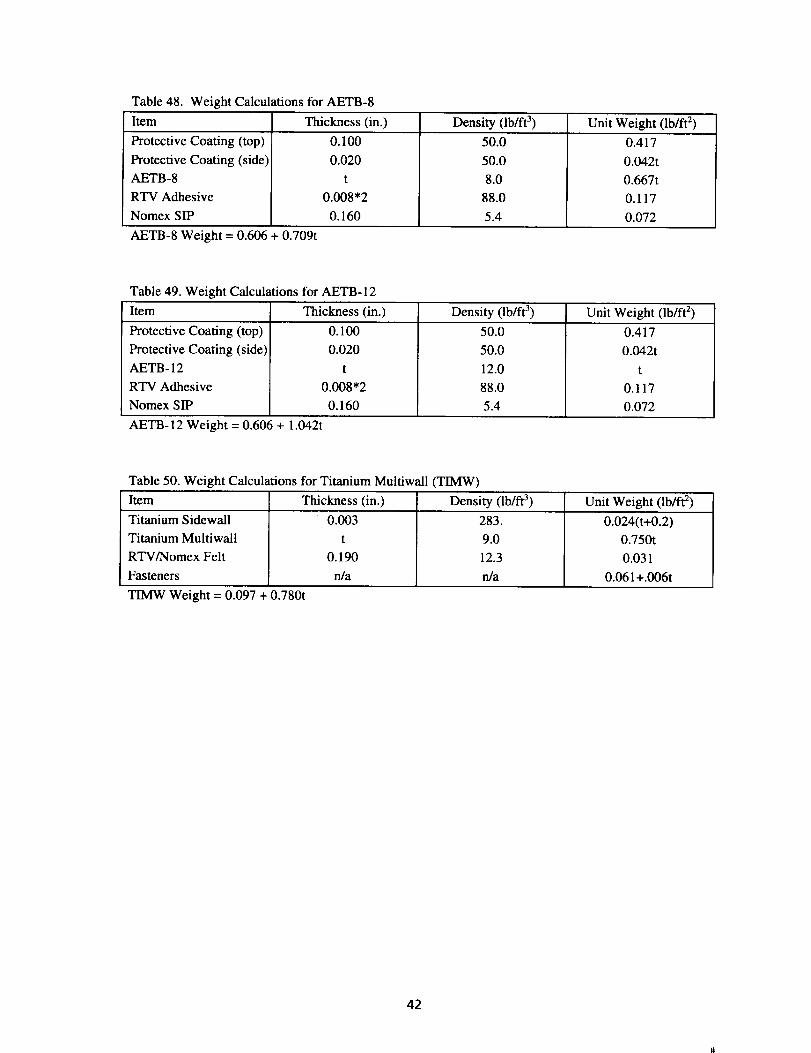
Table48.WeightCalculationsforAETB-8Item Thickness(in.) Density(lb/ft3) UnitWeight(lb/ft:)ProtectiveCoating(top)ProtectiveCoating(side)AETB-8RTVAdhesiveNomexSIP
0.1000.020
t0.008*20.160
AETB-8Weight=0.606+0.709t
50.050.08.088.05.4
0.4170.042t0.667t0.1170.072
Table49.WeightCalculationsforAETB-12Item Thickness(in.) Density(lb/ft3) UnitWeight(lb/ft2)ProtectiveCoating(top)ProtectiveCoating(side)AETB-12RTVAdhesiveNomexSIP
0.1000.020
t0.008*2
0.160
50.0
50.0
12.0
88.0
5.4
0.417
0.042t
t
0.117
0.072
AETB-12 Weight = 0.606 + 1.042t
Table 50. Weight Calculations for Titanium Multiwall (TIMW)
Item Thickness (in.) Density (lb/ft 3) Unit Weight (lb/ft 2)
Titanium Sidewall
Titanium Multiwall
RTV/Nomex Felt
Fasteners
TIMW Weight = 0.097 + 0.780t
0.003
t
0.190
rda
283.
9.0
12.3
n/a
0.024(t+0.2)
0.750t
0.031
0.061+.006t
42
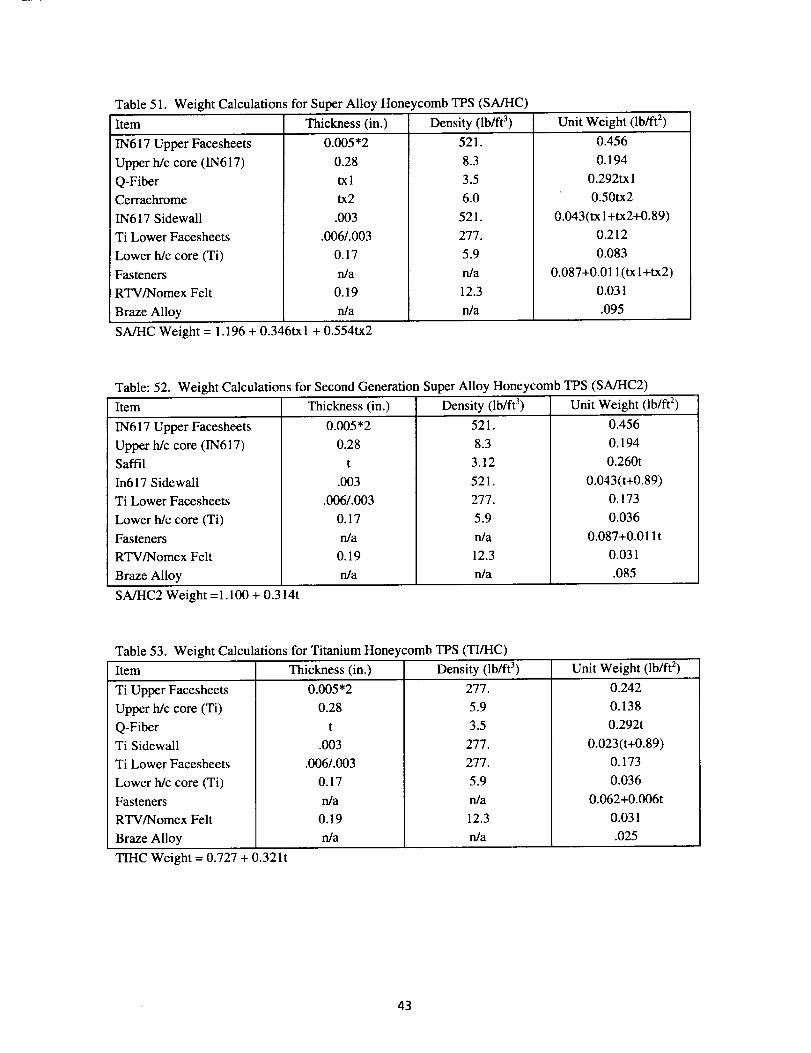
Table51.WeightCalculationsforSuperAlloyHoneycombTPS(SA/HC)Item Thickness(in.)IN617UpperFacesheetsUpperh/ccore(IN617)Q-FiberCerrachromeIN617SidewallTi LowerFacesheetsLowerh/ccore(Ti)FastenersRTV/NomexFeltBrazeAlloy
0.005*20.28txltx2.003
.006/.0030.17n/a0.19n/a
SA/HCWeight= 1.196+0.346txl+ 0.554tx2
Density(lb/ft3)521.8.33.56.0521.277.5.9n/a12.3n/a
UnitWeight(lb/ft2)0.4560.194
0.292txI0.50tx2
0.043(tx1+tx2+0.89)0.2120.083
0.087+0.011(tx1+tx2)0.031.095
Table:52.WeightCalculationsforSecondGenerationSuperAlloyHoneycombTPS(SA/HC2)Item Thickness(in.) Density(lb/ft3) UnitWeight(lb/ft2)
IN617 Upper Facesheets
Upper h/c core (IN617)
Saffil
In617 Sidewall
Ti Lower Facesheets
Lower h/c core (Ti)
Fasteners
RTV/Nomex Felt
Braze Alloy
0.005*2
0.28
t
.003
.006/.003
0.17
n/a
0.19
n/a
521.
8.3
3.12
521.
277.
5.9
n/a
12.3
n/a
0.456
0.194
0.260t
0.043(t+0.89)
0.173
0.036
0.087+0.01 It
0.031
.085
SA/HC2 Weight =1.100 + 0.314t
Table 53. Weight Calculations for Titanium Honeycomb TPS (TI/HC)
Item Thickness (in.) Density (lb/ft 3) Unit Weight (lb/ft 2)
Ti Upper Facesheets
Upper h/c core (Ti)
Q-Fiber
Ti Sidewall
Ti Lower Facesheets
Lower h/c core (Ti)
Fasteners
RTV/Nomex Felt
Braze Alloy
0.005*2
0.28
t
.003
.006/.003
0.17
n/a
0.19
n/a
277.
5.9
3.5
277.
277.
5.9
n/a
12.3
n/a
0.242
0.138
0.292t
0.023(t+0.89)
0.173
0.036
0.062+0.006t
0.031
.025
TIHC Weight = 0.727 + 0.321t
43
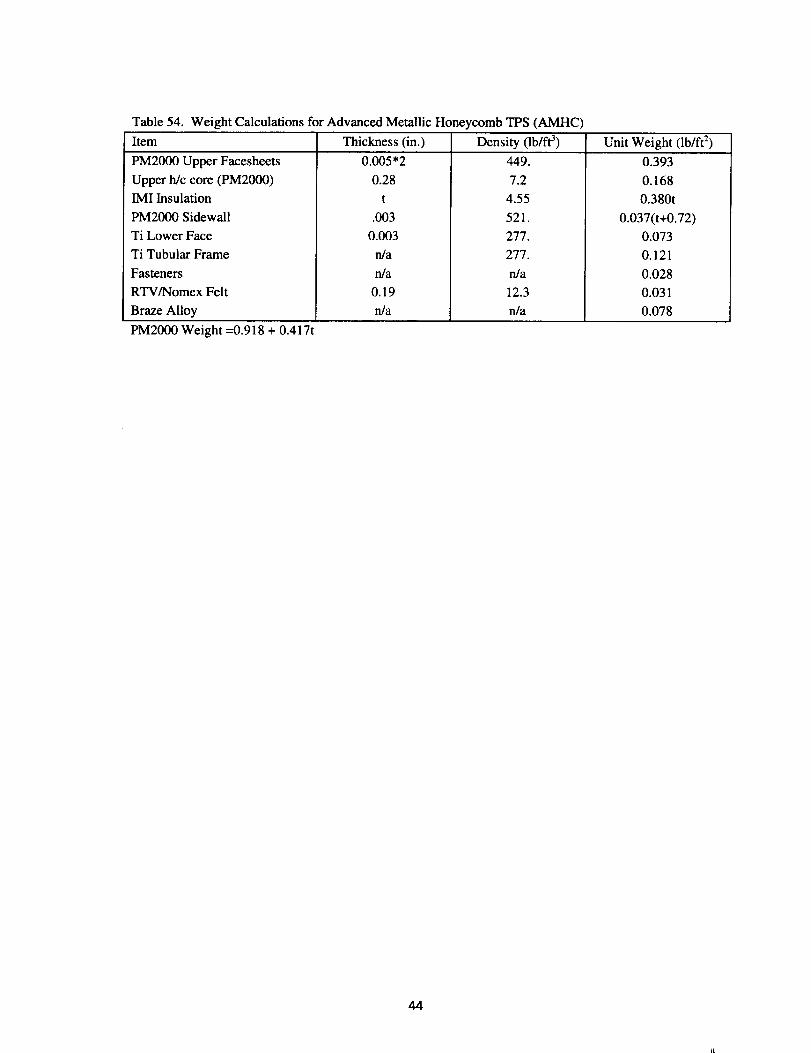
Table 54. Weight Calculations for Advanced Metallic Honeycomb TPS (AMHC)
Item Thickness (in.) Density (lb/ft 3) Unit Weight (lb/ft 2)
PM2000 Upper Facesheets
Upper h/c core (PM2000)
IMI Insulation
PM2000 Sidewall
Ti Lower Face
Ti Tubular Frame
Fasteners
RTV/Nomex Felt
Braze Alloy
0.005*2
0.28
t
.003
0.003
n/a
n/a
0.19
n/a
449.
7.2
4.55
521.
0.393
0.168
0.380t
0.037(t+0.72)
277.
277.
n/a
12.3
n/a
0.073
0.121
0.028
0.031
0.078
PM2000 Weight =0.918 + 0.417t
44

45
REPORT DOCUMENTATION PAGE For_ApprovedOMB No 0704-0188
Public reporting burden for this collection of information is estimated lo average 1 hour per response, including the time for reviewing instructions, searching existing datasources, gathering and maintaining the data needed, and completing and reviewing the collect=on of information Send comments regarding this burden estimate or any otheraspect of this collection of information, including suggestions for reducing this burden, to Washington Heedquarters Services, Directorate for Information Operations andReports, 1215 Jefferson Davis Highway, Suite 1204, Arlington, VA 22202-4302, and Io the Office of Management and Budget, Paperwork Reduction Project (0704-0188),
Washington. DC 205031. AGENCY USE ONLY (Leave blank) 2. REPORT DATE 3. REPORT TYPE AND DATES COVERED
June 2000 Technical Memorandum
4. TITLE AND SUBTITLE 5. FUNDING NUMBERS
Parametric Weight Comparison of Advanced Metallic, Ceramic Tile, andCeramic Blanket Thermal Protection Systems WI, I 242-33-01-50
6. AUTHOR(S)
l)avid E. Myers, Carl J. Martin, and Max L. Blosser
7. PERFORMING ORGANIZATION NAME(S) AND ADDRESS(ES)
NASA Langley Research ('enter
Hampton, VA 23681-2199
9. SPONSORING/MONITORING AGENCY NAME(S) AND ADDRESS(ES)
National Aeronautics and Space Administration
Washington, DC 20546-0001
8. PERFORMING ORGANIZATIONREPORT NUMBER
L-17954
10. SPONSORING/MONITORINGAGENCY REPORT NUMBER
NA SA/TM-2000-2 ! 0289
11.SUPPLEMENTARY NOTES
12a. DISTRIBUTION/AVAILABILITY STATEMENT
t lnclassified-Unlimited
Subject Category 15 Distribution: Standard
Availability: NASA CAS! (301)621-0390
12b. DISTRIBUTION CODE
13. ABSTRACT (Maximum 200 words)
A parametric weight assessment of advanced metallic panel, ceramic blanket, and ceramic tile thermal protection
systems (TPS) was conducted using an implicit, one-dimensional (I-D) finite element sizing code. This sizingcode contained models to account for coatings, fasteners, adhesives, and strain isolation pads. Atmospheric
entr 3 heating profiles for two vehicles, the Access to Space (ATS) vehicle and a proposed Reusable LaunchVehicle (RLV), were used to ensure that the trends were not unique to a certain trajectory. Ten TPS concepts
were compared for a range of applied heat loads and substructural heat capacities to identify general trends. This
study found the bhmket TPS concepts have the lightest weights over the majority of their applicable ranges, andcurrent technology ceramic tiles and metallic TPS concepts have similar weights. A proposed, state-of-the-art
metallic system which uses a higher temperature alloy and efficient multilayer insulation was predicted to be
significantly lighter than the ceramic tile systems and approaches blanket TPS weights for higher integrated heatloads.
14. SUBJECT TERMS
Thermal protection systems (TPS); Reusable launch vehicles (RLV);
Thermal analysis
17. SECURITY CLASSIFICATION 18. _Fi_UHITY (.;LA_,_IPI',.;AIIUN lY. 51E_UI;IITY CLA_,_IPIr,.;ATIONOF REPORT OF THIS PAGE OF ABSTRACT
Unclassified Unclassified Unclassified
NSN 7540-01-280-5500
46
15. NUMBER OFPAGES
4916. PRICE CODE
A0320. LIMITATION
OF ABSTRACT
UL
standard Porm 298 (Hey. 2-89)Prescribed by ANSI Std. Z-39-18298-102