Embed Size (px)
Citation preview
English Language Arts/Literacy Parent Score Report
The PARCC test measures how well students are meeting academic expectations and learning the
knowledge and skills they need to stay on track in school and after high school – in college or a career. The
test measures complex skills like critical thinking, persuasive writing, and problem-solving. The PARCC test is
just one of many ways that teachers and schools measure whether your child is on track for success.
Teachers use the scores to improve teaching and learning, and to customize instruction to meet each
student’s needs. Parents receive one report for English language arts and one for mathematics.
Important improvements were made to the test this year. It is now 90 minutes shorter for most students, and it
was easier for schools to administer the test because students now take the test during a single testing
window. The results will come back sooner, too – by early fall or sooner.
NOTE: Below is a sample score report. It does not include your child’s scores or information.
Ask your child’s school for his or her score report.
Key Information in the Score Report
Sample only.
How did your child do overall? Your child’s score (see below) fits into one of five performance levels. Level 1 is the
lowest performance level; Level 5 is the highest. See #2 for an explanation of what each level means.
What does each performance level mean? Level 4 is the target. It shows that your child has met expectations and
is well prepared for the next grade level. (This is what some states call “proficient.”) Levels 1, 2 and 3 show a child
did not fully meet expectations. Level 5 shows the child did better than what is expected for the grade level.
What was my child’s score? The purple bar graph shows the score ranges for each performance level. In addition
to the exact score, the black triangle shows how close your child’s score is to the next performance level.
Is my child on track? The words under the purple bar graph show that students who score at Level 1, 2, or 3 may
need extra help to be successful at the next grade level. Students performing at Level 4 or Level 5 are on track for
the next grade level. Not all states include this language in the parent score report.
Parent Guide to the Score Report
1
4
3
2
1
2
3
4
2
Sample only
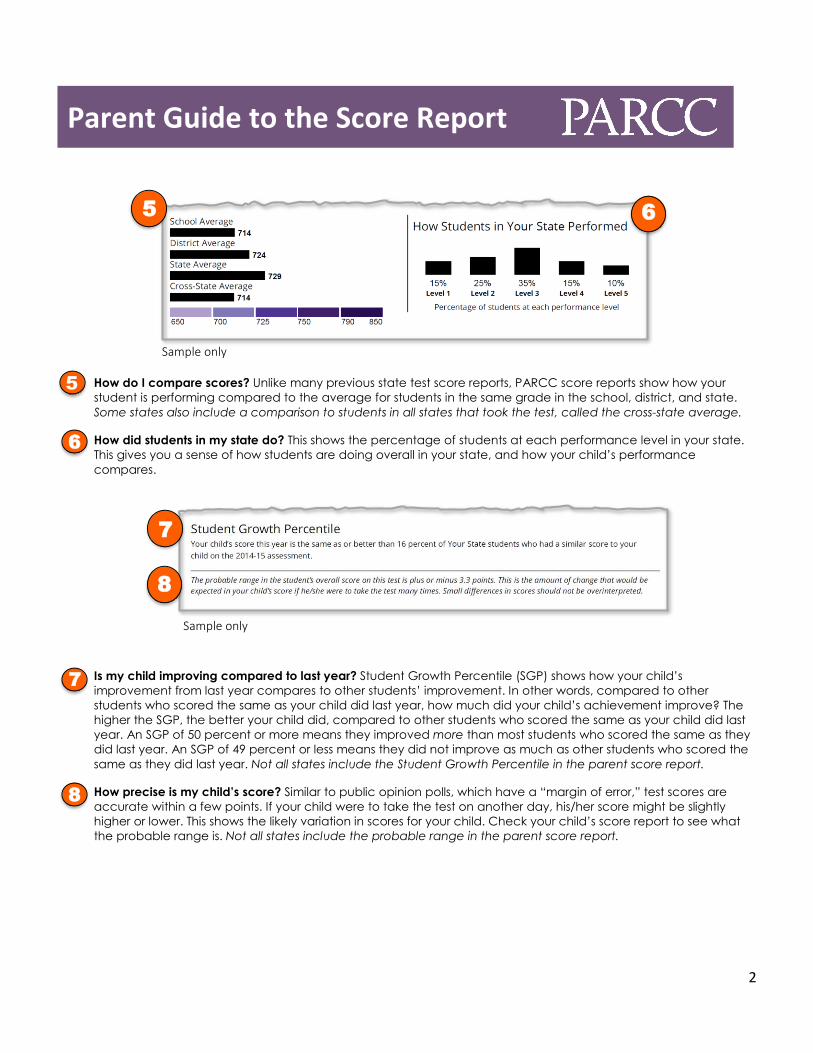
How do I compare scores? Unlike many previous state test score reports, PARCC score reports show how your
student is performing compared to the average for students in the same grade in the school, district, and state.
Some states also include a comparison to students in all states that took the test, called the cross-state average.
How did students in my state do? This shows the percentage of students at each performance level in your state.
This gives you a sense of how students are doing overall in your state, and how your child’s performance
compares.
Sample only
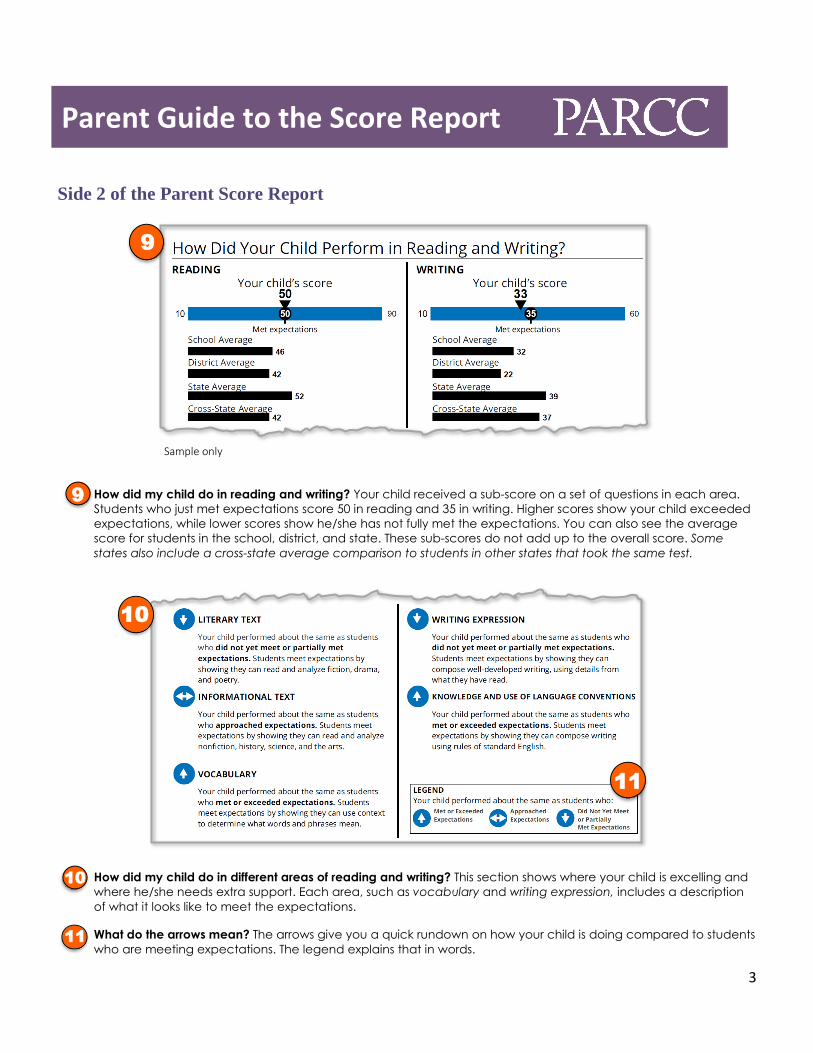
Is my child improving compared to last year? Student Growth Percentile (SGP) shows how your child’s
improvement from last year compares to other students’ improvement. In other words, compared to other
students who scored the same as your child did last year, how much did your child’s achievement improve? The
higher the SGP, the better your child did, compared to other students who scored the same as your child did last
year. An SGP of 50 percent or more means they improved more than most students who scored the same as they
did last year. An SGP of 49 percent or less means they did not improve as much as other students who scored the
same as they did last year. Not all states include the Student Growth Percentile in the parent score report.
How precise is my child’s score? Similar to public opinion polls, which have a “margin of error,” test scores are
accurate within a few points. If your child were to take the test on another day, his/her score might be slightly
higher or lower. This shows the likely variation in scores for your child. Check your child’s score report to see what
the probable range is. Not all states include the probable range in the parent score report.
5
6
7
8
5
6
7
8
9
Parent Guide to the Score Report
3
Side 2 of the Parent Score Report
Sample only
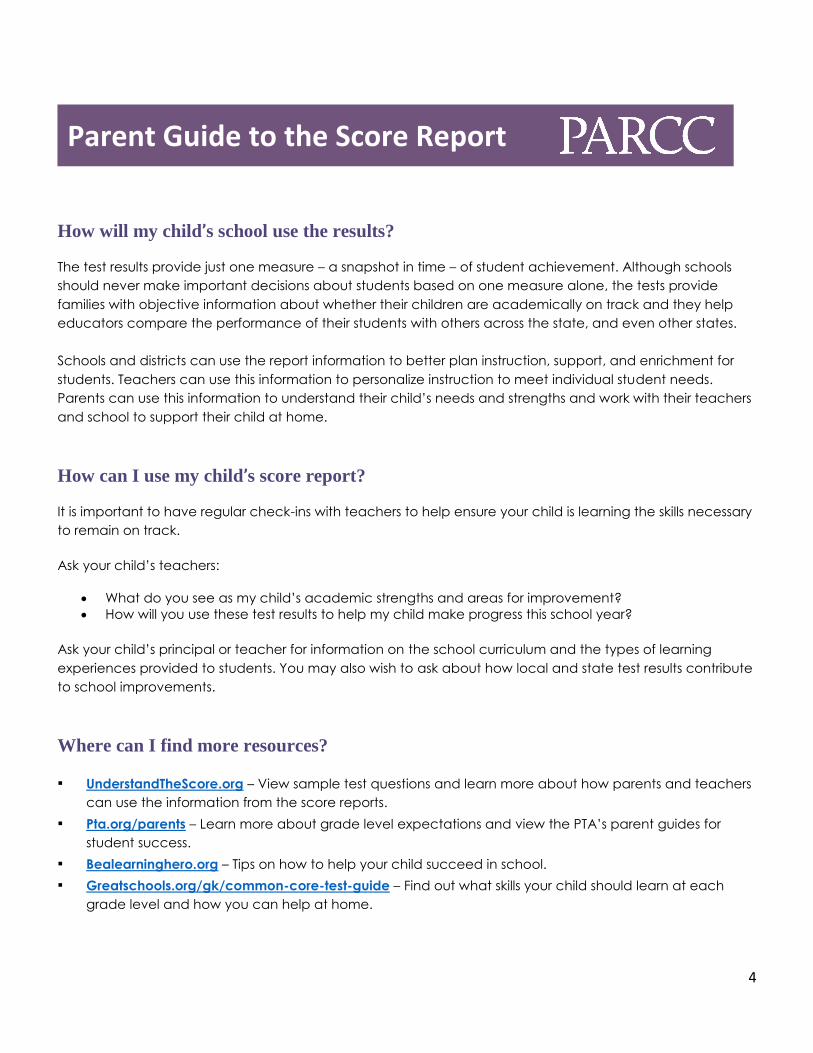
How did my child do in reading and writing? Your child received a sub-score on a set of questions in each area.
Students who just met expectations score 50 in reading and 35 in writing. Higher scores show your child exceeded
expectations, while lower scores show he/she has not fully met the expectations. You can also see the average
score for students in the school, district, and state. These sub-scores do not add up to the overall score. Some
states also include a cross-state average comparison to students in other states that took the same test.
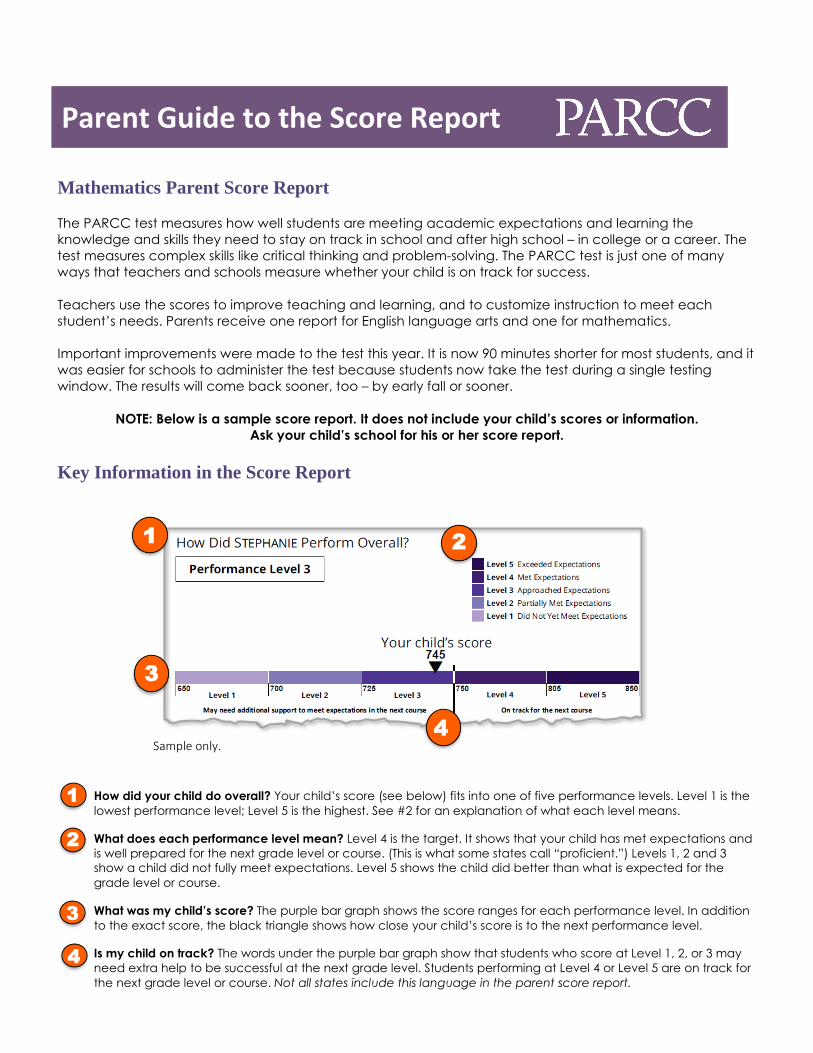
How did my child do in different areas of reading and writing? This section shows where your child is excelling and
where he/she needs extra support. Each area, such as vocabulary and writing expression, includes a description
of what it looks like to meet the expectations.
What do the arrows mean? The arrows give you a quick rundown on how your child is doing compared to students
who are meeting expectations. The legend explains that in words.
9
10
11
10
11
9
Parent Guide to the Score Report
4
How will my child’s school use the results?
The test results provide just one measure – a snapshot in time – of student achievement. Although schools
should never make important decisions about students based on one measure alone, the tests provide
families with objective information about whether their children are academically on track and they help
educators compare the performance of their students with others across the state, and even other states.
Schools and districts can use the report information to better plan instruction, support, and enrichment for
students. Teachers can use this information to personalize instruction to meet individual student needs.
Parents can use this information to understand their child’s needs and strengths and work with their teachers
and school to support their child at home.
How can I use my child’s score report?
It is important to have regular check-ins with teachers to help ensure your child is learning the skills necessary
to remain on track.
Ask your child’s teachers:
What do you see as my child’s academic strengths and areas for improvement?
How will you use these test results to help my child make progress this school year?
Ask your child’s principal or teacher for information on the school curriculum and the types of learning
experiences provided to students. You may also wish to ask about how local and state test results contribute
to school improvements.
Where can I find more resources?
▪ UnderstandTheScore.org – View sample test questions and learn more about how parents and teachers
can use the information from the score reports.
▪ Pta.org/parents – Learn more about grade level expectations and view the PTA’s parent guides for
student success.
▪ Bealearninghero.org – Tips on how to help your child succeed in school.
▪ Greatschools.org/gk/common-core-test-guide – Find out what skills your child should learn at each
grade level and how you can help at home.
Parent Guide to the Score Report
Mathematics Parent Score Report
The PARCC test measures how well students are meeting academic expectations and learning the
knowledge and skills they need to stay on track in school and after high school – in college or a career. The
test measures complex skills like critical thinking and problem-solving. The PARCC test is just one of many
ways that teachers and schools measure whether your child is on track for success.
Teachers use the scores to improve teaching and learning, and to customize instruction to meet each
student’s needs. Parents receive one report for English language arts and one for mathematics.
Important improvements were made to the test this year. It is now 90 minutes shorter for most students, and it
was easier for schools to administer the test because students now take the test during a single testing
window. The results will come back sooner, too – by early fall or sooner.
NOTE: Below is a sample score report. It does not include your child’s scores or information.
Ask your child’s school for his or her score report.
Key Information in the Score Report
Sample only.
How did your child do overall? Your child’s score (see below) fits into one of five performance levels. Level 1 is the
lowest performance level; Level 5 is the highest. See #2 for an explanation of what each level means.
What does each performance level mean? Level 4 is the target. It shows that your child has met expectations and
is well prepared for the next grade level or course. (This is what some states call “proficient.”) Levels 1, 2 and 3
show a child did not fully meet expectations. Level 5 shows the child did better than what is expected for the
grade level or course.
What was my child’s score? The purple bar graph shows the score ranges for each performance level. In addition
to the exact score, the black triangle shows how close your child’s score is to the next performance level.
Is my child on track? The words under the purple bar graph show that students who score at Level 1, 2, or 3 may
need extra help to be successful at the next grade level. Students performing at Level 4 or Level 5 are on track for
the next grade level or course. Not all states include this language in the parent score report.
Parent Guide to the Score Report
1
4
3
2
1
2
3
4

2
Sample only
How do I compare scores? Unlike many previous state test score reports, PARCC score reports show how your
student is performing compared to the average for students in the same grade or course in the school, district,
and state. Some states also include a comparison to students in all states that took the test, called the cross-state
average.
How did students in my state do? This shows the percentage of students at each performance level in your state.
This gives you a sense of how students are doing overall in your state, and how your child’s performance
compares.
Sample only
Is my child improving compared to last year? Student Growth Percentile (SGP) shows how your child’s
improvement from last year compares to other students’ improvement. In other words, compared to other
students who scored the same as your child did last year, how much did your child’s achievement improve? The
higher the SGP, the better your child did, compared to other students who scored the same as your child did last
year. An SGP of 50 percent or more means they improved more than most students who scored the same as they
did last year. An SGP of 49 percent or less means they did not improve as much as other students who scored the
same as they did last year. Not all states include the Student Growth Percentile in the parent score report.
How precise is my child’s score? Similar to public opinion polls, which have a “margin of error,” test scores are
accurate within a few points. If your child were to take the test on another day, his/her score might be slightly
higher or lower. This shows the likely variation in scores for your child. Check your child’s score report to see what
the probable range is. Not all states include the probable range in the parent score report.
5
6
7
8
5
6
7
8
9
Parent Guide to the Score Report
3
Side 2 of the Parent Score Report
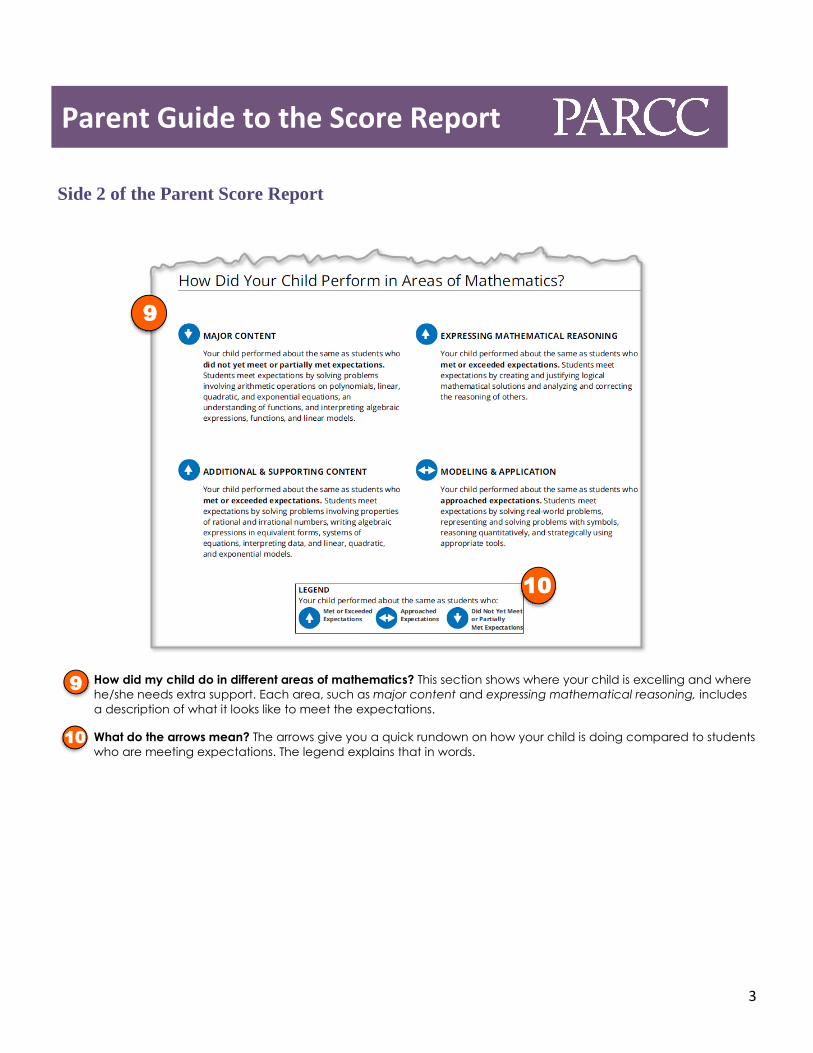
How did my child do in different areas of mathematics? This section shows where your child is excelling and where
he/she needs extra support. Each area, such as major content and expressing mathematical reasoning, includes
a description of what it looks like to meet the expectations.
What do the arrows mean? The arrows give you a quick rundown on how your child is doing compared to students
who are meeting expectations. The legend explains that in words.
9
10
10
9
Parent Guide to the Score Report

4
How will my child’s school use the results?
The test results provide just one measure – a snapshot in time – of student achievement. Although schools
should never make important decisions about students based on one measure alone, the tests provide
families with objective information about whether their children are academically on track and they help
educators compare the performance of their students with others across the state, and even other states.
Schools and districts can use the report information to better plan instruction, support, and enrichment for
students. Teachers can use this information to personalize instruction to meet individual student needs.
Parents can use this information to understand their child’s needs and strengths and work with their teachers
and school to support their child at home.
How can I use my child’s score report?
It is important to have regular check-ins with teachers to help ensure your child is learning the skills necessary
to remain on track.
Ask your child’s teachers:
What do you see as my child’s academic strengths and areas for improvement?
How will you use these test results to help my child make progress this school year?
Ask your child’s principal or teacher for information on the school curriculum and the types of learning
experiences provided to students. You may also wish to ask about how local and state test results contribute
to school improvements.
Where can I find more resources?
▪ UnderstandTheScore.org – View sample test questions and learn more about how parents and teachers
can use the information from the score reports.
▪ Pta.org/parents – Learn more about grade level expectations and view the PTA’s parent guides for
student success.
▪ Bealearninghero.org – Tips on how to help your child succeed in school.
▪ Greatschools.org/gk/common-core-test-guide – Find out what skills your child should learn at each
grade level and course and how you can help at home.
Parent Guide to the Score Report