Embed Size (px)
DESCRIPTION
seismic engineering
Citation preview
GEOPHYSICS, VOL. 64, NO. 3 (MAY-JUNE 1999); P. 800–808, 7 FIGS.
Multichannel analysis of surface waves
Choon B. Park∗, Richard D. Miller∗, and Jianghai Xia∗
ABSTRACTThe frequency-dependent properties of Rayleigh-type
surface waves can be utilized for imaging and character-izing the shallow subsurface. Most surface-wave analysisrelies on the accurate calculation of phase velocities forthe horizontally traveling fundamental-mode Rayleighwave acquired by stepping out a pair of receivers at inter-vals based on calculated ground roll wavelengths. Inter-ference by coherent source-generated noise inhibits thereliability of shear-wave velocities determined throughinversion of the whole wave field. Among these nonpla-nar, nonfundamental-mode Rayleigh waves (noise) arebody waves, scattered and nonsource-generated surfacewaves, and higher-mode surface waves. The degree towhich each of these types of noise contaminates the dis-persion curve and, ultimately, the inverted shear-wavevelocity profile is dependent on frequency as well as dis-tance from the source.
Multichannel recording permits effective identifica-tion and isolation of noise according to distinctive trace-to-trace coherency in arrival time and amplitude. Anadded advantage is the speed and redundancy of themeasurement process. Decomposition of a multichannelrecord into a time variable-frequency format, similar to
an uncorrelated Vibroseis record, permits analysis anddisplay of each frequency component in a unique andcontinuous format. Coherent noise contamination canthen be examined and its effects appraised in both fre-quency and offset space. Separation of frequency com-ponents permits real-time maximization of the S/N ratioduring acquisition and subsequent processing steps.
Linear separation of each ground roll frequency com-ponent allows calculation of phase velocities by simplymeasuring the linear slope of each frequency component.Breaks in coherent surface-wave arrivals, observable onthe decomposed record, can be compensated for dur-ing acquisition and processing. Multichannel recordingpermits single-measurement surveying of a broad depthrange, high levels of redundancy with a single field con-figuration, and the ability to adjust the offset, effectivelyreducing random or nonlinear noise introduced duringrecording.
A multichannel shot gather decomposed into a swept-frequency record allows the fast generation of an accu-rate dispersion curve. The accuracy of dispersion curvesdetermined using this method is proven through fieldcomparisons of the inverted shear-wave velocity (vs) pro-file with a downhole vs profile.
INTRODUCTION
In most surface seismic surveys when a compressional wavesource is used, more than two-thirds of total seismic energygenerated is imparted into Rayleigh waves (Richart et al.,1970), the principal component of ground roll. Assuming ver-tical velocity variation, each frequency component of a sur-face wave has a different propagation velocity (called phasevelocity, C f ) at each unique frequency ( f ) component. Thisunique characteristic results in a different wavelength (λ f )for each frequency propagated. This property is called dis-persion. Although ground roll is considered noise on body-
Presented at the 66th Annual Meeting, Society of Exploration Geophysicists. Manuscript received by the Editor August 15, 1997; revised manuscriptreceived November 23, 1998.∗Kansas Geological Survey, University of Kansas, 1930 Constant Avenue, Campus West, Lawrence, Kansas 66047-3726. E-mail: [email protected]; [email protected]; [email protected]© 1999 Society of Exploration Geophysicists. All rights reserved.
wave surveys (i.e., reflection or refraction profiling), its dis-persive properties can be utilized to infer near-surface elas-tic properties (Nazarian et al., 1983; Stokoe et al., 1994; Parket al., 1998a). Construction of a shear (S)-wave velocity (vs)profile through the analysis of plane-wave, fundamental-modeRayleigh waves is one of the most common ways to use the dis-persive properties of surface waves (Bullen, 1963). This type ofanalysis provides key parameters commonly used to evaluatenear-surface stiffness—a critical property for many geotechni-cal studies (Stokoe et al., 1994). As well, the near-surface vs
field can provide useful information about statics during body-wave data processing (Mari, 1984).
800
Multichannel Analysis of Surface Waves 801
In the early 1980s, a wave-propagation method to generatethe near-surface vs profile, called spectral analysis of surfacewaves (SASW), was introduced (Nazarian et al., 1983). SASWuses the spectral analysis of ground roll generated by an impul-sive source and recorded by a pair of receivers. This methodhas been widely and effectively used in many geotechnical en-gineering projects (Stokoe et al., 1994). The single pair of re-ceivers is configured and reconfigured (based on wavelengthcalculations made during acquisition) as many times as nec-essary to sample the desired frequency range. Data are ana-lyzed in the frequency domain to produce a dispersion curveby calculating the phase difference between each deploymentof receiver pairs. The inclusion of noise during SASW mea-surements occasionally can be controlled using a set of empir-ical criteria tailored for each site investigated (Gucunski andWoods, 1991; Stokoe et al., 1994). Optimizing these criteria ischallenging because of the degree of changes possible in near-surface materials. Besides the uniqueness of each site, inherentdifficulties exist when evaluating and distinguishing signal fromnoise with only a pair of receivers. The necessity of record-ing repeated shots into multiple field deployments for a givensite increases the time and labor requirements over a multi-channel procedure. Multichannel analysis of surface waves(MASW) tries to overcome the few weaknesses of the SASWmethod.
The entire process classically used to produce a vs profilethrough spectral analysis of surface waves involves three steps:acquisition of ground roll, construction of dispersion curve(a plot of phase velocity versus f ), and backcalculation (in-version) of the vs profile from the calculated dispersion curve.Broadband ground roll must be produced and recorded withminimal noise to accurately determine the vs profile. A vari-ety of techniques have been used to calculate dispersion curves(McMechan and Yedlin, 1981; Stokoe et al., 1994), each havingits own unique advantages and disadvantages. Backcalculationof the vs profile (inversion of the dispersion curve) is accom-plished iteratively, using the measured dispersion curve as areference for either forward modeling (Stokoe et al., 1994) ora least-squares approach (Nazarian, 1984). Values for Poisson’sratio and density are necessary to obtain a vs profile from a dis-persion curve and are usually estimated from local measure-ments or material types.
A variety of wave types are produced during the gener-ation of planar, fundamental-mode Rayleigh waves. Amongthese are body waves, nonplanar surface waves, backscatteredwaves, and ambient noise. Body waves can manifest them-selves on a shot record in a variety of ways. Refracted andreflected body waves result from interactions between bodywaves and acoustic impedance or velocity contrasts in the sub-surface, while direct body waves travel, as the name implies,directly from the source to a receiver. Also of consequence aresurface waves that have propagated only a short distance fromthe source. These waves usually behave in a complicated non-linear pattern and cannot be treated as plane waves (Stokoeet al., 1994). Backscattered surface waves can be prevalent onthe shot gather if horizontal discontinuities such as buildingfoundations, earth berms, or retaining walls exist nearby (Sheuet al., 1988). Relative amplitudes of each noise type generallychange with frequency and distance from the source (sourceoffset). Each noise type normally has distinct velocity and at-tenuation properties that can be identified on multichannel
records by the coherency pattern, arrival time, and amplitudeof each.
Decomposition of recorded wavefields into a swept-fre-quency format permits identification of most noise by fre-quency phase and source offset. Decomposition can thereforebe used in association with multichannel records to make ad-justments to minimize noise during acquisition. Selection ofdata-processing parameters such as the optimum frequencyrange for the phase-velocity calculation can be made more ac-curately from multichannel shot records. Once shot gathersare decomposed, a simple multichannel coherency measureapplied in the time (Yilmaz, 1987) or frequency domain (Parket al., 1998b) can be used to calculate phase velocity with afrequency. Phase velocity with frequency are the two variables(x, y) that make up the dispersion curve. It is also possibleto determine the accuracy of the calculated dispersion curveby analyzing the linear slope of each frequency component ofthe ground roll on a single shot gather. In this way, MASWallows the optimum recording and separation of broad band-width and high S/N ratio Rayleigh waves from other acousticenergy. A high S/N ratio ensures accuracy in the calculated dis-persion curve, while the broad bandwidth improves resolutionand possible depth of investigation of the inverted vs profile(Rix and Leipski, 1991).
GENERAL PROCEDURE
Ground roll is easily generated by either a swept source like avibrator or an impulsive source like a sledgehammer. Raw un-correlated data are optimum for multichannel analysis; there-fore, swept sources are preferred if they can be frequency andamplitude optimized for the target. Impulsive source data, onthe other hand, need to be decomposed into a swept-frequencyformat to expose phase velocity-frequency relationship of dis-persive ground roll. The basic field configuration and acquisi-tion routine for MASW is generally the same as that used inconventional common midpoint (CMP) body-wave reflectionsurveys. Some rules of thumb for MASW are inconsistent withreflection optimization. This commonality allows developmentof near-surface velocity field variations using MASW that canbe used for accurate statics corrections on reflection profiles.MASW can be effective with as few as twelve recording chan-nels connected to single low-frequency geophones (<10 Hz).
Near offset
Even with the dominance of ground roll on seismic data,optimal recording of ground roll requires field configura-tions and acquisition parameters favorable to recording pla-nar, fundamental-mode Rayleigh waves and unfavorable toall other types of acoustic waves. Because of undesirable near-field effects, Rayleigh waves can only be treated as horizontallytraveling plane waves after they have propagated a certain dis-tance (offset x1) from the source point (Richart et al., 1970).Plane-wave propagation of surface waves does not occur inmost cases until the near-offset (x1) is greater than half themaximum desired wavelength (λmax) (Stokoe et al., 1994):
x1 ≥ 0.5λmax. (1)
On a multichannel record displayed in a swept-frequency for-mat, near-field effects manifest themselves as a lack of linear
802 Park et al.
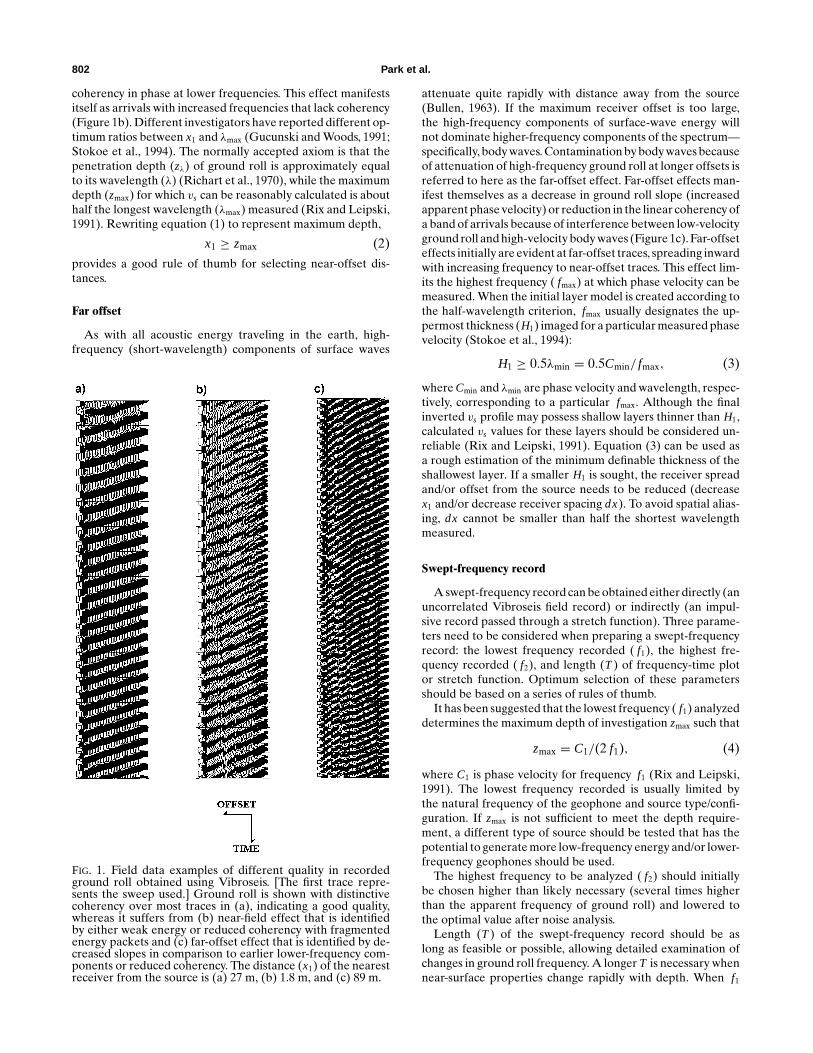
coherency in phase at lower frequencies. This effect manifestsitself as arrivals with increased frequencies that lack coherency(Figure 1b). Different investigators have reported different op-timum ratios between x1 and λmax (Gucunski and Woods, 1991;Stokoe et al., 1994). The normally accepted axiom is that thepenetration depth (zλ) of ground roll is approximately equalto its wavelength (λ) (Richart et al., 1970), while the maximumdepth (zmax) for which vs can be reasonably calculated is abouthalf the longest wavelength (λmax) measured (Rix and Leipski,1991). Rewriting equation (1) to represent maximum depth,
x1 ≥ zmax (2)
provides a good rule of thumb for selecting near-offset dis-tances.
Far offset
As with all acoustic energy traveling in the earth, high-frequency (short-wavelength) components of surface waves
FIG. 1. Field data examples of different quality in recordedground roll obtained using Vibroseis. [The first trace repre-sents the sweep used.] Ground roll is shown with distinctivecoherency over most traces in (a), indicating a good quality,whereas it suffers from (b) near-field effect that is identifiedby either weak energy or reduced coherency with fragmentedenergy packets and (c) far-offset effect that is identified by de-creased slopes in comparison to earlier lower-frequency com-ponents or reduced coherency. The distance (x1) of the nearestreceiver from the source is (a) 27 m, (b) 1.8 m, and (c) 89 m.
attenuate quite rapidly with distance away from the source(Bullen, 1963). If the maximum receiver offset is too large,the high-frequency components of surface-wave energy willnot dominate higher-frequency components of the spectrum—specifically, body waves. Contamination by body waves becauseof attenuation of high-frequency ground roll at longer offsets isreferred to here as the far-offset effect. Far-offset effects man-ifest themselves as a decrease in ground roll slope (increasedapparent phase velocity) or reduction in the linear coherency ofa band of arrivals because of interference between low-velocityground roll and high-velocity body waves (Figure 1c). Far-offseteffects initially are evident at far-offset traces, spreading inwardwith increasing frequency to near-offset traces. This effect lim-its the highest frequency ( fmax) at which phase velocity can bemeasured. When the initial layer model is created according tothe half-wavelength criterion, fmax usually designates the up-permost thickness (H1) imaged for a particular measured phasevelocity (Stokoe et al., 1994):
H1 ≥ 0.5λmin = 0.5Cmin/ fmax, (3)
where Cmin and λmin are phase velocity and wavelength, respec-tively, corresponding to a particular fmax. Although the finalinverted vs profile may possess shallow layers thinner than H1,calculated vs values for these layers should be considered un-reliable (Rix and Leipski, 1991). Equation (3) can be used asa rough estimation of the minimum definable thickness of theshallowest layer. If a smaller H1 is sought, the receiver spreadand/or offset from the source needs to be reduced (decreasex1 and/or decrease receiver spacing dx). To avoid spatial alias-ing, dx cannot be smaller than half the shortest wavelengthmeasured.
Swept-frequency record
A swept-frequency record can be obtained either directly (anuncorrelated Vibroseis field record) or indirectly (an impul-sive record passed through a stretch function). Three parame-ters need to be considered when preparing a swept-frequencyrecord: the lowest frequency recorded ( f1), the highest fre-quency recorded ( f2), and length (T) of frequency-time plotor stretch function. Optimum selection of these parametersshould be based on a series of rules of thumb.
It has been suggested that the lowest frequency ( f1) analyzeddetermines the maximum depth of investigation zmax such that
zmax = C1/(2 f1), (4)
where C1 is phase velocity for frequency f1 (Rix and Leipski,1991). The lowest frequency recorded is usually limited bythe natural frequency of the geophone and source type/confi-guration. If zmax is not sufficient to meet the depth require-ment, a different type of source should be tested that has thepotential to generate more low-frequency energy and/or lower-frequency geophones should be used.
The highest frequency to be analyzed ( f2) should initiallybe chosen higher than likely necessary (several times higherthan the apparent frequency of ground roll) and lowered tothe optimal value after noise analysis.
Length (T) of the swept-frequency record should be aslong as feasible or possible, allowing detailed examination ofchanges in ground roll frequency. A longer T is necessary whennear-surface properties change rapidly with depth. When f1
Multichannel Analysis of Surface Waves 803
and f2 are properly selected, a T of no more than 10 s is suffi-cient.
Stretch function
An impulsive record r (t) obtained by using a source suchas a sledgehammer or weight drop can be transformed intothe swept-frequency record rs(t) by convolution of r (t) with astretch function s(t) (Coruh, 1985):
rs(t) = r (t)∗s(t), (5)
where ∗ denotes the convolution operation. The stretch func-tion s(t) is a sinusoidal function with changing frequency asa function of time. A linear sweep similar to those commonlyused in Vibroseis surveys (Waters, 1978) is a good choice fors(t):
s(t) = sin(
2π f1t + π( f2 − f1)T
t2), (6)
where f1, f2, and T are lowest, highest, and length of s(t).These parameters can be optimized using the previously out-lined procedure.
Dispersion curve
Generation of a dispersion curve is one of the most criticalsteps for eventually generating an accurate shear-wave veloc-ity profile. Dispersion curves are generally displayed as phasevelocity versus frequency. This relationship can be establishedby calculating the phase velocity from the linear slope of eachcomponent of the swept-frequency record. The accuracy of adispersion curve can be enhanced by the analysis and removalof noise on ground roll data. With the excellent isolation poten-tial of each frequency component, a multichannel coherencymeasure (Yilmaz, 1987) can be applied to a ground roll seis-mogram. A frequency-domain approach (Park et al., 1998b) tocalculating the dispersion curve can also be used on impulsivedata.
Inversion
The vs profiles are calculated using an iterative inversionprocess that requires the dispersion data and estimations ofPoisson’s ratio and density. A least-squares approach allows au-tomation of the process (Xia et al., 1999). For the method usedhere, onlyvs is updated after each iteration, with Poisson’s ratio,density, and model thickness remaining unchanged throughoutthe inversion.
An initial earth model needs to be specified as a starting pointfor the iterative inversion process. The earth model consistsof velocity (P-wave and S-wave velocity), density, and thick-ness parameters. Among these four parameters, vs has themost significant effect on the reliable convergence of the al-gorithm. Several methods are reported to ensure the reliableand accurate convergence after calculating the initial vs profile(Heukelom and Foster, 1960; Vardoulakis and Vrettos, 1988).An initial vs profile should be defined such that vs at a depthzf is 1.09 times (Stokoe et al., 1994) the measured phase ve-locity C f at the frequency where wavelength λ f satisfies the
relationship
zf = aλ f , (7)
where a is a coefficient that only slightly changes with frequencyand is based on extensive modeling (Figure 5c). One inversionmethod (Xia et al., 1999) guarantees the process procedureconverges to a reliable result for a wide range of initial models.
FIELD TEST WITH SWEPT SOURCE
An IVI Minivib was used to generate swept surface-wave(ground roll) data at a test site near the Kansas GeologicalSurvey in Lawrence, Kansas. The main purpose of this field testwas to produce avs profile using the MASW procedure. The siteconsists of a thick (>50 m) layered shale sequence overlyinga repetitive section of Kansas cyclothems (Moore, 1964). Thesurface topography was relatively flat with only subtle relief,<1 m across the 100-m-long site. The weathered-zone thicknesswas known to be about 3 m.
Forty-one of the 48 channels available on a GeometricsStrataview seismograph were connected to a group of three10-Hz Geospace geophones with each group separated by 1 m.During the survey design, the thickness of the uppermost layerto be resolved was chosen to be about the same as the thick-ness (3 m) of the weathered zone. The minimum offset (x1) waschosen to be 1.8 m to allow observation of the near-field effect.A 10-s linear upsweep from 10 to 50 Hz was recorded with a1-ms sampling interval. A maximum depth of investigation waschosen not in advance but after noise analysis was assigned,so as to be consistent with the lowest measured frequency(10 Hz).
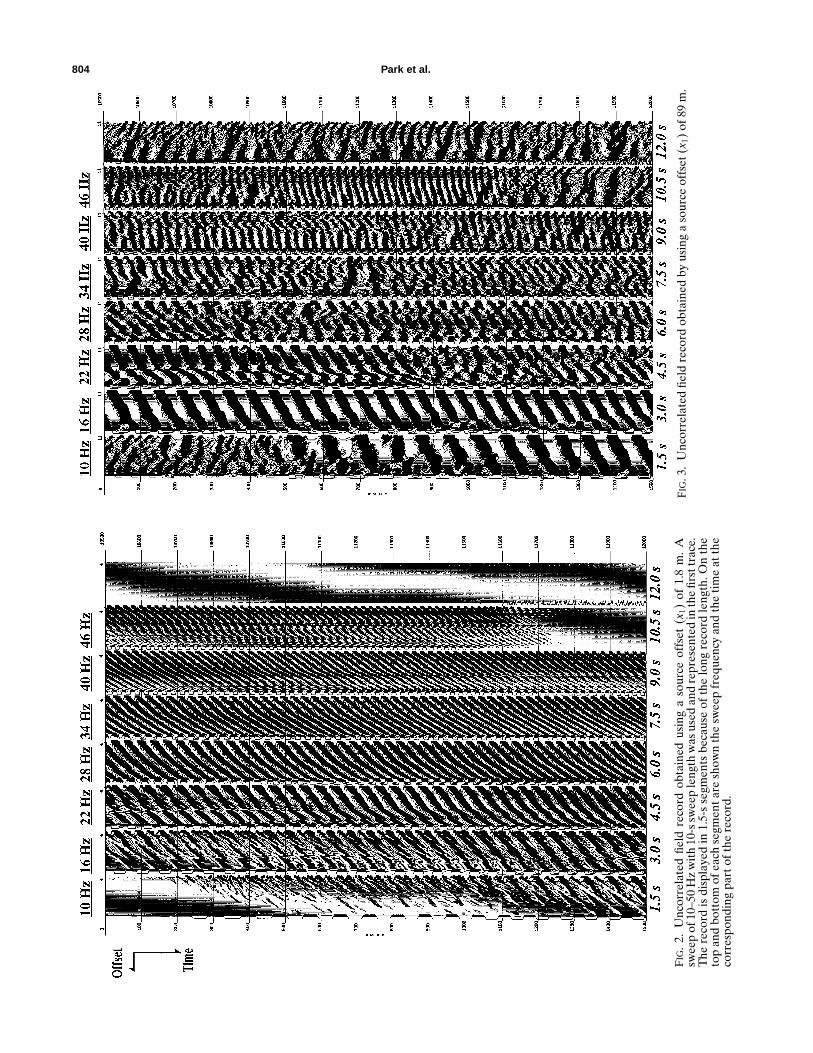
Shot gathers from our test site suffer from severe near-fieldeffects at low frequencies (<about 25 Hz), as indicated by thelack of ground roll coherency (Figure 2). The slightly curvednature of the coherent ground roll events is believed to be froma slight topographic high (<1 m) near the center of the lineor a laterally variable velocity structure. Far-offset effects arenoticeable at higher frequencies (>about 40 Hz) and longeroffsets. Subsequent processing suggests these effects do notadversely affect the accuracy of calculated phase velocities atthe higher frequencies. The lowest observed phase velocity wasabout 200 m/s at 50 Hz, equating to a minimum wavelengthof 4 m. Half this minimum wavelength is comparable to theexpected thickness of the uppermost layer, or the shallowestdepth of investigation for this data.
Subsequent noise analysis attempts were designed to esti-mate the highest recorded phase velocity without near-fieldeffect. A minimum offset x1 was chosen large (89 m) to en-hance these effects. Good coherency is observed (Figure 3)for frequencies from about 20 Hz down to near the naturalfrequency of the geophones (10 Hz). The reduced coherencyevident near 10 Hz (near 500 ms recording time) is not becauseof the near-field effect but is rather from the purposely tapereddrive force of the vibrator at the start of the sweep (necessarybecause of physical limitations of the vibrator) and ambientnoise. The highest phase velocity was about 800 m/s for fre-quencies very near 10 Hz. At later times, traces at this site suf-fer from high-amplitude body waves, backscatter from nearbybuildings, and surface waves from vehicle traffic. Based on theprevious two noise analyses, the approximate range of phasevelocities measurable at this site is estimated to be 200–800 m/s,
804 Park et al.
FIG
.2.
Unc
orre
late
dfie
ldre
cord
obta
ined
usin
ga
sour
ceof
fset
(x1)
of1.
8m
.A
swee
pof
10–5
0H
zw
ith
10-s
swee
ple
ngth
was
used
and
repr
esen
ted
inth
efir
sttr
ace.
The
reco
rdis
disp
laye
din
1.5-
sse
gmen
tsbe
caus
eof
the
long
reco
rdle
ngth
.On
the
top
and
bott
omof
each
segm
enta
resh
own
the
swee
pfr
eque
ncy
and
the
tim
eat
the
corr
espo
ndin
gpa
rtof
the
reco
rd.
FIG
.3.
Unc
orre
late
dfie
ldre
cord
obta
ined
byus
ing
aso
urce
offs
et(x
1)of
89m
.
Multichannel Analysis of Surface Waves 805
corresponding to a wavelength range of 4–80 m and resultingin a 40-m maximum depth (zmax) of investigation.
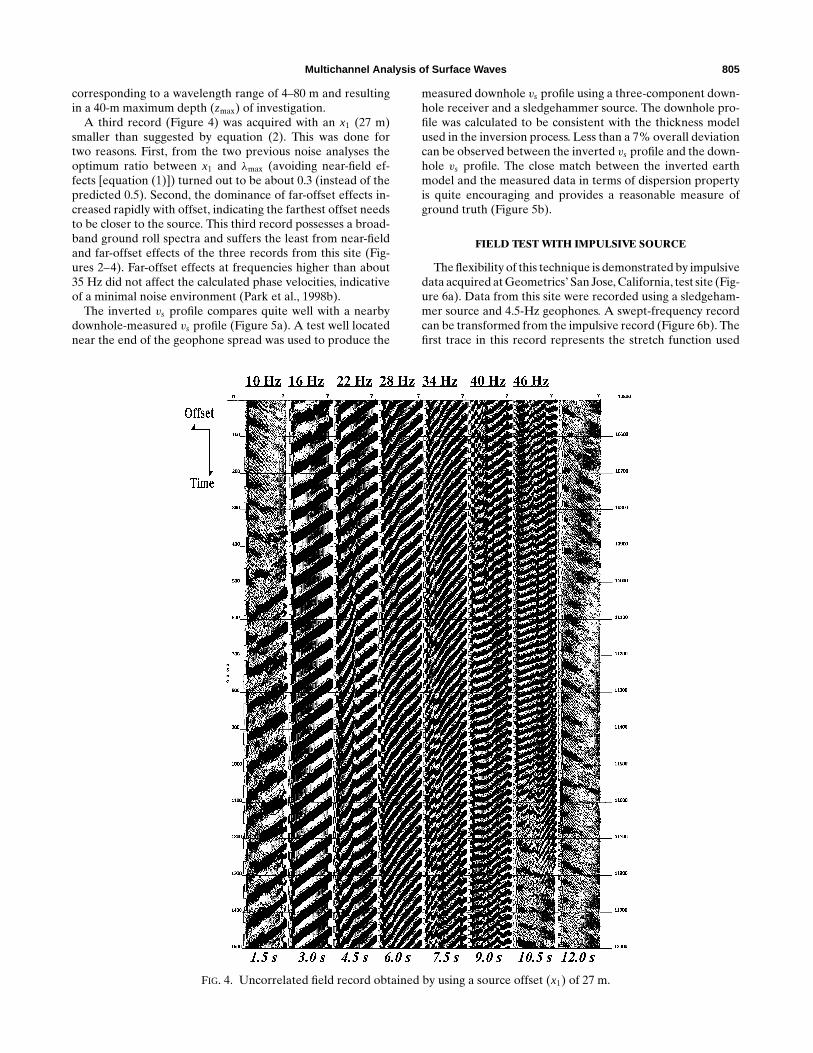
A third record (Figure 4) was acquired with an x1 (27 m)smaller than suggested by equation (2). This was done fortwo reasons. First, from the two previous noise analyses theoptimum ratio between x1 and λmax (avoiding near-field ef-fects [equation (1)]) turned out to be about 0.3 (instead of thepredicted 0.5). Second, the dominance of far-offset effects in-creased rapidly with offset, indicating the farthest offset needsto be closer to the source. This third record possesses a broad-band ground roll spectra and suffers the least from near-fieldand far-offset effects of the three records from this site (Fig-ures 2–4). Far-offset effects at frequencies higher than about35 Hz did not affect the calculated phase velocities, indicativeof a minimal noise environment (Park et al., 1998b).
The inverted vs profile compares quite well with a nearbydownhole-measured vs profile (Figure 5a). A test well locatednear the end of the geophone spread was used to produce the
FIG. 4. Uncorrelated field record obtained by using a source offset (x1) of 27 m.
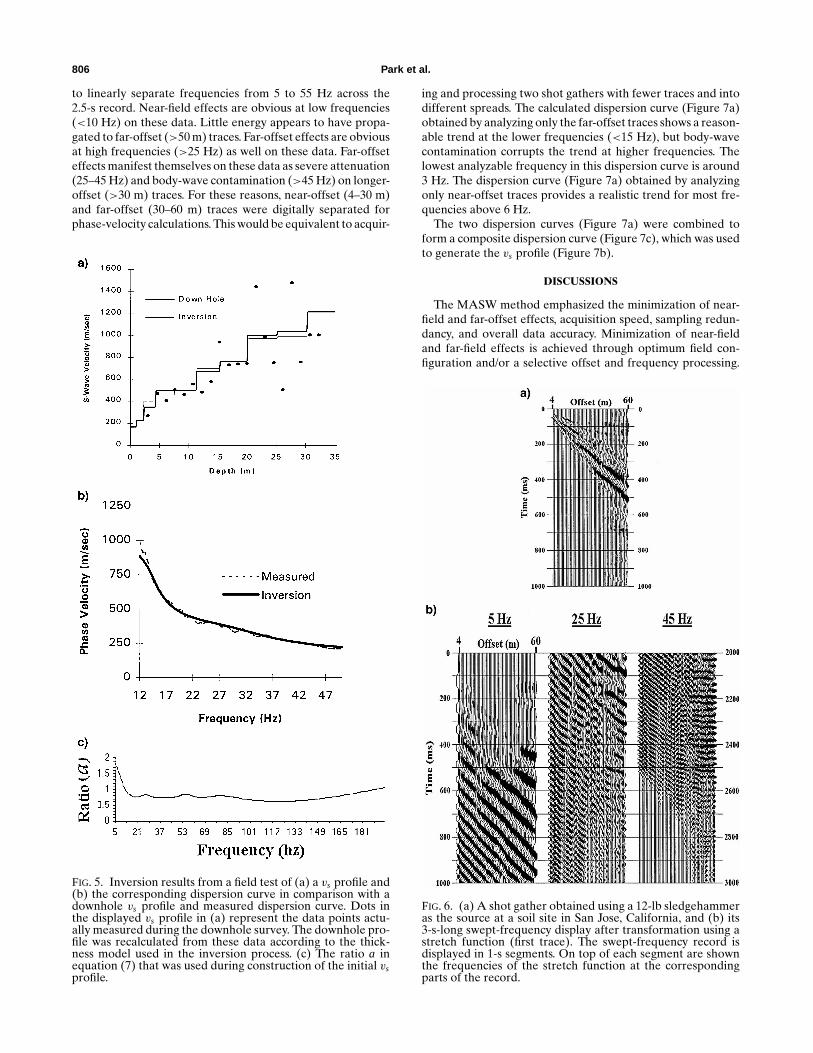
measured downhole vs profile using a three-component down-hole receiver and a sledgehammer source. The downhole pro-file was calculated to be consistent with the thickness modelused in the inversion process. Less than a 7% overall deviationcan be observed between the inverted vs profile and the down-hole vs profile. The close match between the inverted earthmodel and the measured data in terms of dispersion propertyis quite encouraging and provides a reasonable measure ofground truth (Figure 5b).
FIELD TEST WITH IMPULSIVE SOURCE
The flexibility of this technique is demonstrated by impulsivedata acquired at Geometrics’ San Jose, California, test site (Fig-ure 6a). Data from this site were recorded using a sledgeham-mer source and 4.5-Hz geophones. A swept-frequency recordcan be transformed from the impulsive record (Figure 6b). Thefirst trace in this record represents the stretch function used
806 Park et al.
to linearly separate frequencies from 5 to 55 Hz across the2.5-s record. Near-field effects are obvious at low frequencies(<10 Hz) on these data. Little energy appears to have propa-gated to far-offset (>50 m) traces. Far-offset effects are obviousat high frequencies (>25 Hz) as well on these data. Far-offseteffects manifest themselves on these data as severe attenuation(25–45 Hz) and body-wave contamination (>45 Hz) on longer-offset (>30 m) traces. For these reasons, near-offset (4–30 m)and far-offset (30–60 m) traces were digitally separated forphase-velocity calculations. This would be equivalent to acquir-
FIG. 5. Inversion results from a field test of (a) a vs profile and(b) the corresponding dispersion curve in comparison with adownhole vs profile and measured dispersion curve. Dots inthe displayed vs profile in (a) represent the data points actu-ally measured during the downhole survey. The downhole pro-file was recalculated from these data according to the thick-ness model used in the inversion process. (c) The ratio a inequation (7) that was used during construction of the initial vsprofile.
ing and processing two shot gathers with fewer traces and intodifferent spreads. The calculated dispersion curve (Figure 7a)obtained by analyzing only the far-offset traces shows a reason-able trend at the lower frequencies (<15 Hz), but body-wavecontamination corrupts the trend at higher frequencies. Thelowest analyzable frequency in this dispersion curve is around3 Hz. The dispersion curve (Figure 7a) obtained by analyzingonly near-offset traces provides a realistic trend for most fre-quencies above 6 Hz.
The two dispersion curves (Figure 7a) were combined toform a composite dispersion curve (Figure 7c), which was usedto generate the vs profile (Figure 7b).
DISCUSSIONS
The MASW method emphasized the minimization of near-field and far-offset effects, acquisition speed, sampling redun-dancy, and overall data accuracy. Minimization of near-fieldand far-field effects is achieved through optimum field con-figuration and/or a selective offset and frequency processing.
FIG. 6. (a) A shot gather obtained using a 12-lb sledgehammeras the source at a soil site in San Jose, California, and (b) its3-s-long swept-frequency display after transformation using astretch function (first trace). The swept-frequency record isdisplayed in 1-s segments. On top of each segment are shownthe frequencies of the stretch function at the correspondingparts of the record.

Multichannel Analysis of Surface Waves 807
FIG. 7. (a) Dispersion curves obtained by processing near-offset (4–30 m) traces and far-offset (30–60 m) traces of therecord in Figure 6a separately. (b) A vs profile obtained fromthe inversion of a composite dispersion curve created by in-tegrating the two curves. (c) The composite dispersion curvein comparison with the dispersion curve corresponding to theinverted vs profile in (b).
Sampling redundancy is obtained by the relatively large num-ber and tight spacing of all receivers. Accuracy of the MASWmethod was tested through ground truth comparisons withborehole measurements.
MASW assumes that the nature of near-surface materialscan be treated implicitly as a layered earth model with no lateral
variation in elastic properties. It is therefore important to keepthe entire spread as short as possible to maximize the validityof this assumption if lateral variations are suspected. From anempirical perspective, this assumption is valid as long as goodlinear coherency is observed on decomposed or swept shotrecords.
We do not see any appreciable difference in the overall effec-tiveness, whether using a swept source or an impulsive source.Considering the relative importance of lower frequencies fordeeper penetration, a heavy impulsive source seems to be aneffective and economic choice. Because of this dependence ondepth of penetration in the lower frequencies, we recommendalways using high-output, low-frequency geophones with norecording filters. As far as the stretch function or Vibroseissweep is concerned, we see no difference in the resulting vs
profile between up or down sweeps.A frequency-continuous approach makes the swept-fre-
quency display more useful when analyzing the interaction be-tween several different types of seismic events, as comparedwith conventional filter panels. The optimum offset and low-est usable frequency outside the ground roll can be establishedmore effectively using a swept-frequency display than from theimpulsive record alone. This makes decomposition of frequen-cies a potentially useful tool for compressional surveys as well.
An indication of the overall speed of the MASW process isrevealed by the production of a ten-layer vs profile in less than5 minutes on a 100-MHz Pentium-based PC from a 48-channel,12-s-long swept-frequency record.
CONCLUSIONS
When ground roll is acquired using a multichannel record-ing method and displayed in a swept-frequency format, differ-ent frequency components of Rayleigh waves can be identifiedby distinctive and simple coherency. This leads to a seismicsurface-wave method that provides a useful noninvasive tool,where information about elastic properties of near-surface ma-terials can be effectively obtained for two reasons:
1) The integrity of each single Rayleigh wave frequency canbe readily examined for contamination by coherent noise,making adjustments possible to improve S/N ratio duringdata acquisition and processing steps, and
2) A highly accurate dispersion curve can be obtained andinverted to produce a vs profile with high confidence andconsistency using ground roll recorded on a single shotgather.
ACKNOWLEDGMENTS
We thank Joe Anderson, David Laflen, and Brett Bennettfor their commitment during the field tests. A special thanks toLee Gerhard, director of the Kansas Geological Survey (KGS),and Kathy Sheldon, chief of operations at KGS, for giving per-mission to acquire vibroseis data at the KGS test site. Finally,we thank Mary Brohammer for her help in the preparation ofthis manuscript.
REFERENCES
Bullen, K. E., 1963, An introduction to the theory of seismology: Cam-bridge Univ. Press.
Coruh, C., 1985, Stretched automatic amplitude adjustment of seismicdata: Geophysics, 50, 252–256.
808 Park et al.
Gucunski, N., and Woods, R. D., 1991, Instrumentation for SASW test-ing, in Bhatia, S. K., and Blaney, G. W., Eds., Recent advances ininstrumentation, data acquisition and testing in soil dynamics: Am.Soc. Civil Eng., 1–16.
Heukelom, W., and Foster, C. R., 1960, Dynamic testing of pavements:J. Soil Mechanics and Foundations Div., 86, no. SM1, 1–28.
Mari, J. L., 1984, Estimation of static corrections for shear-wave pro-filing using the dispersion properties of Love waves: Geophysics, 49,1169–1179.
McMechan, G. A., and Yedlin, M. J., 1981, Analysis of dispersive wavesby wave field transformation: Geophysics, 46, 869–874.
Moore, R. C., 1964, Paleoecological aspects of Kansas Pennsylvanianand Permian Cyclothems: Kansas Geol. Bull., 169, no. 1, 287–380.
Nazarian, S., 1984, In situ determination of elastic moduli of soil de-posits and pavement systems by spectral-analysis-of-surface-wavesmethod: Ph.D. dissertation, Univ. of Texas, Austin.
Nazarian, S., Stokoe, K. H., II, and Hudson, W. R., 1983, Use of spectralanalysis of surface waves method for determination of moduli andthicknesses of pavement systems: Transport. Res. Record, 930, 38–45.
Park, C. B., Xia, J., and Miller, R. D., 1998a, Ground roll as a tool toimage near-surface anomaly: 68th Ann. Internat. Mtg., Soc. Expl.Geophys., Expanded Abstracts, 874–877.
——— 1998b, Imaging dispersion curves of surface waves on multi-channel record: 68th Ann. Internat. Mtg., Soc. Expl. Geophys., Ex-panded Abstracts, 1377–1380.
Richart, F. E., Hall, J. R., and Woods, R. D., 1970, Vibrations of soilsand foundations: Prentice-Hall, Inc.
Rix, G. J., and Leipski, E. A., 1991, Accuracy and resolution of surfacewave inversion, in Bhatia, S. K., and Blaney, G. W., Eds., Recentadvances in instrumentation, data acquisition and testing in soil dy-namics: Am. Soc. Civil Eng., 17–32.
Sheu, J. C., Stokoe, K. H., II, and Roesset, J. M., 1988, Effect of reflectedwaves in SASW testing of pavements: Transportation Res. Record,1196, 51–61.
Stokoe, K. H., II, Wright, G. W., James, A. B., and Jose, M. R., 1994,Characterization of geotechnical sites by SASW method, in Woods,R. D., Ed., Geophysical characterization of sites: Oxford Publ.
Vardoulakis, I., and Vrettos, C., 1988, dispersion law of Rayleigh-typewaves in a compressible Gibson half space: Internat. J. Numericaland Analytical Methods in Geomechanics, 12, 639–655.
Waters, K. H., 1978, Reflection seismology: John Wiley & Sons, Inc.Xia, J., Miller, R. D., and Park, C. B., 1999, Estimation of near-surface
shear-wave velocity by inversion of Rayleigh wave: Geophysics, 64,691–700, this issue.
Yilmaz, O., 1987, Seismic data processing: Soc. of Expl. Geophys.