Embed Size (px)
Citation preview
439
Part 8
Community Services
Introduction
The Community Services portfolio works with communities to support people with disabilities, vulnerable families, children and young people at risk and seniors. The portfolio particularly focuses on breaking disadvantage to improve lives and cultivating vibrant, inclusive communities through sport, culture and arts industries.
The portfolio is contributing to the achievement of the following Our Priorities and associated targets:
• A Bright Future
− improving the health and wellbeing of children in the early years;
• A Safer Community
− reducing youth reoffending;
− reducing illicit drug use;
• A Liveable Environment
− building METRONET and increasing housing opportunities nearby;
• Aboriginal Wellbeing
− reducing the over-representation of Aboriginal people in custody; and
• Sustainable Health Review.
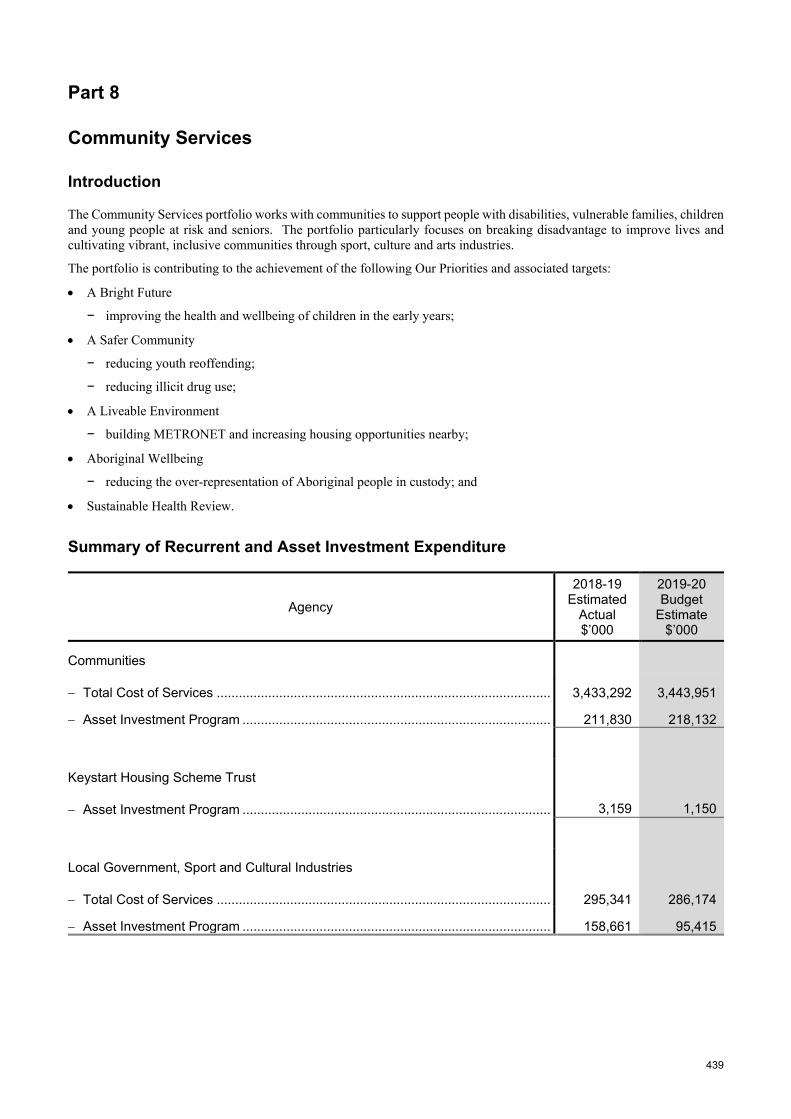
Summary of Recurrent and Asset Investment Expenditure
Agency
2018-19 Estimated
Actual $’000
2019-20 Budget
Estimate $’000
Communities
− Total Cost of Services ........................................................................................... 3,433,292 3,443,951
− Asset Investment Program .................................................................................... 211,830 218,132
Keystart Housing Scheme Trust
− Asset Investment Program .................................................................................... 3,159 1,150
Local Government, Sport and Cultural Industries
− Total Cost of Services ........................................................................................... 295,341 286,174
− Asset Investment Program .................................................................................... 158,661 95,415
440
Agency
2018-19 Estimated
Actual $’000
2019-20 Budget
Estimate $’000
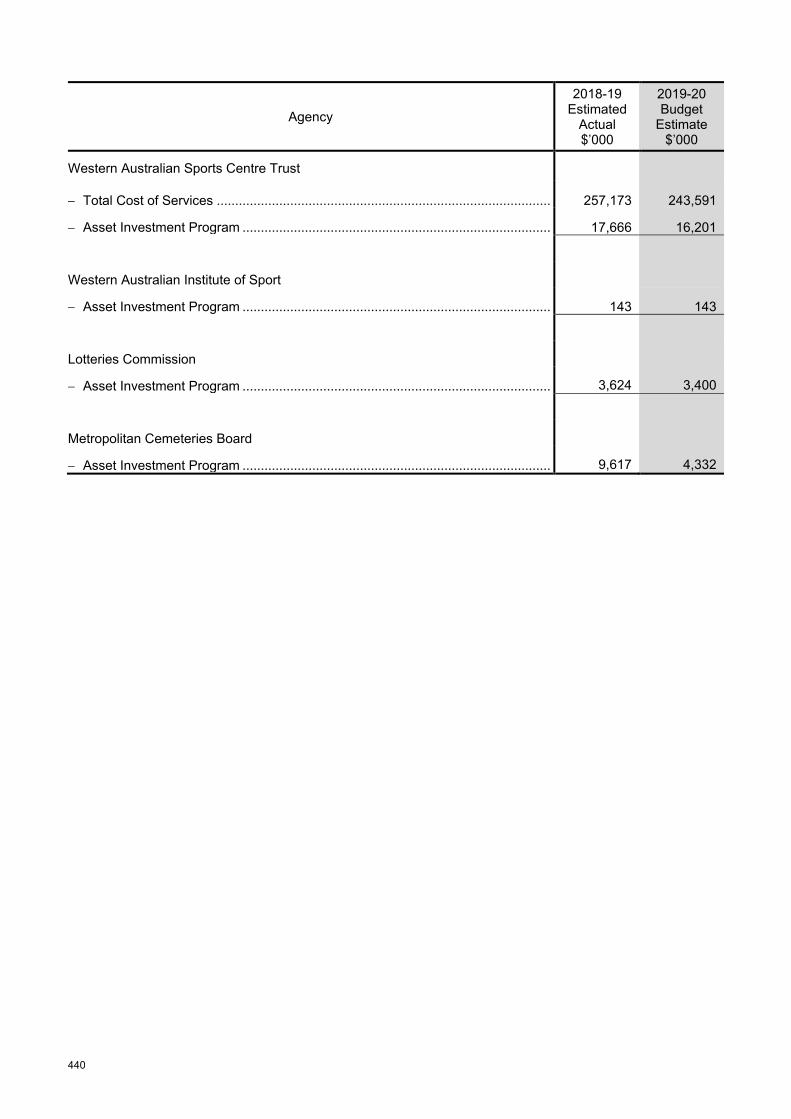
Western Australian Sports Centre Trust
− Total Cost of Services ........................................................................................... 257,173 243,591
− Asset Investment Program .................................................................................... 17,666 16,201
Western Australian Institute of Sport
− Asset Investment Program .................................................................................... 143 143
Lotteries Commission
− Asset Investment Program .................................................................................... 3,624 3,400
Metropolitan Cemeteries Board
− Asset Investment Program .................................................................................... 9,617 4,332
441
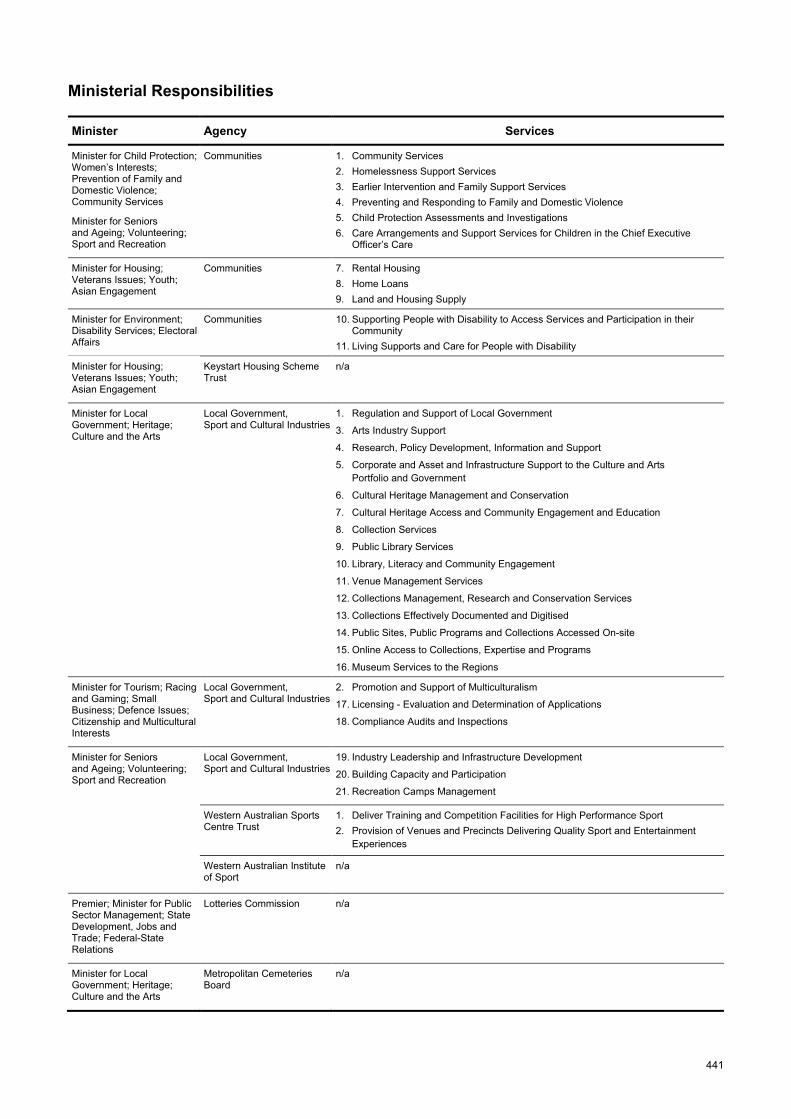
Ministerial Responsibilities
Minister Agency Services
Minister for Child Protection; Women’s Interests; Prevention of Family and Domestic Violence; Community Services
Minister for Seniors and Ageing; Volunteering; Sport and Recreation
Communities 1. Community Services 2. Homelessness Support Services 3. Earlier Intervention and Family Support Services 4. Preventing and Responding to Family and Domestic Violence 5. Child Protection Assessments and Investigations 6. Care Arrangements and Support Services for Children in the Chief Executive
Officer’s Care
Minister for Housing; Veterans Issues; Youth; Asian Engagement
Communities 7. Rental Housing 8. Home Loans 9. Land and Housing Supply
Minister for Environment; Disability Services; Electoral Affairs
Communities 10. Supporting People with Disability to Access Services and Participation in their Community
11. Living Supports and Care for People with Disability
Minister for Housing; Veterans Issues; Youth; Asian Engagement
Keystart Housing Scheme Trust
n/a
Minister for Local Government; Heritage; Culture and the Arts
Local Government, Sport and Cultural Industries
1. Regulation and Support of Local Government
3. Arts Industry Support
4. Research, Policy Development, Information and Support
5. Corporate and Asset and Infrastructure Support to the Culture and Arts Portfolio and Government
6. Cultural Heritage Management and Conservation
7. Cultural Heritage Access and Community Engagement and Education
8. Collection Services
9. Public Library Services
10. Library, Literacy and Community Engagement
11. Venue Management Services
12. Collections Management, Research and Conservation Services
13. Collections Effectively Documented and Digitised
14. Public Sites, Public Programs and Collections Accessed On-site
15. Online Access to Collections, Expertise and Programs
16. Museum Services to the Regions
Minister for Tourism; Racing and Gaming; Small Business; Defence Issues; Citizenship and Multicultural Interests
Local Government, Sport and Cultural Industries
2. Promotion and Support of Multiculturalism
17. Licensing - Evaluation and Determination of Applications
18. Compliance Audits and Inspections
Minister for Seniors and Ageing; Volunteering; Sport and Recreation
Local Government, Sport and Cultural Industries
19. Industry Leadership and Infrastructure Development
20. Building Capacity and Participation
21. Recreation Camps Management
Western Australian Sports Centre Trust
1. Deliver Training and Competition Facilities for High Performance Sport 2. Provision of Venues and Precincts Delivering Quality Sport and Entertainment
Experiences
Western Australian Institute of Sport
n/a
Premier; Minister for Public Sector Management; State Development, Jobs and Trade; Federal-State Relations
Lotteries Commission n/a
Minister for Local Government; Heritage; Culture and the Arts
Metropolitan Cemeteries Board
n/a

443
Division 33 Communities
Part 8 Community Services
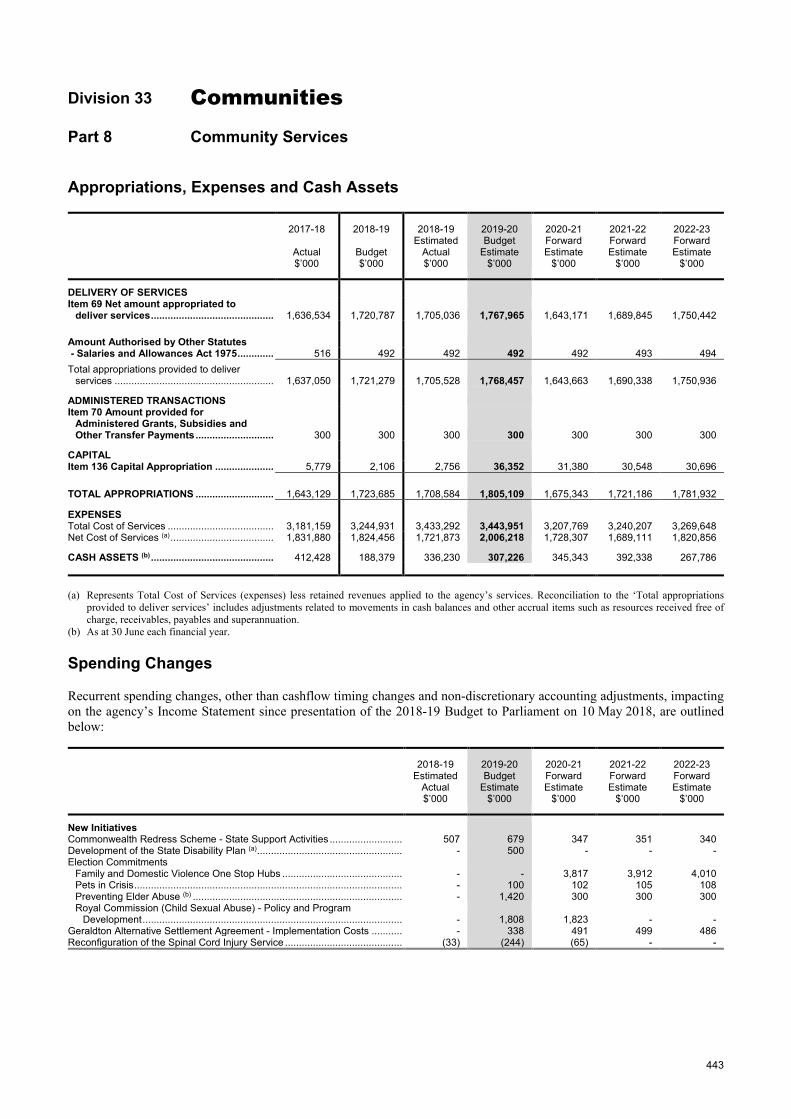
Appropriations, Expenses and Cash Assets
2017-18
Actual $’000
2018-19
Budget $’000
2018-19 Estimated
Actual $’000
2019-20 Budget
Estimate $’000
2020-21 Forward Estimate
$’000
2021-22 Forward Estimate
$’000
2022-23 Forward Estimate
$’000
DELIVERY OF SERVICES Item 69 Net amount appropriated to
deliver services ............................................ 1,636,534 1,720,787 1,705,036 1,767,965 1,643,171 1,689,845 1,750,442
Amount Authorised by Other Statutes - Salaries and Allowances Act 1975 ............. 516 492 492 492 492 493 494 Total appropriations provided to deliver
services ......................................................... 1,637,050 1,721,279 1,705,528 1,768,457 1,643,663 1,690,338 1,750,936
ADMINISTERED TRANSACTIONS Item 70 Amount provided for
Administered Grants, Subsidies and Other Transfer Payments ............................ 300 300 300 300 300 300 300
CAPITAL Item 136 Capital Appropriation ..................... 5,779 2,106 2,756 36,352 31,380 30,548 30,696
TOTAL APPROPRIATIONS ............................ 1,643,129 1,723,685 1,708,584 1,805,109 1,675,343 1,721,186 1,781,932
EXPENSES Total Cost of Services ...................................... 3,181,159 3,244,931 3,433,292 3,443,951 3,207,769 3,240,207 3,269,648 Net Cost of Services (a) ..................................... 1,831,880 1,824,456 1,721,873 2,006,218 1,728,307 1,689,111 1,820,856
CASH ASSETS (b) ............................................ 412,428 188,379 336,230 307,226 345,343 392,338 267,786 (a) Represents Total Cost of Services (expenses) less retained revenues applied to the agency’s services. Reconciliation to the ‘Total appropriations
provided to deliver services’ includes adjustments related to movements in cash balances and other accrual items such as resources received free of charge, receivables, payables and superannuation.
(b) As at 30 June each financial year.
Spending Changes
Recurrent spending changes, other than cashflow timing changes and non-discretionary accounting adjustments, impacting on the agency’s Income Statement since presentation of the 2018-19 Budget to Parliament on 10 May 2018, are outlined below:
2018-19 Estimated
Actual $’000
2019-20 Budget
Estimate $’000
2020-21 Forward Estimate
$’000
2021-22 Forward Estimate
$’000
2022-23 Forward Estimate
$’000
New Initiatives Commonwealth Redress Scheme - State Support Activities ........................... 507 679 347 351 340 Development of the State Disability Plan (a) ..................................................... - 500 - - - Election Commitments
Family and Domestic Violence One Stop Hubs ............................................ - - 3,817 3,912 4,010 Pets in Crisis ................................................................................................. - 100 102 105 108 Preventing Elder Abuse (b) ............................................................................ - 1,420 300 300 300 Royal Commission (Child Sexual Abuse) - Policy and Program
Development .............................................................................................. - 1,808 1,823 - - Geraldton Alternative Settlement Agreement - Implementation Costs ............ - 338 491 499 486 Reconfiguration of the Spinal Cord Injury Service ........................................... (33) (244) (65) - -
Communities - continued
444
2018-19 Estimated
Actual $’000
2019-20 Budget
Estimate $’000
2020-21 Forward Estimate
$’000
2021-22 Forward Estimate
$’000
2022-23 Forward Estimate
$’000
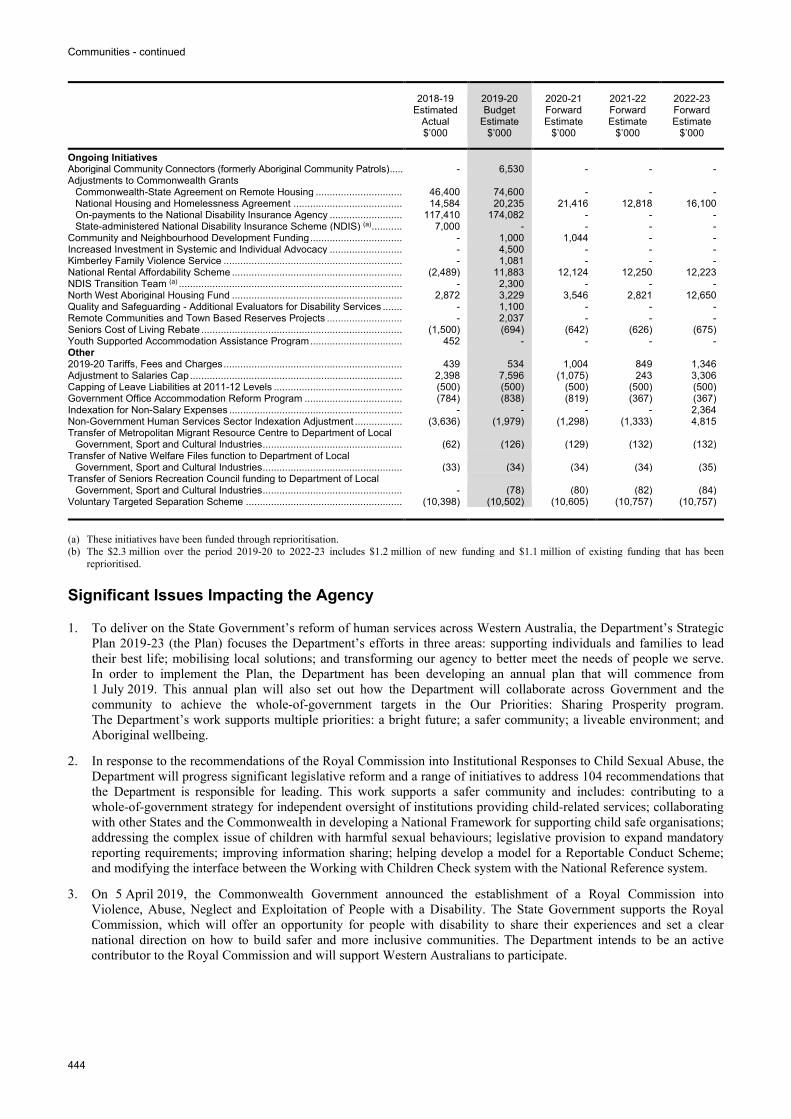
Ongoing Initiatives Aboriginal Community Connectors (formerly Aboriginal Community Patrols) ..... - 6,530 - - - Adjustments to Commonwealth Grants
Commonwealth-State Agreement on Remote Housing ................................ 46,400 74,600 - - - National Housing and Homelessness Agreement ........................................ 14,584 20,235 21,416 12,818 16,100 On-payments to the National Disability Insurance Agency ........................... 117,410 174,082 - - - State-administered National Disability Insurance Scheme (NDIS) (a) ............ 7,000 - - - -
Community and Neighbourhood Development Funding .................................. - 1,000 1,044 - - Increased Investment in Systemic and Individual Advocacy ........................... - 4,500 - - - Kimberley Family Violence Service ................................................................. - 1,081 - - - National Rental Affordability Scheme .............................................................. (2,489) 11,883 12,124 12,250 12,223 NDIS Transition Team (a) ................................................................................. - 2,300 - - - North West Aboriginal Housing Fund .............................................................. 2,872 3,229 3,546 2,821 12,650 Quality and Safeguarding - Additional Evaluators for Disability Services ........ - 1,100 - - - Remote Communities and Town Based Reserves Projects ............................ - 2,037 - - - Seniors Cost of Living Rebate ......................................................................... (1,500) (694) (642) (626) (675) Youth Supported Accommodation Assistance Program .................................. 452 - - - - Other 2019-20 Tariffs, Fees and Charges ................................................................. 439 534 1,004 849 1,346 Adjustment to Salaries Cap ............................................................................. 2,398 7,596 (1,075) 243 3,306 Capping of Leave Liabilities at 2011-12 Levels ............................................... (500) (500) (500) (500) (500) Government Office Accommodation Reform Program .................................... (784) (838) (819) (367) (367) Indexation for Non-Salary Expenses ............................................................... - - - - 2,364 Non-Government Human Services Sector Indexation Adjustment .................. (3,636) (1,979) (1,298) (1,333) 4,815 Transfer of Metropolitan Migrant Resource Centre to Department of Local
Government, Sport and Cultural Industries ................................................... (62) (126) (129) (132) (132) Transfer of Native Welfare Files function to Department of Local
Government, Sport and Cultural Industries ................................................... (33) (34) (34) (34) (35) Transfer of Seniors Recreation Council funding to Department of Local
Government, Sport and Cultural Industries ................................................... - (78) (80) (82) (84) Voluntary Targeted Separation Scheme ......................................................... (10,398) (10,502) (10,605) (10,757) (10,757) (a) These initiatives have been funded through reprioritisation. (b) The $2.3 million over the period 2019-20 to 2022-23 includes $1.2 million of new funding and $1.1 million of existing funding that has been
reprioritised.
Significant Issues Impacting the Agency
1. To deliver on the State Government’s reform of human services across Western Australia, the Department’s Strategic Plan 2019-23 (the Plan) focuses the Department’s efforts in three areas: supporting individuals and families to lead their best life; mobilising local solutions; and transforming our agency to better meet the needs of people we serve. In order to implement the Plan, the Department has been developing an annual plan that will commence from 1 July 2019. This annual plan will also set out how the Department will collaborate across Government and the community to achieve the whole-of-government targets in the Our Priorities: Sharing Prosperity program. The Department’s work supports multiple priorities: a bright future; a safer community; a liveable environment; and Aboriginal wellbeing.
2. In response to the recommendations of the Royal Commission into Institutional Responses to Child Sexual Abuse, the Department will progress significant legislative reform and a range of initiatives to address 104 recommendations that the Department is responsible for leading. This work supports a safer community and includes: contributing to a whole-of-government strategy for independent oversight of institutions providing child-related services; collaborating with other States and the Commonwealth in developing a National Framework for supporting child safe organisations; addressing the complex issue of children with harmful sexual behaviours; legislative provision to expand mandatory reporting requirements; improving information sharing; helping develop a model for a Reportable Conduct Scheme; and modifying the interface between the Working with Children Check system with the National Reference system.
3. On 5 April 2019, the Commonwealth Government announced the establishment of a Royal Commission into Violence, Abuse, Neglect and Exploitation of People with a Disability. The State Government supports the Royal Commission, which will offer an opportunity for people with disability to share their experiences and set a clear national direction on how to build safer and more inclusive communities. The Department intends to be an active contributor to the Royal Commission and will support Western Australians to participate.
Communities - continued
445
4. Since the State Government entered into a bilateral agreement in December 2017 with the Commonwealth Government for the National Disability Insurance Agency (NDIA) to deliver the National Disability Insurance Scheme (NDIS) in Western Australia, both Governments have acknowledged the challenge currently experienced in the transition of State clients into the NDIS. The transfer of State clients progressed slower than anticipated in the first six months of the agreement; however, it has since accelerated due to collaborative work between the Department and State and Commonwealth agencies.
4.1. While the transition progresses, the Government will continue the second tranche of the $20.3 million Sector Transition Fund by providing $8.5 million in 2019-20 to safeguard the sustainability of the disability sector in Western Australia and provide funding to the Department to maintain support for individuals who have experienced delayed entry into the NDIS. This includes additional investment in advocacy services to ensure that people with disability, their families and carers are supported during the transition. Further to this, the Government has committed to developing the State Disability Plan (the Plan), which is a 10 year plan to build an inclusive community that supports and empowers people with disability. The Plan will be for all Western Australians who want to live in an inclusive community.
5. As at 28 February 2019, 5,317 children were in out-of-home care, 55% of whom are Aboriginal children. In response to the increasing rate of children entering out-of-home care, the Department continues to implement the Building a Better Future: Out-of-Home Care Reform which will deliver an out-of-home care system that is: focused on the needs of the child; a coordinated and flexible service system; a safe system held to high quality standards; and a legislative framework supporting best child outcomes. In recognition of the increasing rate of children entering out-of-home care, the Department is also focused on providing earlier and more intensive engagements and intervention as part of the Building Safe and Strong Families: Earlier Intervention and Family Support Strategy.
6. It is estimated that between 2% and 10% of older Western Australians - between 9,800 and 49,000 people - may experience some form of elder abuse. In response, the Government has endorsed the State joining the National Plan to Respond to the Abuse of Older Australians 2019-2023 (the National Plan). The Government has committed to spending $2.3 million to deliver a safer community and commence a number of initiatives that support the National Plan and progress delivery of the Government’s election commitments to respond to elder abuse. The Department will develop community education and awareness campaigns; fund advocacy and legal services and the State-wide Elder Abuse Helpline; and initiate a range of inclusion, participation and education activities.
7. The Commonwealth Government has provided the State Government with $121 million, which will assist with delivering some critical services and investment for remote communities in 2018-19 and 2019-20. The absence of Commonwealth funding beyond this period presents a substantial financial shortfall that will undermine the State’s capacity to continue to deliver services and provide critical investment in remote communities. To support the Government’s commitment to remote communities and regional prosperity, the Department will work closely with key service and central government agencies to develop service options for ongoing infrastructure and essential service delivery in remote communities. The Department will also pursue further integration of services and functions for remote communities through ongoing implementation of Machinery of Government changes.
8. The North West Aboriginal Housing Fund (NWAHF) has been established to invest in initiatives that increase housing options, increase opportunities for educational attainment and job stability, and empower Aboriginal people and communities. The NWAHF directly supports improvements to Aboriginal wellbeing. In partnership with Aboriginal people and organisations, the Department is currently building 50 homes in Kununurra, Halls Creek and Wyndham that are aligned with improved Aboriginal employment outcomes. A further 40 existing houses in South Hedland are being refurbished and repurposed as transitional housing for Aboriginal families. An expression of interest process has commenced to identify the next tranche of community-led NWAHF initiatives.
9. Target 120, a Government election commitment, is a new approach and early intervention strategy for young people identified most at risk of entering the formal justice system and becoming repeat offenders. It aims to increase community safety by providing young people and their families with intensive, coordinated and timely access to the services required to make positive changes. In partnership with community, government and non-government agencies, the program will be rolled out across 11 metropolitan and regional locations over a four year period. Five locations commenced service delivery in 2018-19 and a further three are scheduled for implementation in 2019-20. Target 120 is an initiative that contributes to the Government’s priority area of a safer community under the Our Priorities: Sharing Prosperity Program.
Communities - continued
446
10. One in five children aged four years and under in Western Australia is considered developmentally vulnerable, as measured by the Australian Early Development Census. The Early Years Initiative (the Initiative) announced on 3 March 2018 is a commitment to working collaboratively and innovatively with our partners in the community to improve the development, health and learning of children from conception to four years and create lasting change. It is a 10 year partnership that brings together community leaders, government, researchers, business and philanthropic organisations to empower communities to support and assess the needs of children and families, so they have the opportunity and confidence to flourish. In December 2018, the Central Great Southern Shires of Katanning, Broomehill-Tambellup, Kojonup and Gnowangerup were selected to be the first partner communities to join the Initiative. The remaining partner communities are expected to be announced in 2019. The Initiative is a demonstration of how the State Government will partner with others to achieve the early childhood health and wellbeing target under the Our Priorities: Sharing Prosperity Program.
11. The State is committed to addressing housing affordability, creating inclusive communities and driving economic growth. The Department is working across Government and partnering with the private sector and non-government organisations to deliver the $394 million METRONET Social and Affordable Housing and Jobs Package (the Package). The new dwellings within the Package are aligned to the delivery of METRONET. The Department has engaged partners and identified projects to deliver the Package and has already achieved major milestones, including the appointment of a development partner for Pier Street Perth. This work will help the Government to meet its Our Priorities targets for a strong economy and a liveable environment.
12. The Department continues to support regional Western Australia, including through the ongoing implementation of Machinery of Government changes that will see regional executive directors appointed in each region of the State. These structural changes will be supported by work under the Strategic Plan to ensure that the regional executive directors can make decisions and deliver supports that make sense for that region, in partnership with local leaders and organisations, other agencies and tiers of government, and service providers.
13. In September 2017, the Government announced the commencement of construction on the Fremantle Kings Square Renewal project and relocation of 1,500 public sector employees from the Perth CBD to the newly constructed premises. The Department will relocate its head office to the purpose-built Kings Square location in the second quarter of 2020. The location of government services to the area has already resulted in a boost to jobs and the Fremantle economy and will continue when staff move into the new offices.
Resource Agreement
The following performance information (financial and non-financial) is the subject of a Resource Agreement signed by the Ministers, Accountable Authority and Treasurer under Part 3, Division 5 of the Financial Management Act 2006.
Outcomes, Services and Key Performance Information
The Department has implemented a new Outcome Based Management structure to provide a better reflection of its amalgamated service delivery methodology. The new structure includes changes to service categories, which have been restated where possible. Results for services under the previous structure will be available in the Department’s annual report.
Communities - continued
447
Relationship to Government Goals
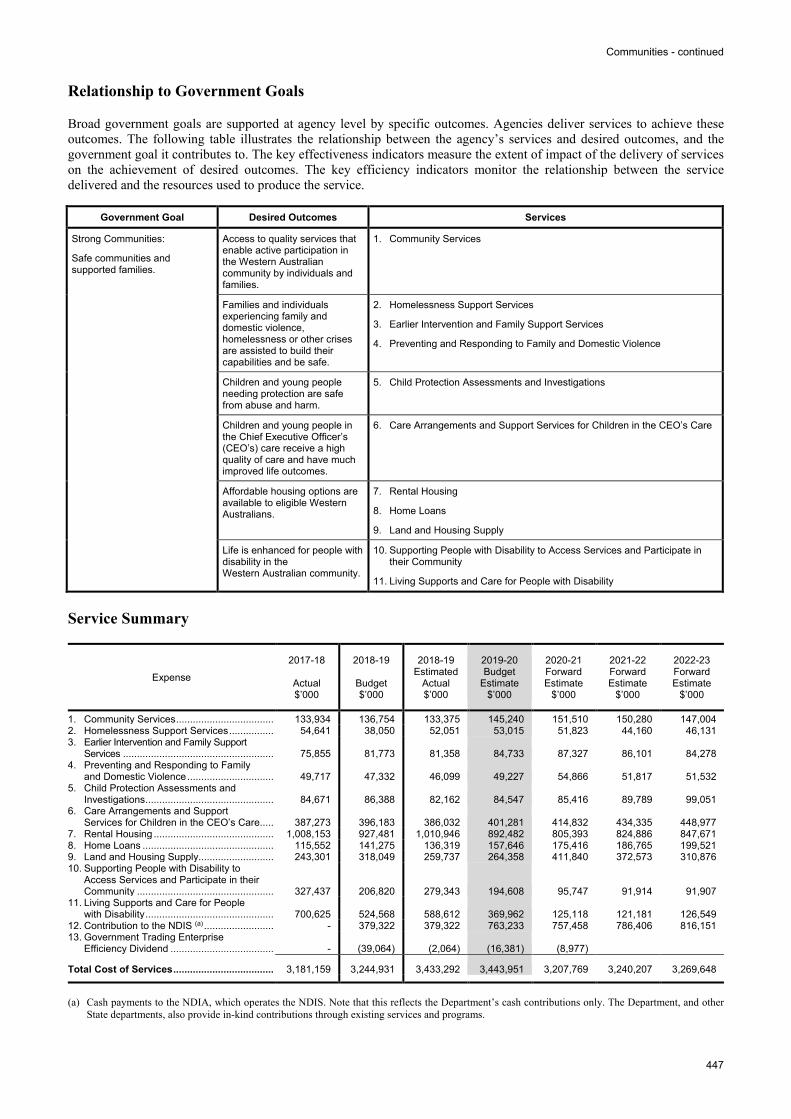
Broad government goals are supported at agency level by specific outcomes. Agencies deliver services to achieve these outcomes. The following table illustrates the relationship between the agency’s services and desired outcomes, and the government goal it contributes to. The key effectiveness indicators measure the extent of impact of the delivery of services on the achievement of desired outcomes. The key efficiency indicators monitor the relationship between the service delivered and the resources used to produce the service.
Government Goal Desired Outcomes Services
Strong Communities:
Safe communities and supported families.
Access to quality services that enable active participation in the Western Australian community by individuals and families.
1. Community Services
Families and individuals experiencing family and domestic violence, homelessness or other crises are assisted to build their capabilities and be safe.
2. Homelessness Support Services
3. Earlier Intervention and Family Support Services
4. Preventing and Responding to Family and Domestic Violence
Children and young people needing protection are safe from abuse and harm.
5. Child Protection Assessments and Investigations
Children and young people in the Chief Executive Officer’s (CEO’s) care receive a high quality of care and have much improved life outcomes.
6. Care Arrangements and Support Services for Children in the CEO’s Care
Affordable housing options are available to eligible Western Australians.
7. Rental Housing
8. Home Loans
9. Land and Housing Supply
Life is enhanced for people with disability in the Western Australian community.
10. Supporting People with Disability to Access Services and Participate in their Community
11. Living Supports and Care for People with Disability
Service Summary
Expense
2017-18
Actual $’000
2018-19
Budget $’000
2018-19 Estimated
Actual $’000
2019-20 Budget
Estimate $’000
2020-21 Forward Estimate
$’000
2021-22 Forward Estimate
$’000
2022-23 Forward Estimate
$’000
1. Community Services ................................... 133,934 136,754 133,375 145,240 151,510 150,280 147,004 2. Homelessness Support Services ................ 54,641 38,050 52,051 53,015 51,823 44,160 46,131 3. Earlier Intervention and Family Support
Services ...................................................... 75,855 81,773 81,358 84,733 87,327 86,101 84,278 4. Preventing and Responding to Family
and Domestic Violence ............................... 49,717 47,332 46,099 49,227 54,866 51,817 51,532 5. Child Protection Assessments and
Investigations .............................................. 84,671 86,388 82,162 84,547 85,416 89,789 99,051 6. Care Arrangements and Support
Services for Children in the CEO’s Care..... 387,273 396,183 386,032 401,281 414,832 434,335 448,977 7. Rental Housing ........................................... 1,008,153 927,481 1,010,946 892,482 805,393 824,886 847,671 8. Home Loans ............................................... 115,552 141,275 136,319 157,646 175,416 186,765 199,521 9. Land and Housing Supply........................... 243,301 318,049 259,737 264,358 411,840 372,573 310,876 10. Supporting People with Disability to
Access Services and Participate in their Community ................................................. 327,437 206,820 279,343 194,608 95,747 91,914 91,907
11. Living Supports and Care for People with Disability .............................................. 700,625 524,568 588,612 369,962 125,118 121,181 126,549
12. Contribution to the NDIS (a) ......................... - 379,322 379,322 763,233 757,458 786,406 816,151 13. Government Trading Enterprise
Efficiency Dividend ..................................... - (39,064) (2,064) (16,381) (8,977)
Total Cost of Services .................................... 3,181,159 3,244,931 3,433,292 3,443,951 3,207,769 3,240,207 3,269,648
(a) Cash payments to the NDIA, which operates the NDIS. Note that this reflects the Department’s cash contributions only. The Department, and other
State departments, also provide in-kind contributions through existing services and programs.
Communities - continued
448
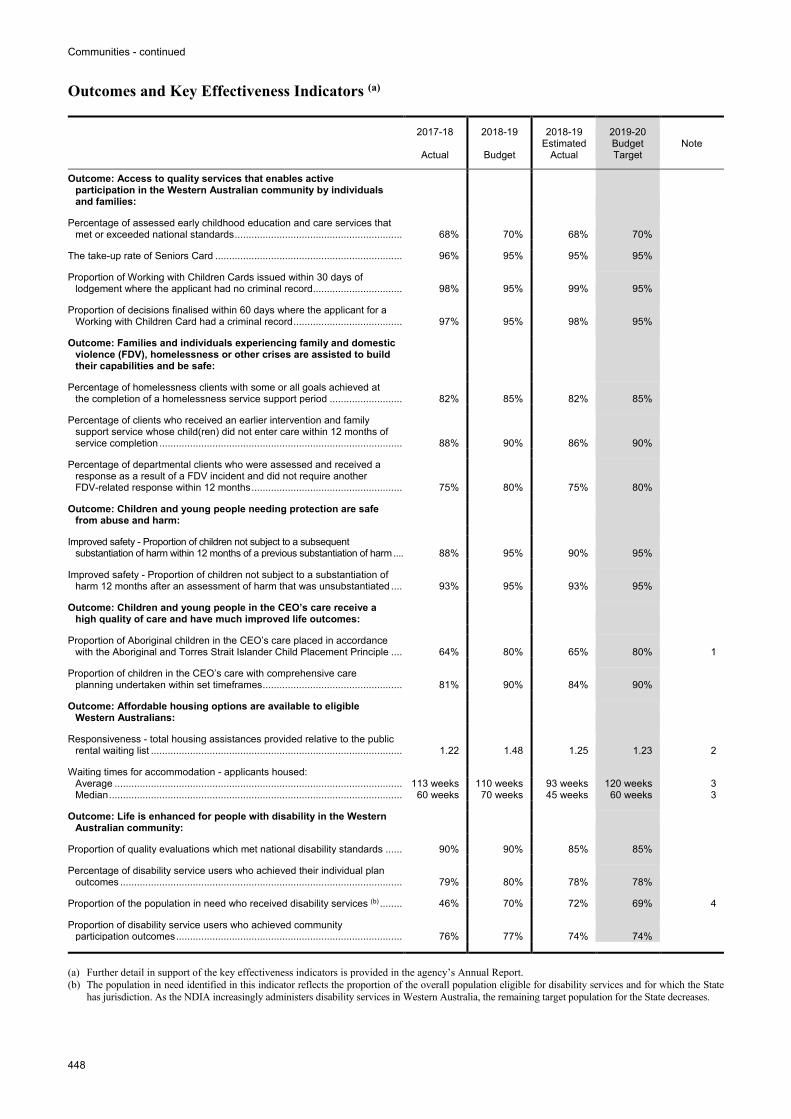
Outcomes and Key Effectiveness Indicators (a)
2017-18
Actual
2018-19
Budget
2018-19 Estimated
Actual
2019-20 Budget Target
Note
Outcome: Access to quality services that enables active participation in the Western Australian community by individuals and families:
Percentage of assessed early childhood education and care services that
met or exceeded national standards ............................................................. 68% 70% 68% 70% The take-up rate of Seniors Card .................................................................... 96% 95% 95% 95% Proportion of Working with Children Cards issued within 30 days of
lodgement where the applicant had no criminal record ................................. 98% 95% 99% 95% Proportion of decisions finalised within 60 days where the applicant for a
Working with Children Card had a criminal record ........................................ 97% 95% 98% 95% Outcome: Families and individuals experiencing family and domestic
violence (FDV), homelessness or other crises are assisted to build their capabilities and be safe:
Percentage of homelessness clients with some or all goals achieved at
the completion of a homelessness service support period ........................... 82% 85% 82% 85% Percentage of clients who received an earlier intervention and family
support service whose child(ren) did not enter care within 12 months of service completion ........................................................................................ 88% 90% 86% 90%
Percentage of departmental clients who were assessed and received a
response as a result of a FDV incident and did not require another FDV-related response within 12 months ....................................................... 75% 80% 75% 80%
Outcome: Children and young people needing protection are safe
from abuse and harm: Improved safety - Proportion of children not subject to a subsequent
substantiation of harm within 12 months of a previous substantiation of harm .... 88% 95% 90% 95% Improved safety - Proportion of children not subject to a substantiation of
harm 12 months after an assessment of harm that was unsubstantiated ..... 93% 95% 93% 95% Outcome: Children and young people in the CEO’s care receive a
high quality of care and have much improved life outcomes: Proportion of Aboriginal children in the CEO’s care placed in accordance
with the Aboriginal and Torres Strait Islander Child Placement Principle ..... 64% 80% 65% 80% 1 Proportion of children in the CEO’s care with comprehensive care
planning undertaken within set timeframes ................................................... 81% 90% 84% 90% Outcome: Affordable housing options are available to eligible
Western Australians: Responsiveness - total housing assistances provided relative to the public
rental waiting list ........................................................................................... 1.22 1.48 1.25 1.23 2
Waiting times for accommodation - applicants housed: Average ........................................................................................................ 113 weeks 110 weeks 93 weeks 120 weeks 3 Median .......................................................................................................... 60 weeks 70 weeks 45 weeks 60 weeks 3
Outcome: Life is enhanced for people with disability in the Western
Australian community: Proportion of quality evaluations which met national disability standards ....... 90% 90% 85% 85% Percentage of disability service users who achieved their individual plan
outcomes ...................................................................................................... 79% 80% 78% 78% Proportion of the population in need who received disability services (b) ......... 46% 70% 72% 69% 4 Proportion of disability service users who achieved community
participation outcomes .................................................................................. 76% 77% 74% 74% (a) Further detail in support of the key effectiveness indicators is provided in the agency’s Annual Report. (b) The population in need identified in this indicator reflects the proportion of the overall population eligible for disability services and for which the State
has jurisdiction. As the NDIA increasingly administers disability services in Western Australia, the remaining target population for the State decreases.
Communities - continued
449
Explanation of Significant Movements
(Notes) 1. The number and proportion of Aboriginal children in care continues to increase at a higher rate than the number of
available placement options with Aboriginal carers or relatives. While the application of the principle is generally in the child’s best interests, there are other factors that must be considered in placement decisions to ensure a child’s safety and wellbeing.
2. The 2018-19 Estimated Actual is lower than the 2018-19 Budget mostly due to the number of forecast vacancies
within existing public housing stock being lower than expected. 3. The 2018-19 Estimated Actual and the 2018-19 Budget are lower than the 2017-18 Actual due to a greater focus on
allocations to priority listed applicants associated with the Social Housing Investment Package in that year. The 2019-20 Budget Target sees a return to a historically normal level of wait times.
4. The 2017-18 Actual reflects a higher target population of individuals in need in that year as a result of the roll-out of
the Commonwealth-administered NDIS. As a result of the December 2017 agreement to transition to the national scheme, the Department provided services to fewer individuals in 2017-18 than estimated as individuals accessed the Commonwealth-administered scheme instead of services funded directly by the Department. The increases in the 2018-19 Budget, 2018-19 Estimated Actual and 2019-20 Budget Target reflect a reduced target population for the Department as more individuals are expected to be supported through the NDIA scheme as it rolls out across the State. By 2019-20, it is expected that the majority of individuals will have transitioned to the NDIS, further reducing the number of State service users.
Services and Key Efficiency Indicators
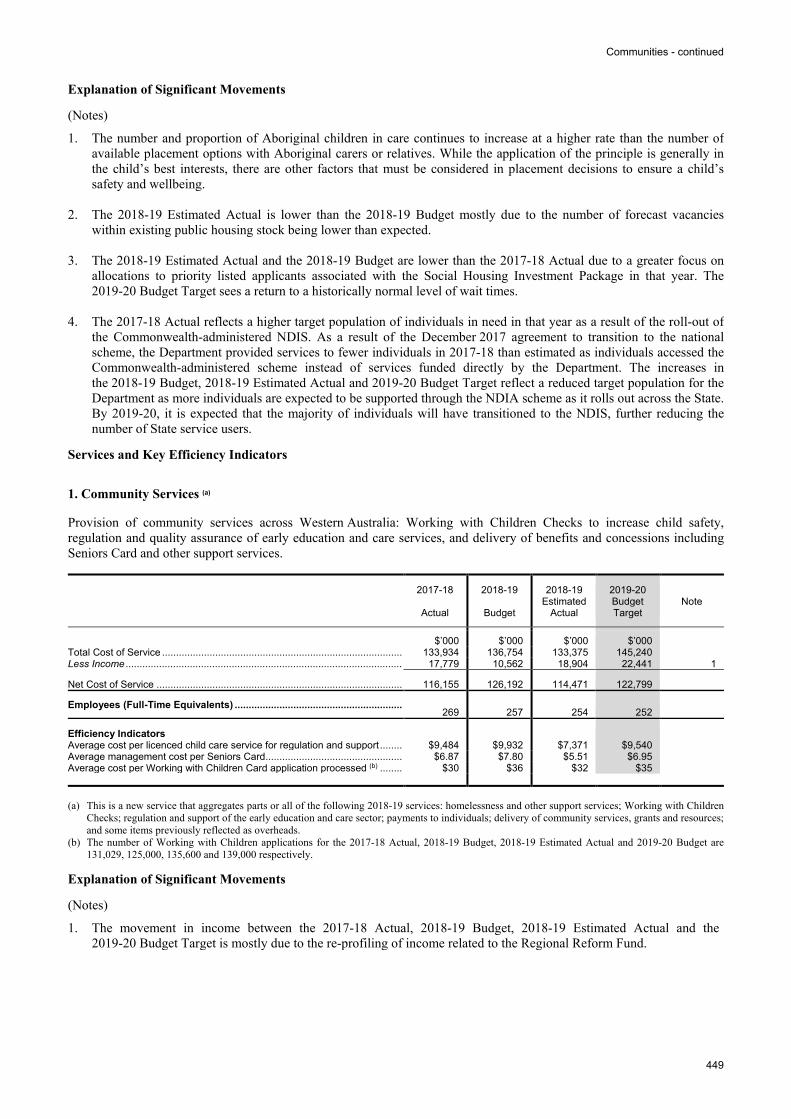
1. Community Services (a)
Provision of community services across Western Australia: Working with Children Checks to increase child safety, regulation and quality assurance of early education and care services, and delivery of benefits and concessions including Seniors Card and other support services.
2017-18
Actual
2018-19
Budget
2018-19 Estimated
Actual
2019-20 Budget Target
Note
$’000 $’000 $’000 $’000 Total Cost of Service ...................................................................................... 133,934 136,754 133,375 145,240 Less Income ................................................................................................... 17,779 10,562 18,904 22,441 1
Net Cost of Service ........................................................................................ 116,155 126,192 114,471 122,799
Employees (Full-Time Equivalents) ............................................................ 269 257 254 252
Efficiency Indicators Average cost per licenced child care service for regulation and support ........ $9,484 $9,932 $7,371 $9,540 Average management cost per Seniors Card ................................................. $6.87 $7.80 $5.51 $6.95 Average cost per Working with Children Card application processed (b) ........ $30 $36 $32 $35 (a) This is a new service that aggregates parts or all of the following 2018-19 services: homelessness and other support services; Working with Children
Checks; regulation and support of the early education and care sector; payments to individuals; delivery of community services, grants and resources; and some items previously reflected as overheads.
(b) The number of Working with Children applications for the 2017-18 Actual, 2018-19 Budget, 2018-19 Estimated Actual and 2019-20 Budget are 131,029, 125,000, 135,600 and 139,000 respectively.
Explanation of Significant Movements
(Notes) 1. The movement in income between the 2017-18 Actual, 2018-19 Budget, 2018-19 Estimated Actual and the
2019-20 Budget Target is mostly due to the re-profiling of income related to the Regional Reform Fund.
Communities - continued
450
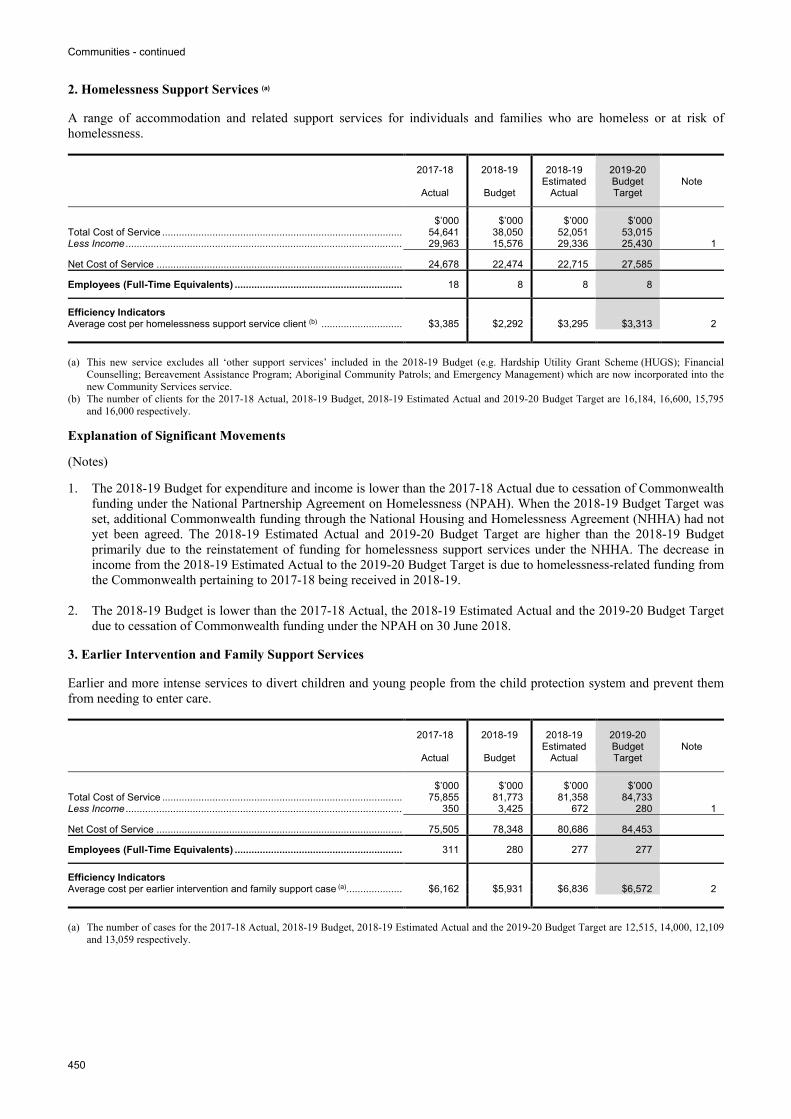
2. Homelessness Support Services (a)
A range of accommodation and related support services for individuals and families who are homeless or at risk of homelessness.
2017-18
Actual
2018-19
Budget
2018-19 Estimated
Actual
2019-20 Budget Target
Note
$’000 $’000 $’000 $’000 Total Cost of Service ...................................................................................... 54,641 38,050 52,051 53,015 Less Income ................................................................................................... 29,963 15,576 29,336 25,430 1
Net Cost of Service ........................................................................................ 24,678 22,474 22,715 27,585
Employees (Full-Time Equivalents) ............................................................ 18 8 8 8
Efficiency Indicators Average cost per homelessness support service client (b) ............................. $3,385 $2,292 $3,295 $3,313 2 (a) This new service excludes all ‘other support services’ included in the 2018-19 Budget (e.g. Hardship Utility Grant Scheme (HUGS); Financial
Counselling; Bereavement Assistance Program; Aboriginal Community Patrols; and Emergency Management) which are now incorporated into the new Community Services service.
(b) The number of clients for the 2017-18 Actual, 2018-19 Budget, 2018-19 Estimated Actual and 2019-20 Budget Target are 16,184, 16,600, 15,795 and 16,000 respectively.
Explanation of Significant Movements
(Notes) 1. The 2018-19 Budget for expenditure and income is lower than the 2017-18 Actual due to cessation of Commonwealth
funding under the National Partnership Agreement on Homelessness (NPAH). When the 2018-19 Budget Target was set, additional Commonwealth funding through the National Housing and Homelessness Agreement (NHHA) had not yet been agreed. The 2018-19 Estimated Actual and 2019-20 Budget Target are higher than the 2018-19 Budget primarily due to the reinstatement of funding for homelessness support services under the NHHA. The decrease in income from the 2018-19 Estimated Actual to the 2019-20 Budget Target is due to homelessness-related funding from the Commonwealth pertaining to 2017-18 being received in 2018-19.
2. The 2018-19 Budget is lower than the 2017-18 Actual, the 2018-19 Estimated Actual and the 2019-20 Budget Target
due to cessation of Commonwealth funding under the NPAH on 30 June 2018.
3. Earlier Intervention and Family Support Services
Earlier and more intense services to divert children and young people from the child protection system and prevent them from needing to enter care.
2017-18
Actual
2018-19
Budget
2018-19 Estimated
Actual
2019-20 Budget Target
Note
$’000 $’000 $’000 $’000 Total Cost of Service ...................................................................................... 75,855 81,773 81,358 84,733 Less Income ................................................................................................... 350 3,425 672 280 1
Net Cost of Service ........................................................................................ 75,505 78,348 80,686 84,453
Employees (Full-Time Equivalents) ............................................................ 311 280 277 277
Efficiency Indicators Average cost per earlier intervention and family support case (a) .................... $6,162 $5,931 $6,836 $6,572 2 (a) The number of cases for the 2017-18 Actual, 2018-19 Budget, 2018-19 Estimated Actual and the 2019-20 Budget Target are 12,515, 14,000, 12,109
and 13,059 respectively.
Communities - continued
451
Explanation of Significant Movements
(Notes) 1. The 2018-19 Estimated Actual is lower than the 2018-19 Budget primarily due to Regional Reform Fund-related
expenditure being re-profiled to Service 1. The 2019-20 Budget Target is lower than the 2018-19 Estimated Actual due to the cessation of Commonwealth funding for the Support for Family Safety in the Kimberley program.
2. The average cost per earlier intervention and family support case has increased from the 2018-19 Budget to the 2018-19 Estimated Actual mainly due to increases in case complexity.
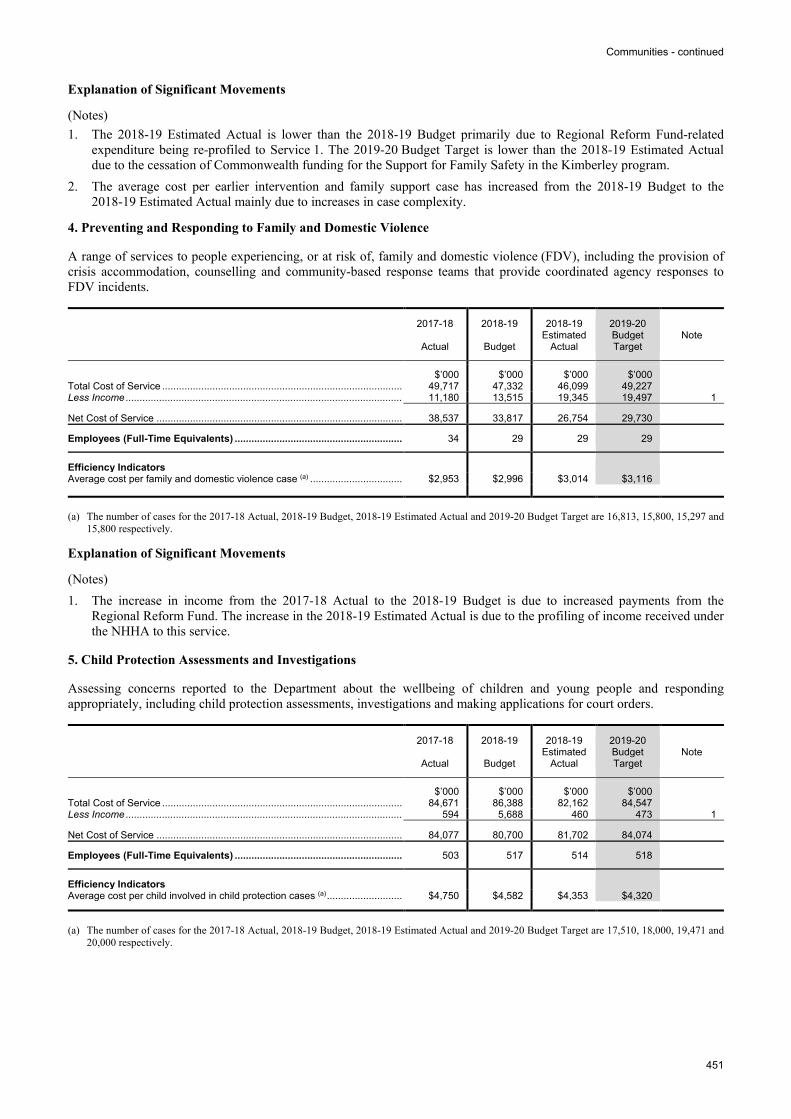
4. Preventing and Responding to Family and Domestic Violence
A range of services to people experiencing, or at risk of, family and domestic violence (FDV), including the provision of crisis accommodation, counselling and community-based response teams that provide coordinated agency responses to FDV incidents.
2017-18
Actual
2018-19
Budget
2018-19 Estimated
Actual
2019-20 Budget Target
Note
$’000 $’000 $’000 $’000 Total Cost of Service ...................................................................................... 49,717 47,332 46,099 49,227 Less Income ................................................................................................... 11,180 13,515 19,345 19,497 1
Net Cost of Service ........................................................................................ 38,537 33,817 26,754 29,730
Employees (Full-Time Equivalents) ............................................................ 34 29 29 29
Efficiency Indicators Average cost per family and domestic violence case (a) ................................. $2,953 $2,996 $3,014 $3,116 (a) The number of cases for the 2017-18 Actual, 2018-19 Budget, 2018-19 Estimated Actual and 2019-20 Budget Target are 16,813, 15,800, 15,297 and
15,800 respectively.
Explanation of Significant Movements
(Notes)
1. The increase in income from the 2017-18 Actual to the 2018-19 Budget is due to increased payments from the Regional Reform Fund. The increase in the 2018-19 Estimated Actual is due to the profiling of income received under the NHHA to this service.
5. Child Protection Assessments and Investigations
Assessing concerns reported to the Department about the wellbeing of children and young people and responding appropriately, including child protection assessments, investigations and making applications for court orders.
2017-18
Actual
2018-19
Budget
2018-19 Estimated
Actual
2019-20 Budget Target
Note
$’000 $’000 $’000 $’000 Total Cost of Service ...................................................................................... 84,671 86,388 82,162 84,547 Less Income ................................................................................................... 594 5,688 460 473 1
Net Cost of Service ........................................................................................ 84,077 80,700 81,702 84,074
Employees (Full-Time Equivalents) ............................................................ 503 517 514 518
Efficiency Indicators Average cost per child involved in child protection cases (a) ........................... $4,750 $4,582 $4,353 $4,320
(a) The number of cases for the 2017-18 Actual, 2018-19 Budget, 2018-19 Estimated Actual and 2019-20 Budget Target are 17,510, 18,000, 19,471 and
20,000 respectively.
Communities - continued
452
Explanation of Significant Movements
(Notes) 1. The 2018-19 Budget value included income from the Regional Reform Fund. This income has been re-profiled and
recorded against Service 1 for the 2018-19 Estimated Actual and the 2019-20 Budget Target.
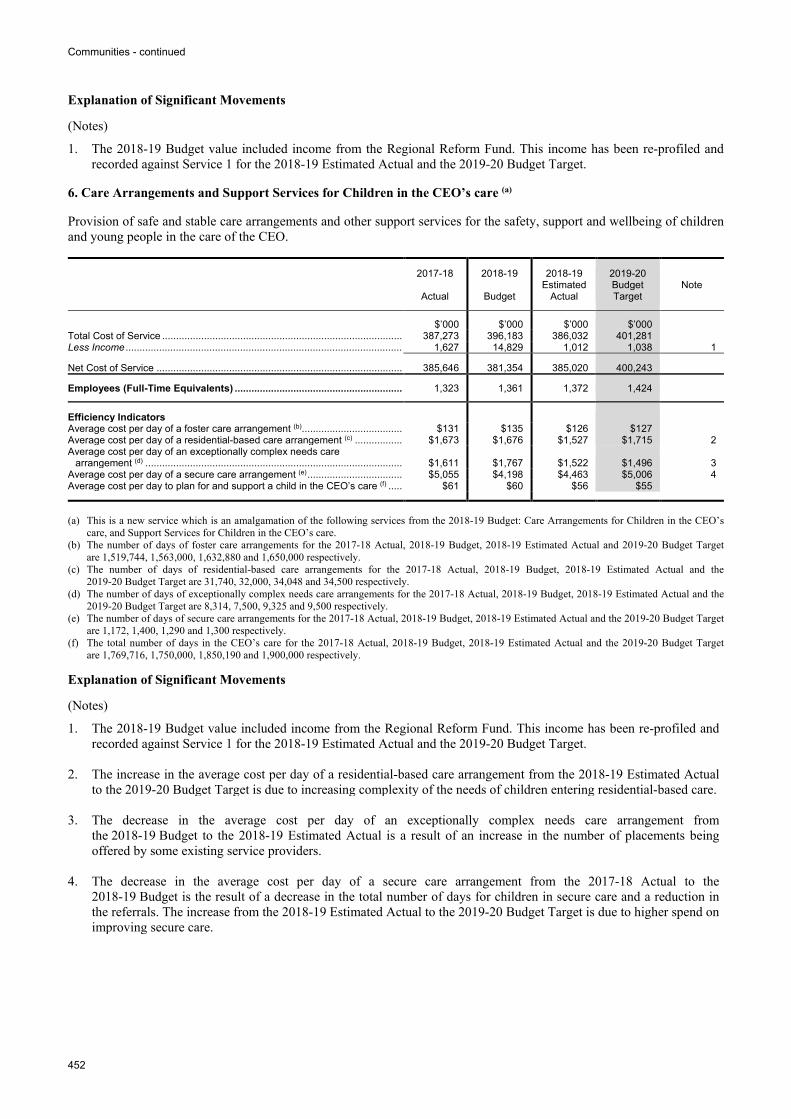
6. Care Arrangements and Support Services for Children in the CEO’s care (a)
Provision of safe and stable care arrangements and other support services for the safety, support and wellbeing of children and young people in the care of the CEO.
2017-18
Actual
2018-19
Budget
2018-19 Estimated
Actual
2019-20 Budget Target
Note
$’000 $’000 $’000 $’000 Total Cost of Service ...................................................................................... 387,273 396,183 386,032 401,281 Less Income ................................................................................................... 1,627 14,829 1,012 1,038 1
Net Cost of Service ........................................................................................ 385,646 381,354 385,020 400,243
Employees (Full-Time Equivalents) ............................................................ 1,323 1,361 1,372 1,424
Efficiency Indicators Average cost per day of a foster care arrangement (b).................................... $131 $135 $126 $127 Average cost per day of a residential-based care arrangement (c) ................. $1,673 $1,676 $1,527 $1,715 2 Average cost per day of an exceptionally complex needs care
arrangement (d) ............................................................................................ $1,611 $1,767 $1,522 $1,496 3 Average cost per day of a secure care arrangement (e) .................................. $5,055 $4,198 $4,463 $5,006 4 Average cost per day to plan for and support a child in the CEO’s care (f) ..... $61 $60 $56 $55
(a) This is a new service which is an amalgamation of the following services from the 2018-19 Budget: Care Arrangements for Children in the CEO’s
care, and Support Services for Children in the CEO’s care. (b) The number of days of foster care arrangements for the 2017-18 Actual, 2018-19 Budget, 2018-19 Estimated Actual and 2019-20 Budget Target
are 1,519,744, 1,563,000, 1,632,880 and 1,650,000 respectively. (c) The number of days of residential-based care arrangements for the 2017-18 Actual, 2018-19 Budget, 2018-19 Estimated Actual and the
2019-20 Budget Target are 31,740, 32,000, 34,048 and 34,500 respectively. (d) The number of days of exceptionally complex needs care arrangements for the 2017-18 Actual, 2018-19 Budget, 2018-19 Estimated Actual and the
2019-20 Budget Target are 8,314, 7,500, 9,325 and 9,500 respectively. (e) The number of days of secure care arrangements for the 2017-18 Actual, 2018-19 Budget, 2018-19 Estimated Actual and the 2019-20 Budget Target
are 1,172, 1,400, 1,290 and 1,300 respectively. (f) The total number of days in the CEO’s care for the 2017-18 Actual, 2018-19 Budget, 2018-19 Estimated Actual and the 2019-20 Budget Target
are 1,769,716, 1,750,000, 1,850,190 and 1,900,000 respectively.
Explanation of Significant Movements
(Notes) 1. The 2018-19 Budget value included income from the Regional Reform Fund. This income has been re-profiled and
recorded against Service 1 for the 2018-19 Estimated Actual and the 2019-20 Budget Target. 2. The increase in the average cost per day of a residential-based care arrangement from the 2018-19 Estimated Actual
to the 2019-20 Budget Target is due to increasing complexity of the needs of children entering residential-based care. 3. The decrease in the average cost per day of an exceptionally complex needs care arrangement from
the 2018-19 Budget to the 2018-19 Estimated Actual is a result of an increase in the number of placements being offered by some existing service providers.
4. The decrease in the average cost per day of a secure care arrangement from the 2017-18 Actual to the
2018-19 Budget is the result of a decrease in the total number of days for children in secure care and a reduction in the referrals. The increase from the 2018-19 Estimated Actual to the 2019-20 Budget Target is due to higher spend on improving secure care.
Communities - continued
453
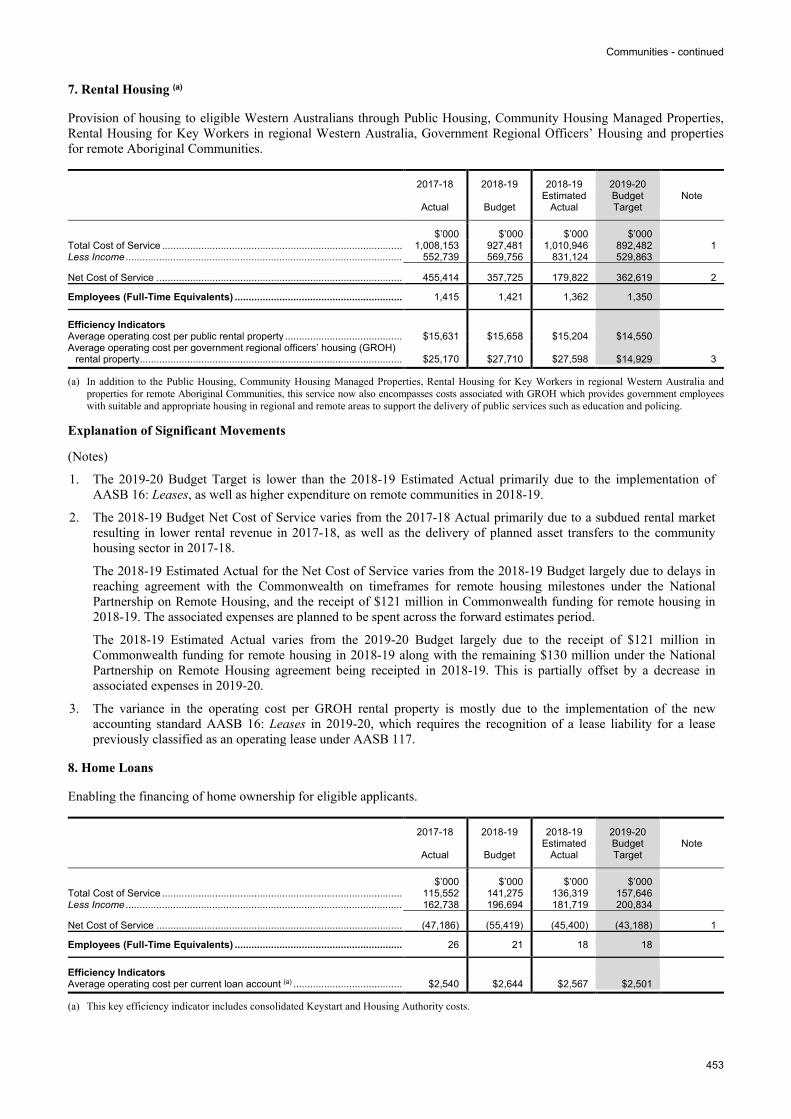
7. Rental Housing (a)
Provision of housing to eligible Western Australians through Public Housing, Community Housing Managed Properties, Rental Housing for Key Workers in regional Western Australia, Government Regional Officers’ Housing and properties for remote Aboriginal Communities.
2017-18
Actual
2018-19
Budget
2018-19 Estimated
Actual
2019-20 Budget Target
Note
$’000 $’000 $’000 $’000 Total Cost of Service ...................................................................................... 1,008,153 927,481 1,010,946 892,482 1 Less Income ................................................................................................... 552,739 569,756 831,124 529,863
Net Cost of Service ........................................................................................ 455,414 357,725 179,822 362,619 2
Employees (Full-Time Equivalents) ............................................................ 1,415 1,421 1,362 1,350
Efficiency Indicators Average operating cost per public rental property .......................................... $15,631 $15,658 $15,204 $14,550 Average operating cost per government regional officers’ housing (GROH)
rental property.............................................................................................. $25,170 $27,710 $27,598 $14,929 3
(a) In addition to the Public Housing, Community Housing Managed Properties, Rental Housing for Key Workers in regional Western Australia and properties for remote Aboriginal Communities, this service now also encompasses costs associated with GROH which provides government employees with suitable and appropriate housing in regional and remote areas to support the delivery of public services such as education and policing.
Explanation of Significant Movements
(Notes) 1. The 2019-20 Budget Target is lower than the 2018-19 Estimated Actual primarily due to the implementation of
AASB 16: Leases, as well as higher expenditure on remote communities in 2018-19. 2. The 2018-19 Budget Net Cost of Service varies from the 2017-18 Actual primarily due to a subdued rental market
resulting in lower rental revenue in 2017-18, as well as the delivery of planned asset transfers to the community housing sector in 2017-18.
The 2018-19 Estimated Actual for the Net Cost of Service varies from the 2018-19 Budget largely due to delays in reaching agreement with the Commonwealth on timeframes for remote housing milestones under the National Partnership on Remote Housing, and the receipt of $121 million in Commonwealth funding for remote housing in 2018-19. The associated expenses are planned to be spent across the forward estimates period.
The 2018-19 Estimated Actual varies from the 2019-20 Budget largely due to the receipt of $121 million in Commonwealth funding for remote housing in 2018-19 along with the remaining $130 million under the National Partnership on Remote Housing agreement being receipted in 2018-19. This is partially offset by a decrease in associated expenses in 2019-20.
3. The variance in the operating cost per GROH rental property is mostly due to the implementation of the new accounting standard AASB 16: Leases in 2019-20, which requires the recognition of a lease liability for a lease previously classified as an operating lease under AASB 117.
8. Home Loans
Enabling the financing of home ownership for eligible applicants.
2017-18
Actual
2018-19
Budget
2018-19 Estimated
Actual
2019-20 Budget Target
Note
$’000 $’000 $’000 $’000 Total Cost of Service ...................................................................................... 115,552 141,275 136,319 157,646 Less Income ................................................................................................... 162,738 196,694 181,719 200,834
Net Cost of Service ........................................................................................ (47,186) (55,419) (45,400) (43,188) 1
Employees (Full-Time Equivalents) ............................................................ 26 21 18 18
Efficiency Indicators Average operating cost per current loan account (a) ....................................... $2,540 $2,644 $2,567 $2,501
(a) This key efficiency indicator includes consolidated Keystart and Housing Authority costs.
Communities - continued
454
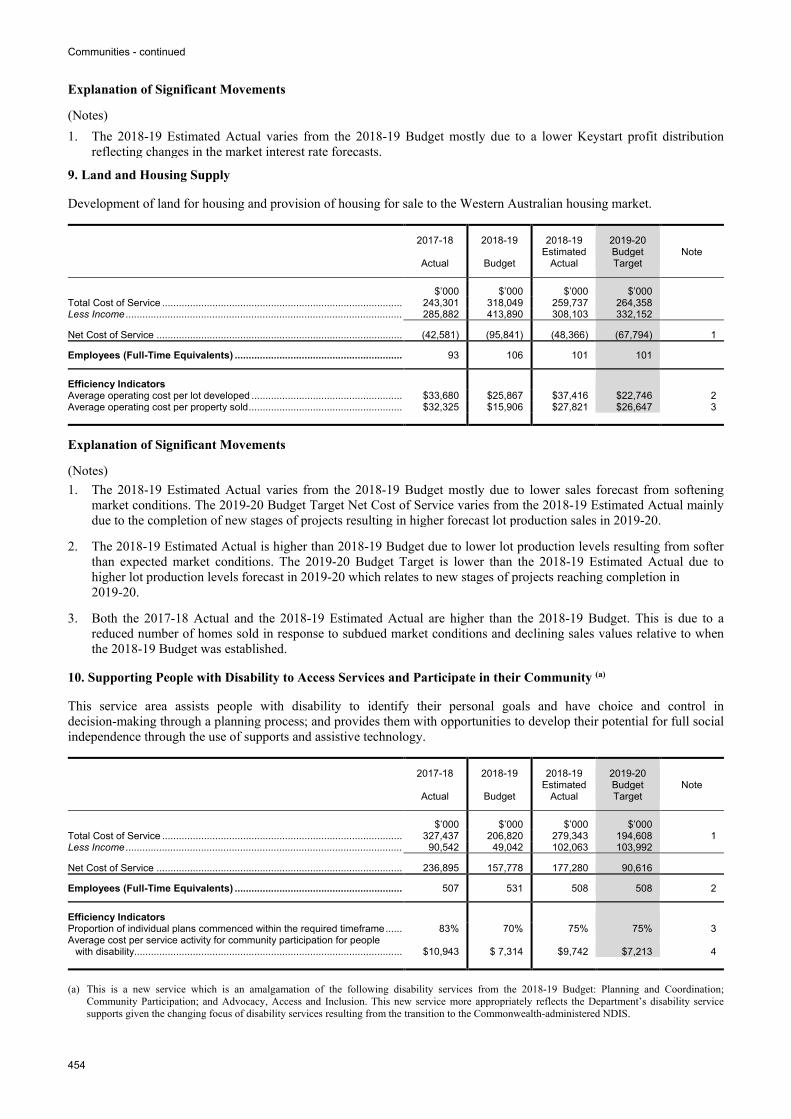
Explanation of Significant Movements
(Notes) 1. The 2018-19 Estimated Actual varies from the 2018-19 Budget mostly due to a lower Keystart profit distribution
reflecting changes in the market interest rate forecasts.
9. Land and Housing Supply
Development of land for housing and provision of housing for sale to the Western Australian housing market.
2017-18
Actual
2018-19
Budget
2018-19 Estimated
Actual
2019-20 Budget Target
Note
$’000 $’000 $’000 $’000 Total Cost of Service ...................................................................................... 243,301 318,049 259,737 264,358 Less Income ................................................................................................... 285,882 413,890 308,103 332,152
Net Cost of Service ........................................................................................ (42,581) (95,841) (48,366) (67,794) 1
Employees (Full-Time Equivalents) ............................................................ 93 106 101 101
Efficiency Indicators Average operating cost per lot developed ...................................................... $33,680 $25,867 $37,416 $22,746 2 Average operating cost per property sold ....................................................... $32,325 $15,906 $27,821 $26,647 3
Explanation of Significant Movements
(Notes) 1. The 2018-19 Estimated Actual varies from the 2018-19 Budget mostly due to lower sales forecast from softening
market conditions. The 2019-20 Budget Target Net Cost of Service varies from the 2018-19 Estimated Actual mainly due to the completion of new stages of projects resulting in higher forecast lot production sales in 2019-20.
2. The 2018-19 Estimated Actual is higher than 2018-19 Budget due to lower lot production levels resulting from softer
than expected market conditions. The 2019-20 Budget Target is lower than the 2018-19 Estimated Actual due to higher lot production levels forecast in 2019-20 which relates to new stages of projects reaching completion in 2019-20.
3. Both the 2017-18 Actual and the 2018-19 Estimated Actual are higher than the 2018-19 Budget. This is due to a
reduced number of homes sold in response to subdued market conditions and declining sales values relative to when the 2018-19 Budget was established.
10. Supporting People with Disability to Access Services and Participate in their Community (a)
This service area assists people with disability to identify their personal goals and have choice and control in decision-making through a planning process; and provides them with opportunities to develop their potential for full social independence through the use of supports and assistive technology.
2017-18
Actual
2018-19
Budget
2018-19 Estimated
Actual
2019-20 Budget Target
Note
$’000 $’000 $’000 $’000 Total Cost of Service ...................................................................................... 327,437 206,820 279,343 194,608 1 Less Income ................................................................................................... 90,542 49,042 102,063 103,992
Net Cost of Service ........................................................................................ 236,895 157,778 177,280 90,616
Employees (Full-Time Equivalents) ............................................................ 507 531 508 508 2
Efficiency Indicators Proportion of individual plans commenced within the required timeframe ...... 83% 70% 75% 75% 3 Average cost per service activity for community participation for people
with disability................................................................................................ $10,943 $ 7,314 $9,742 $7,213 4 (a) This is a new service which is an amalgamation of the following disability services from the 2018-19 Budget: Planning and Coordination;
Community Participation; and Advocacy, Access and Inclusion. This new service more appropriately reflects the Department’s disability service supports given the changing focus of disability services resulting from the transition to the Commonwealth-administered NDIS.
Communities - continued
455
Explanation of Significant Movements
(Notes) 1. These costs exclude payments made to the NDIA. The movement between the 2017-18 Actual, 2018-19 Budget,
2018-19 Estimated Actual and 2019-20 Budget Target is due to the impact of the transition of State clients to the Commonwealth-administered NDIS. State expenditure on disability services is directly influenced by the NDIS transition (which itself is dependent on a number of factors, including eligibility assessment and NDIA capacity), and this is reflected in the estimated variances for the Total Cost of Service, income, FTEs and efficiency indicators.
2. The variances between the 2017-18 Actual, 2018-19 Budget, 2018-19 Estimated Actual and 2019-20 Budget Target reflect the impact of the transition to the Commonwealth-administered NDIS. The number of FTEs is directly influenced by the intake of State-supported individuals to the Commonwealth-administered NDIS over the transition period.
3. The variance between the 2017-18 Actual, 2018-19 Budget, 2018-19 Estimated Actual and 2019-20 Budget Target is due to greater than expected efficiency in 2017-18. For 2019-20, the Budget Target is consistent with historical levels.
4. The forecast decrease in average cost per service activity in the 2019-20 Budget Target reflects the continual transition of clients, and their associated services and supports, to the NDIA. The transfer of the budget for this service is not directly proportional to the transfer of service users.
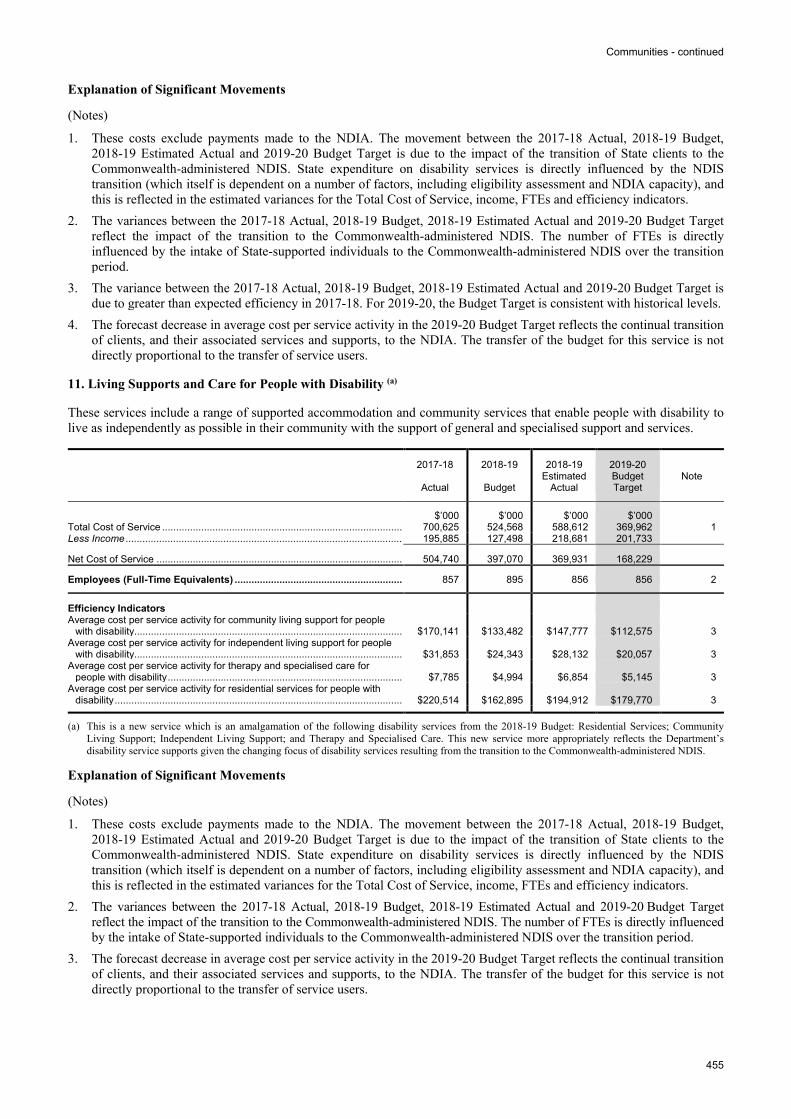
11. Living Supports and Care for People with Disability (a)
These services include a range of supported accommodation and community services that enable people with disability to live as independently as possible in their community with the support of general and specialised support and services.
2017-18
Actual
2018-19
Budget
2018-19 Estimated
Actual
2019-20 Budget Target
Note
$’000 $’000 $’000 $’000 Total Cost of Service ...................................................................................... 700,625 524,568 588,612 369,962 1 Less Income ................................................................................................... 195,885 127,498 218,681 201,733
Net Cost of Service ........................................................................................ 504,740 397,070 369,931 168,229
Employees (Full-Time Equivalents) ............................................................ 857 895 856 856 2
Efficiency Indicators Average cost per service activity for community living support for people
with disability................................................................................................ $170,141 $133,482 $147,777 $112,575 3 Average cost per service activity for independent living support for people
with disability................................................................................................ $31,853 $24,343 $28,132 $20,057 3 Average cost per service activity for therapy and specialised care for
people with disability .................................................................................... $7,785 $4,994 $6,854 $5,145 3 Average cost per service activity for residential services for people with
disability ....................................................................................................... $220,514 $162,895 $194,912 $179,770 3
(a) This is a new service which is an amalgamation of the following disability services from the 2018-19 Budget: Residential Services; Community Living Support; Independent Living Support; and Therapy and Specialised Care. This new service more appropriately reflects the Department’s disability service supports given the changing focus of disability services resulting from the transition to the Commonwealth-administered NDIS.
Explanation of Significant Movements
(Notes) 1. These costs exclude payments made to the NDIA. The movement between the 2017-18 Actual, 2018-19 Budget,
2018-19 Estimated Actual and 2019-20 Budget Target is due to the impact of the transition of State clients to the Commonwealth-administered NDIS. State expenditure on disability services is directly influenced by the NDIS transition (which itself is dependent on a number of factors, including eligibility assessment and NDIA capacity), and this is reflected in the estimated variances for the Total Cost of Service, income, FTEs and efficiency indicators.
2. The variances between the 2017-18 Actual, 2018-19 Budget, 2018-19 Estimated Actual and 2019-20 Budget Target reflect the impact of the transition to the Commonwealth-administered NDIS. The number of FTEs is directly influenced by the intake of State-supported individuals to the Commonwealth-administered NDIS over the transition period.
3. The forecast decrease in average cost per service activity in the 2019-20 Budget Target reflects the continual transition of clients, and their associated services and supports, to the NDIA. The transfer of the budget for this service is not directly proportional to the transfer of service users.
Communities - continued
456
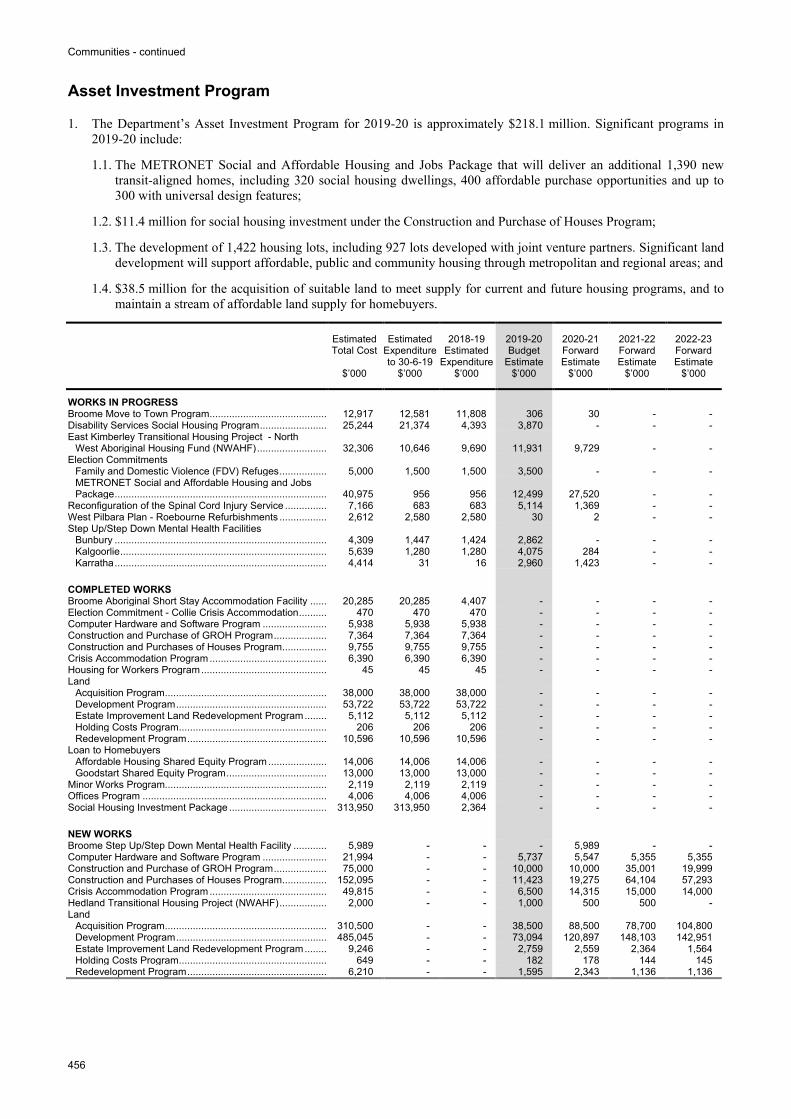
Asset Investment Program
1. The Department’s Asset Investment Program for 2019-20 is approximately $218.1 million. Significant programs in 2019-20 include:
1.1. The METRONET Social and Affordable Housing and Jobs Package that will deliver an additional 1,390 new transit-aligned homes, including 320 social housing dwellings, 400 affordable purchase opportunities and up to 300 with universal design features;
1.2. $11.4 million for social housing investment under the Construction and Purchase of Houses Program;
1.3. The development of 1,422 housing lots, including 927 lots developed with joint venture partners. Significant land development will support affordable, public and community housing through metropolitan and regional areas; and
1.4. $38.5 million for the acquisition of suitable land to meet supply for current and future housing programs, and to maintain a stream of affordable land supply for homebuyers.
Estimated Total Cost
$’000
Estimated Expenditure to 30-6-19
$’000
2018-19 Estimated
Expenditure $’000
2019-20 Budget
Estimate $’000
2020-21 Forward Estimate
$’000
2021-22 Forward Estimate
$’000
2022-23 Forward Estimate
$’000
WORKS IN PROGRESS Broome Move to Town Program .......................................... 12,917 12,581 11,808 306 30 - - Disability Services Social Housing Program ........................ 25,244 21,374 4,393 3,870 - - - East Kimberley Transitional Housing Project - North
West Aboriginal Housing Fund (NWAHF) ......................... 32,306 10,646 9,690 11,931 9,729 - - Election Commitments
Family and Domestic Violence (FDV) Refuges ................. 5,000 1,500 1,500 3,500 - - - METRONET Social and Affordable Housing and Jobs Package ............................................................................ 40,975 956 956 12,499 27,520 - -
Reconfiguration of the Spinal Cord Injury Service ............... 7,166 683 683 5,114 1,369 - - West Pilbara Plan - Roebourne Refurbishments ................. 2,612 2,580 2,580 30 2 - - Step Up/Step Down Mental Health Facilities
Bunbury ............................................................................ 4,309 1,447 1,424 2,862 - - - Kalgoorlie .......................................................................... 5,639 1,280 1,280 4,075 284 - - Karratha ............................................................................ 4,414 31 16 2,960 1,423 - -
COMPLETED WORKS Broome Aboriginal Short Stay Accommodation Facility ...... 20,285 20,285 4,407 - - - - Election Commitment - Collie Crisis Accommodation .......... 470 470 470 - - - - Computer Hardware and Software Program ....................... 5,938 5,938 5,938 - - - - Construction and Purchase of GROH Program ................... 7,364 7,364 7,364 - - - - Construction and Purchases of Houses Program ................ 9,755 9,755 9,755 - - - - Crisis Accommodation Program .......................................... 6,390 6,390 6,390 - - - - Housing for Workers Program ............................................. 45 45 45 - - - - Land
Acquisition Program .......................................................... 38,000 38,000 38,000 - - - - Development Program ...................................................... 53,722 53,722 53,722 - - - - Estate Improvement Land Redevelopment Program ........ 5,112 5,112 5,112 - - - - Holding Costs Program ..................................................... 206 206 206 - - - - Redevelopment Program .................................................. 10,596 10,596 10,596 - - - -
Loan to Homebuyers Affordable Housing Shared Equity Program ..................... 14,006 14,006 14,006 - - - - Goodstart Shared Equity Program .................................... 13,000 13,000 13,000 - - - -
Minor Works Program.......................................................... 2,119 2,119 2,119 - - - - Offices Program .................................................................. 4,006 4,006 4,006 - - - - Social Housing Investment Package ................................... 313,950 313,950 2,364 - - - -
NEW WORKS Broome Step Up/Step Down Mental Health Facility ............ 5,989 - - - 5,989 - - Computer Hardware and Software Program ....................... 21,994 - - 5,737 5,547 5,355 5,355 Construction and Purchase of GROH Program ................... 75,000 - - 10,000 10,000 35,001 19,999 Construction and Purchases of Houses Program ................ 152,095 - - 11,423 19,275 64,104 57,293 Crisis Accommodation Program .......................................... 49,815 - - 6,500 14,315 15,000 14,000 Hedland Transitional Housing Project (NWAHF) ................. 2,000 - - 1,000 500 500 - Land
Acquisition Program .......................................................... 310,500 - - 38,500 88,500 78,700 104,800 Development Program ...................................................... 485,045 - - 73,094 120,897 148,103 142,951 Estate Improvement Land Redevelopment Program ........ 9,246 - - 2,759 2,559 2,364 1,564 Holding Costs Program ..................................................... 649 - - 182 178 144 145 Redevelopment Program .................................................. 6,210 - - 1,595 2,343 1,136 1,136
Communities - continued
457
Estimated Total Cost
$’000
Estimated Expenditure to 30-6-19
$’000
2018-19 Estimated
Expenditure $’000
2019-20 Budget
Estimate $’000
2020-21 Forward Estimate
$’000
2021-22 Forward Estimate
$’000
2022-23 Forward Estimate
$’000
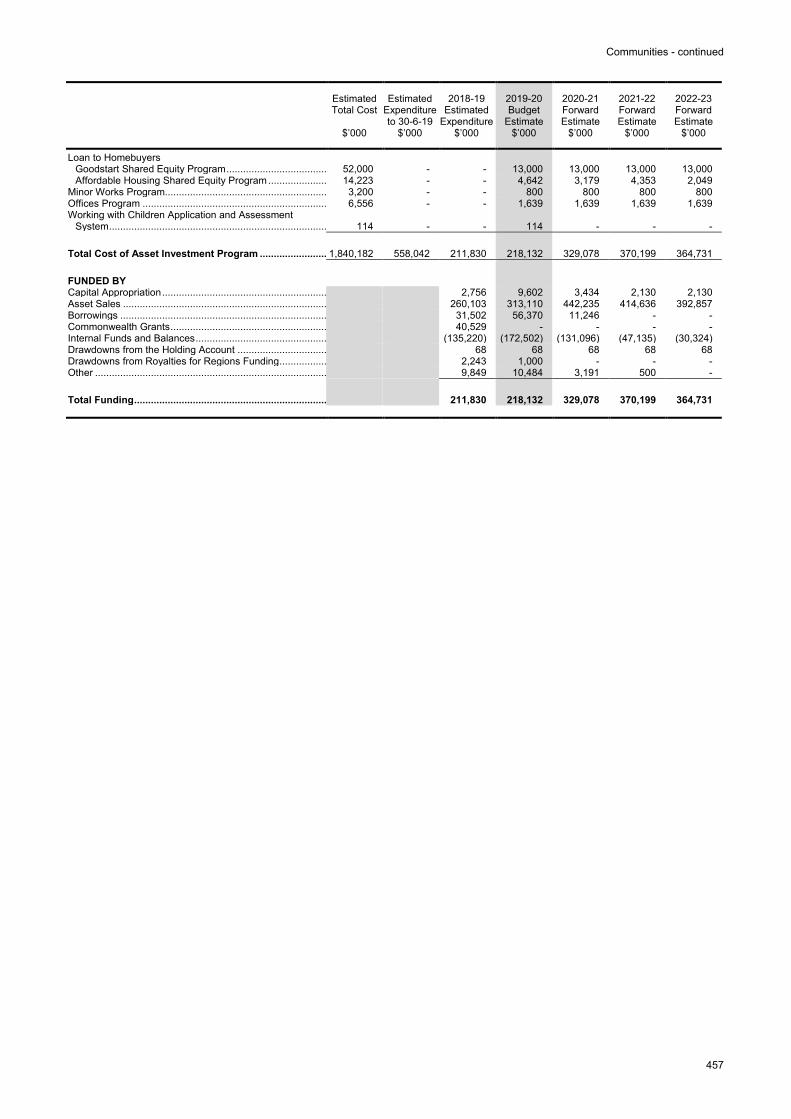
Loan to Homebuyers Goodstart Shared Equity Program .................................... 52,000 - - 13,000 13,000 13,000 13,000 Affordable Housing Shared Equity Program ..................... 14,223 - - 4,642 3,179 4,353 2,049
Minor Works Program.......................................................... 3,200 - - 800 800 800 800 Offices Program .................................................................. 6,556 - - 1,639 1,639 1,639 1,639 Working with Children Application and Assessment
System .............................................................................. 114 - - 114 - - -
Total Cost of Asset Investment Program ........................ 1,840,182 558,042 211,830 218,132 329,078 370,199 364,731
FUNDED BY Capital Appropriation ........................................................... 2,756 9,602 3,434 2,130 2,130 Asset Sales ......................................................................... 260,103 313,110 442,235 414,636 392,857 Borrowings .......................................................................... 31,502 56,370 11,246 - - Commonwealth Grants ........................................................ 40,529 - - - - Internal Funds and Balances ............................................... (135,220) (172,502) (131,096) (47,135) (30,324) Drawdowns from the Holding Account ................................ 68 68 68 68 68 Drawdowns from Royalties for Regions Funding ................. 2,243 1,000 - - - Other ................................................................................... 9,849 10,484 3,191 500 -
Total Funding ..................................................................... 211,830 218,132 329,078 370,199 364,731
Communities - continued
458
Financial Statements
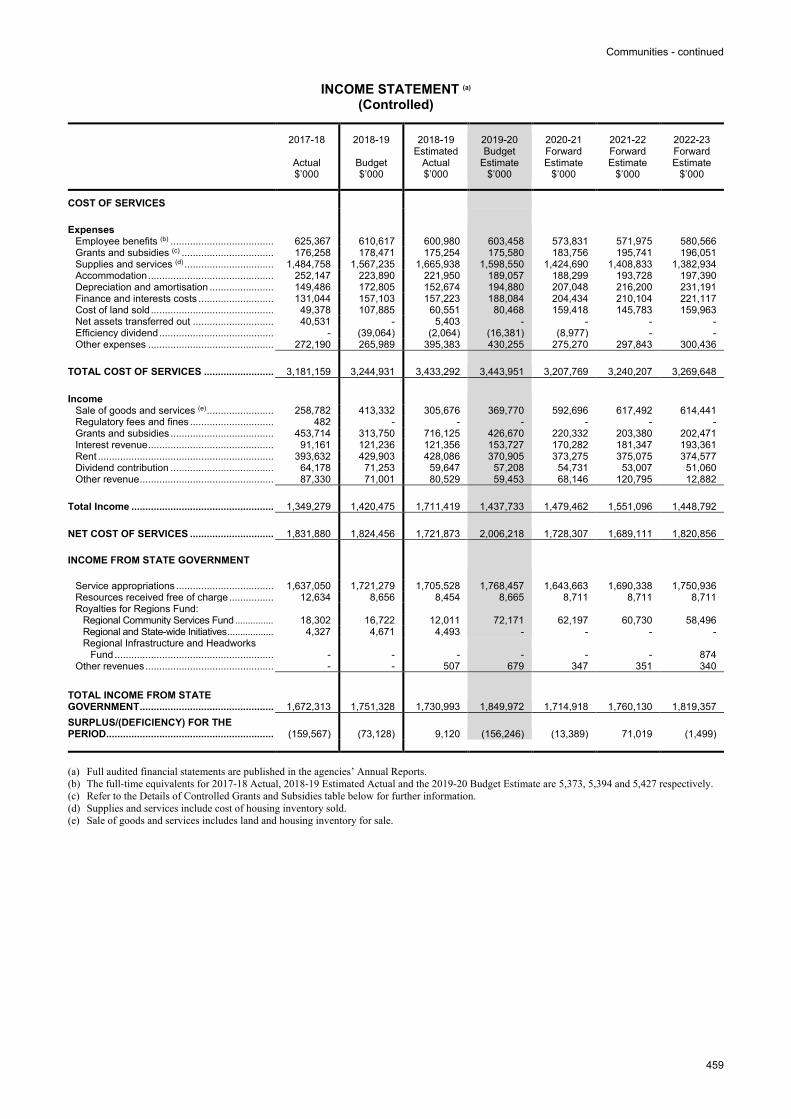
1. The implementation of new accounting standard AASB 16: Leases significantly impacts the Statement of Financial Position by bringing arrangements previously classified as operating leases on to the balance sheet. On the Income Statement, previous rental expenses for operating leases are removed and replaced with interest expense for the lease obligation and a depreciation cost for the right of use asset. Further information on AASB 16 and other new accounting standards impacting the Budget are detailed in a feature box in Budget Paper No. 3.
Income Statement
Expenses 2. Total Cost of Services is forecast to increase by $10.7 million (0.3%) in 2019-20 compared to the
2018-19 Estimated Actual. The forecast increase is primarily related to increased investment in systemic and individual advocacy and expenditure related to the NDIS decommissioning team.
Income 3. Total income is forecast to decrease by $273.7 million (16%) in 2019-20 compared to the 2018-19 Estimated Actual
primarily due to:
3.1. Commonwealth funding from the National Partnership Agreement on Remote Housing ceasing in 2018-19; and
3.2. The transition of State clients to the NDIA-administered NDIS, resulting in a reduction in Commonwealth grant funding passing through the State in 2019-20 (with the Commonwealth increasingly providing its funding directly to the NDIA as the NDIS transition progresses).
Statement of Financial Position
4. The Department’s equity (net assets) is expected to decrease by $144.4 million (1.1%) in 2019-20 compared to the 2018-19 Estimated Actual. This movement is primarily related to non-cash depreciation expenditure from the Department’s housing portfolio.
Statement of Cashflows
5. The 2019-20 net cash holdings for the Department is forecast to be $307.2 million, a decrease of $29 million (8.6%) compared to the 2018-19 Estimated Actual of $336.2 million. The forecast decrease is mainly the net effect of:
5.1. the majority of the $121 million Commonwealth payment under the National Partnership Agreement on Remote Housing received in 2018-19 being spent in 2019-20; and
5.2. an increase in sales proceeds of Housing Authority assets.
Communities - continued
459
INCOME STATEMENT (a)
(Controlled)
2017-18
Actual $’000
2018-19
Budget $’000
2018-19 Estimated
Actual $’000
2019-20 Budget
Estimate $’000
2020-21 Forward Estimate
$’000
2021-22 Forward Estimate
$’000
2022-23 Forward Estimate
$’000
COST OF SERVICES
Expenses Employee benefits (b) ..................................... 625,367 610,617 600,980 603,458 573,831 571,975 580,566 Grants and subsidies (c) ................................. 176,258 178,471 175,254 175,580 183,756 195,741 196,051 Supplies and services (d) ................................ 1,484,758 1,567,235 1,665,938 1,598,550 1,424,690 1,408,833 1,382,934 Accommodation ............................................. 252,147 223,890 221,950 189,057 188,299 193,728 197,390 Depreciation and amortisation ....................... 149,486 172,805 152,674 194,880 207,048 216,200 231,191 Finance and interests costs ........................... 131,044 157,103 157,223 188,084 204,434 210,104 221,117 Cost of land sold ............................................ 49,378 107,885 60,551 80,468 159,418 145,783 159,963 Net assets transferred out ............................. 40,531 - 5,403 - - - - Efficiency dividend ......................................... - (39,064) (2,064) (16,381) (8,977) - - Other expenses ............................................. 272,190 265,989 395,383 430,255 275,270 297,843 300,436
TOTAL COST OF SERVICES ......................... 3,181,159 3,244,931 3,433,292 3,443,951 3,207,769 3,240,207 3,269,648
Income Sale of goods and services (e) ........................ 258,782 413,332 305,676 369,770 592,696 617,492 614,441 Regulatory fees and fines .............................. 482 - - - - - - Grants and subsidies ..................................... 453,714 313,750 716,125 426,670 220,332 203,380 202,471 Interest revenue ............................................. 91,161 121,236 121,356 153,727 170,282 181,347 193,361 Rent ............................................................... 393,632 429,903 428,086 370,905 373,275 375,075 374,577 Dividend contribution ..................................... 64,178 71,253 59,647 57,208 54,731 53,007 51,060 Other revenue ................................................ 87,330 71,001 80,529 59,453 68,146 120,795 12,882
Total Income ................................................... 1,349,279 1,420,475 1,711,419 1,437,733 1,479,462 1,551,096 1,448,792
NET COST OF SERVICES .............................. 1,831,880 1,824,456 1,721,873 2,006,218 1,728,307 1,689,111 1,820,856
INCOME FROM STATE GOVERNMENT
Service appropriations ................................... 1,637,050 1,721,279 1,705,528 1,768,457 1,643,663 1,690,338 1,750,936 Resources received free of charge ................ 12,634 8,656 8,454 8,665 8,711 8,711 8,711 Royalties for Regions Fund:
Regional Community Services Fund ............... 18,302 16,722 12,011 72,171 62,197 60,730 58,496 Regional and State-wide Initiatives .................. 4,327 4,671 4,493 - - - - Regional Infrastructure and Headworks
Fund ......................................................... - - - - - - 874 Other revenues .............................................. - - 507 679 347 351 340
TOTAL INCOME FROM STATE GOVERNMENT ................................................ 1,672,313 1,751,328 1,730,993 1,849,972 1,714,918 1,760,130 1,819,357 SURPLUS/(DEFICIENCY) FOR THE PERIOD ............................................................ (159,567) (73,128) 9,120 (156,246) (13,389) 71,019 (1,499) (a) Full audited financial statements are published in the agencies’ Annual Reports. (b) The full-time equivalents for 2017-18 Actual, 2018-19 Estimated Actual and the 2019-20 Budget Estimate are 5,373, 5,394 and 5,427 respectively. (c) Refer to the Details of Controlled Grants and Subsidies table below for further information. (d) Supplies and services include cost of housing inventory sold. (e) Sale of goods and services includes land and housing inventory for sale.
Communities - continued
460
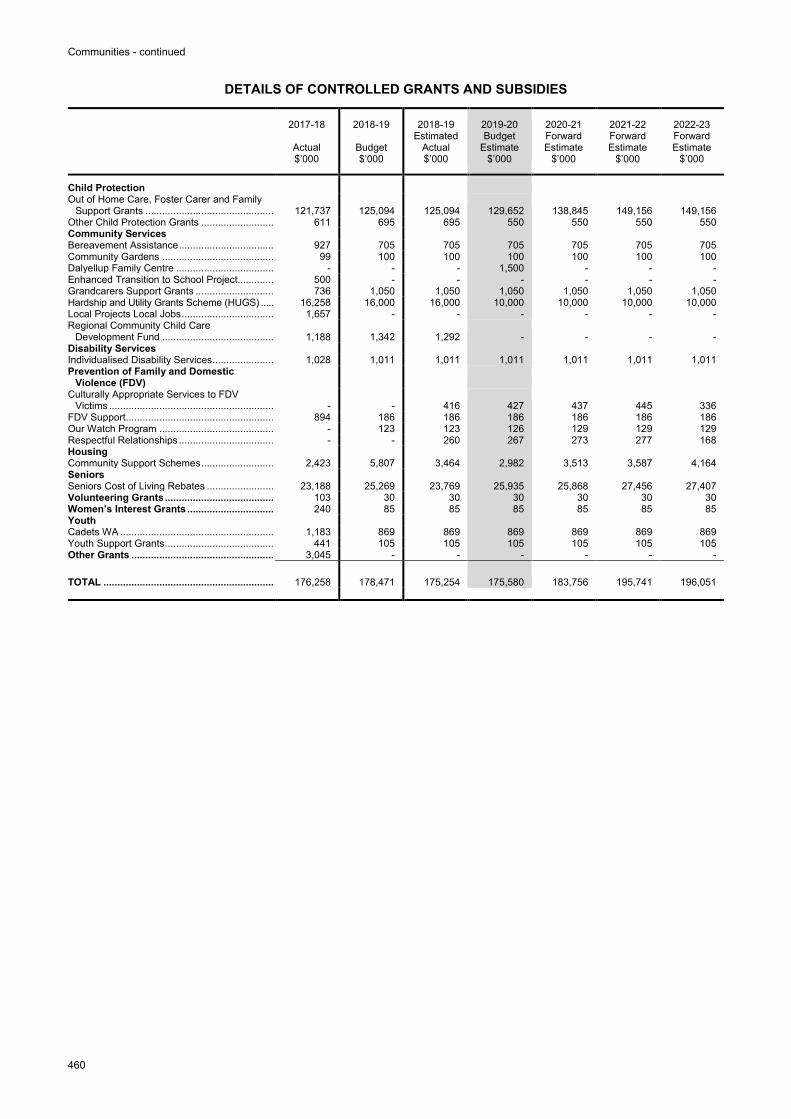
DETAILS OF CONTROLLED GRANTS AND SUBSIDIES
2017-18
Actual $’000
2018-19
Budget $’000
2018-19 Estimated
Actual $’000
2019-20 Budget
Estimate $’000
2020-21 Forward Estimate
$’000
2021-22 Forward Estimate
$’000
2022-23 Forward Estimate
$’000
Child Protection Out of Home Care, Foster Carer and Family
Support Grants .............................................. 121,737 125,094 125,094 129,652 138,845 149,156 149,156 Other Child Protection Grants .......................... 611 695 695 550 550 550 550 Community Services Bereavement Assistance .................................. 927 705 705 705 705 705 705 Community Gardens ........................................ 99 100 100 100 100 100 100 Dalyellup Family Centre ................................... - - - 1,500 - - - Enhanced Transition to School Project............. 500 - - - - - - Grandcarers Support Grants ............................ 736 1,050 1,050 1,050 1,050 1,050 1,050 Hardship and Utility Grants Scheme (HUGS) ..... 16,258 16,000 16,000 10,000 10,000 10,000 10,000 Local Projects Local Jobs ................................. 1,657 - - - - - - Regional Community Child Care
Development Fund ........................................ 1,188 1,342 1,292 - - - - Disability Services Individualised Disability Services ...................... 1,028 1,011 1,011 1,011 1,011 1,011 1,011 Prevention of Family and Domestic
Violence (FDV) Culturally Appropriate Services to FDV
Victims ........................................................... - - 416 427 437 445 336 FDV Support ..................................................... 894 186 186 186 186 186 186 Our Watch Program ......................................... - 123 123 126 129 129 129 Respectful Relationships .................................. - - 260 267 273 277 168 Housing Community Support Schemes .......................... 2,423 5,807 3,464 2,982 3,513 3,587 4,164 Seniors Seniors Cost of Living Rebates ........................ 23,188 25,269 23,769 25,935 25,868 27,456 27,407 Volunteering Grants ....................................... 103 30 30 30 30 30 30 Women’s Interest Grants ............................... 240 85 85 85 85 85 85 Youth Cadets WA ....................................................... 1,183 869 869 869 869 869 869 Youth Support Grants ....................................... 441 105 105 105 105 105 105 Other Grants ................................................... 3,045 - - - - - -
TOTAL ............................................................. 176,258 178,471 175,254 175,580 183,756 195,741 196,051
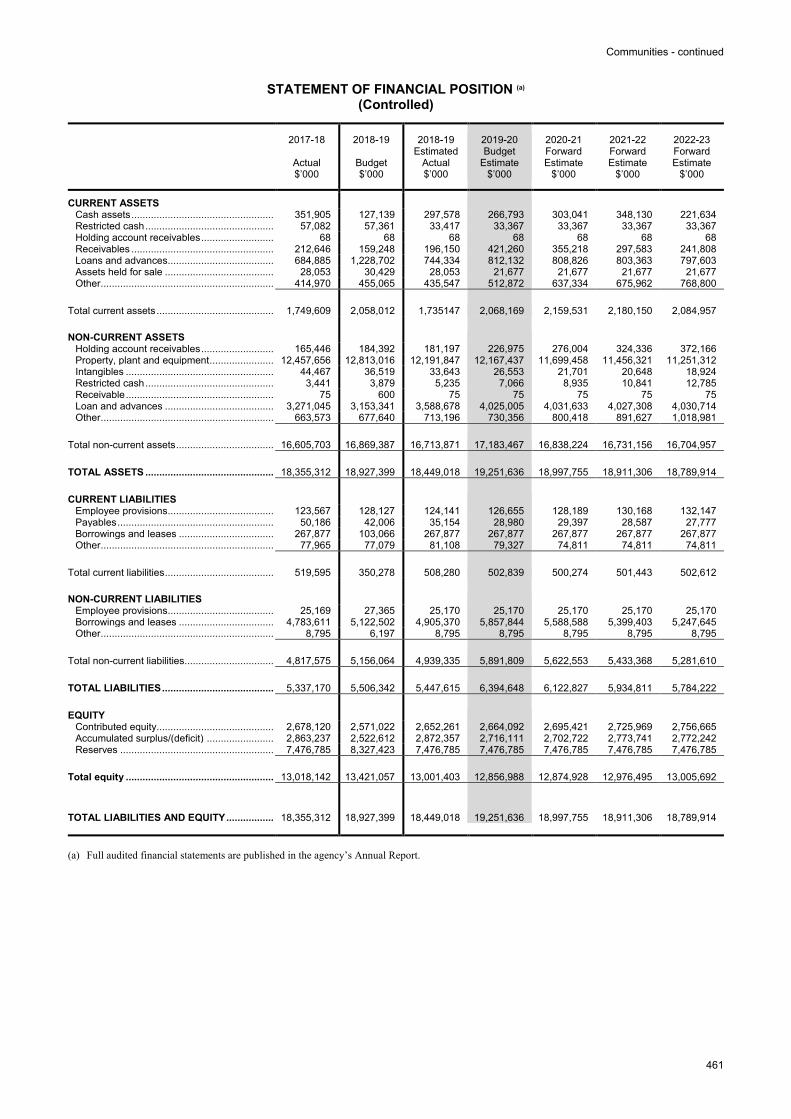
Communities - continued
461
STATEMENT OF FINANCIAL POSITION (a)
(Controlled)
2017-18
Actual $’000
2018-19
Budget $’000
2018-19 Estimated
Actual $’000
2019-20 Budget
Estimate $’000
2020-21 Forward Estimate
$’000
2021-22 Forward Estimate
$’000
2022-23 Forward Estimate
$’000
CURRENT ASSETS Cash assets ................................................... 351,905 127,139 297,578 266,793 303,041 348,130 221,634 Restricted cash .............................................. 57,082 57,361 33,417 33,367 33,367 33,367 33,367 Holding account receivables .......................... 68 68 68 68 68 68 68 Receivables ................................................... 212,646 159,248 196,150 421,260 355,218 297,583 241,808 Loans and advances ...................................... 684,885 1,228,702 744,334 812,132 808,826 803,363 797,603 Assets held for sale ....................................... 28,053 30,429 28,053 21,677 21,677 21,677 21,677 Other .............................................................. 414,970 455,065 435,547 512,872 637,334 675,962 768,800
Total current assets .......................................... 1,749,609 2,058,012 1,735147 2,068,169 2,159,531 2,180,150 2,084,957
NON-CURRENT ASSETS Holding account receivables .......................... 165,446 184,392 181,197 226,975 276,004 324,336 372,166 Property, plant and equipment ....................... 12,457,656 12,813,016 12,191,847 12,167,437 11,699,458 11,456,321 11,251,312 Intangibles ..................................................... 44,467 36,519 33,643 26,553 21,701 20,648 18,924 Restricted cash .............................................. 3,441 3,879 5,235 7,066 8,935 10,841 12,785 Receivable ..................................................... 75 600 75 75 75 75 75 Loan and advances ....................................... 3,271,045 3,153,341 3,588,678 4,025,005 4,031,633 4,027,308 4,030,714 Other .............................................................. 663,573 677,640 713,196 730,356 800,418 891,627 1,018,981
Total non-current assets ................................... 16,605,703 16,869,387 16,713,871 17,183,467 16,838,224 16,731,156 16,704,957
TOTAL ASSETS .............................................. 18,355,312 18,927,399 18,449,018 19,251,636 18,997,755 18,911,306 18,789,914
CURRENT LIABILITIES Employee provisions ...................................... 123,567 128,127 124,141 126,655 128,189 130,168 132,147 Payables ........................................................ 50,186 42,006 35,154 28,980 29,397 28,587 27,777 Borrowings and leases .................................. 267,877 103,066 267,877 267,877 267,877 267,877 267,877 Other .............................................................. 77,965 77,079 81,108 79,327 74,811 74,811 74,811
Total current liabilities ....................................... 519,595 350,278 508,280 502,839 500,274 501,443 502,612
NON-CURRENT LIABILITIES Employee provisions ...................................... 25,169 27,365 25,170 25,170 25,170 25,170 25,170 Borrowings and leases .................................. 4,783,611 5,122,502 4,905,370 5,857,844 5,588,588 5,399,403 5,247,645 Other .............................................................. 8,795 6,197 8,795 8,795 8,795 8,795 8,795
Total non-current liabilities ................................ 4,817,575 5,156,064 4,939,335 5,891,809 5,622,553 5,433,368 5,281,610
TOTAL LIABILITIES ........................................ 5,337,170 5,506,342 5,447,615 6,394,648 6,122,827 5,934,811 5,784,222
EQUITY Contributed equity .......................................... 2,678,120 2,571,022 2,652,261 2,664,092 2,695,421 2,725,969 2,756,665 Accumulated surplus/(deficit) ........................ 2,863,237 2,522,612 2,872,357 2,716,111 2,702,722 2,773,741 2,772,242 Reserves ....................................................... 7,476,785 8,327,423 7,476,785 7,476,785 7,476,785 7,476,785 7,476,785
Total equity ..................................................... 13,018,142 13,421,057 13,001,403 12,856,988 12,874,928 12,976,495 13,005,692
TOTAL LIABILITIES AND EQUITY ................. 18,355,312 18,927,399 18,449,018 19,251,636 18,997,755 18,911,306 18,789,914 (a) Full audited financial statements are published in the agency’s Annual Report.
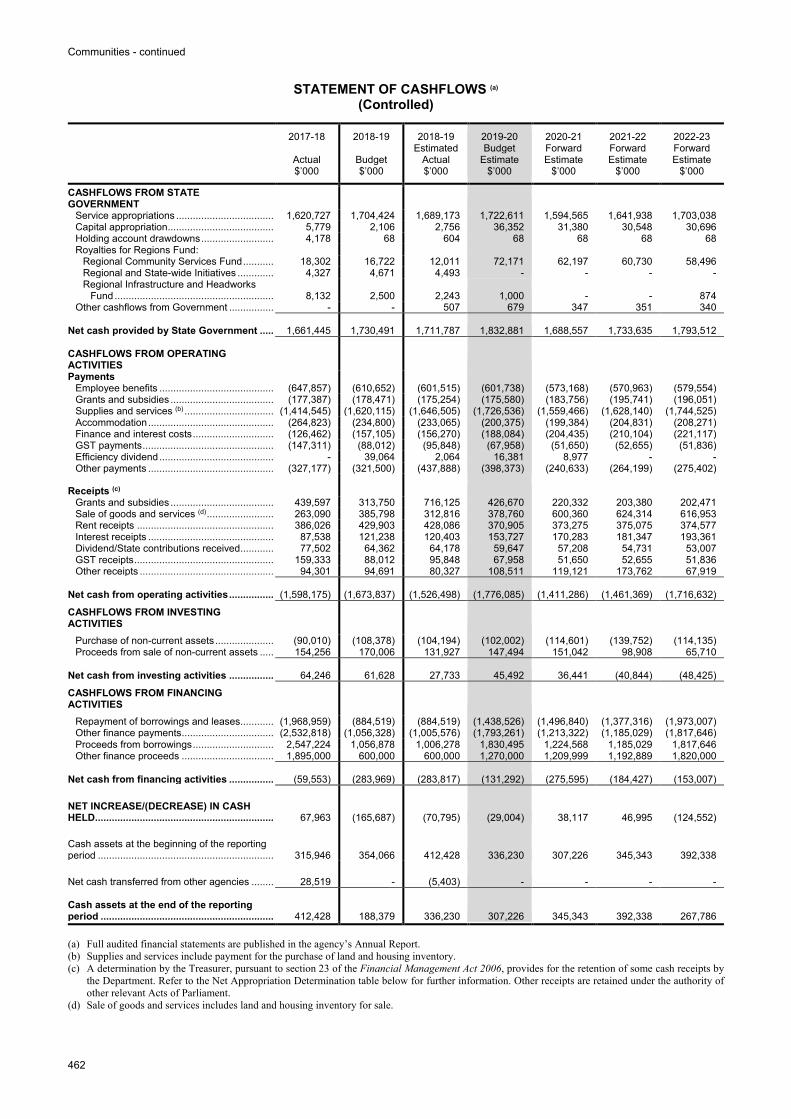
Communities - continued
462
STATEMENT OF CASHFLOWS (a)
(Controlled)
2017-18
Actual $’000
2018-19
Budget $’000
2018-19 Estimated
Actual $’000
2019-20 Budget
Estimate $’000
2020-21 Forward Estimate
$’000
2021-22 Forward Estimate
$’000
2022-23 Forward Estimate
$’000
CASHFLOWS FROM STATE GOVERNMENT
Service appropriations ................................... 1,620,727 1,704,424 1,689,173 1,722,611 1,594,565 1,641,938 1,703,038 Capital appropriation ...................................... 5,779 2,106 2,756 36,352 31,380 30,548 30,696 Holding account drawdowns .......................... 4,178 68 604 68 68 68 68 Royalties for Regions Fund:
Regional Community Services Fund ........... 18,302 16,722 12,011 72,171 62,197 60,730 58,496 Regional and State-wide Initiatives ............. 4,327 4,671 4,493 - - - - Regional Infrastructure and Headworks
Fund ......................................................... 8,132 2,500 2,243 1,000 - - 874 Other cashflows from Government ................ - - 507 679 347 351 340
Net cash provided by State Government ..... 1,661,445 1,730,491 1,711,787 1,832,881 1,688,557 1,733,635 1,793,512
CASHFLOWS FROM OPERATING ACTIVITIES Payments
Employee benefits ......................................... (647,857) (610,652) (601,515) (601,738) (573,168) (570,963) (579,554) Grants and subsidies ..................................... (177,387) (178,471) (175,254) (175,580) (183,756) (195,741) (196,051) Supplies and services (b) ................................ (1,414,545) (1,620,115) (1,646,505) (1,726,536) (1,559,466) (1,628,140) (1,744,525) Accommodation ............................................. (264,823) (234,800) (233,065) (200,375) (199,384) (204,831) (208,271) Finance and interest costs ............................. (126,462) (157,105) (156,270) (188,084) (204,435) (210,104) (221,117) GST payments ............................................... (147,311) (88,012) (95,848) (67,958) (51,650) (52,655) (51,836) Efficiency dividend ......................................... - 39,064 2,064 16,381 8,977 - - Other payments ............................................. (327,177) (321,500) (437,888) (398,373) (240,633) (264,199) (275,402)
Receipts (c) Grants and subsidies ..................................... 439,597 313,750 716,125 426,670 220,332 203,380 202,471 Sale of goods and services (d) ........................ 263,090 385,798 312,816 378,760 600,360 624,314 616,953 Rent receipts ................................................. 386,026 429,903 428,086 370,905 373,275 375,075 374,577 Interest receipts ............................................. 87,538 121,238 120,403 153,727 170,283 181,347 193,361 Dividend/State contributions received ............ 77,502 64,362 64,178 59,647 57,208 54,731 53,007 GST receipts .................................................. 159,333 88,012 95,848 67,958 51,650 52,655 51,836 Other receipts ................................................ 94,301 94,691 80,327 108,511 119,121 173,762 67,919
Net cash from operating activities ................ (1,598,175) (1,673,837) (1,526,498) (1,776,085) (1,411,286) (1,461,369) (1,716,632)
CASHFLOWS FROM INVESTING ACTIVITIES
Purchase of non-current assets ..................... (90,010) (108,378) (104,194) (102,002) (114,601) (139,752) (114,135) Proceeds from sale of non-current assets ..... 154,256 170,006 131,927 147,494 151,042 98,908 65,710
Net cash from investing activities ................ 64,246 61,628 27,733 45,492 36,441 (40,844) (48,425)
CASHFLOWS FROM FINANCING ACTIVITIES
Repayment of borrowings and leases ............ (1,968,959) (884,519) (884,519) (1,438,526) (1,496,840) (1,377,316) (1,973,007) Other finance payments ................................. (2,532,818) (1,056,328) (1,005,576) (1,793,261) (1,213,322) (1,185,029) (1,817,646) Proceeds from borrowings ............................. 2,547,224 1,056,878 1,006,278 1,830,495 1,224,568 1,185,029 1,817,646 Other finance proceeds ................................. 1,895,000 600,000 600,000 1,270,000 1,209,999 1,192,889 1,820,000
Net cash from financing activities ................ (59,553) (283,969) (283,817) (131,292) (275,595) (184,427) (153,007)
NET INCREASE/(DECREASE) IN CASH HELD................................................................ 67,963 (165,687) (70,795) (29,004) 38,117 46,995 (124,552)
Cash assets at the beginning of the reporting period ............................................................... 315,946 354,066 412,428 336,230 307,226 345,343 392,338
Net cash transferred from other agencies ........ 28,519 - (5,403) - - - -
Cash assets at the end of the reporting period .............................................................. 412,428 188,379 336,230 307,226 345,343 392,338 267,786
(a) Full audited financial statements are published in the agency’s Annual Report. (b) Supplies and services include payment for the purchase of land and housing inventory. (c) A determination by the Treasurer, pursuant to section 23 of the Financial Management Act 2006, provides for the retention of some cash receipts by
the Department. Refer to the Net Appropriation Determination table below for further information. Other receipts are retained under the authority of other relevant Acts of Parliament.
(d) Sale of goods and services includes land and housing inventory for sale.
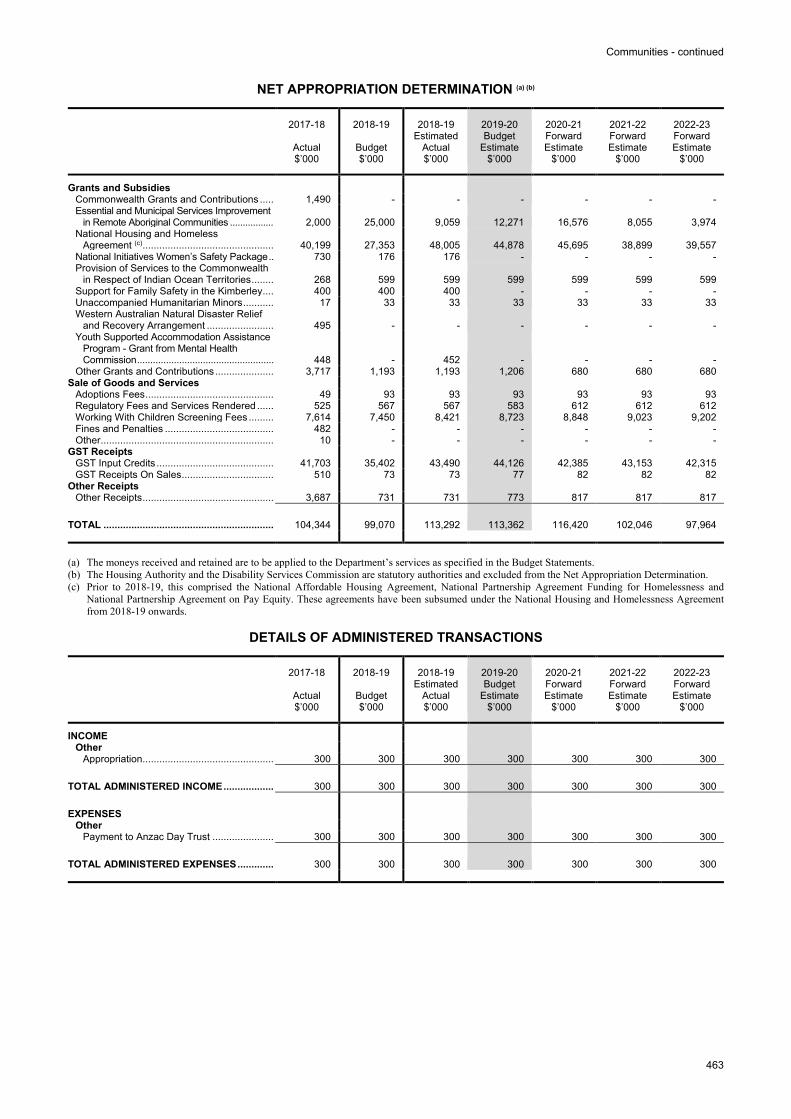
Communities - continued
463
NET APPROPRIATION DETERMINATION (a) (b)
2017-18
Actual $’000
2018-19
Budget $’000
2018-19 Estimated
Actual $’000
2019-20 Budget
Estimate $’000
2020-21 Forward Estimate
$’000
2021-22 Forward Estimate
$’000
2022-23 Forward Estimate
$’000
Grants and Subsidies Commonwealth Grants and Contributions ..... 1,490 - - - - - - Essential and Municipal Services Improvement
in Remote Aboriginal Communities ................. 2,000 25,000 9,059 12,271 16,576 8,055 3,974 National Housing and Homeless
Agreement (c) ............................................... 40,199 27,353 48,005 44,878 45,695 38,899 39,557 National Initiatives Women’s Safety Package .. 730 176 176 - - - - Provision of Services to the Commonwealth
in Respect of Indian Ocean Territories ........ 268 599 599 599 599 599 599 Support for Family Safety in the Kimberley .... 400 400 400 - - - - Unaccompanied Humanitarian Minors ........... 17 33 33 33 33 33 33 Western Australian Natural Disaster Relief
and Recovery Arrangement ........................ 495 - - - - - - Youth Supported Accommodation Assistance
Program - Grant from Mental Health Commission .................................................... 448 - 452 - - - -
Other Grants and Contributions ..................... 3,717 1,193 1,193 1,206 680 680 680 Sale of Goods and Services
Adoptions Fees .............................................. 49 93 93 93 93 93 93 Regulatory Fees and Services Rendered ...... 525 567 567 583 612 612 612 Working With Children Screening Fees ......... 7,614 7,450 8,421 8,723 8,848 9,023 9,202 Fines and Penalties ....................................... 482 - - - - - - Other .............................................................. 10 - - - - - -
GST Receipts GST Input Credits .......................................... 41,703 35,402 43,490 44,126 42,385 43,153 42,315 GST Receipts On Sales ................................. 510 73 73 77 82 82 82
Other Receipts Other Receipts ............................................... 3,687 731 731 773 817 817 817
TOTAL ............................................................. 104,344 99,070 113,292 113,362 116,420 102,046 97,964 (a) The moneys received and retained are to be applied to the Department’s services as specified in the Budget Statements. (b) The Housing Authority and the Disability Services Commission are statutory authorities and excluded from the Net Appropriation Determination. (c) Prior to 2018-19, this comprised the National Affordable Housing Agreement, National Partnership Agreement Funding for Homelessness and
National Partnership Agreement on Pay Equity. These agreements have been subsumed under the National Housing and Homelessness Agreement from 2018-19 onwards.
DETAILS OF ADMINISTERED TRANSACTIONS
2017-18
Actual $’000
2018-19
Budget $’000
2018-19 Estimated
Actual $’000
2019-20 Budget
Estimate $’000
2020-21 Forward Estimate
$’000
2021-22 Forward Estimate
$’000
2022-23 Forward Estimate
$’000
INCOME Other
Appropriation ............................................... 300 300 300 300 300 300 300
TOTAL ADMINISTERED INCOME .................. 300 300 300 300 300 300 300
EXPENSES Other
Payment to Anzac Day Trust ...................... 300 300 300 300 300 300 300
TOTAL ADMINISTERED EXPENSES ............. 300 300 300 300 300 300 300
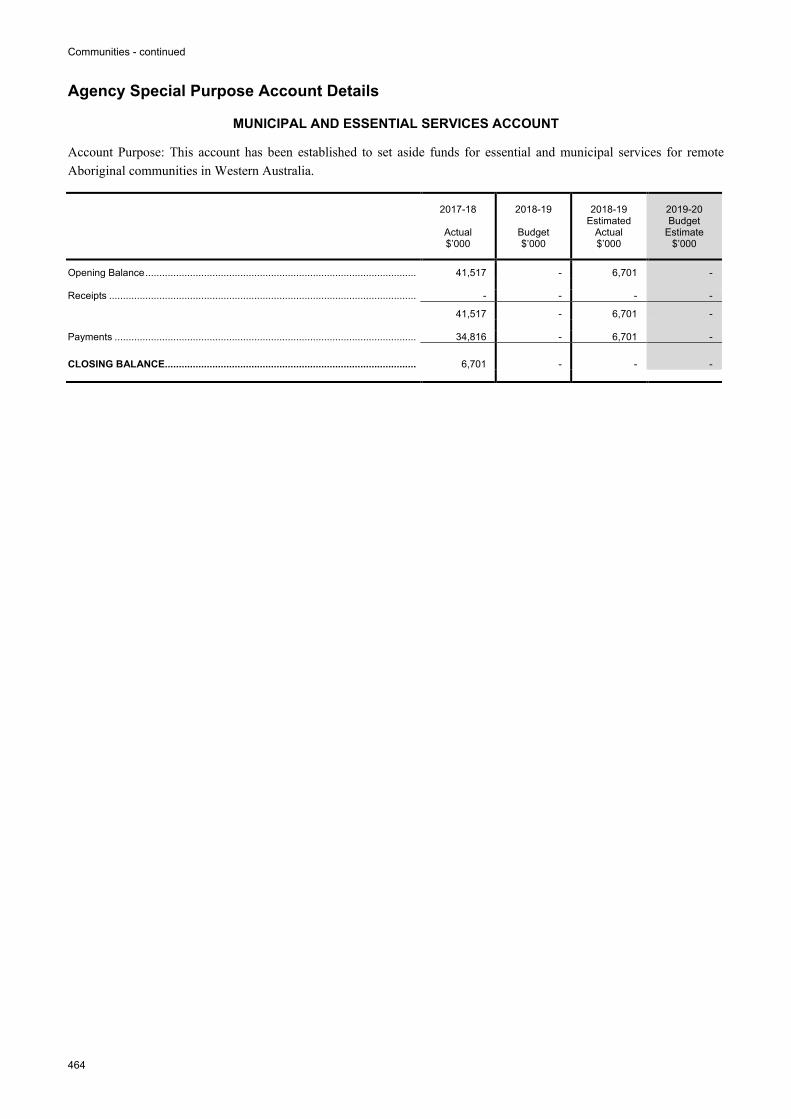
Communities - continued
464
Agency Special Purpose Account Details
MUNICIPAL AND ESSENTIAL SERVICES ACCOUNT
Account Purpose: This account has been established to set aside funds for essential and municipal services for remote Aboriginal communities in Western Australia.
2017-18
Actual $’000
2018-19
Budget $’000
2018-19 Estimated
Actual $’000
2019-20 Budget
Estimate $’000
Opening Balance ................................................................................................. 41,517 - 6,701 - Receipts .............................................................................................................. - - - - 41,517 - 6,701 - Payments ............................................................................................................ 34,816 - 6,701 -
CLOSING BALANCE.......................................................................................... 6,701 - - -
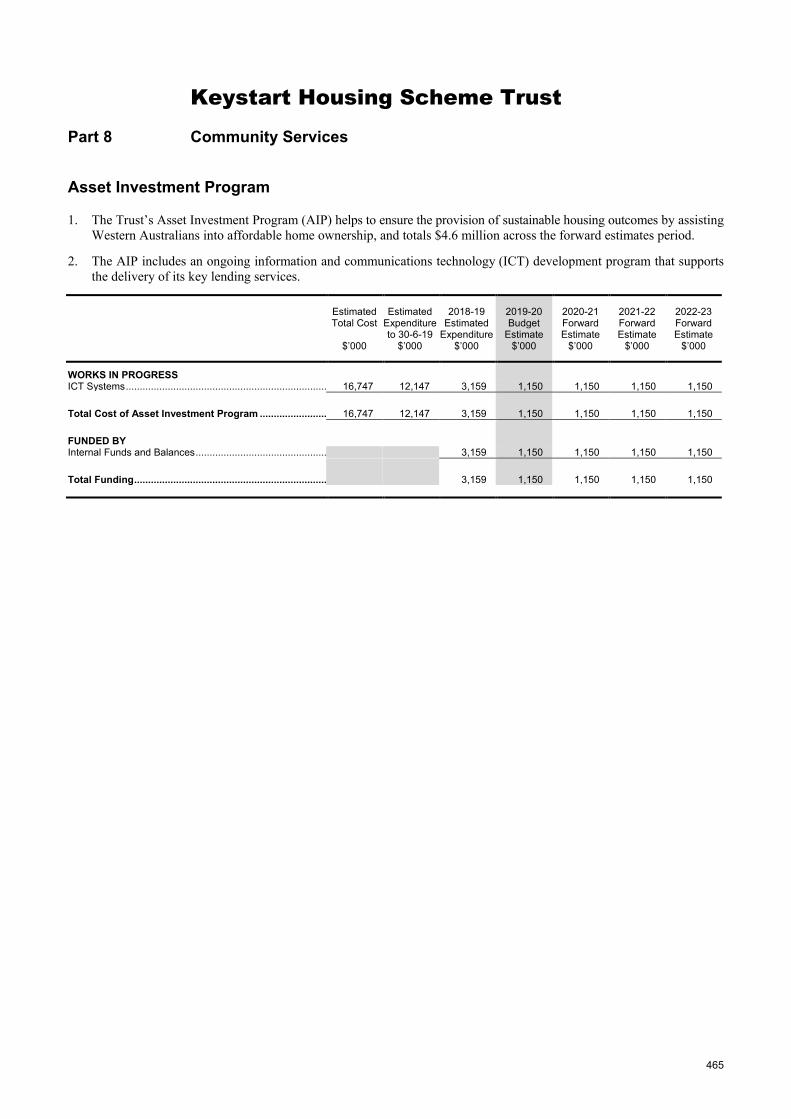
465
Keystart Housing Scheme Trust
Part 8 Community Services
Asset Investment Program
1. The Trust’s Asset Investment Program (AIP) helps to ensure the provision of sustainable housing outcomes by assisting Western Australians into affordable home ownership, and totals $4.6 million across the forward estimates period.
2. The AIP includes an ongoing information and communications technology (ICT) development program that supports the delivery of its key lending services.
Estimated Total Cost
$’000
Estimated Expenditure to 30-6-19
$’000
2018-19 Estimated
Expenditure $’000
2019-20 Budget
Estimate $’000
2020-21 Forward Estimate
$’000
2021-22 Forward Estimate
$’000
2022-23 Forward Estimate
$’000
WORKS IN PROGRESS ICT Systems ........................................................................ 16,747 12,147 3,159 1,150 1,150 1,150 1,150
Total Cost of Asset Investment Program ........................ 16,747 12,147 3,159 1,150 1,150 1,150 1,150
FUNDED BY Internal Funds and Balances ............................................... 3,159 1,150 1,150 1,150 1,150
Total Funding ..................................................................... 3,159 1,150 1,150 1,150 1,150
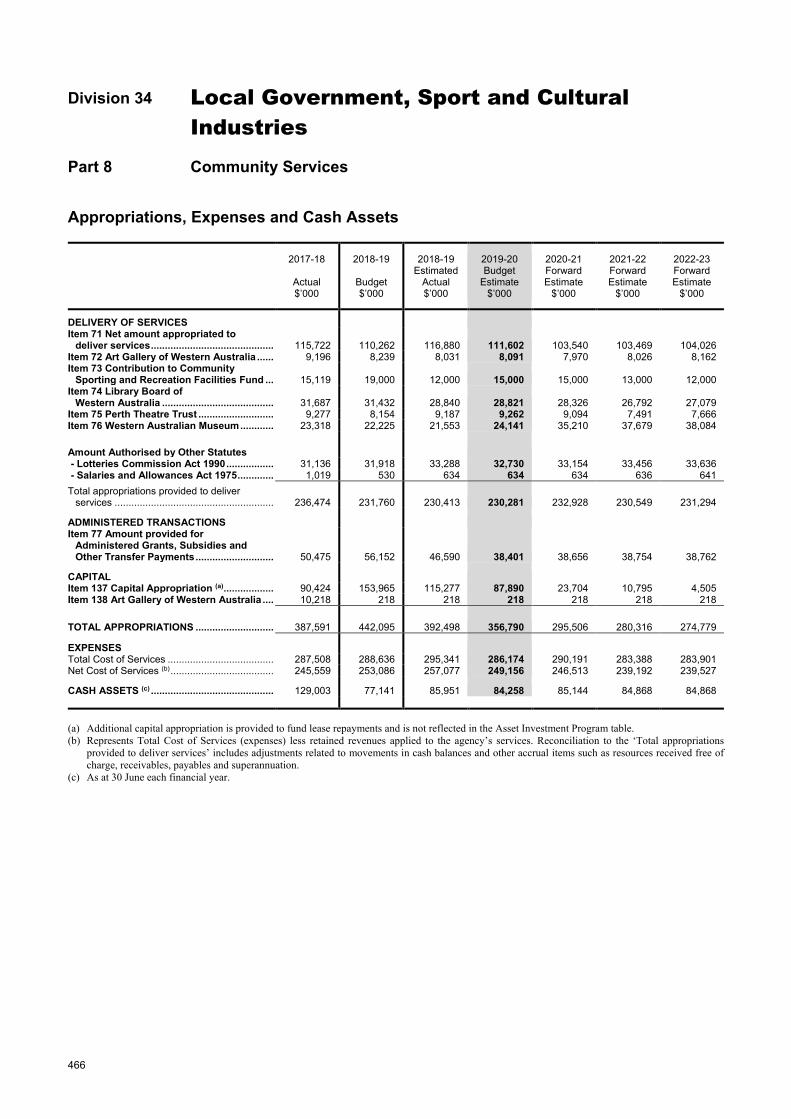
466
Division 34 Local Government, Sport and Cultural Industries
Part 8 Community Services
Appropriations, Expenses and Cash Assets
2017-18
Actual $’000
2018-19
Budget $’000
2018-19 Estimated
Actual $’000
2019-20 Budget
Estimate $’000
2020-21 Forward Estimate
$’000
2021-22 Forward Estimate
$’000
2022-23 Forward Estimate
$’000
DELIVERY OF SERVICES Item 71 Net amount appropriated to
deliver services ............................................ 115,722 110,262 116,880 111,602 103,540 103,469 104,026 Item 72 Art Gallery of Western Australia ...... 9,196 8,239 8,031 8,091 7,970 8,026 8,162 Item 73 Contribution to Community
Sporting and Recreation Facilities Fund ... 15,119 19,000 12,000 15,000 15,000 13,000 12,000 Item 74 Library Board of
Western Australia ........................................ 31,687 31,432 28,840 28,821 28,326 26,792 27,079 Item 75 Perth Theatre Trust ........................... 9,277 8,154 9,187 9,262 9,094 7,491 7,666 Item 76 Western Australian Museum ............ 23,318 22,225 21,553 24,141 35,210 37,679 38,084
Amount Authorised by Other Statutes - Lotteries Commission Act 1990 ................. 31,136 31,918 33,288 32,730 33,154 33,456 33,636 - Salaries and Allowances Act 1975 ............. 1,019 530 634 634 634 636 641 Total appropriations provided to deliver
services ......................................................... 236,474 231,760 230,413 230,281 232,928 230,549 231,294
ADMINISTERED TRANSACTIONS Item 77 Amount provided for
Administered Grants, Subsidies and Other Transfer Payments ............................ 50,475 56,152 46,590 38,401 38,656 38,754 38,762
CAPITAL Item 137 Capital Appropriation (a) .................. 90,424 153,965 115,277 87,890 23,704 10,795 4,505 Item 138 Art Gallery of Western Australia .... 10,218 218 218 218 218 218 218
TOTAL APPROPRIATIONS ............................ 387,591 442,095 392,498 356,790 295,506 280,316 274,779
EXPENSES Total Cost of Services ...................................... 287,508 288,636 295,341 286,174 290,191 283,388 283,901 Net Cost of Services (b) ..................................... 245,559 253,086 257,077 249,156 246,513 239,192 239,527
CASH ASSETS (c) ............................................ 129,003 77,141 85,951 84,258 85,144 84,868 84,868 (a) Additional capital appropriation is provided to fund lease repayments and is not reflected in the Asset Investment Program table. (b) Represents Total Cost of Services (expenses) less retained revenues applied to the agency’s services. Reconciliation to the ‘Total appropriations
provided to deliver services’ includes adjustments related to movements in cash balances and other accrual items such as resources received free of charge, receivables, payables and superannuation.
(c) As at 30 June each financial year.
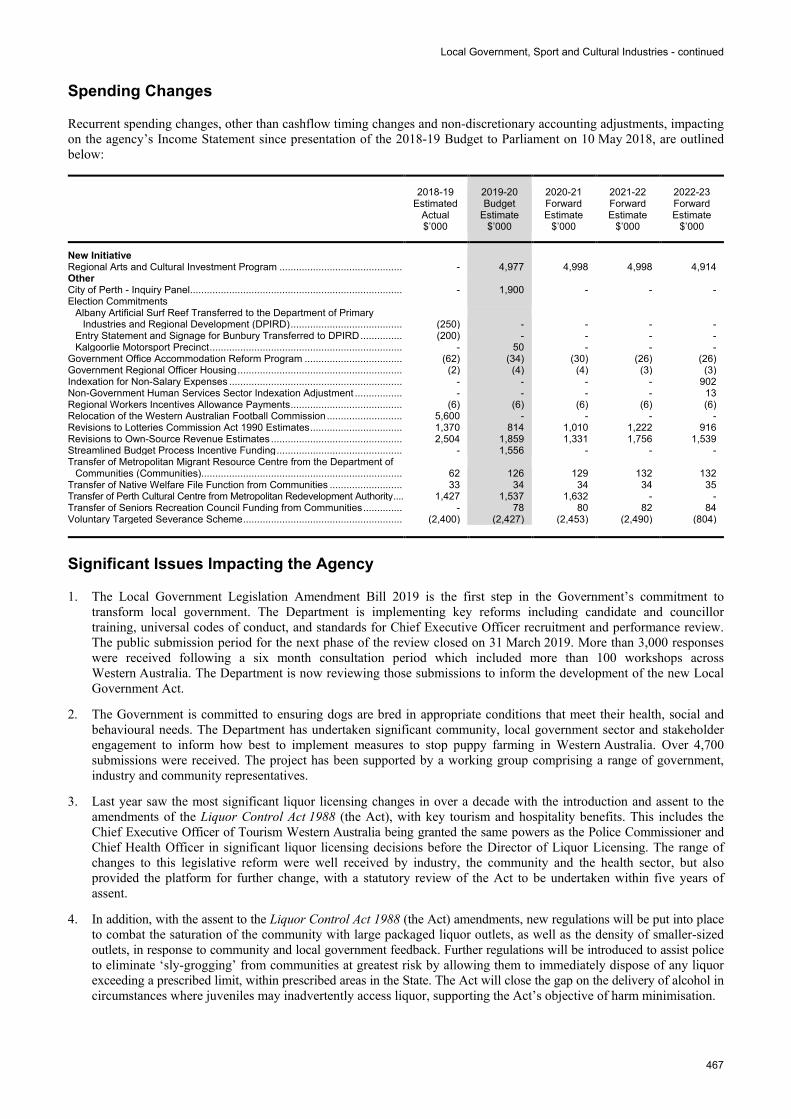
Local Government, Sport and Cultural Industries - continued
467
Spending Changes
Recurrent spending changes, other than cashflow timing changes and non-discretionary accounting adjustments, impacting on the agency’s Income Statement since presentation of the 2018-19 Budget to Parliament on 10 May 2018, are outlined below:
2018-19 Estimated
Actual $’000
2019-20 Budget
Estimate $’000
2020-21 Forward Estimate
$’000
2021-22 Forward Estimate
$’000
2022-23 Forward Estimate
$’000
New Initiative Regional Arts and Cultural Investment Program ............................................. - 4,977 4,998 4,998 4,914 Other City of Perth - Inquiry Panel ............................................................................. - 1,900 - - - Election Commitments
Albany Artificial Surf Reef Transferred to the Department of Primary Industries and Regional Development (DPIRD) ......................................... (250) - - - -
Entry Statement and Signage for Bunbury Transferred to DPIRD ................ (200) - - - - Kalgoorlie Motorsport Precinct ...................................................................... - 50 - - -
Government Office Accommodation Reform Program .................................... (62) (34) (30) (26) (26) Government Regional Officer Housing ............................................................ (2) (4) (4) (3) (3) Indexation for Non-Salary Expenses ............................................................... - - - - 902 Non-Government Human Services Sector Indexation Adjustment .................. - - - - 13 Regional Workers Incentives Allowance Payments ......................................... (6) (6) (6) (6) (6) Relocation of the Western Australian Football Commission ............................ 5,600 - - - - Revisions to Lotteries Commission Act 1990 Estimates .................................. 1,370 814 1,010 1,222 916 Revisions to Own-Source Revenue Estimates ................................................ 2,504 1,859 1,331 1,756 1,539 Streamlined Budget Process Incentive Funding .............................................. - 1,556 - - - Transfer of Metropolitan Migrant Resource Centre from the Department of
Communities (Communities)......................................................................... 62 126 129 132 132 Transfer of Native Welfare File Function from Communities ........................... 33 34 34 34 35 Transfer of Perth Cultural Centre from Metropolitan Redevelopment Authority .... 1,427 1,537 1,632 - - Transfer of Seniors Recreation Council Funding from Communities ............... - 78 80 82 84 Voluntary Targeted Severance Scheme .......................................................... (2,400) (2,427) (2,453) (2,490) (804)
Significant Issues Impacting the Agency
1. The Local Government Legislation Amendment Bill 2019 is the first step in the Government’s commitment to transform local government. The Department is implementing key reforms including candidate and councillor training, universal codes of conduct, and standards for Chief Executive Officer recruitment and performance review. The public submission period for the next phase of the review closed on 31 March 2019. More than 3,000 responses were received following a six month consultation period which included more than 100 workshops across Western Australia. The Department is now reviewing those submissions to inform the development of the new Local Government Act.
2. The Government is committed to ensuring dogs are bred in appropriate conditions that meet their health, social and behavioural needs. The Department has undertaken significant community, local government sector and stakeholder engagement to inform how best to implement measures to stop puppy farming in Western Australia. Over 4,700 submissions were received. The project has been supported by a working group comprising a range of government, industry and community representatives.
3. Last year saw the most significant liquor licensing changes in over a decade with the introduction and assent to the amendments of the Liquor Control Act 1988 (the Act), with key tourism and hospitality benefits. This includes the Chief Executive Officer of Tourism Western Australia being granted the same powers as the Police Commissioner and Chief Health Officer in significant liquor licensing decisions before the Director of Liquor Licensing. The range of changes to this legislative reform were well received by industry, the community and the health sector, but also provided the platform for further change, with a statutory review of the Act to be undertaken within five years of assent.
4. In addition, with the assent to the Liquor Control Act 1988 (the Act) amendments, new regulations will be put into place to combat the saturation of the community with large packaged liquor outlets, as well as the density of smaller-sized outlets, in response to community and local government feedback. Further regulations will be introduced to assist police to eliminate ‘sly-grogging’ from communities at greatest risk by allowing them to immediately dispose of any liquor exceeding a prescribed limit, within prescribed areas in the State. The Act will close the gap on the delivery of alcohol in circumstances where juveniles may inadvertently access liquor, supporting the Act’s objective of harm minimisation.
Local Government, Sport and Cultural Industries - continued
468
5. In January 2019, following an inquiry to consider the ongoing extent of alcohol-related harm in the Pilbara region, the Director of Liquor Licensing determined to impose new liquor restrictions across the region. The planned effective date for restrictions is 27 May 2019. A review of the decision to impose restrictions has been made to the Liquor Commission. Restrictions are intended to be reviewed after they have been in operation for two years.
6. In line with the Government’s West Pilbara Trauma Response Plan to address deeply entrenched community issues, a Banned Drinkers Register (the Register) trial, focusing on problem drinkers who have attracted the attention of police, will commence in the Pilbara as soon as practicable. The proposal incorporates an electronic system designed to identify persons who are not permitted to purchase liquor. Learning from the Northern Territory, Queensland and other similar projects, the Department will pilot the Register in the Pilbara to identify gaps in managing alcohol problems with the aim of targeting and assisting the people with the greatest need. The Register trial, along with the liquor restrictions in the Pilbara, will act as complementary measures to try to combat harm from alcohol misuse.
7. The Coroner’s report into Aboriginal Youth Suicide in the Kimberley, released on 7 February 2019, included a recommendation for the implementation of consistent Kimberley-wide liquor restrictions. As a consequence of the Coroner’s recommendation, the Director of Liquor Licensing will be engaging with stakeholders in the Kimberley to consider the effectiveness of the current restrictions.
8. The Department is continuing to develop its licensing systems to deliver more services online. Online services will shortly include all applications for permanent liquor licences and will provide the ability for applications to be lodged at any time. Further improvements will allow applicants to be able to track the progress of their applications from submission to final approval.
9. The Department is contributing to the formulation and drafting of new legislation relating to the potential sale of the Western Australian TAB and to establish a new regulatory framework for a private operator.
10. With the introduction of a point of consumption tax in Western Australia, the Government has assured $3.7 million per annum indexed over the forward estimates period as a replacement for the revenue formally derived through sports betting with the TAB. This has provided greater certainty of funding available to community sport and recreation through the Sports Wagering Account.
11. The Department has commenced implementing the $3 million Contemporary Music Fund, providing funding and opportunities for music artists and enabling safer and more vibrant venues. This will considerably improve the economic and social output of the contemporary music industry.
12. The new Regional Arts and Culture Investment Program (RACIP) will deliver almost $20 million in funding to regional Western Australia over the next four years. This investment will strengthen regional economies by providing employment opportunities in the creative sector. The program will increase the capacity for the regions to engage with arts and culture, improving the social cohesion, liveability and vibrancy of local communities.
13. The RACIP will empower communities to engage with arts and culture, building the social cohesion, liveability and vibrancy of the regions. Over $1 million will be allocated to leverage creative and cultural planning, allowing regional local governments to develop the creative and cultural industries in line with community needs. The program will increase inclusion in arts and cultural activities through supporting arts and disability practices and culturally and linguistically diverse arts practices.
14. The RACIP program complements the Government’s $8 million investment in the Regional Exhibitions Touring Boost, which is already delivering the State Collection to our regional galleries. The Art Gallery of Western Australia, in partnership with ART ON THE MOVE, will deliver a series of travelling exhibitions as part of this election commitment. The aim of the Regional Exhibitions Touring Boost is to share Western Australian culture more widely within the State ensuring that our regional communities get access to the highest quality arts experiences and can attract visitors, by touring more high-quality visual arts exhibitions.
15. The New Museum content design for exhibitions and other interior spaces focuses on contemporary and engaging museum experiences. Exhibit production has commenced, and the new facilities’ exhibition and other interior spaces will be fitted out during 2020. The Government allocated $250,000 per annum over four years, commencing in 2018-19, to support the promotion and attraction of visitors to regional museums and collections, maximising the value of these cultural resources to their own communities and as tourism assets. Working in collaboration with the Collections Sector Working Group, representing galleries, libraries, archives and museums, the Western Australian Museum has advanced planning and delivery of three initiatives: Training, Collections WA and Visitor Portal for Collections.
Local Government, Sport and Cultural Industries - continued
469
16. Works are underway to modernise His Majesty’s Theatre’s infrastructure and public spaces to maintain it as a world-class premier venue for opera, dance and theatre. Works to the Theatre’s public areas will improve public amenity, whilst providing more hospitality opportunities, making the venue tourist ready and ensuring its future as the home of the West Australian Opera and West Australian Ballet.
17. To meet growing community demand for access to information in digital format, the State Library of Western Australia (SLWA) is increasing its capacity to collect, create and manage digital format materials and skill its workforce accordingly. The SLWA is planning to address the need for a digital preservation management system to store, preserve and make accessible these digital materials for future generations.
18. As part of the implementation of the WA Public Libraries Strategy, the Library Board of Western Australia is leading the development of a new model to support public library service delivery in Western Australia. The new model will guide the evolution of public library services so that they remain efficient, sustainable and relevant to meet the knowledge, literacy and learning needs of Western Australians today and into the future.
19. A review of practices relating to weight cutting of contestants is being undertaken by the Combat Sports Commission. The review made a number of recommendations relating to the safety and welfare of contestants when preparing for, and participating in, a contest. The Commission is currently in the process of implementing its dehydration and weight cutting strategy and anticipates this to be achieved during 2019-20.
20. Investment in the Community Sporting and Recreation Facilities Fund assists local government and community sporting clubs to develop sport and recreation facilities to support participation. The Government has prioritised the development of female-friendly change room facilities to support the growth in women’s football, cricket, hockey, netball and many other sports. Projects supported include the Wanneroo City Soccer Club, Lilac Hill Pavilion in the City of Swan, Melville Hockey Club and Koorana Reserve in the City of Rockingham.
21. In 2019-20, the Government is implementing a targeted policy to increase the number of women on Boards in Western Australia’s sport and active recreation governing bodies. The establishment of the Gender Diversity Advisor Group by the Department and the Case for Change report outlines the economic, cultural and social benefits to be found with a more balanced leadership structure.
22. Western Australia adopted a coordinated and collaborative, cross-agency approach to progress the implementation of recommendations from the Royal Commission into Institutional Responses to Child Sexual Abuse. The Department is proactively working with peak industry bodies across its sectors to consult and advise on the potential impacts of proposed child safeguarding reforms.
23. Western Australia is home to people originating from more than 190 countries, speaking over 240 languages, including Aboriginal languages, and identifying with more than 130 faith groups. With almost one-third of Western Australia’s population born overseas, cultural, linguistic and religious diversity is at the heart of our identity. While this contributes to Western Australia being a thriving State, it also brings challenges. The Department will focus resources on building intercultural understanding, encouraging mutual respect and countering racism and discrimination. In recognition of the importance of multiculturalism, and to ensure that Western Australians from culturally and linguistically diverse backgrounds have equitable access to appropriate services in order to actively participate in and contribute to the economic, social and cultural development of our State, a Multicultural Policy Framework for the Western Australian public sector is being developed, with implementation to be driven by the Office of Multicultural Interests.
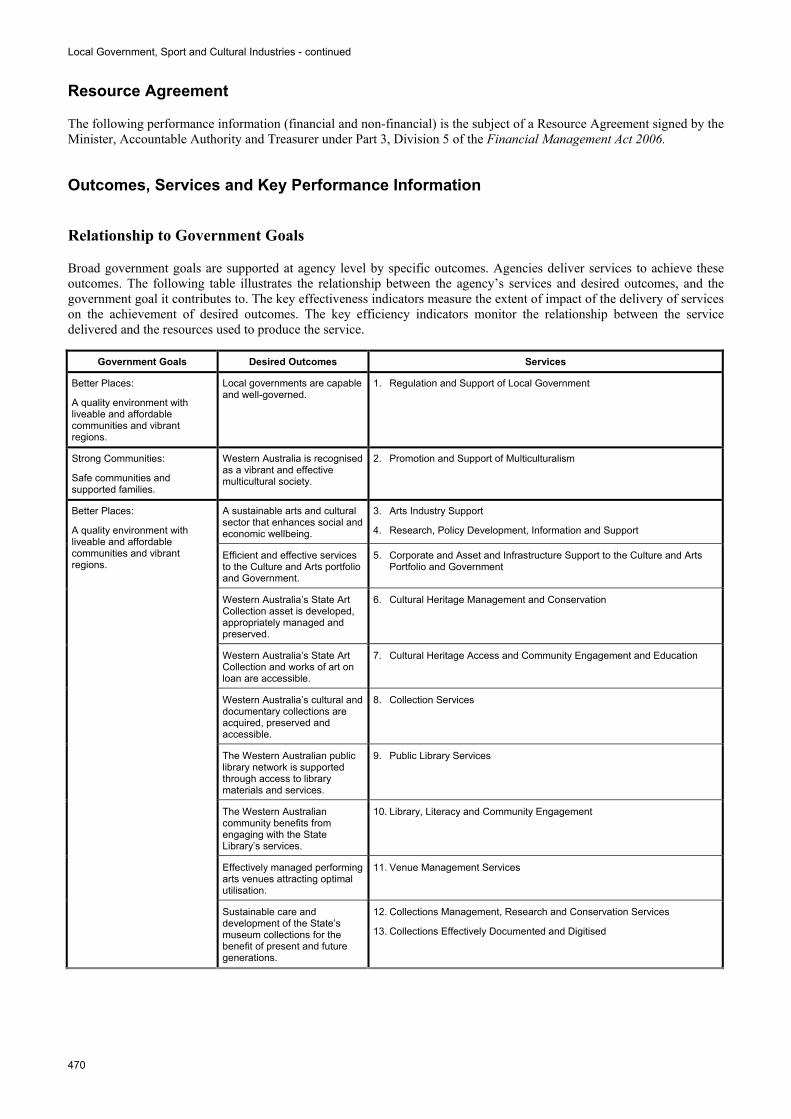
Local Government, Sport and Cultural Industries - continued
470
Resource Agreement
The following performance information (financial and non-financial) is the subject of a Resource Agreement signed by the Minister, Accountable Authority and Treasurer under Part 3, Division 5 of the Financial Management Act 2006.
Outcomes, Services and Key Performance Information
Relationship to Government Goals
Broad government goals are supported at agency level by specific outcomes. Agencies deliver services to achieve these outcomes. The following table illustrates the relationship between the agency’s services and desired outcomes, and the government goal it contributes to. The key effectiveness indicators measure the extent of impact of the delivery of services on the achievement of desired outcomes. The key efficiency indicators monitor the relationship between the service delivered and the resources used to produce the service.
Government Goals Desired Outcomes Services
Better Places:
A quality environment with liveable and affordable communities and vibrant regions.
Local governments are capable and well-governed.
1. Regulation and Support of Local Government
Strong Communities:
Safe communities and supported families.
Western Australia is recognised as a vibrant and effective multicultural society.
2. Promotion and Support of Multiculturalism
Better Places:
A quality environment with liveable and affordable communities and vibrant regions.
A sustainable arts and cultural sector that enhances social and economic wellbeing.
3. Arts Industry Support
4. Research, Policy Development, Information and Support
Efficient and effective services to the Culture and Arts portfolio and Government.
5. Corporate and Asset and Infrastructure Support to the Culture and Arts Portfolio and Government
Western Australia’s State Art Collection asset is developed, appropriately managed and preserved.
6. Cultural Heritage Management and Conservation
Western Australia’s State Art Collection and works of art on loan are accessible.
7. Cultural Heritage Access and Community Engagement and Education
Western Australia’s cultural and documentary collections are acquired, preserved and accessible.
8. Collection Services
The Western Australian public library network is supported through access to library materials and services.
9. Public Library Services
The Western Australian community benefits from engaging with the State Library’s services.
10. Library, Literacy and Community Engagement
Effectively managed performing arts venues attracting optimal utilisation.
11. Venue Management Services
Sustainable care and development of the State’s museum collections for the benefit of present and future generations.
12. Collections Management, Research and Conservation Services
13. Collections Effectively Documented and Digitised
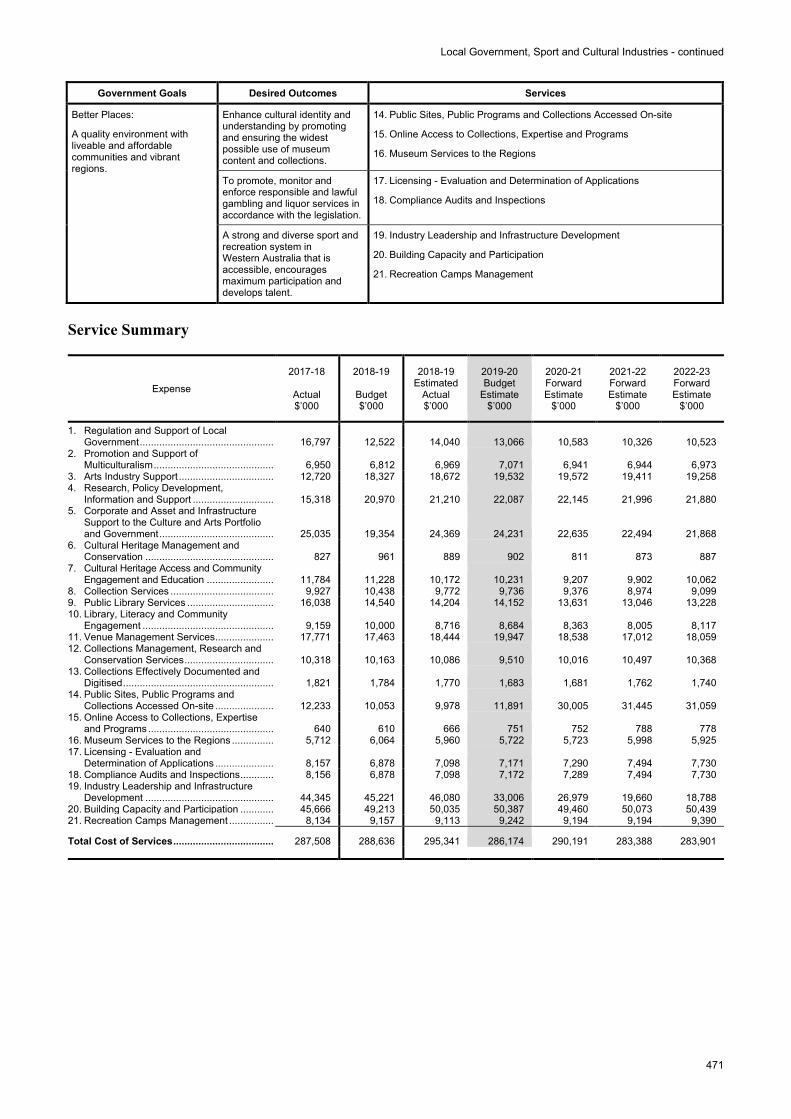
Local Government, Sport and Cultural Industries - continued
471
Government Goals Desired Outcomes Services
Better Places:
A quality environment with liveable and affordable communities and vibrant regions.
Enhance cultural identity and understanding by promoting and ensuring the widest possible use of museum content and collections.
14. Public Sites, Public Programs and Collections Accessed On-site
15. Online Access to Collections, Expertise and Programs
16. Museum Services to the Regions
To promote, monitor and enforce responsible and lawful gambling and liquor services in accordance with the legislation.
17. Licensing - Evaluation and Determination of Applications
18. Compliance Audits and Inspections
A strong and diverse sport and recreation system in Western Australia that is accessible, encourages maximum participation and develops talent.
19. Industry Leadership and Infrastructure Development
20. Building Capacity and Participation
21. Recreation Camps Management
Service Summary
Expense
2017-18
Actual $’000
2018-19
Budget $’000
2018-19 Estimated
Actual $’000
2019-20 Budget
Estimate $’000
2020-21 Forward Estimate
$’000
2021-22 Forward Estimate
$’000
2022-23 Forward Estimate
$’000
1. Regulation and Support of Local Government ................................................ 16,797 12,522 14,040 13,066 10,583 10,326 10,523
2. Promotion and Support of Multiculturalism ........................................... 6,950 6,812 6,969 7,071 6,941 6,944 6,973
3. Arts Industry Support .................................. 12,720 18,327 18,672 19,532 19,572 19,411 19,258 4. Research, Policy Development,
Information and Support ............................. 15,318 20,970 21,210 22,087 22,145 21,996 21,880 5. Corporate and Asset and Infrastructure
Support to the Culture and Arts Portfolio and Government ......................................... 25,035 19,354 24,369 24,231 22,635 22,494 21,868
6. Cultural Heritage Management and Conservation .............................................. 827 961 889 902 811 873 887
7. Cultural Heritage Access and Community Engagement and Education ........................ 11,784 11,228 10,172 10,231 9,207 9,902 10,062
8. Collection Services ..................................... 9,927 10,438 9,772 9,736 9,376 8,974 9,099 9. Public Library Services ............................... 16,038 14,540 14,204 14,152 13,631 13,046 13,228 10. Library, Literacy and Community
Engagement ............................................... 9,159 10,000 8,716 8,684 8,363 8,005 8,117 11. Venue Management Services ..................... 17,771 17,463 18,444 19,947 18,538 17,012 18,059 12. Collections Management, Research and
Conservation Services ................................ 10,318 10,163 10,086 9,510 10,016 10,497 10,368 13. Collections Effectively Documented and
Digitised ...................................................... 1,821 1,784 1,770 1,683 1,681 1,762 1,740 14. Public Sites, Public Programs and
Collections Accessed On-site ..................... 12,233 10,053 9,978 11,891 30,005 31,445 31,059 15. Online Access to Collections, Expertise
and Programs ............................................. 640 610 666 751 752 788 778 16. Museum Services to the Regions ............... 5,712 6,064 5,960 5,722 5,723 5,998 5,925 17. Licensing - Evaluation and
Determination of Applications ..................... 8,157 6,878 7,098 7,171 7,290 7,494 7,730 18. Compliance Audits and Inspections ............ 8,156 6,878 7,098 7,172 7,289 7,494 7,730 19. Industry Leadership and Infrastructure
Development .............................................. 44,345 45,221 46,080 33,006 26,979 19,660 18,788 20. Building Capacity and Participation ............ 45,666 49,213 50,035 50,387 49,460 50,073 50,439 21. Recreation Camps Management ................ 8,134 9,157 9,113 9,242 9,194 9,194 9,390
Total Cost of Services .................................... 287,508 288,636 295,341 286,174 290,191 283,388 283,901
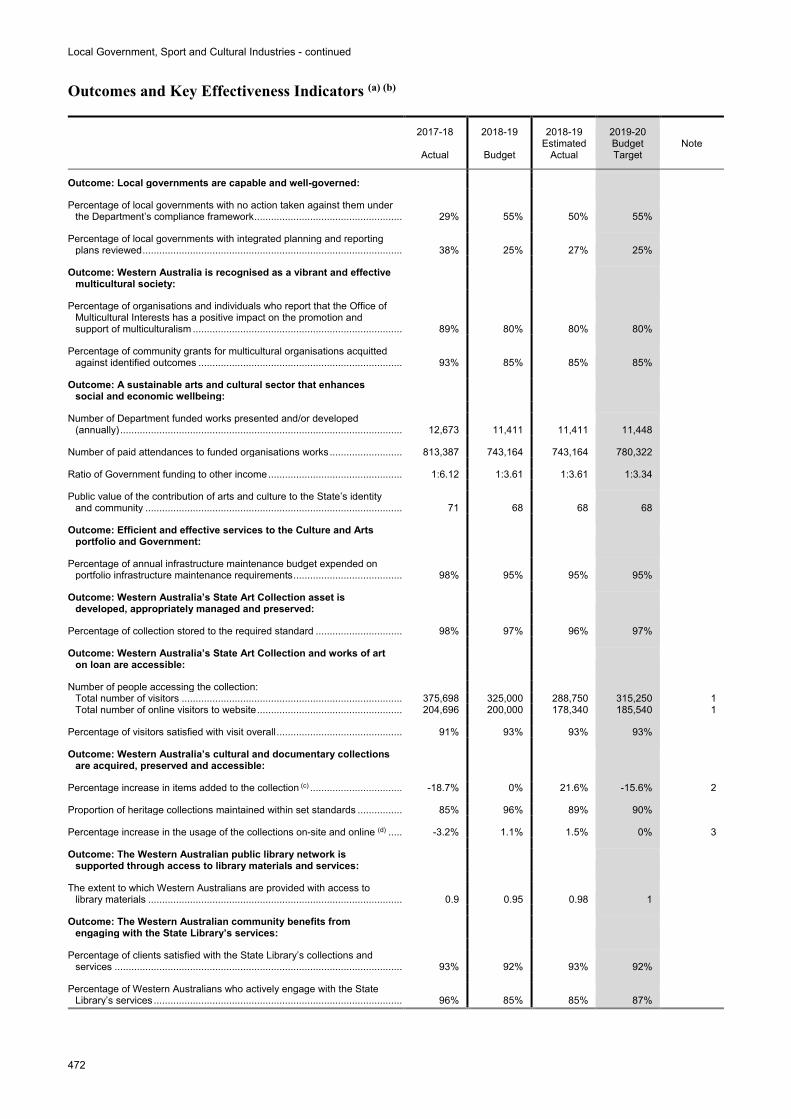
Local Government, Sport and Cultural Industries - continued
472
Outcomes and Key Effectiveness Indicators (a) (b)
2017-18
Actual
2018-19
Budget
2018-19 Estimated
Actual
2019-20 Budget Target
Note
Outcome: Local governments are capable and well-governed: Percentage of local governments with no action taken against them under
the Department’s compliance framework ...................................................... 29% 55% 50% 55% Percentage of local governments with integrated planning and reporting
plans reviewed .............................................................................................. 38% 25% 27% 25% Outcome: Western Australia is recognised as a vibrant and effective
multicultural society: Percentage of organisations and individuals who report that the Office of
Multicultural Interests has a positive impact on the promotion and support of multiculturalism ............................................................................ 89% 80% 80% 80%
Percentage of community grants for multicultural organisations acquitted
against identified outcomes .......................................................................... 93% 85% 85% 85% Outcome: A sustainable arts and cultural sector that enhances
social and economic wellbeing: Number of Department funded works presented and/or developed
(annually) ...................................................................................................... 12,673 11,411 11,411 11,448 Number of paid attendances to funded organisations works ........................... 813,387 743,164 743,164 780,322 Ratio of Government funding to other income ................................................. 1:6.12 1:3.61 1:3.61 1:3.34 Public value of the contribution of arts and culture to the State’s identity
and community ............................................................................................. 71 68 68 68 Outcome: Efficient and effective services to the Culture and Arts
portfolio and Government: Percentage of annual infrastructure maintenance budget expended on
portfolio infrastructure maintenance requirements ........................................ 98% 95% 95% 95% Outcome: Western Australia’s State Art Collection asset is
developed, appropriately managed and preserved: Percentage of collection stored to the required standard ................................ 98% 97% 96% 97% Outcome: Western Australia’s State Art Collection and works of art
on loan are accessible: Number of people accessing the collection:
Total number of visitors ................................................................................ 375,698 325,000 288,750 315,250 1 Total number of online visitors to website ..................................................... 204,696 200,000 178,340 185,540 1
Percentage of visitors satisfied with visit overall .............................................. 91% 93% 93% 93% Outcome: Western Australia’s cultural and documentary collections
are acquired, preserved and accessible: Percentage increase in items added to the collection (c) .................................. -18.7% 0% 21.6% -15.6% 2 Proportion of heritage collections maintained within set standards ................. 85% 96% 89% 90% Percentage increase in the usage of the collections on-site and online (d) ...... -3.2% 1.1% 1.5% 0% 3 Outcome: The Western Australian public library network is
supported through access to library materials and services: The extent to which Western Australians are provided with access to
library materials ............................................................................................ 0.9 0.95 0.98 1 Outcome: The Western Australian community benefits from
engaging with the State Library’s services: Percentage of clients satisfied with the State Library’s collections and
services ........................................................................................................ 93% 92% 93% 92% Percentage of Western Australians who actively engage with the State
Library’s services .......................................................................................... 96% 85% 85% 87%
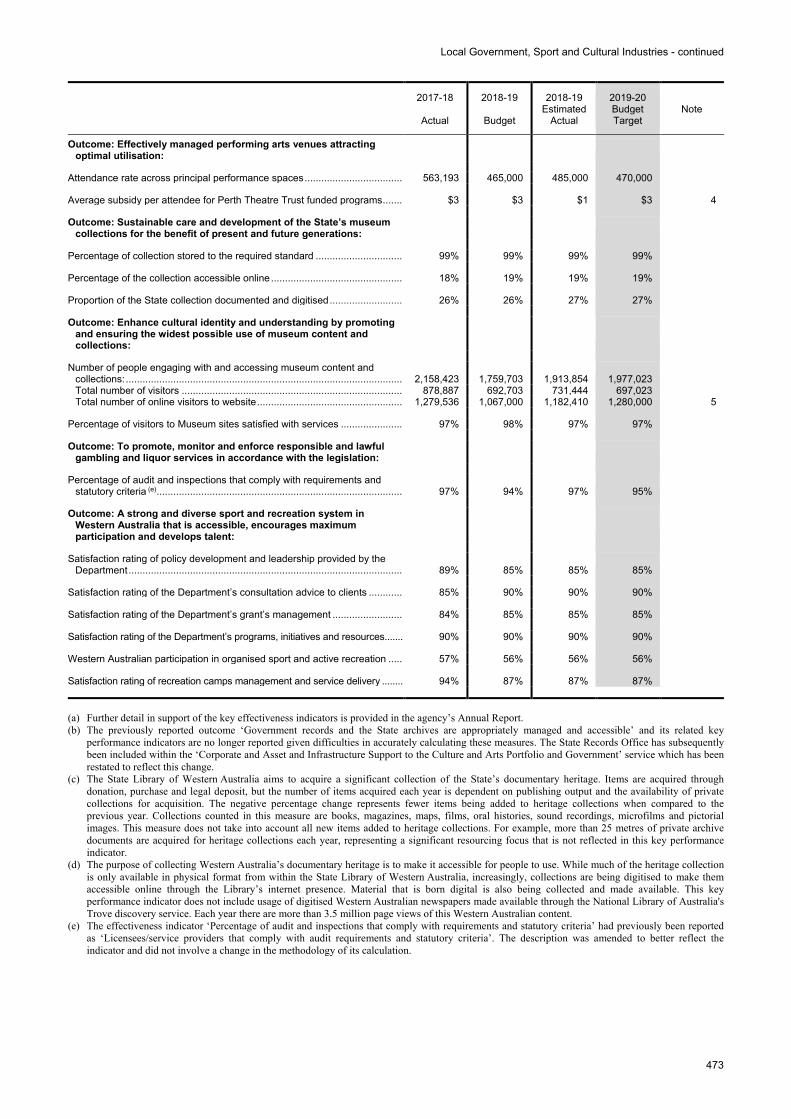
Local Government, Sport and Cultural Industries - continued
473
2017-18
Actual
2018-19
Budget
2018-19 Estimated
Actual
2019-20 Budget Target
Note
Outcome: Effectively managed performing arts venues attracting optimal utilisation:
Attendance rate across principal performance spaces .................................... 563,193 465,000 485,000 470,000 Average subsidy per attendee for Perth Theatre Trust funded programs ........ $3 $3 $1 $3 4 Outcome: Sustainable care and development of the State’s museum
collections for the benefit of present and future generations: Percentage of collection stored to the required standard ................................ 99% 99% 99% 99% Percentage of the collection accessible online ................................................ 18% 19% 19% 19% Proportion of the State collection documented and digitised ........................... 26% 26% 27% 27% Outcome: Enhance cultural identity and understanding by promoting
and ensuring the widest possible use of museum content and collections:
Number of people engaging with and accessing museum content and
collections: .................................................................................................... 2,158,423 1,759,703 1,913,854 1,977,023 Total number of visitors ................................................................................ 878,887 692,703 731,444 697,023 Total number of online visitors to website ..................................................... 1,279,536 1,067,000 1,182,410 1,280,000 5
Percentage of visitors to Museum sites satisfied with services ....................... 97% 98% 97% 97% Outcome: To promote, monitor and enforce responsible and lawful
gambling and liquor services in accordance with the legislation: Percentage of audit and inspections that comply with requirements and
statutory criteria (e) ......................................................................................... 97% 94% 97% 95% Outcome: A strong and diverse sport and recreation system in
Western Australia that is accessible, encourages maximum participation and develops talent:
Satisfaction rating of policy development and leadership provided by the
Department ................................................................................................... 89% 85% 85% 85% Satisfaction rating of the Department’s consultation advice to clients ............. 85% 90% 90% 90% Satisfaction rating of the Department’s grant’s management .......................... 84% 85% 85% 85% Satisfaction rating of the Department’s programs, initiatives and resources ....... 90% 90% 90% 90% Western Australian participation in organised sport and active recreation ...... 57% 56% 56% 56% Satisfaction rating of recreation camps management and service delivery ........ 94% 87% 87% 87% (a) Further detail in support of the key effectiveness indicators is provided in the agency’s Annual Report. (b) The previously reported outcome ‘Government records and the State archives are appropriately managed and accessible’ and its related key
performance indicators are no longer reported given difficulties in accurately calculating these measures. The State Records Office has subsequently been included within the ‘Corporate and Asset and Infrastructure Support to the Culture and Arts Portfolio and Government’ service which has been restated to reflect this change.
(c) The State Library of Western Australia aims to acquire a significant collection of the State’s documentary heritage. Items are acquired through donation, purchase and legal deposit, but the number of items acquired each year is dependent on publishing output and the availability of private collections for acquisition. The negative percentage change represents fewer items being added to heritage collections when compared to the previous year. Collections counted in this measure are books, magazines, maps, films, oral histories, sound recordings, microfilms and pictorial images. This measure does not take into account all new items added to heritage collections. For example, more than 25 metres of private archive documents are acquired for heritage collections each year, representing a significant resourcing focus that is not reflected in this key performance indicator.
(d) The purpose of collecting Western Australia’s documentary heritage is to make it accessible for people to use. While much of the heritage collection is only available in physical format from within the State Library of Western Australia, increasingly, collections are being digitised to make them accessible online through the Library’s internet presence. Material that is born digital is also being collected and made available. This key performance indicator does not include usage of digitised Western Australian newspapers made available through the National Library of Australia's Trove discovery service. Each year there are more than 3.5 million page views of this Western Australian content.
(e) The effectiveness indicator ‘Percentage of audit and inspections that comply with requirements and statutory criteria’ had previously been reported as ‘Licensees/service providers that comply with audit requirements and statutory criteria’. The description was amended to better reflect the indicator and did not involve a change in the methodology of its calculation.
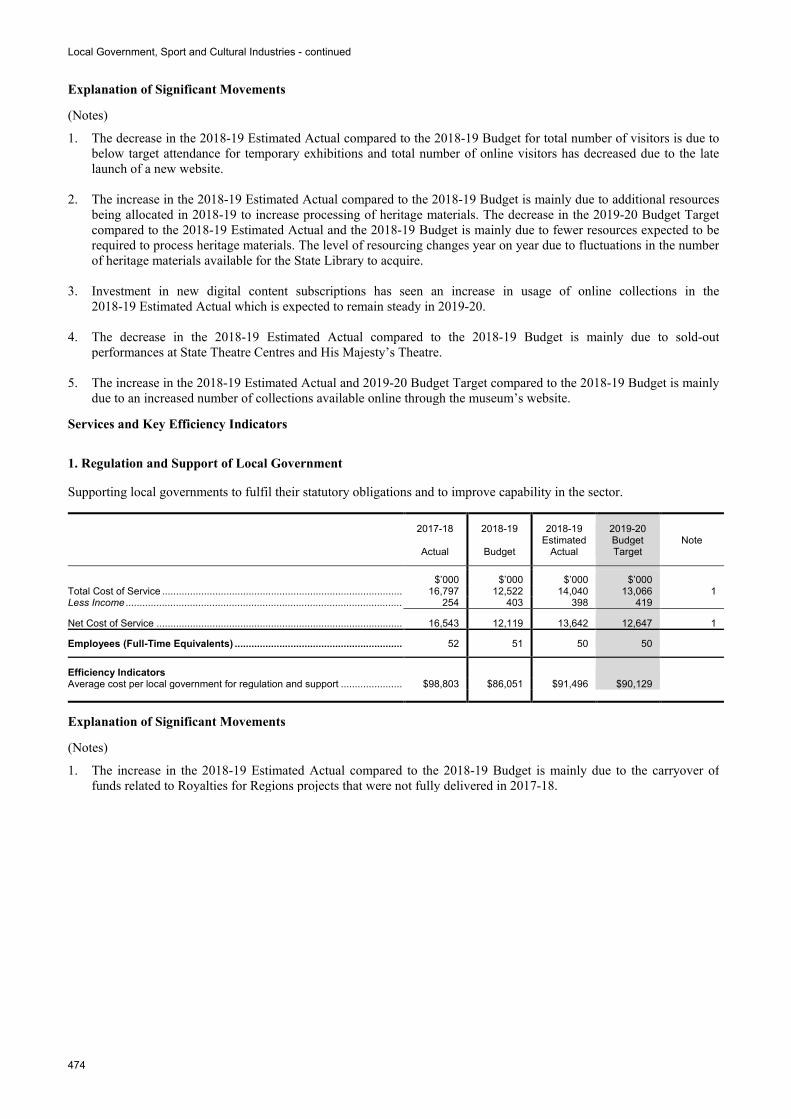
Local Government, Sport and Cultural Industries - continued
474
Explanation of Significant Movements
(Notes) 1. The decrease in the 2018-19 Estimated Actual compared to the 2018-19 Budget for total number of visitors is due to
below target attendance for temporary exhibitions and total number of online visitors has decreased due to the late launch of a new website.
2. The increase in the 2018-19 Estimated Actual compared to the 2018-19 Budget is mainly due to additional resources
being allocated in 2018-19 to increase processing of heritage materials. The decrease in the 2019-20 Budget Target compared to the 2018-19 Estimated Actual and the 2018-19 Budget is mainly due to fewer resources expected to be required to process heritage materials. The level of resourcing changes year on year due to fluctuations in the number of heritage materials available for the State Library to acquire.
3. Investment in new digital content subscriptions has seen an increase in usage of online collections in the
2018-19 Estimated Actual which is expected to remain steady in 2019-20. 4. The decrease in the 2018-19 Estimated Actual compared to the 2018-19 Budget is mainly due to sold-out
performances at State Theatre Centres and His Majesty’s Theatre. 5. The increase in the 2018-19 Estimated Actual and 2019-20 Budget Target compared to the 2018-19 Budget is mainly
due to an increased number of collections available online through the museum’s website.
Services and Key Efficiency Indicators
1. Regulation and Support of Local Government
Supporting local governments to fulfil their statutory obligations and to improve capability in the sector.
2017-18
Actual
2018-19
Budget
2018-19 Estimated
Actual
2019-20 Budget Target
Note
$’000 $’000 $’000 $’000 Total Cost of Service ...................................................................................... 16,797 12,522 14,040 13,066 1 Less Income ................................................................................................... 254 403 398 419
Net Cost of Service ........................................................................................ 16,543 12,119 13,642 12,647 1
Employees (Full-Time Equivalents) ............................................................ 52 51 50 50
Efficiency Indicators Average cost per local government for regulation and support ...................... $98,803 $86,051 $91,496 $90,129
Explanation of Significant Movements
(Notes) 1. The increase in the 2018-19 Estimated Actual compared to the 2018-19 Budget is mainly due to the carryover of
funds related to Royalties for Regions projects that were not fully delivered in 2017-18.
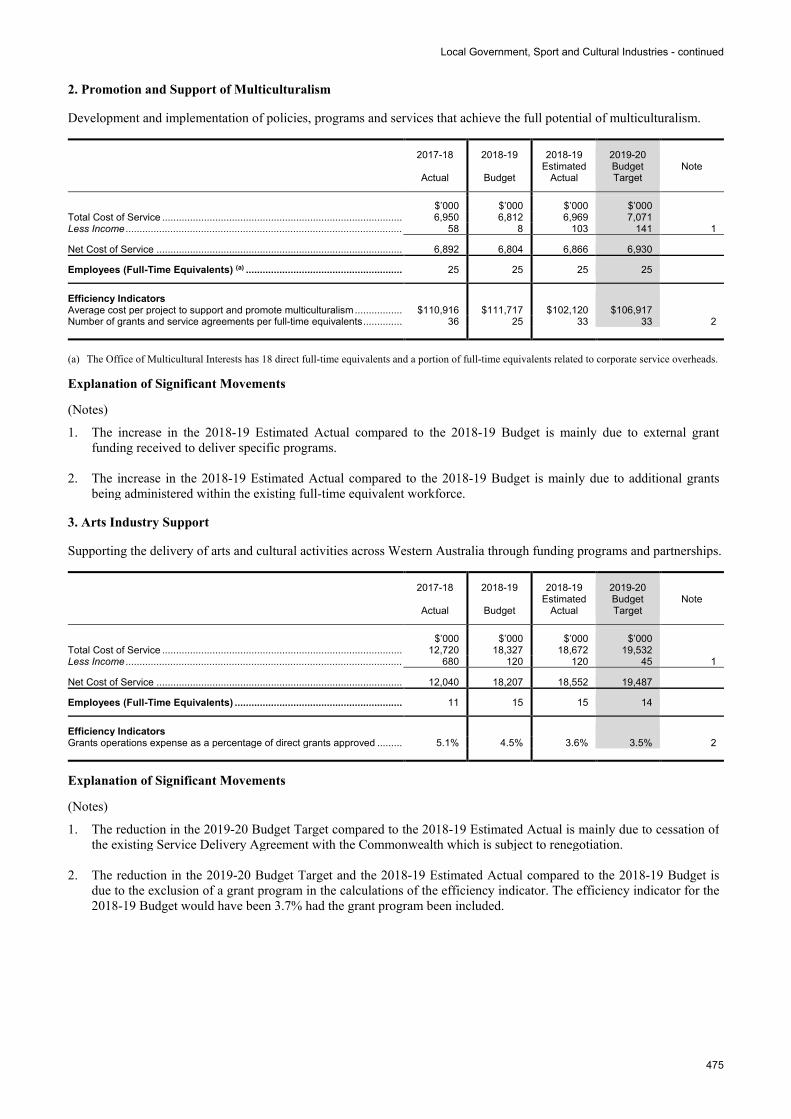
Local Government, Sport and Cultural Industries - continued
475
2. Promotion and Support of Multiculturalism
Development and implementation of policies, programs and services that achieve the full potential of multiculturalism.
2017-18
Actual
2018-19
Budget
2018-19 Estimated
Actual
2019-20 Budget Target
Note
$’000 $’000 $’000 $’000 Total Cost of Service ...................................................................................... 6,950 6,812 6,969 7,071 Less Income ................................................................................................... 58 8 103 141 1
Net Cost of Service ........................................................................................ 6,892 6,804 6,866 6,930
Employees (Full-Time Equivalents) (a) ........................................................ 25 25 25 25
Efficiency Indicators Average cost per project to support and promote multiculturalism ................. $110,916 $111,717 $102,120 $106,917 Number of grants and service agreements per full-time equivalents .............. 36 25 33 33 2 (a) The Office of Multicultural Interests has 18 direct full-time equivalents and a portion of full-time equivalents related to corporate service overheads.
Explanation of Significant Movements
(Notes) 1. The increase in the 2018-19 Estimated Actual compared to the 2018-19 Budget is mainly due to external grant
funding received to deliver specific programs. 2. The increase in the 2018-19 Estimated Actual compared to the 2018-19 Budget is mainly due to additional grants
being administered within the existing full-time equivalent workforce.
3. Arts Industry Support
Supporting the delivery of arts and cultural activities across Western Australia through funding programs and partnerships.
2017-18
Actual
2018-19
Budget
2018-19 Estimated
Actual
2019-20 Budget Target
Note
$’000 $’000 $’000 $’000 Total Cost of Service ...................................................................................... 12,720 18,327 18,672 19,532 Less Income ................................................................................................... 680 120 120 45 1
Net Cost of Service ........................................................................................ 12,040 18,207 18,552 19,487
Employees (Full-Time Equivalents) ............................................................ 11 15 15 14
Efficiency Indicators Grants operations expense as a percentage of direct grants approved ......... 5.1% 4.5% 3.6% 3.5% 2
Explanation of Significant Movements
(Notes) 1. The reduction in the 2019-20 Budget Target compared to the 2018-19 Estimated Actual is mainly due to cessation of
the existing Service Delivery Agreement with the Commonwealth which is subject to renegotiation. 2. The reduction in the 2019-20 Budget Target and the 2018-19 Estimated Actual compared to the 2018-19 Budget is
due to the exclusion of a grant program in the calculations of the efficiency indicator. The efficiency indicator for the 2018-19 Budget would have been 3.7% had the grant program been included.
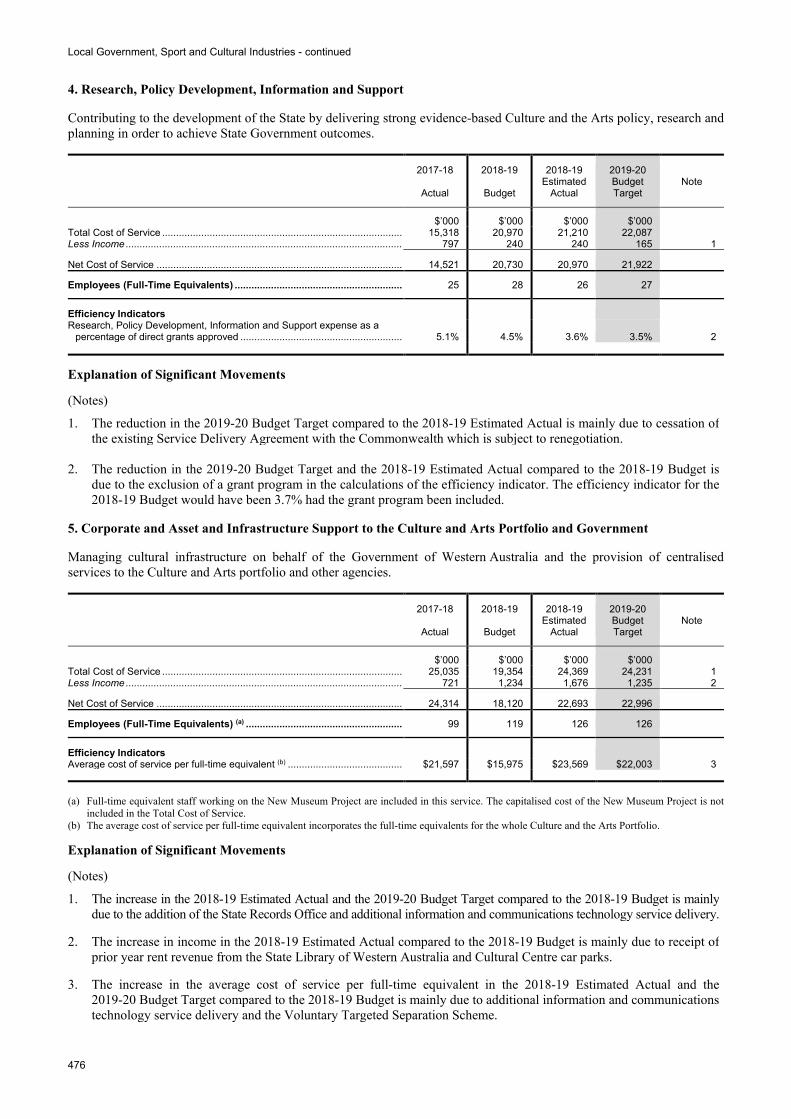
Local Government, Sport and Cultural Industries - continued
476
4. Research, Policy Development, Information and Support
Contributing to the development of the State by delivering strong evidence-based Culture and the Arts policy, research and planning in order to achieve State Government outcomes.
2017-18
Actual
2018-19
Budget
2018-19 Estimated
Actual
2019-20 Budget Target
Note
$’000 $’000 $’000 $’000 Total Cost of Service ...................................................................................... 15,318 20,970 21,210 22,087 Less Income ................................................................................................... 797 240 240 165 1
Net Cost of Service ........................................................................................ 14,521 20,730 20,970 21,922
Employees (Full-Time Equivalents) ............................................................ 25 28 26 27
Efficiency Indicators Research, Policy Development, Information and Support expense as a
percentage of direct grants approved .......................................................... 5.1% 4.5% 3.6% 3.5% 2
Explanation of Significant Movements
(Notes) 1. The reduction in the 2019-20 Budget Target compared to the 2018-19 Estimated Actual is mainly due to cessation of
the existing Service Delivery Agreement with the Commonwealth which is subject to renegotiation. 2. The reduction in the 2019-20 Budget Target and the 2018-19 Estimated Actual compared to the 2018-19 Budget is
due to the exclusion of a grant program in the calculations of the efficiency indicator. The efficiency indicator for the 2018-19 Budget would have been 3.7% had the grant program been included.
5. Corporate and Asset and Infrastructure Support to the Culture and Arts Portfolio and Government
Managing cultural infrastructure on behalf of the Government of Western Australia and the provision of centralised services to the Culture and Arts portfolio and other agencies.
2017-18
Actual
2018-19
Budget
2018-19 Estimated
Actual
2019-20 Budget Target
Note
$’000 $’000 $’000 $’000 Total Cost of Service ...................................................................................... 25,035 19,354 24,369 24,231 1 Less Income ................................................................................................... 721 1,234 1,676 1,235 2
Net Cost of Service ........................................................................................ 24,314 18,120 22,693 22,996
Employees (Full-Time Equivalents) (a) ........................................................ 99 119 126 126
Efficiency Indicators Average cost of service per full-time equivalent (b) ......................................... $21,597 $15,975 $23,569 $22,003 3 (a) Full-time equivalent staff working on the New Museum Project are included in this service. The capitalised cost of the New Museum Project is not
included in the Total Cost of Service. (b) The average cost of service per full-time equivalent incorporates the full-time equivalents for the whole Culture and the Arts Portfolio.
Explanation of Significant Movements
(Notes) 1. The increase in the 2018-19 Estimated Actual and the 2019-20 Budget Target compared to the 2018-19 Budget is mainly
due to the addition of the State Records Office and additional information and communications technology service delivery. 2. The increase in income in the 2018-19 Estimated Actual compared to the 2018-19 Budget is mainly due to receipt of
prior year rent revenue from the State Library of Western Australia and Cultural Centre car parks. 3. The increase in the average cost of service per full-time equivalent in the 2018-19 Estimated Actual and the
2019-20 Budget Target compared to the 2018-19 Budget is mainly due to additional information and communications technology service delivery and the Voluntary Targeted Separation Scheme.
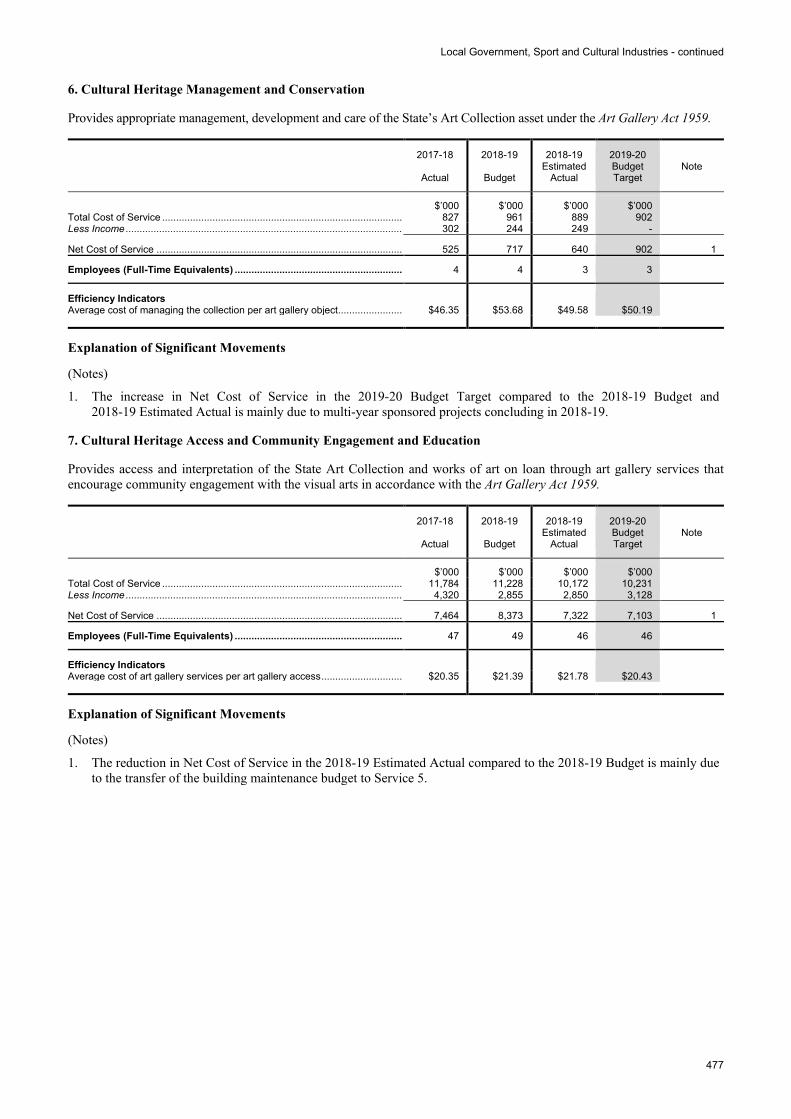
Local Government, Sport and Cultural Industries - continued
477
6. Cultural Heritage Management and Conservation
Provides appropriate management, development and care of the State’s Art Collection asset under the Art Gallery Act 1959.
2017-18
Actual
2018-19
Budget
2018-19 Estimated
Actual
2019-20 Budget Target
Note
$’000 $’000 $’000 $’000 Total Cost of Service ...................................................................................... 827 961 889 902 Less Income ................................................................................................... 302 244 249 -
Net Cost of Service ........................................................................................ 525 717 640 902 1
Employees (Full-Time Equivalents) ............................................................ 4 4 3 3
Efficiency Indicators Average cost of managing the collection per art gallery object ....................... $46.35 $53.68 $49.58 $50.19
Explanation of Significant Movements
(Notes) 1. The increase in Net Cost of Service in the 2019-20 Budget Target compared to the 2018-19 Budget and
2018-19 Estimated Actual is mainly due to multi-year sponsored projects concluding in 2018-19.
7. Cultural Heritage Access and Community Engagement and Education
Provides access and interpretation of the State Art Collection and works of art on loan through art gallery services that encourage community engagement with the visual arts in accordance with the Art Gallery Act 1959.
2017-18
Actual
2018-19
Budget
2018-19 Estimated
Actual
2019-20 Budget Target
Note
$’000 $’000 $’000 $’000 Total Cost of Service ...................................................................................... 11,784 11,228 10,172 10,231 Less Income ................................................................................................... 4,320 2,855 2,850 3,128
Net Cost of Service ........................................................................................ 7,464 8,373 7,322 7,103 1
Employees (Full-Time Equivalents) ............................................................ 47 49 46 46
Efficiency Indicators Average cost of art gallery services per art gallery access ............................. $20.35 $21.39 $21.78 $20.43
Explanation of Significant Movements
(Notes) 1. The reduction in Net Cost of Service in the 2018-19 Estimated Actual compared to the 2018-19 Budget is mainly due
to the transfer of the building maintenance budget to Service 5.
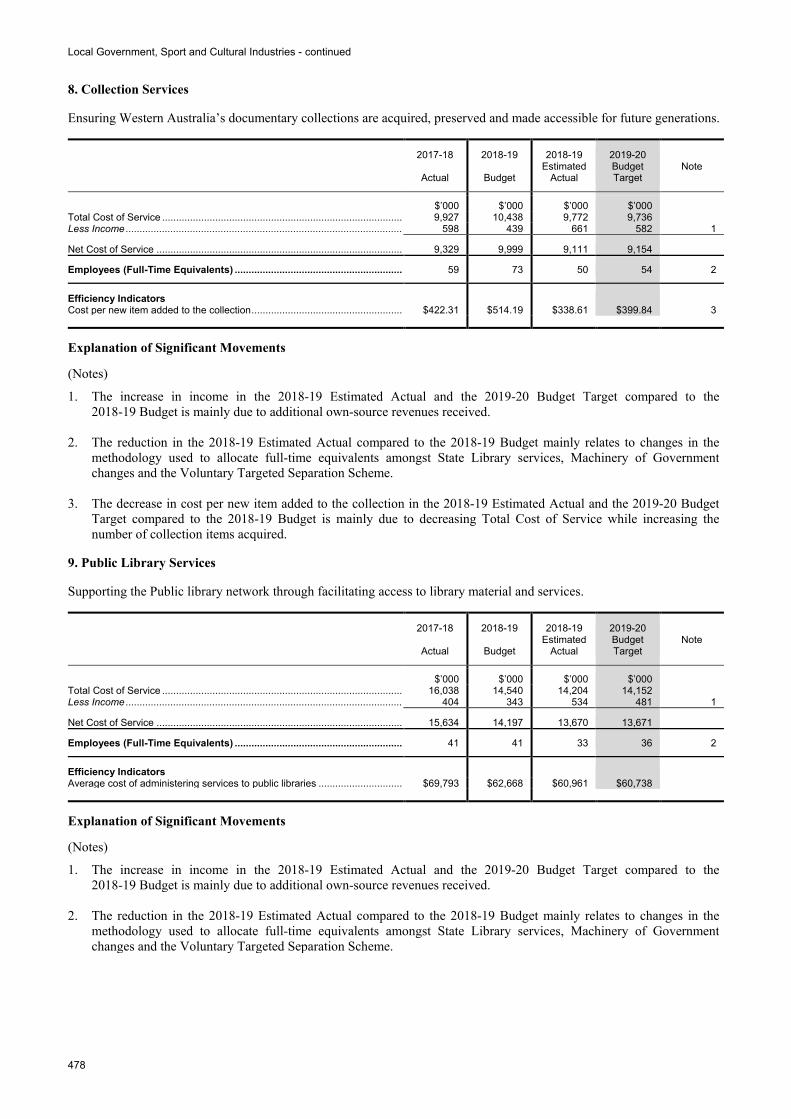
Local Government, Sport and Cultural Industries - continued
478
8. Collection Services
Ensuring Western Australia’s documentary collections are acquired, preserved and made accessible for future generations.
2017-18
Actual
2018-19
Budget
2018-19 Estimated
Actual
2019-20 Budget Target
Note
$’000 $’000 $’000 $’000 Total Cost of Service ...................................................................................... 9,927 10,438 9,772 9,736 Less Income ................................................................................................... 598 439 661 582 1
Net Cost of Service ........................................................................................ 9,329 9,999 9,111 9,154
Employees (Full-Time Equivalents) ............................................................ 59 73 50 54 2
Efficiency Indicators Cost per new item added to the collection ...................................................... $422.31 $514.19 $338.61 $399.84 3
Explanation of Significant Movements
(Notes) 1. The increase in income in the 2018-19 Estimated Actual and the 2019-20 Budget Target compared to the
2018-19 Budget is mainly due to additional own-source revenues received. 2. The reduction in the 2018-19 Estimated Actual compared to the 2018-19 Budget mainly relates to changes in the
methodology used to allocate full-time equivalents amongst State Library services, Machinery of Government changes and the Voluntary Targeted Separation Scheme.
3. The decrease in cost per new item added to the collection in the 2018-19 Estimated Actual and the 2019-20 Budget
Target compared to the 2018-19 Budget is mainly due to decreasing Total Cost of Service while increasing the number of collection items acquired.
9. Public Library Services
Supporting the Public library network through facilitating access to library material and services.
2017-18
Actual
2018-19
Budget
2018-19 Estimated
Actual
2019-20 Budget Target
Note
$’000 $’000 $’000 $’000 Total Cost of Service ...................................................................................... 16,038 14,540 14,204 14,152 Less Income ................................................................................................... 404 343 534 481 1
Net Cost of Service ........................................................................................ 15,634 14,197 13,670 13,671
Employees (Full-Time Equivalents) ............................................................ 41 41 33 36 2
Efficiency Indicators Average cost of administering services to public libraries .............................. $69,793 $62,668 $60,961 $60,738
Explanation of Significant Movements
(Notes) 1. The increase in income in the 2018-19 Estimated Actual and the 2019-20 Budget Target compared to the
2018-19 Budget is mainly due to additional own-source revenues received. 2. The reduction in the 2018-19 Estimated Actual compared to the 2018-19 Budget mainly relates to changes in the
methodology used to allocate full-time equivalents amongst State Library services, Machinery of Government changes and the Voluntary Targeted Separation Scheme.
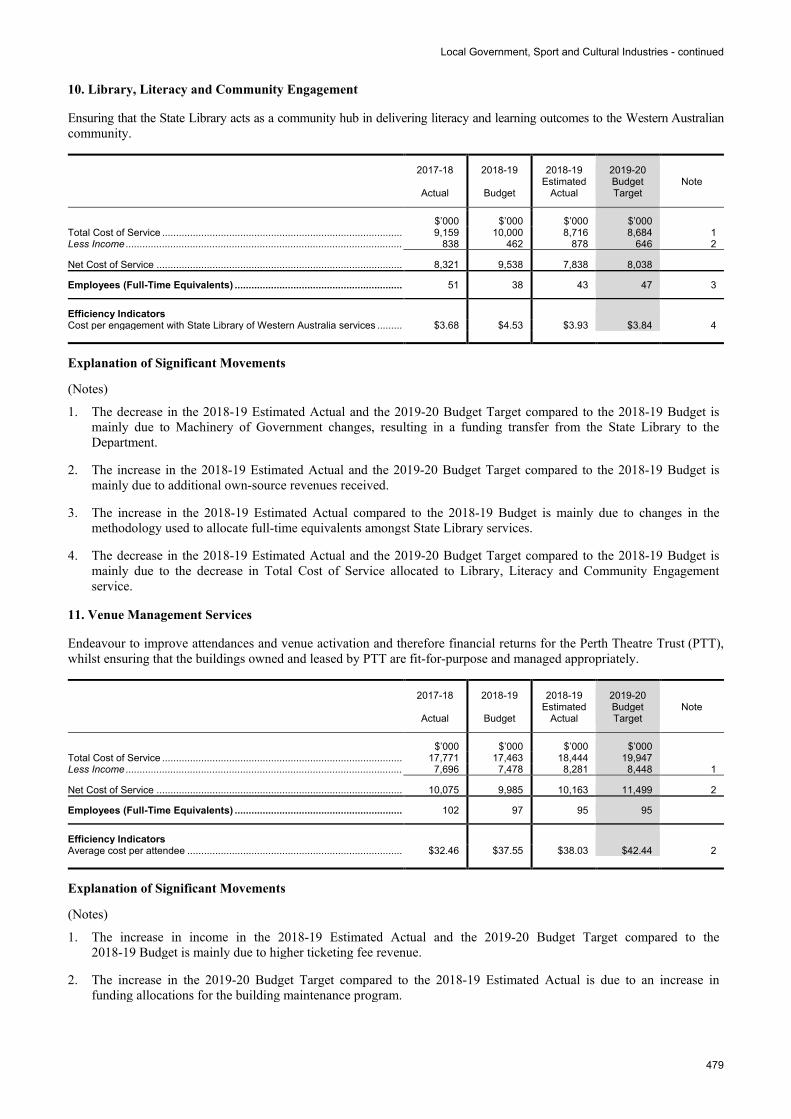
Local Government, Sport and Cultural Industries - continued
479
10. Library, Literacy and Community Engagement
Ensuring that the State Library acts as a community hub in delivering literacy and learning outcomes to the Western Australian community.
2017-18
Actual
2018-19
Budget
2018-19 Estimated
Actual
2019-20 Budget Target
Note
$’000 $’000 $’000 $’000 Total Cost of Service ...................................................................................... 9,159 10,000 8,716 8,684 1 Less Income ................................................................................................... 838 462 878 646 2
Net Cost of Service ........................................................................................ 8,321 9,538 7,838 8,038
Employees (Full-Time Equivalents) ............................................................ 51 38 43 47 3
Efficiency Indicators Cost per engagement with State Library of Western Australia services ......... $3.68 $4.53 $3.93 $3.84 4
Explanation of Significant Movements
(Notes) 1. The decrease in the 2018-19 Estimated Actual and the 2019-20 Budget Target compared to the 2018-19 Budget is
mainly due to Machinery of Government changes, resulting in a funding transfer from the State Library to the Department.
2. The increase in the 2018-19 Estimated Actual and the 2019-20 Budget Target compared to the 2018-19 Budget is
mainly due to additional own-source revenues received. 3. The increase in the 2018-19 Estimated Actual compared to the 2018-19 Budget is mainly due to changes in the
methodology used to allocate full-time equivalents amongst State Library services. 4. The decrease in the 2018-19 Estimated Actual and the 2019-20 Budget Target compared to the 2018-19 Budget is
mainly due to the decrease in Total Cost of Service allocated to Library, Literacy and Community Engagement service.
11. Venue Management Services
Endeavour to improve attendances and venue activation and therefore financial returns for the Perth Theatre Trust (PTT), whilst ensuring that the buildings owned and leased by PTT are fit-for-purpose and managed appropriately.
2017-18
Actual
2018-19
Budget
2018-19 Estimated
Actual
2019-20 Budget Target
Note
$’000 $’000 $’000 $’000 Total Cost of Service ...................................................................................... 17,771 17,463 18,444 19,947 Less Income ................................................................................................... 7,696 7,478 8,281 8,448 1
Net Cost of Service ........................................................................................ 10,075 9,985 10,163 11,499 2
Employees (Full-Time Equivalents) ............................................................ 102 97 95 95
Efficiency Indicators Average cost per attendee ............................................................................. $32.46 $37.55 $38.03 $42.44 2
Explanation of Significant Movements
(Notes) 1. The increase in income in the 2018-19 Estimated Actual and the 2019-20 Budget Target compared to the
2018-19 Budget is mainly due to higher ticketing fee revenue. 2. The increase in the 2019-20 Budget Target compared to the 2018-19 Estimated Actual is due to an increase in
funding allocations for the building maintenance program.
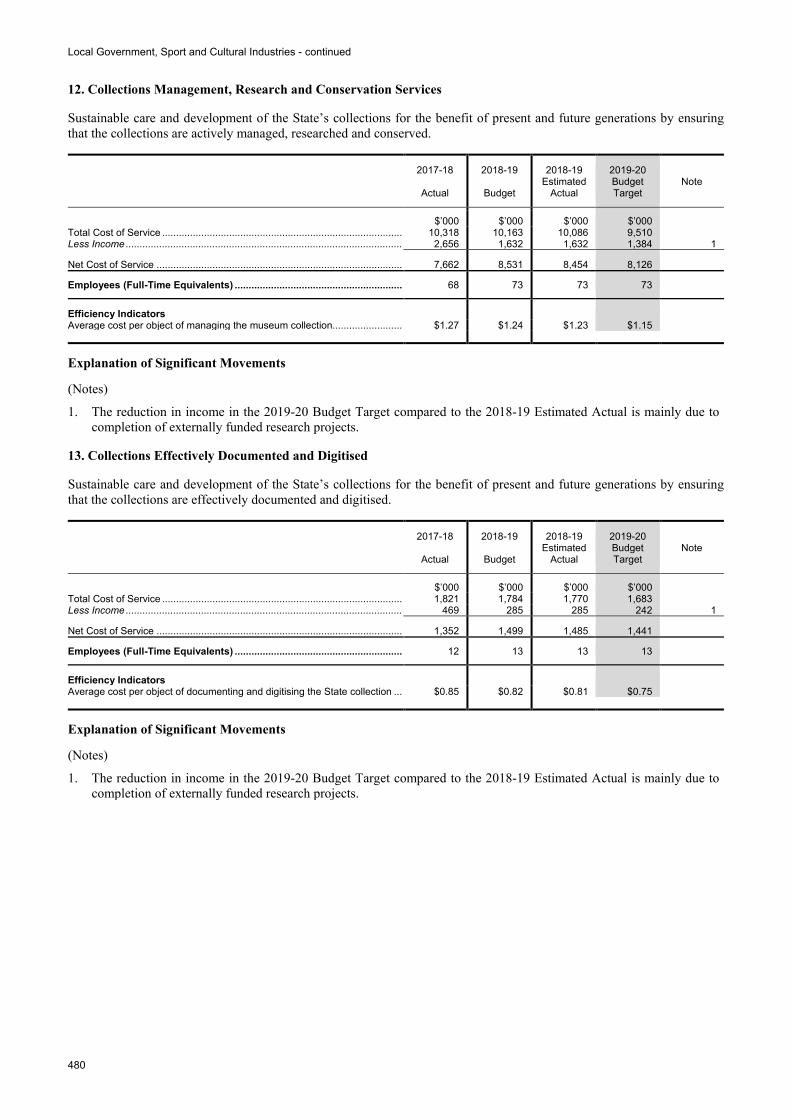
Local Government, Sport and Cultural Industries - continued
480
12. Collections Management, Research and Conservation Services
Sustainable care and development of the State’s collections for the benefit of present and future generations by ensuring that the collections are actively managed, researched and conserved.
2017-18
Actual
2018-19
Budget
2018-19 Estimated
Actual
2019-20 Budget Target
Note
$’000 $’000 $’000 $’000 Total Cost of Service ...................................................................................... 10,318 10,163 10,086 9,510 Less Income ................................................................................................... 2,656 1,632 1,632 1,384 1
Net Cost of Service ........................................................................................ 7,662 8,531 8,454 8,126
Employees (Full-Time Equivalents) ............................................................ 68 73 73 73
Efficiency Indicators Average cost per object of managing the museum collection......................... $1.27 $1.24 $1.23 $1.15
Explanation of Significant Movements
(Notes) 1. The reduction in income in the 2019-20 Budget Target compared to the 2018-19 Estimated Actual is mainly due to
completion of externally funded research projects.
13. Collections Effectively Documented and Digitised
Sustainable care and development of the State’s collections for the benefit of present and future generations by ensuring that the collections are effectively documented and digitised.
2017-18
Actual
2018-19
Budget
2018-19 Estimated
Actual
2019-20 Budget Target
Note
$’000 $’000 $’000 $’000 Total Cost of Service ...................................................................................... 1,821 1,784 1,770 1,683 Less Income ................................................................................................... 469 285 285 242 1
Net Cost of Service ........................................................................................ 1,352 1,499 1,485 1,441
Employees (Full-Time Equivalents) ............................................................ 12 13 13 13
Efficiency Indicators Average cost per object of documenting and digitising the State collection ... $0.85 $0.82 $0.81 $0.75
Explanation of Significant Movements
(Notes) 1. The reduction in income in the 2019-20 Budget Target compared to the 2018-19 Estimated Actual is mainly due to
completion of externally funded research projects.
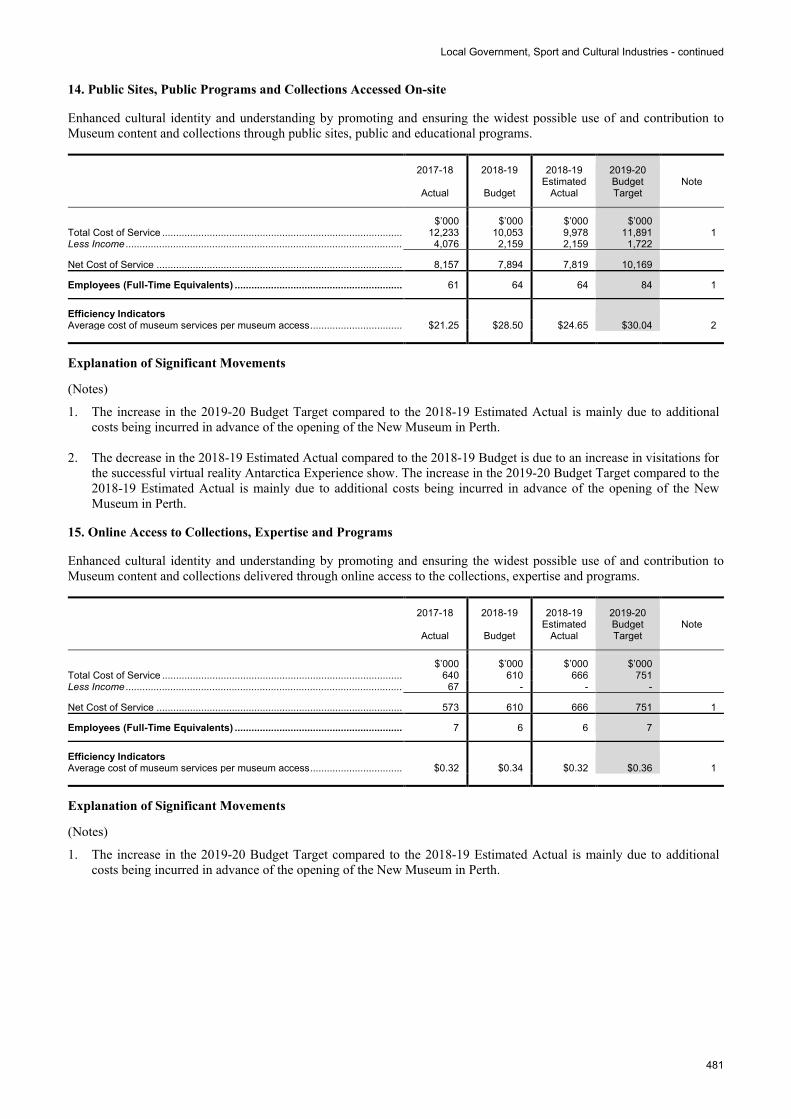
Local Government, Sport and Cultural Industries - continued
481
14. Public Sites, Public Programs and Collections Accessed On-site
Enhanced cultural identity and understanding by promoting and ensuring the widest possible use of and contribution to Museum content and collections through public sites, public and educational programs.
2017-18
Actual
2018-19
Budget
2018-19 Estimated
Actual
2019-20 Budget Target
Note
$’000 $’000 $’000 $’000 Total Cost of Service ...................................................................................... 12,233 10,053 9,978 11,891 1 Less Income ................................................................................................... 4,076 2,159 2,159 1,722
Net Cost of Service ........................................................................................ 8,157 7,894 7,819 10,169
Employees (Full-Time Equivalents) ............................................................ 61 64 64 84 1
Efficiency Indicators Average cost of museum services per museum access ................................. $21.25 $28.50 $24.65 $30.04 2
Explanation of Significant Movements
(Notes) 1. The increase in the 2019-20 Budget Target compared to the 2018-19 Estimated Actual is mainly due to additional
costs being incurred in advance of the opening of the New Museum in Perth. 2. The decrease in the 2018-19 Estimated Actual compared to the 2018-19 Budget is due to an increase in visitations for
the successful virtual reality Antarctica Experience show. The increase in the 2019-20 Budget Target compared to the 2018-19 Estimated Actual is mainly due to additional costs being incurred in advance of the opening of the New Museum in Perth.
15. Online Access to Collections, Expertise and Programs
Enhanced cultural identity and understanding by promoting and ensuring the widest possible use of and contribution to Museum content and collections delivered through online access to the collections, expertise and programs.
2017-18
Actual
2018-19
Budget
2018-19 Estimated
Actual
2019-20 Budget Target
Note
$’000 $’000 $’000 $’000 Total Cost of Service ...................................................................................... 640 610 666 751 Less Income ................................................................................................... 67 - - -
Net Cost of Service ........................................................................................ 573 610 666 751 1
Employees (Full-Time Equivalents) ............................................................ 7 6 6 7
Efficiency Indicators Average cost of museum services per museum access ................................. $0.32 $0.34 $0.32 $0.36 1
Explanation of Significant Movements
(Notes) 1. The increase in the 2019-20 Budget Target compared to the 2018-19 Estimated Actual is mainly due to additional
costs being incurred in advance of the opening of the New Museum in Perth.
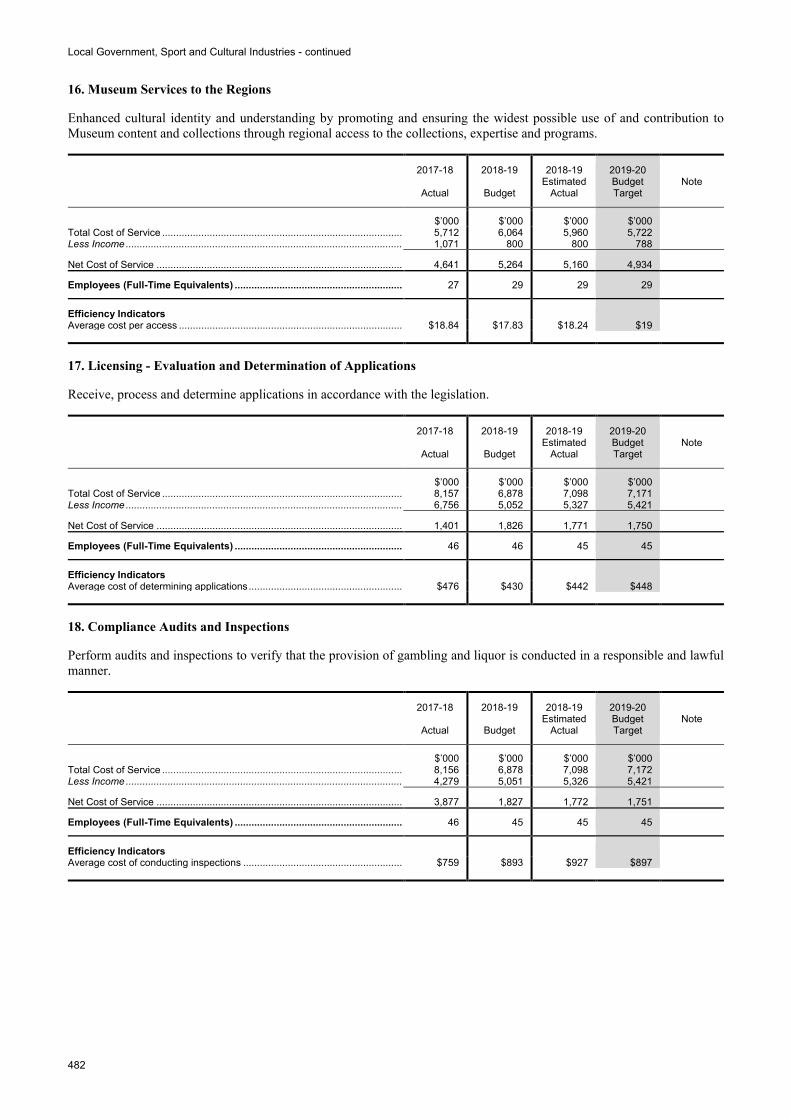
Local Government, Sport and Cultural Industries - continued
482
16. Museum Services to the Regions
Enhanced cultural identity and understanding by promoting and ensuring the widest possible use of and contribution to Museum content and collections through regional access to the collections, expertise and programs.
2017-18
Actual
2018-19
Budget
2018-19 Estimated
Actual
2019-20 Budget Target
Note
$’000 $’000 $’000 $’000 Total Cost of Service ...................................................................................... 5,712 6,064 5,960 5,722 Less Income ................................................................................................... 1,071 800 800 788
Net Cost of Service ........................................................................................ 4,641 5,264 5,160 4,934
Employees (Full-Time Equivalents) ............................................................ 27 29 29 29
Efficiency Indicators Average cost per access ................................................................................ $18.84 $17.83 $18.24 $19
17. Licensing - Evaluation and Determination of Applications
Receive, process and determine applications in accordance with the legislation.
2017-18
Actual
2018-19
Budget
2018-19 Estimated
Actual
2019-20 Budget Target
Note
$’000 $’000 $’000 $’000 Total Cost of Service ...................................................................................... 8,157 6,878 7,098 7,171 Less Income ................................................................................................... 6,756 5,052 5,327 5,421
Net Cost of Service ........................................................................................ 1,401 1,826 1,771 1,750
Employees (Full-Time Equivalents) ............................................................ 46 46 45 45
Efficiency Indicators Average cost of determining applications ....................................................... $476 $430 $442 $448
18. Compliance Audits and Inspections
Perform audits and inspections to verify that the provision of gambling and liquor is conducted in a responsible and lawful manner.
2017-18
Actual
2018-19
Budget
2018-19 Estimated
Actual
2019-20 Budget Target
Note
$’000 $’000 $’000 $’000 Total Cost of Service ...................................................................................... 8,156 6,878 7,098 7,172 Less Income ................................................................................................... 4,279 5,051 5,326 5,421
Net Cost of Service ........................................................................................ 3,877 1,827 1,772 1,751
Employees (Full-Time Equivalents) ............................................................ 46 45 45 45
Efficiency Indicators Average cost of conducting inspections ......................................................... $759 $893 $927 $897
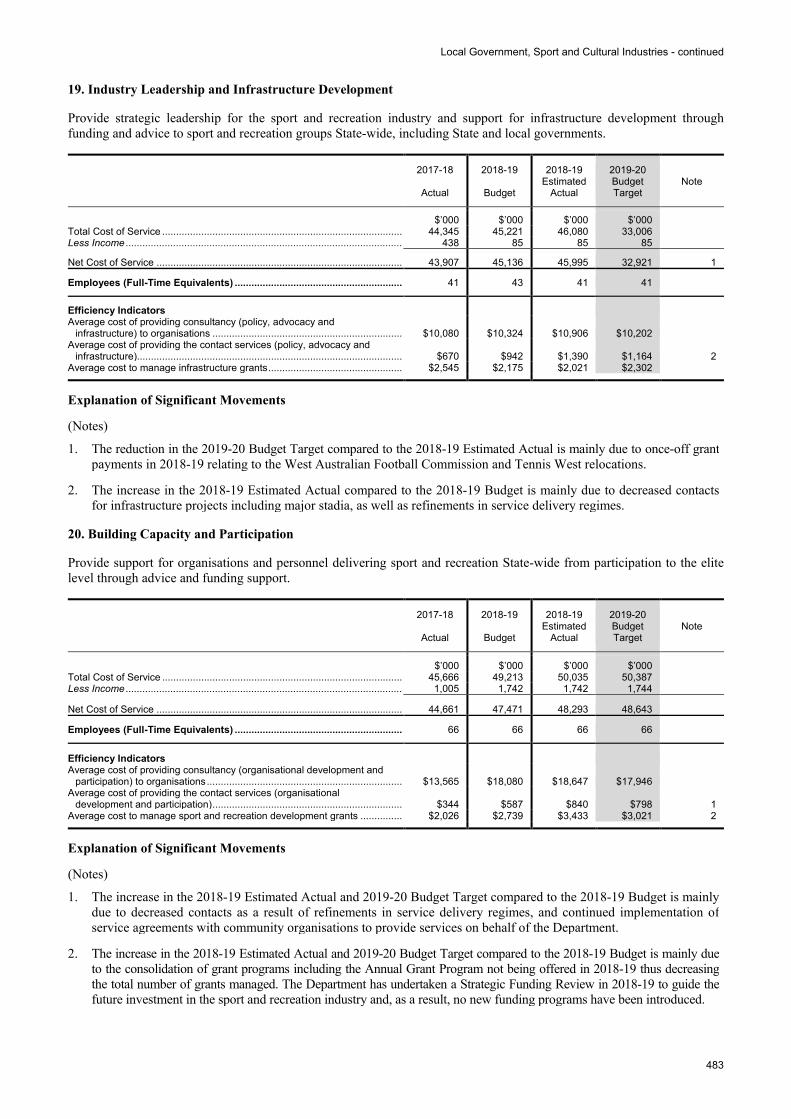
Local Government, Sport and Cultural Industries - continued
483
19. Industry Leadership and Infrastructure Development
Provide strategic leadership for the sport and recreation industry and support for infrastructure development through funding and advice to sport and recreation groups State-wide, including State and local governments.
2017-18
Actual
2018-19
Budget
2018-19 Estimated
Actual
2019-20 Budget Target
Note
$’000 $’000 $’000 $’000 Total Cost of Service ...................................................................................... 44,345 45,221 46,080 33,006 Less Income ................................................................................................... 438 85 85 85
Net Cost of Service ........................................................................................ 43,907 45,136 45,995 32,921 1
Employees (Full-Time Equivalents) ............................................................ 41 43 41 41
Efficiency Indicators Average cost of providing consultancy (policy, advocacy and
infrastructure) to organisations .................................................................... $10,080 $10,324 $10,906 $10,202 Average cost of providing the contact services (policy, advocacy and
infrastructure)............................................................................................... $670 $942 $1,390 $1,164 2 Average cost to manage infrastructure grants ................................................ $2,545 $2,175 $2,021 $2,302
Explanation of Significant Movements
(Notes) 1. The reduction in the 2019-20 Budget Target compared to the 2018-19 Estimated Actual is mainly due to once-off grant
payments in 2018-19 relating to the West Australian Football Commission and Tennis West relocations. 2. The increase in the 2018-19 Estimated Actual compared to the 2018-19 Budget is mainly due to decreased contacts
for infrastructure projects including major stadia, as well as refinements in service delivery regimes.
20. Building Capacity and Participation
Provide support for organisations and personnel delivering sport and recreation State-wide from participation to the elite level through advice and funding support.
2017-18
Actual
2018-19
Budget
2018-19 Estimated
Actual
2019-20 Budget Target
Note
$’000 $’000 $’000 $’000 Total Cost of Service ...................................................................................... 45,666 49,213 50,035 50,387 Less Income ................................................................................................... 1,005 1,742 1,742 1,744
Net Cost of Service ........................................................................................ 44,661 47,471 48,293 48,643
Employees (Full-Time Equivalents) ............................................................ 66 66 66 66
Efficiency Indicators Average cost of providing consultancy (organisational development and
participation) to organisations ...................................................................... $13,565 $18,080 $18,647 $17,946 Average cost of providing the contact services (organisational
development and participation) .................................................................... $344 $587 $840 $798 1 Average cost to manage sport and recreation development grants ............... $2,026 $2,739 $3,433 $3,021 2
Explanation of Significant Movements
(Notes) 1. The increase in the 2018-19 Estimated Actual and 2019-20 Budget Target compared to the 2018-19 Budget is mainly
due to decreased contacts as a result of refinements in service delivery regimes, and continued implementation of service agreements with community organisations to provide services on behalf of the Department.
2. The increase in the 2018-19 Estimated Actual and 2019-20 Budget Target compared to the 2018-19 Budget is mainly due
to the consolidation of grant programs including the Annual Grant Program not being offered in 2018-19 thus decreasing the total number of grants managed. The Department has undertaken a Strategic Funding Review in 2018-19 to guide the future investment in the sport and recreation industry and, as a result, no new funding programs have been introduced.
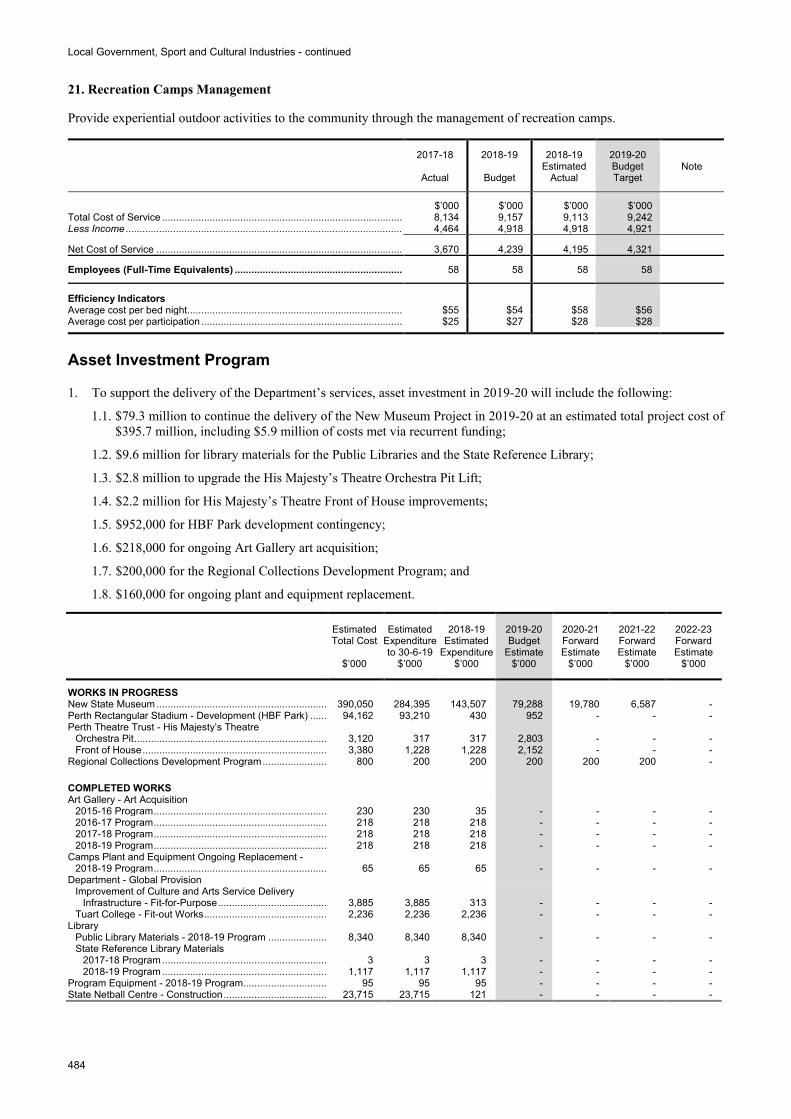
Local Government, Sport and Cultural Industries - continued
484
21. Recreation Camps Management
Provide experiential outdoor activities to the community through the management of recreation camps.
2017-18
Actual
2018-19
Budget
2018-19 Estimated
Actual
2019-20 Budget Target
Note
$’000 $’000 $’000 $’000 Total Cost of Service ...................................................................................... 8,134 9,157 9,113 9,242 Less Income ................................................................................................... 4,464 4,918 4,918 4,921
Net Cost of Service ........................................................................................ 3,670 4,239 4,195 4,321
Employees (Full-Time Equivalents) ............................................................ 58 58 58 58
Efficiency Indicators Average cost per bed night ............................................................................. $55 $54 $58 $56 Average cost per participation ........................................................................ $25 $27 $28 $28
Asset Investment Program
1. To support the delivery of the Department’s services, asset investment in 2019-20 will include the following:
1.1. $79.3 million to continue the delivery of the New Museum Project in 2019-20 at an estimated total project cost of $395.7 million, including $5.9 million of costs met via recurrent funding;
1.2. $9.6 million for library materials for the Public Libraries and the State Reference Library;
1.3. $2.8 million to upgrade the His Majesty’s Theatre Orchestra Pit Lift;
1.4. $2.2 million for His Majesty’s Theatre Front of House improvements;
1.5. $952,000 for HBF Park development contingency;
1.6. $218,000 for ongoing Art Gallery art acquisition;
1.7. $200,000 for the Regional Collections Development Program; and
1.8. $160,000 for ongoing plant and equipment replacement.
Estimated Total Cost
$’000
Estimated Expenditure to 30-6-19
$’000
2018-19 Estimated
Expenditure $’000
2019-20 Budget
Estimate $’000
2020-21 Forward Estimate
$’000
2021-22 Forward Estimate
$’000
2022-23 Forward Estimate
$’000
WORKS IN PROGRESS New State Museum ............................................................. 390,050 284,395 143,507 79,288 19,780 6,587 - Perth Rectangular Stadium - Development (HBF Park) ...... 94,162 93,210 430 952 - - - Perth Theatre Trust - His Majesty’s Theatre
Orchestra Pit ..................................................................... 3,120 317 317 2,803 - - - Front of House .................................................................. 3,380 1,228 1,228 2,152 - - -
Regional Collections Development Program ....................... 800 200 200 200 200 200 -
COMPLETED WORKS Art Gallery - Art Acquisition
2015-16 Program .............................................................. 230 230 35 - - - - 2016-17 Program .............................................................. 218 218 218 - - - - 2017-18 Program .............................................................. 218 218 218 - - - - 2018-19 Program .............................................................. 218 218 218 - - - -
Camps Plant and Equipment Ongoing Replacement - 2018-19 Program .............................................................. 65 65 65 - - - -
Department - Global Provision Improvement of Culture and Arts Service Delivery
Infrastructure - Fit-for-Purpose ....................................... 3,885 3,885 313 - - - - Tuart College - Fit-out Works ............................................ 2,236 2,236 2,236 - - - -
Library Public Library Materials - 2018-19 Program ..................... 8,340 8,340 8,340 - - - - State Reference Library Materials
2017-18 Program ........................................................... 3 3 3 - - - - 2018-19 Program ........................................................... 1,117 1,117 1,117 - - - -
Program Equipment - 2018-19 Program.............................. 95 95 95 - - - - State Netball Centre - Construction ..................................... 23,715 23,715 121 - - - -
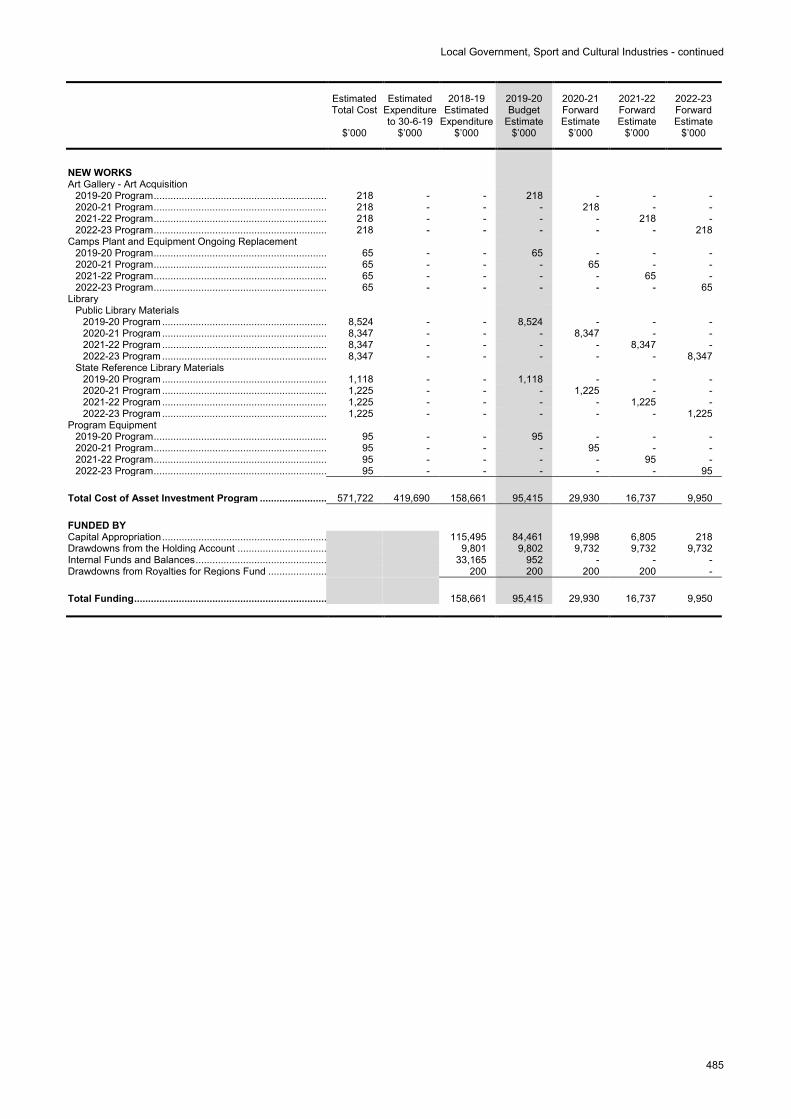
Local Government, Sport and Cultural Industries - continued
485
Estimated Total Cost
$’000
Estimated Expenditure to 30-6-19
$’000
2018-19 Estimated
Expenditure $’000
2019-20 Budget
Estimate $’000
2020-21 Forward Estimate
$’000
2021-22 Forward Estimate
$’000
2022-23 Forward Estimate
$’000
NEW WORKS Art Gallery - Art Acquisition
2019-20 Program .............................................................. 218 - - 218 - - - 2020-21 Program .............................................................. 218 - - - 218 - - 2021-22 Program .............................................................. 218 - - - - 218 - 2022-23 Program .............................................................. 218 - - - - - 218
Camps Plant and Equipment Ongoing Replacement 2019-20 Program .............................................................. 65 - - 65 - - - 2020-21 Program .............................................................. 65 - - - 65 - - 2021-22 Program .............................................................. 65 - - - - 65 - 2022-23 Program .............................................................. 65 - - - - - 65
Library Public Library Materials
2019-20 Program ........................................................... 8,524 - - 8,524 - - - 2020-21 Program ........................................................... 8,347 - - - 8,347 - - 2021-22 Program ........................................................... 8,347 - - - - 8,347 - 2022-23 Program ........................................................... 8,347 - - - - - 8,347
State Reference Library Materials 2019-20 Program ........................................................... 1,118 - - 1,118 - - - 2020-21 Program ........................................................... 1,225 - - - 1,225 - - 2021-22 Program ........................................................... 1,225 - - - - 1,225 - 2022-23 Program ........................................................... 1,225 - - - - - 1,225
Program Equipment 2019-20 Program .............................................................. 95 - - 95 - - - 2020-21 Program .............................................................. 95 - - - 95 - - 2021-22 Program .............................................................. 95 - - - - 95 - 2022-23 Program .............................................................. 95 - - - - - 95
Total Cost of Asset Investment Program ........................ 571,722 419,690 158,661 95,415 29,930 16,737 9,950
FUNDED BY Capital Appropriation ........................................................... 115,495 84,461 19,998 6,805 218 Drawdowns from the Holding Account ................................ 9,801 9,802 9,732 9,732 9,732 Internal Funds and Balances ............................................... 33,165 952 - - - Drawdowns from Royalties for Regions Fund ..................... 200 200 200 200 -
Total Funding ..................................................................... 158,661 95,415 29,930 16,737 9,950
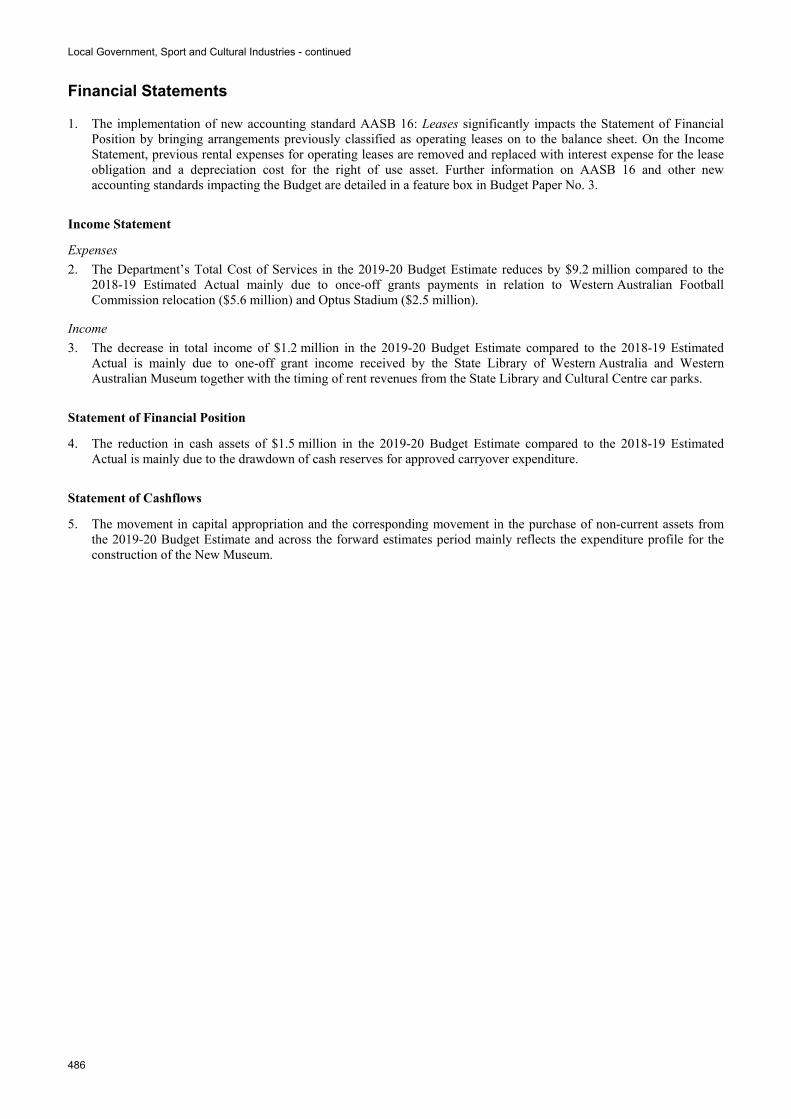
Local Government, Sport and Cultural Industries - continued
486
Financial Statements
1. The implementation of new accounting standard AASB 16: Leases significantly impacts the Statement of Financial Position by bringing arrangements previously classified as operating leases on to the balance sheet. On the Income Statement, previous rental expenses for operating leases are removed and replaced with interest expense for the lease obligation and a depreciation cost for the right of use asset. Further information on AASB 16 and other new accounting standards impacting the Budget are detailed in a feature box in Budget Paper No. 3.
Income Statement
Expenses 2. The Department’s Total Cost of Services in the 2019-20 Budget Estimate reduces by $9.2 million compared to the
2018-19 Estimated Actual mainly due to once-off grants payments in relation to Western Australian Football Commission relocation ($5.6 million) and Optus Stadium ($2.5 million).
Income 3. The decrease in total income of $1.2 million in the 2019-20 Budget Estimate compared to the 2018-19 Estimated
Actual is mainly due to one-off grant income received by the State Library of Western Australia and Western Australian Museum together with the timing of rent revenues from the State Library and Cultural Centre car parks.
Statement of Financial Position
4. The reduction in cash assets of $1.5 million in the 2019-20 Budget Estimate compared to the 2018-19 Estimated Actual is mainly due to the drawdown of cash reserves for approved carryover expenditure.
Statement of Cashflows
5. The movement in capital appropriation and the corresponding movement in the purchase of non-current assets from the 2019-20 Budget Estimate and across the forward estimates period mainly reflects the expenditure profile for the construction of the New Museum.
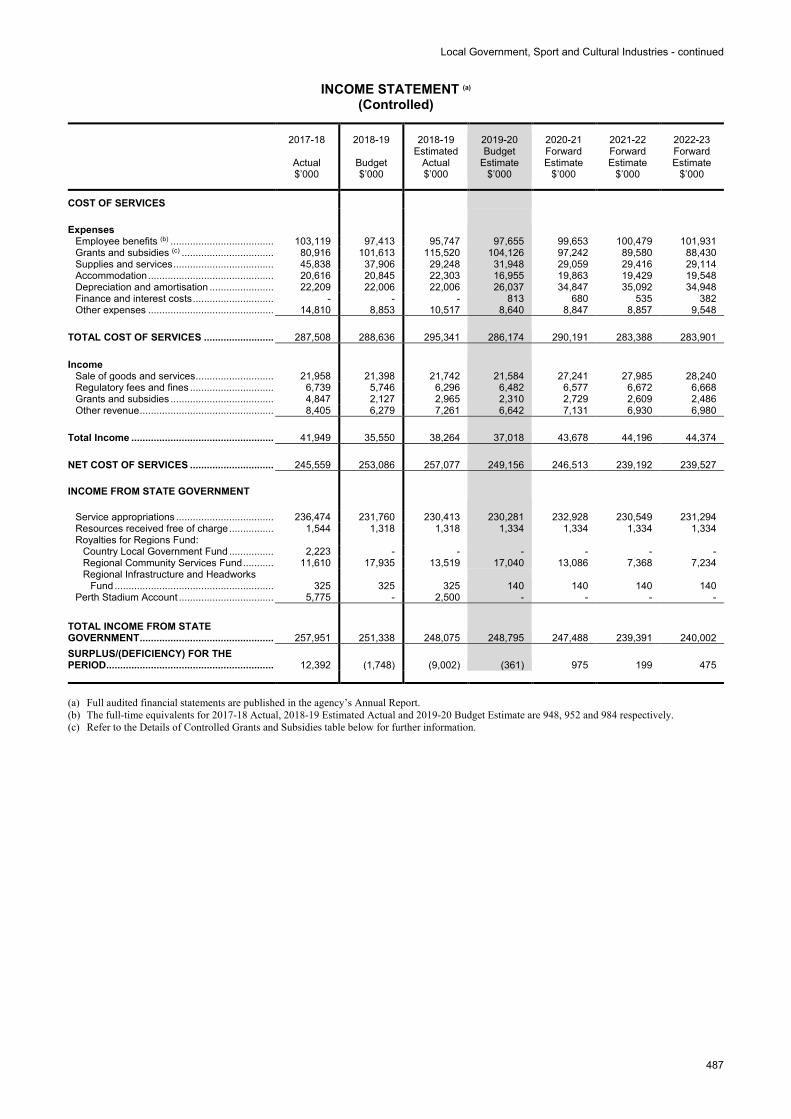
Local Government, Sport and Cultural Industries - continued
487
INCOME STATEMENT (a)
(Controlled)
2017-18
Actual $’000
2018-19
Budget $’000
2018-19 Estimated
Actual $’000
2019-20 Budget
Estimate $’000
2020-21 Forward Estimate
$’000
2021-22 Forward Estimate
$’000
2022-23 Forward Estimate
$’000
COST OF SERVICES
Expenses Employee benefits (b) ..................................... 103,119 97,413 95,747 97,655 99,653 100,479 101,931 Grants and subsidies (c) ................................. 80,916 101,613 115,520 104,126 97,242 89,580 88,430 Supplies and services .................................... 45,838 37,906 29,248 31,948 29,059 29,416 29,114 Accommodation ............................................. 20,616 20,845 22,303 16,955 19,863 19,429 19,548 Depreciation and amortisation ....................... 22,209 22,006 22,006 26,037 34,847 35,092 34,948 Finance and interest costs ............................. - - - 813 680 535 382 Other expenses ............................................. 14,810 8,853 10,517 8,640 8,847 8,857 9,548
TOTAL COST OF SERVICES ......................... 287,508 288,636 295,341 286,174 290,191 283,388 283,901
Income Sale of goods and services ............................ 21,958 21,398 21,742 21,584 27,241 27,985 28,240 Regulatory fees and fines .............................. 6,739 5,746 6,296 6,482 6,577 6,672 6,668 Grants and subsidies ..................................... 4,847 2,127 2,965 2,310 2,729 2,609 2,486 Other revenue ................................................ 8,405 6,279 7,261 6,642 7,131 6,930 6,980
Total Income ................................................... 41,949 35,550 38,264 37,018 43,678 44,196 44,374
NET COST OF SERVICES .............................. 245,559 253,086 257,077 249,156 246,513 239,192 239,527
INCOME FROM STATE GOVERNMENT
Service appropriations ................................... 236,474 231,760 230,413 230,281 232,928 230,549 231,294 Resources received free of charge ................ 1,544 1,318 1,318 1,334 1,334 1,334 1,334 Royalties for Regions Fund:
Country Local Government Fund ................ 2,223 - - - - - - Regional Community Services Fund ........... 11,610 17,935 13,519 17,040 13,086 7,368 7,234 Regional Infrastructure and Headworks
Fund ......................................................... 325 325 325 140 140 140 140 Perth Stadium Account .................................. 5,775 - 2,500 - - - -
TOTAL INCOME FROM STATE GOVERNMENT ................................................ 257,951 251,338 248,075 248,795 247,488 239,391 240,002 SURPLUS/(DEFICIENCY) FOR THE PERIOD ............................................................ 12,392 (1,748) (9,002) (361) 975 199 475 (a) Full audited financial statements are published in the agency’s Annual Report. (b) The full-time equivalents for 2017-18 Actual, 2018-19 Estimated Actual and 2019-20 Budget Estimate are 948, 952 and 984 respectively. (c) Refer to the Details of Controlled Grants and Subsidies table below for further information.
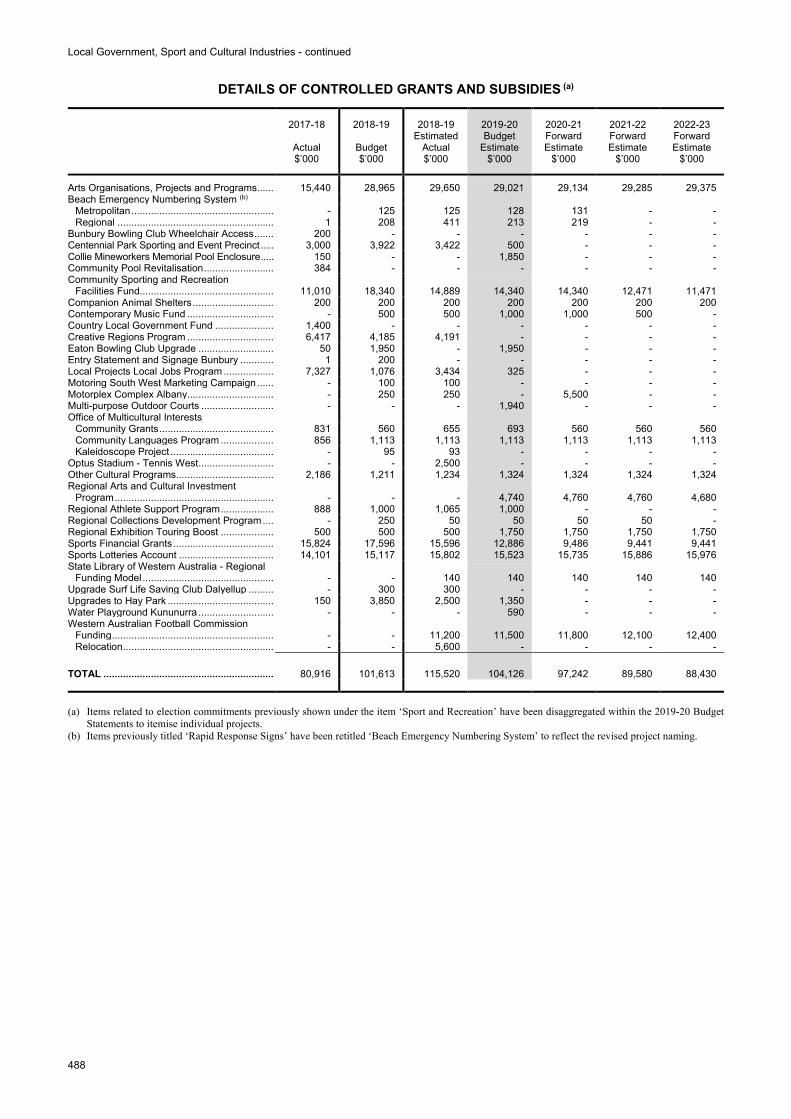
Local Government, Sport and Cultural Industries - continued
488
DETAILS OF CONTROLLED GRANTS AND SUBSIDIES (a)
2017-18
Actual $’000
2018-19
Budget $’000
2018-19 Estimated
Actual $’000
2019-20 Budget
Estimate $’000
2020-21 Forward Estimate
$’000
2021-22 Forward Estimate
$’000
2022-23 Forward Estimate
$’000
Arts Organisations, Projects and Programs ...... 15,440 28,965 29,650 29,021 29,134 29,285 29,375 Beach Emergency Numbering System (b)
Metropolitan ................................................... - 125 125 128 131 - - Regional ........................................................ 1 208 411 213 219 - -
Bunbury Bowling Club Wheelchair Access ....... 200 - - - - - - Centennial Park Sporting and Event Precinct ..... 3,000 3,922 3,422 500 - - - Collie Mineworkers Memorial Pool Enclosure ..... 150 - - 1,850 - - - Community Pool Revitalisation ......................... 384 - - - - - - Community Sporting and Recreation
Facilities Fund................................................ 11,010 18,340 14,889 14,340 14,340 12,471 11,471 Companion Animal Shelters ............................. 200 200 200 200 200 200 200 Contemporary Music Fund ............................... - 500 500 1,000 1,000 500 - Country Local Government Fund ..................... 1,400 - - - - - - Creative Regions Program ............................... 6,417 4,185 4,191 - - - - Eaton Bowling Club Upgrade ........................... 50 1,950 - 1,950 - - - Entry Statement and Signage Bunbury ............ 1 200 - - - - - Local Projects Local Jobs Program .................. 7,327 1,076 3,434 325 - - - Motoring South West Marketing Campaign ...... - 100 100 - - - - Motorplex Complex Albany ............................... - 250 250 - 5,500 - - Multi-purpose Outdoor Courts .......................... - - - 1,940 - - - Office of Multicultural Interests
Community Grants ......................................... 831 560 655 693 560 560 560 Community Languages Program ................... 856 1,113 1,113 1,113 1,113 1,113 1,113 Kaleidoscope Project ..................................... - 95 93 - - - -
Optus Stadium - Tennis West ........................... - - 2,500 - - - - Other Cultural Programs ................................... 2,186 1,211 1,234 1,324 1,324 1,324 1,324 Regional Arts and Cultural Investment
Program ......................................................... - - - 4,740 4,760 4,760 4,680 Regional Athlete Support Program ................... 888 1,000 1,065 1,000 - - - Regional Collections Development Program .... - 250 50 50 50 50 - Regional Exhibition Touring Boost ................... 500 500 500 1,750 1,750 1,750 1,750 Sports Financial Grants .................................... 15,824 17,596 15,596 12,886 9,486 9,441 9,441 Sports Lotteries Account .................................. 14,101 15,117 15,802 15,523 15,735 15,886 15,976 State Library of Western Australia - Regional
Funding Model ............................................... - - 140 140 140 140 140 Upgrade Surf Life Saving Club Dalyellup ......... - 300 300 - - - - Upgrades to Hay Park ...................................... 150 3,850 2,500 1,350 - - - Water Playground Kununurra ........................... - - - 590 - - - Western Australian Football Commission
Funding .......................................................... - - 11,200 11,500 11,800 12,100 12,400 Relocation ...................................................... - - 5,600 - - - -
TOTAL ............................................................. 80,916 101,613 115,520 104,126 97,242 89,580 88,430 (a) Items related to election commitments previously shown under the item ‘Sport and Recreation’ have been disaggregated within the 2019-20 Budget
Statements to itemise individual projects. (b) Items previously titled ‘Rapid Response Signs’ have been retitled ‘Beach Emergency Numbering System’ to reflect the revised project naming.
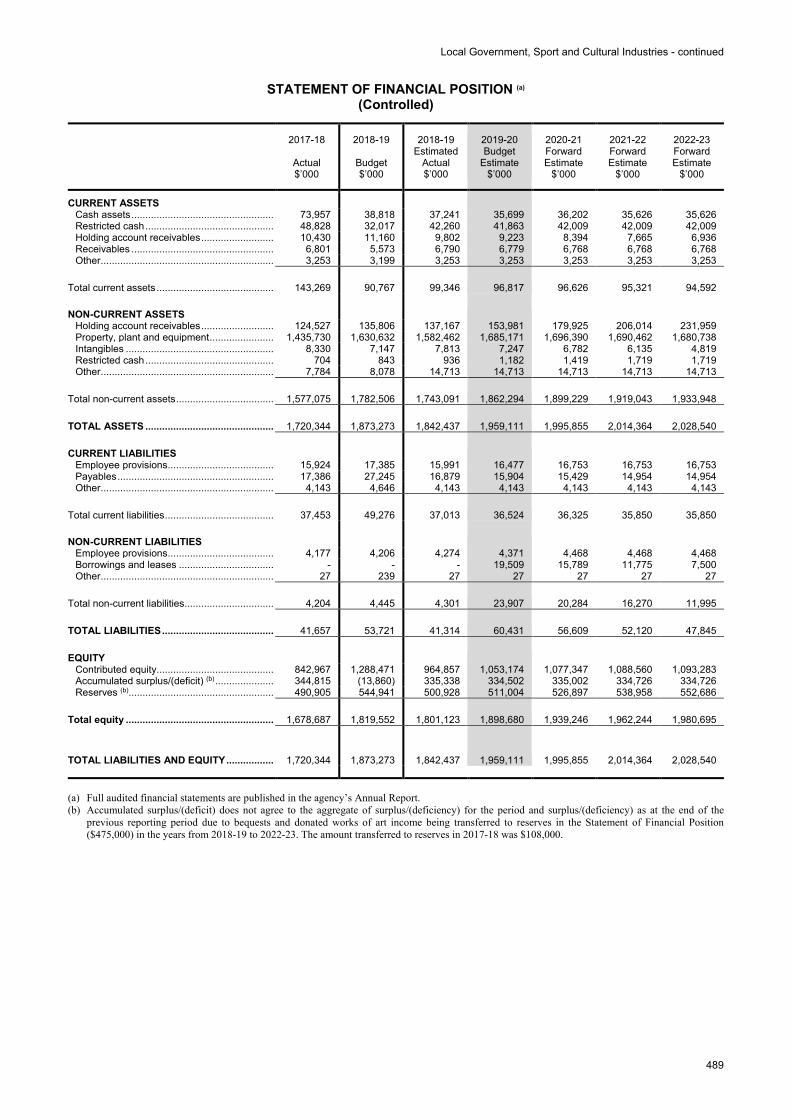
Local Government, Sport and Cultural Industries - continued
489
STATEMENT OF FINANCIAL POSITION (a)
(Controlled)
2017-18
Actual $’000
2018-19
Budget $’000
2018-19 Estimated
Actual $’000
2019-20 Budget
Estimate $’000
2020-21 Forward Estimate
$’000
2021-22 Forward Estimate
$’000
2022-23 Forward Estimate
$’000
CURRENT ASSETS Cash assets ................................................... 73,957 38,818 37,241 35,699 36,202 35,626 35,626 Restricted cash .............................................. 48,828 32,017 42,260 41,863 42,009 42,009 42,009 Holding account receivables .......................... 10,430 11,160 9,802 9,223 8,394 7,665 6,936 Receivables ................................................... 6,801 5,573 6,790 6,779 6,768 6,768 6,768 Other .............................................................. 3,253 3,199 3,253 3,253 3,253 3,253 3,253
Total current assets .......................................... 143,269 90,767 99,346 96,817 96,626 95,321 94,592
NON-CURRENT ASSETS Holding account receivables .......................... 124,527 135,806 137,167 153,981 179,925 206,014 231,959 Property, plant and equipment ....................... 1,435,730 1,630,632 1,582,462 1,685,171 1,696,390 1,690,462 1,680,738 Intangibles ..................................................... 8,330 7,147 7,813 7,247 6,782 6,135 4,819 Restricted cash .............................................. 704 843 936 1,182 1,419 1,719 1,719 Other .............................................................. 7,784 8,078 14,713 14,713 14,713 14,713 14,713
Total non-current assets ................................... 1,577,075 1,782,506 1,743,091 1,862,294 1,899,229 1,919,043 1,933,948
TOTAL ASSETS .............................................. 1,720,344 1,873,273 1,842,437 1,959,111 1,995,855 2,014,364 2,028,540
CURRENT LIABILITIES Employee provisions ...................................... 15,924 17,385 15,991 16,477 16,753 16,753 16,753 Payables ........................................................ 17,386 27,245 16,879 15,904 15,429 14,954 14,954 Other .............................................................. 4,143 4,646 4,143 4,143 4,143 4,143 4,143
Total current liabilities ....................................... 37,453 49,276 37,013 36,524 36,325 35,850 35,850
NON-CURRENT LIABILITIES Employee provisions ...................................... 4,177 4,206 4,274 4,371 4,468 4,468 4,468 Borrowings and leases .................................. - - - 19,509 15,789 11,775 7,500 Other .............................................................. 27 239 27 27 27 27 27
Total non-current liabilities ................................ 4,204 4,445 4,301 23,907 20,284 16,270 11,995
TOTAL LIABILITIES ........................................ 41,657 53,721 41,314 60,431 56,609 52,120 47,845
EQUITY Contributed equity .......................................... 842,967 1,288,471 964,857 1,053,174 1,077,347 1,088,560 1,093,283 Accumulated surplus/(deficit) (b) ..................... 344,815 (13,860) 335,338 334,502 335,002 334,726 334,726 Reserves (b).................................................... 490,905 544,941 500,928 511,004 526,897 538,958 552,686
Total equity ..................................................... 1,678,687 1,819,552 1,801,123 1,898,680 1,939,246 1,962,244 1,980,695
TOTAL LIABILITIES AND EQUITY ................. 1,720,344 1,873,273 1,842,437 1,959,111 1,995,855 2,014,364 2,028,540 (a) Full audited financial statements are published in the agency’s Annual Report. (b) Accumulated surplus/(deficit) does not agree to the aggregate of surplus/(deficiency) for the period and surplus/(deficiency) as at the end of the
previous reporting period due to bequests and donated works of art income being transferred to reserves in the Statement of Financial Position ($475,000) in the years from 2018-19 to 2022-23. The amount transferred to reserves in 2017-18 was $108,000.
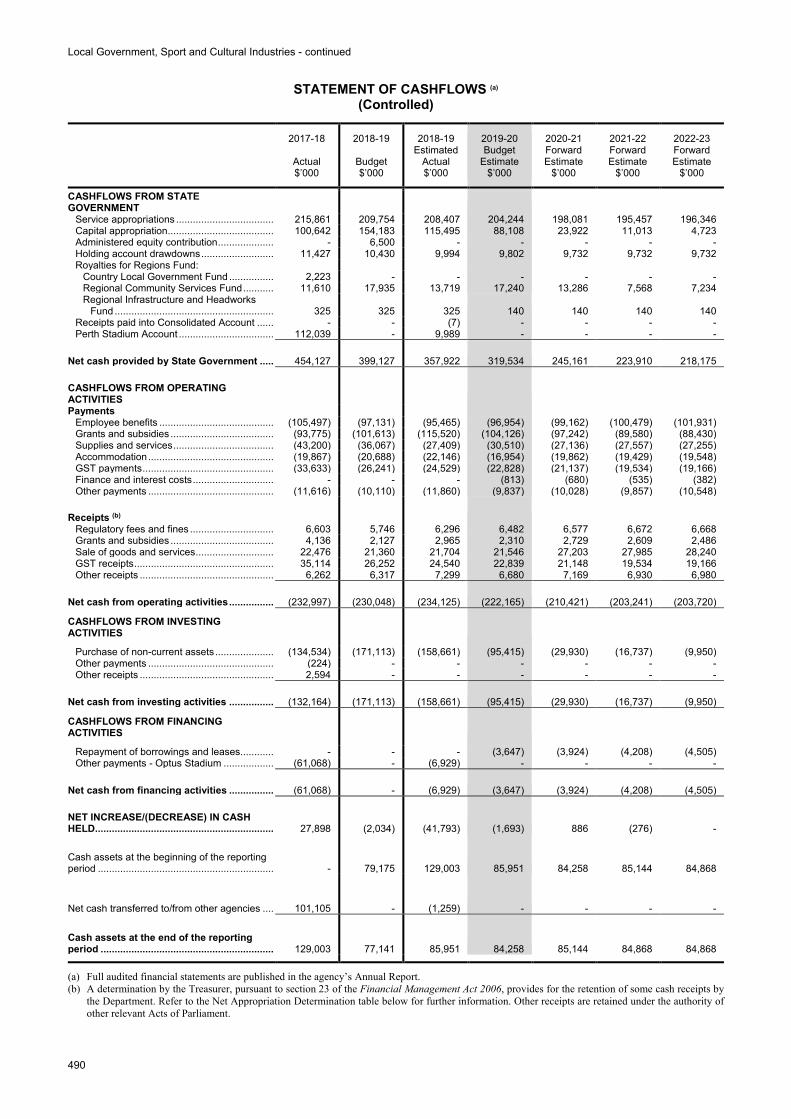
Local Government, Sport and Cultural Industries - continued
490
STATEMENT OF CASHFLOWS (a)
(Controlled)
2017-18
Actual $’000
2018-19
Budget $’000
2018-19 Estimated
Actual $’000
2019-20 Budget
Estimate $’000
2020-21 Forward Estimate
$’000
2021-22 Forward Estimate
$’000
2022-23 Forward Estimate
$’000
CASHFLOWS FROM STATE GOVERNMENT
Service appropriations ................................... 215,861 209,754 208,407 204,244 198,081 195,457 196,346 Capital appropriation ...................................... 100,642 154,183 115,495 88,108 23,922 11,013 4,723 Administered equity contribution .................... - 6,500 - - - - - Holding account drawdowns .......................... 11,427 10,430 9,994 9,802 9,732 9,732 9,732 Royalties for Regions Fund:
Country Local Government Fund ................ 2,223 - - - - - - Regional Community Services Fund ........... 11,610 17,935 13,719 17,240 13,286 7,568 7,234 Regional Infrastructure and Headworks
Fund ......................................................... 325 325 325 140 140 140 140 Receipts paid into Consolidated Account ...... - - (7) - - - - Perth Stadium Account .................................. 112,039 - 9,989 - - - -
Net cash provided by State Government ..... 454,127 399,127 357,922 319,534 245,161 223,910 218,175
CASHFLOWS FROM OPERATING ACTIVITIES Payments
Employee benefits ......................................... (105,497) (97,131) (95,465) (96,954) (99,162) (100,479) (101,931) Grants and subsidies ..................................... (93,775) (101,613) (115,520) (104,126) (97,242) (89,580) (88,430) Supplies and services .................................... (43,200) (36,067) (27,409) (30,510) (27,136) (27,557) (27,255) Accommodation ............................................. (19,867) (20,688) (22,146) (16,954) (19,862) (19,429) (19,548) GST payments ............................................... (33,633) (26,241) (24,529) (22,828) (21,137) (19,534) (19,166) Finance and interest costs ............................. - - - (813) (680) (535) (382) Other payments ............................................. (11,616) (10,110) (11,860) (9,837) (10,028) (9,857) (10,548)
Receipts (b) Regulatory fees and fines .............................. 6,603 5,746 6,296 6,482 6,577 6,672 6,668 Grants and subsidies ..................................... 4,136 2,127 2,965 2,310 2,729 2,609 2,486 Sale of goods and services ............................ 22,476 21,360 21,704 21,546 27,203 27,985 28,240 GST receipts .................................................. 35,114 26,252 24,540 22,839 21,148 19,534 19,166 Other receipts ................................................ 6,262 6,317 7,299 6,680 7,169 6,930 6,980
Net cash from operating activities ................ (232,997) (230,048) (234,125) (222,165) (210,421) (203,241) (203,720)
CASHFLOWS FROM INVESTING ACTIVITIES
Purchase of non-current assets ..................... (134,534) (171,113) (158,661) (95,415) (29,930) (16,737) (9,950) Other payments ............................................. (224) - - - - - - Other receipts ................................................ 2,594 - - - - - -
Net cash from investing activities ................ (132,164) (171,113) (158,661) (95,415) (29,930) (16,737) (9,950)
CASHFLOWS FROM FINANCING ACTIVITIES
Repayment of borrowings and leases ............ - - - (3,647) (3,924) (4,208) (4,505) Other payments - Optus Stadium .................. (61,068) - (6,929) - - - -
Net cash from financing activities ................ (61,068) - (6,929) (3,647) (3,924) (4,208) (4,505)
NET INCREASE/(DECREASE) IN CASH HELD................................................................ 27,898 (2,034) (41,793) (1,693) 886 (276) -
Cash assets at the beginning of the reporting period ............................................................... - 79,175 129,003 85,951 84,258 85,144 84,868
Net cash transferred to/from other agencies .... 101,105 - (1,259) - - - -
Cash assets at the end of the reporting period .............................................................. 129,003 77,141 85,951 84,258 85,144 84,868 84,868
(a) Full audited financial statements are published in the agency’s Annual Report. (b) A determination by the Treasurer, pursuant to section 23 of the Financial Management Act 2006, provides for the retention of some cash receipts by
the Department. Refer to the Net Appropriation Determination table below for further information. Other receipts are retained under the authority of other relevant Acts of Parliament.
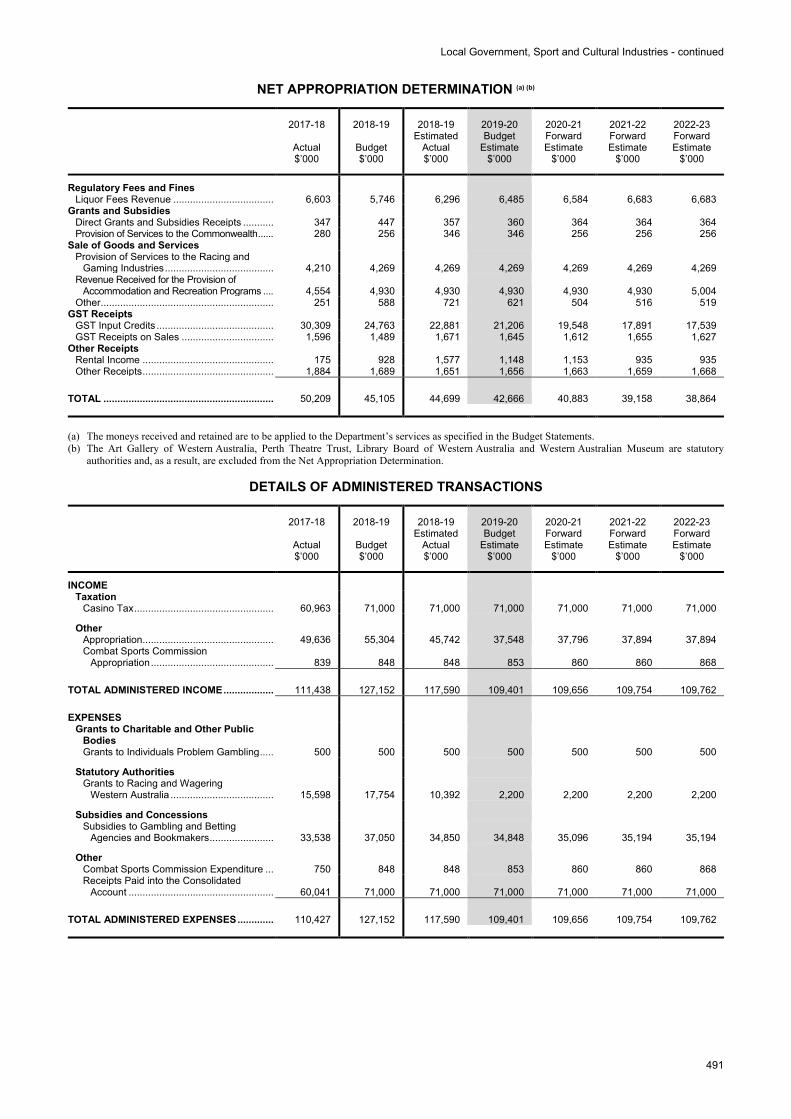
Local Government, Sport and Cultural Industries - continued
491
NET APPROPRIATION DETERMINATION (a) (b)
2017-18
Actual $’000
2018-19
Budget $’000
2018-19 Estimated
Actual $’000
2019-20 Budget
Estimate $’000
2020-21 Forward Estimate
$’000
2021-22 Forward Estimate
$’000
2022-23 Forward Estimate
$’000
Regulatory Fees and Fines Liquor Fees Revenue .................................... 6,603 5,746 6,296 6,485 6,584 6,683 6,683
Grants and Subsidies Direct Grants and Subsidies Receipts ........... 347 447 357 360 364 364 364 Provision of Services to the Commonwealth ...... 280 256 346 346 256 256 256
Sale of Goods and Services Provision of Services to the Racing and
Gaming Industries ....................................... 4,210 4,269 4,269 4,269 4,269 4,269 4,269 Revenue Received for the Provision of
Accommodation and Recreation Programs .... 4,554 4,930 4,930 4,930 4,930 4,930 5,004 Other .............................................................. 251 588 721 621 504 516 519
GST Receipts GST Input Credits .......................................... 30,309 24,763 22,881 21,206 19,548 17,891 17,539 GST Receipts on Sales ................................. 1,596 1,489 1,671 1,645 1,612 1,655 1,627
Other Receipts Rental Income ............................................... 175 928 1,577 1,148 1,153 935 935 Other Receipts ............................................... 1,884 1,689 1,651 1,656 1,663 1,659 1,668
TOTAL ............................................................. 50,209 45,105 44,699 42,666 40,883 39,158 38,864 (a) The moneys received and retained are to be applied to the Department’s services as specified in the Budget Statements. (b) The Art Gallery of Western Australia, Perth Theatre Trust, Library Board of Western Australia and Western Australian Museum are statutory
authorities and, as a result, are excluded from the Net Appropriation Determination.
DETAILS OF ADMINISTERED TRANSACTIONS
2017-18
Actual $’000
2018-19
Budget $’000
2018-19 Estimated
Actual $’000
2019-20 Budget
Estimate $’000
2020-21 Forward Estimate
$’000
2021-22 Forward Estimate
$’000
2022-23 Forward Estimate
$’000
INCOME Taxation
Casino Tax .................................................. 60,963 71,000 71,000 71,000 71,000 71,000 71,000
Other Appropriation ............................................... 49,636 55,304 45,742 37,548 37,796 37,894 37,894 Combat Sports Commission
Appropriation ............................................ 839 848 848 853 860 860 868
TOTAL ADMINISTERED INCOME .................. 111,438 127,152 117,590 109,401 109,656 109,754 109,762
EXPENSES Grants to Charitable and Other Public
Bodies Grants to Individuals Problem Gambling ..... 500 500 500 500 500 500 500
Statutory Authorities Grants to Racing and Wagering
Western Australia ..................................... 15,598 17,754 10,392 2,200 2,200 2,200 2,200
Subsidies and Concessions Subsidies to Gambling and Betting
Agencies and Bookmakers ....................... 33,538 37,050 34,850 34,848 35,096 35,194 35,194
Other Combat Sports Commission Expenditure ... 750 848 848 853 860 860 868 Receipts Paid into the Consolidated
Account .................................................... 60,041 71,000 71,000 71,000 71,000 71,000 71,000
TOTAL ADMINISTERED EXPENSES ............. 110,427 127,152 117,590 109,401 109,656 109,754 109,762
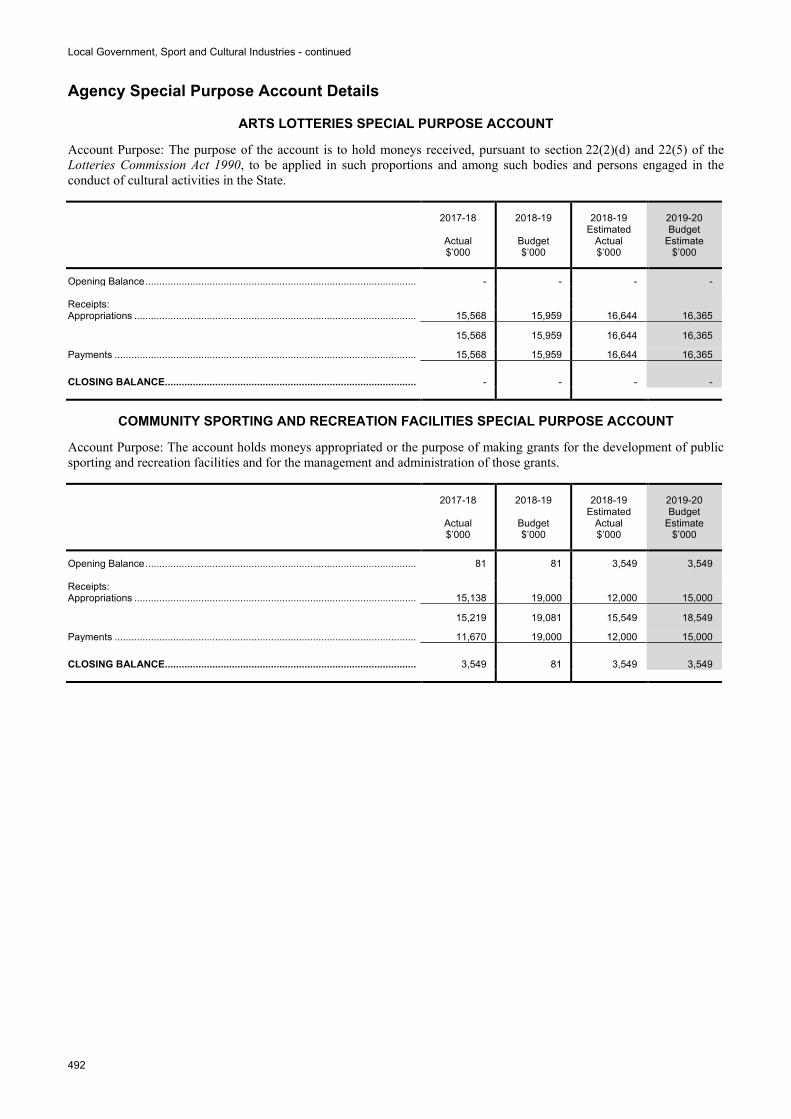
Local Government, Sport and Cultural Industries - continued
492
Agency Special Purpose Account Details
ARTS LOTTERIES SPECIAL PURPOSE ACCOUNT
Account Purpose: The purpose of the account is to hold moneys received, pursuant to section 22(2)(d) and 22(5) of the Lotteries Commission Act 1990, to be applied in such proportions and among such bodies and persons engaged in the conduct of cultural activities in the State.
2017-18
Actual $’000
2018-19
Budget $’000
2018-19 Estimated
Actual $’000
2019-20 Budget
Estimate $’000
Opening Balance ................................................................................................. - - - - Receipts: Appropriations ..................................................................................................... 15,568 15,959 16,644 16,365
15,568 15,959 16,644 16,365
Payments ............................................................................................................ 15,568 15,959 16,644 16,365
CLOSING BALANCE.......................................................................................... - - - -
COMMUNITY SPORTING AND RECREATION FACILITIES SPECIAL PURPOSE ACCOUNT
Account Purpose: The account holds moneys appropriated or the purpose of making grants for the development of public sporting and recreation facilities and for the management and administration of those grants.
2017-18
Actual $’000
2018-19
Budget $’000
2018-19 Estimated
Actual $’000
2019-20 Budget
Estimate $’000
Opening Balance ................................................................................................. 81 81 3,549 3,549 Receipts: Appropriations ..................................................................................................... 15,138 19,000 12,000 15,000
15,219 19,081 15,549 18,549
Payments ............................................................................................................ 11,670 19,000 12,000 15,000
CLOSING BALANCE.......................................................................................... 3,549 81 3,549 3,549
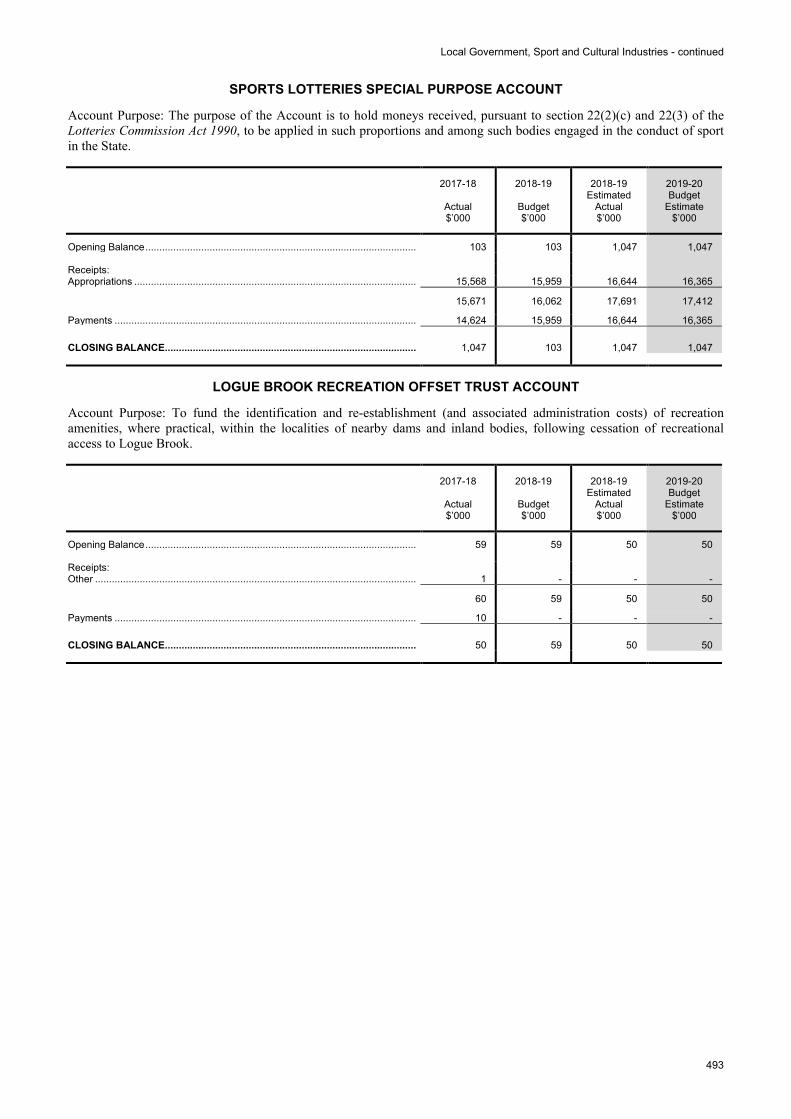
Local Government, Sport and Cultural Industries - continued
493
SPORTS LOTTERIES SPECIAL PURPOSE ACCOUNT
Account Purpose: The purpose of the Account is to hold moneys received, pursuant to section 22(2)(c) and 22(3) of the Lotteries Commission Act 1990, to be applied in such proportions and among such bodies engaged in the conduct of sport in the State.
2017-18
Actual $’000
2018-19
Budget $’000
2018-19 Estimated
Actual $’000
2019-20 Budget
Estimate $’000
Opening Balance ................................................................................................. 103 103 1,047 1,047 Receipts: Appropriations ..................................................................................................... 15,568 15,959 16,644 16,365
15,671 16,062 17,691 17,412
Payments ............................................................................................................ 14,624 15,959 16,644 16,365
CLOSING BALANCE.......................................................................................... 1,047 103 1,047 1,047
LOGUE BROOK RECREATION OFFSET TRUST ACCOUNT
Account Purpose: To fund the identification and re-establishment (and associated administration costs) of recreation amenities, where practical, within the localities of nearby dams and inland bodies, following cessation of recreational access to Logue Brook.
2017-18
Actual $’000
2018-19
Budget $’000
2018-19 Estimated
Actual $’000
2019-20 Budget
Estimate $’000
Opening Balance ................................................................................................. 59 59 50 50 Receipts: Other ................................................................................................................... 1 - - -
60 59 50 50
Payments ............................................................................................................ 10 - - -
CLOSING BALANCE.......................................................................................... 50 59 50 50
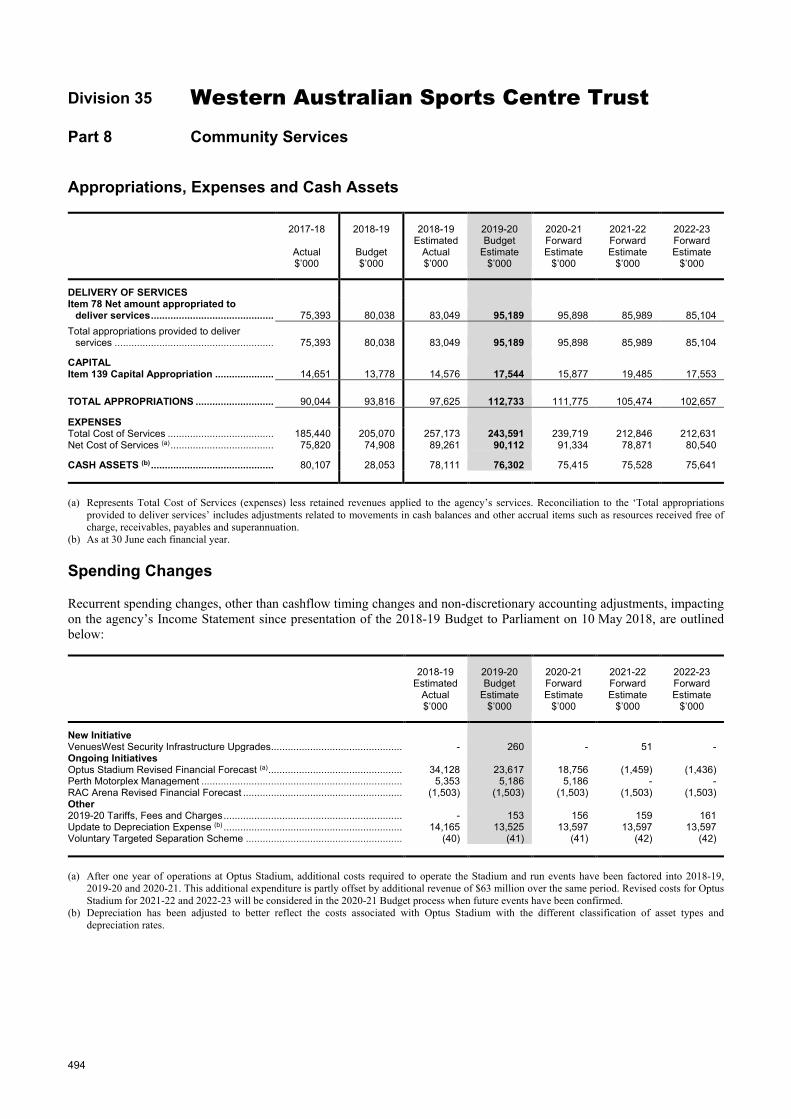
494
Division 35 Western Australian Sports Centre Trust
Part 8 Community Services
Appropriations, Expenses and Cash Assets
2017-18
Actual $’000
2018-19
Budget $’000
2018-19 Estimated
Actual $’000
2019-20 Budget
Estimate $’000
2020-21 Forward Estimate
$’000
2021-22 Forward Estimate
$’000
2022-23 Forward Estimate
$’000
DELIVERY OF SERVICES Item 78 Net amount appropriated to
deliver services ............................................ 75,393 80,038 83,049 95,189 95,898 85,989 85,104 Total appropriations provided to deliver
services ......................................................... 75,393 80,038 83,049 95,189 95,898 85,989 85,104
CAPITAL Item 139 Capital Appropriation ..................... 14,651 13,778 14,576 17,544 15,877 19,485 17,553
TOTAL APPROPRIATIONS ............................ 90,044 93,816 97,625 112,733 111,775 105,474 102,657
EXPENSES Total Cost of Services ...................................... 185,440 205,070 257,173 243,591 239,719 212,846 212,631 Net Cost of Services (a) ..................................... 75,820 74,908 89,261 90,112 91,334 78,871 80,540
CASH ASSETS (b) ............................................ 80,107 28,053 78,111 76,302 75,415 75,528 75,641 (a) Represents Total Cost of Services (expenses) less retained revenues applied to the agency’s services. Reconciliation to the ‘Total appropriations
provided to deliver services’ includes adjustments related to movements in cash balances and other accrual items such as resources received free of charge, receivables, payables and superannuation.
(b) As at 30 June each financial year.
Spending Changes
Recurrent spending changes, other than cashflow timing changes and non-discretionary accounting adjustments, impacting on the agency’s Income Statement since presentation of the 2018-19 Budget to Parliament on 10 May 2018, are outlined below:
2018-19 Estimated
Actual $’000
2019-20 Budget
Estimate $’000
2020-21 Forward Estimate
$’000
2021-22 Forward Estimate
$’000
2022-23 Forward Estimate
$’000
New Initiative VenuesWest Security Infrastructure Upgrades ................................................ - 260 - 51 - Ongoing Initiatives Optus Stadium Revised Financial Forecast (a) ................................................. 34,128 23,617 18,756 (1,459) (1,436) Perth Motorplex Management ......................................................................... 5,353 5,186 5,186 - - RAC Arena Revised Financial Forecast .......................................................... (1,503) (1,503) (1,503) (1,503) (1,503) Other 2019-20 Tariffs, Fees and Charges ................................................................. - 153 156 159 161 Update to Depreciation Expense (b) ................................................................. 14,165 13,525 13,597 13,597 13,597 Voluntary Targeted Separation Scheme ......................................................... (40) (41) (41) (42) (42) (a) After one year of operations at Optus Stadium, additional costs required to operate the Stadium and run events have been factored into 2018-19,
2019-20 and 2020-21. This additional expenditure is partly offset by additional revenue of $63 million over the same period. Revised costs for Optus Stadium for 2021-22 and 2022-23 will be considered in the 2020-21 Budget process when future events have been confirmed.
(b) Depreciation has been adjusted to better reflect the costs associated with Optus Stadium with the different classification of asset types and depreciation rates.
Western Australian Sports Centre Trust - continued
495
Significant Issues Impacting the Agency
1. Concerted and collaborative efforts to attract world-class sport and entertainment events to Perth are paying off. Optus Stadium will host a calendar of sporting events never before seen in one year, with Manchester United playing twice, the Bledisloe Cup between the Wallabies and the All Blacks, and the Rugby League State of Origin - all happening in the midst of the 2019 AFL season before the focus turns to the ICC Men’s T20 World Cup.
2. The performance of RAC Arena, HBF Park and HBF Stadium is expected to be sustained with success in terms of attracting music acts and sporting events to Perth. Across the entire portfolio of 13 venues, VenuesWest expects to service approximately six million patrons, many of which are high-performance Western Australian athletes pursuing a place in the Australian team heading for the Olympics in Japan in 2020.
3. As the owner and manager of venues, security remains a key aspect of delivering great venue experiences in an ever-changing environment. In addition to continually working with the Western Australia Police Force and other essential service providers, VenuesWest will commence a program of infrastructure upgrades across its higher profile venues to mitigate the risk of hostile vehicles. The organisational capacity and capability to prepare, react and recover from any security incident has never been more important.
4. The interim management of the Perth Motorplex venue will continue whilst the long-term future of the asset is determined. The venue’s improved operating performance supports the sale or lease to a private sector operator and the management of a transition of business in some form is expected over the next year.
5. As asset managers, VenuesWest manages a large portfolio of State assets at various stages in their lifecycle. Being able to understand the condition of those assets over time is critical to managing the tension between the need to generate commercial revenues, meet world-class standards and plan for asset maintenance and renewal. A comprehensive program to undertake whole of asset condition assessments will be embarked upon in 2019-20. This will assist in understanding and making informed decisions regarding the allocation of resources to ensure safety, restore assets and sustain their ongoing performance in alignment with the State’s expectations.
6. The need to enhance the patron experience through the use of technology is increasing and the challenge for sport and entertainment venues to meet customer expectations for on-demand technology consumption is essential in order to enhance the live experience in an environment where event and sport viewing is increasingly happening at home through mainstream and alternative media channels.
7. Consumer concerns relating to the ticket resale market have grown significantly with the advances in technology and the sophistication of the reselling marketplace. Scalpers are utilising sophisticated software to bypass computer security systems to purchase large numbers of tickets and the industry has necessarily absorbed the cost of greater monitoring efforts to minimise the detrimental impact on genuine fans who may miss out or pay inflated prices for events.
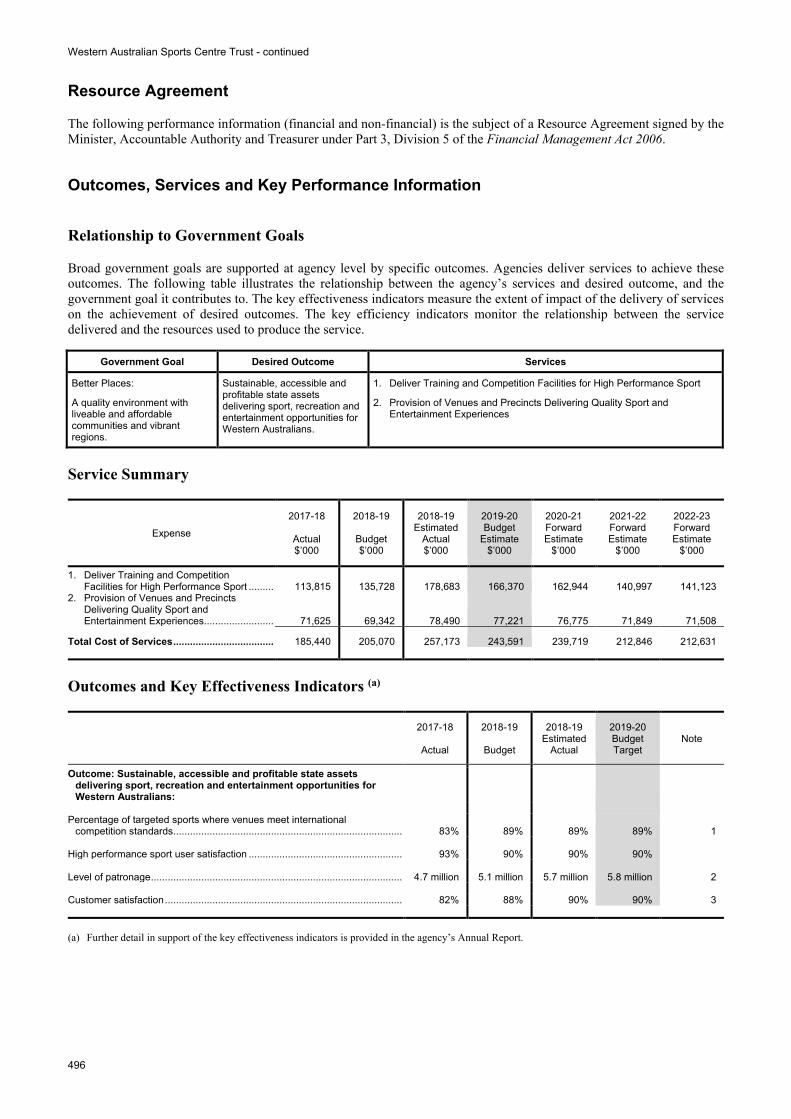
Western Australian Sports Centre Trust - continued
496
Resource Agreement
The following performance information (financial and non-financial) is the subject of a Resource Agreement signed by the Minister, Accountable Authority and Treasurer under Part 3, Division 5 of the Financial Management Act 2006.
Outcomes, Services and Key Performance Information
Relationship to Government Goals
Broad government goals are supported at agency level by specific outcomes. Agencies deliver services to achieve these outcomes. The following table illustrates the relationship between the agency’s services and desired outcome, and the government goal it contributes to. The key effectiveness indicators measure the extent of impact of the delivery of services on the achievement of desired outcomes. The key efficiency indicators monitor the relationship between the service delivered and the resources used to produce the service.
Government Goal Desired Outcome Services
Better Places:
A quality environment with liveable and affordable communities and vibrant regions.
Sustainable, accessible and profitable state assets delivering sport, recreation and entertainment opportunities for Western Australians.
1. Deliver Training and Competition Facilities for High Performance Sport
2. Provision of Venues and Precincts Delivering Quality Sport and Entertainment Experiences
Service Summary
Expense
2017-18
Actual $’000
2018-19
Budget $’000
2018-19 Estimated
Actual $’000
2019-20 Budget
Estimate $’000
2020-21 Forward Estimate
$’000
2021-22 Forward Estimate
$’000
2022-23 Forward Estimate
$’000
1. Deliver Training and Competition Facilities for High Performance Sport ......... 113,815 135,728 178,683 166,370 162,944 140,997 141,123
2. Provision of Venues and Precincts Delivering Quality Sport and Entertainment Experiences ......................... 71,625 69,342 78,490 77,221 76,775 71,849 71,508
Total Cost of Services .................................... 185,440 205,070 257,173 243,591 239,719 212,846 212,631
Outcomes and Key Effectiveness Indicators (a)
2017-18
Actual
2018-19
Budget
2018-19 Estimated
Actual
2019-20 Budget Target
Note
Outcome: Sustainable, accessible and profitable state assets delivering sport, recreation and entertainment opportunities for Western Australians:
Percentage of targeted sports where venues meet international
competition standards ................................................................................... 83% 89% 89% 89% 1 High performance sport user satisfaction ........................................................ 93% 90% 90% 90% Level of patronage ........................................................................................... 4.7 million 5.1 million 5.7 million 5.8 million 2 Customer satisfaction ...................................................................................... 82% 88% 90% 90% 3 (a) Further detail in support of the key effectiveness indicators is provided in the agency’s Annual Report.
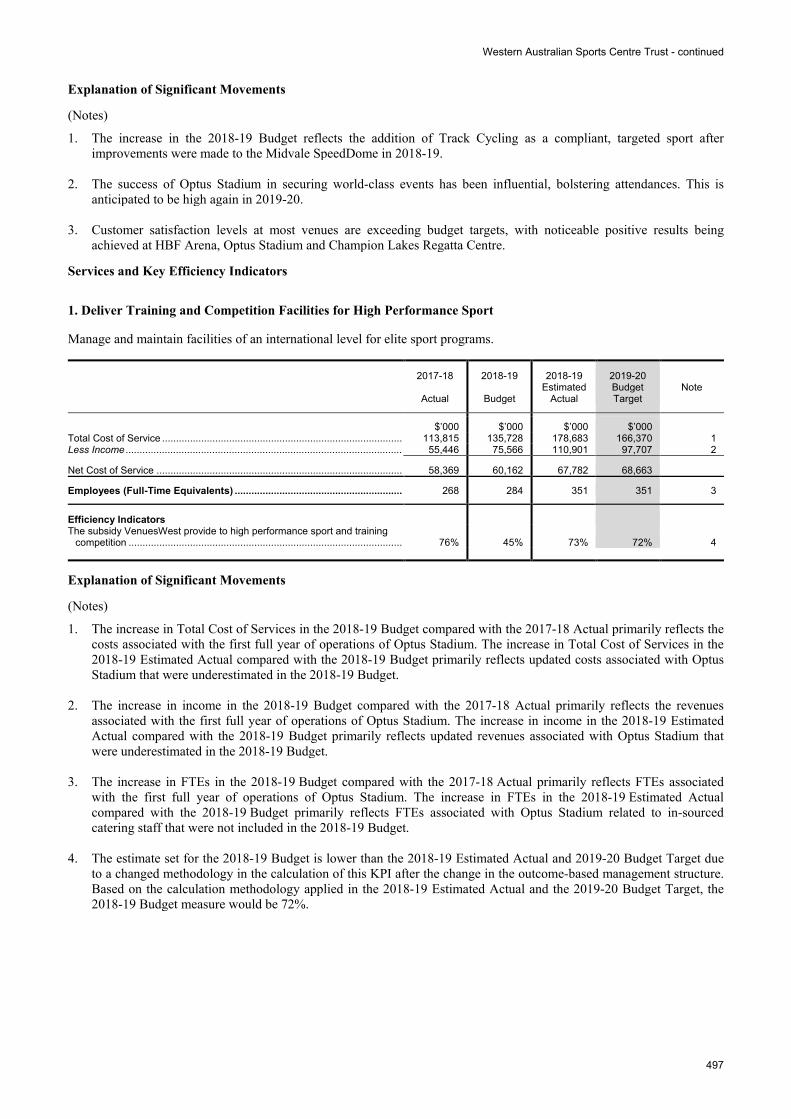
Western Australian Sports Centre Trust - continued
497
Explanation of Significant Movements
(Notes) 1. The increase in the 2018-19 Budget reflects the addition of Track Cycling as a compliant, targeted sport after
improvements were made to the Midvale SpeedDome in 2018-19. 2. The success of Optus Stadium in securing world-class events has been influential, bolstering attendances. This is
anticipated to be high again in 2019-20. 3. Customer satisfaction levels at most venues are exceeding budget targets, with noticeable positive results being
achieved at HBF Arena, Optus Stadium and Champion Lakes Regatta Centre.
Services and Key Efficiency Indicators
1. Deliver Training and Competition Facilities for High Performance Sport
Manage and maintain facilities of an international level for elite sport programs.
2017-18
Actual
2018-19
Budget
2018-19 Estimated
Actual
2019-20 Budget Target
Note
$’000 $’000 $’000 $’000 Total Cost of Service ...................................................................................... 113,815 135,728 178,683 166,370 1 Less Income ................................................................................................... 55,446 75,566 110,901 97,707 2
Net Cost of Service ........................................................................................ 58,369 60,162 67,782 68,663
Employees (Full-Time Equivalents) ............................................................ 268 284 351 351 3
Efficiency Indicators The subsidy VenuesWest provide to high performance sport and training
competition .................................................................................................. 76% 45% 73% 72% 4
Explanation of Significant Movements
(Notes) 1. The increase in Total Cost of Services in the 2018-19 Budget compared with the 2017-18 Actual primarily reflects the
costs associated with the first full year of operations of Optus Stadium. The increase in Total Cost of Services in the 2018-19 Estimated Actual compared with the 2018-19 Budget primarily reflects updated costs associated with Optus Stadium that were underestimated in the 2018-19 Budget.
2. The increase in income in the 2018-19 Budget compared with the 2017-18 Actual primarily reflects the revenues
associated with the first full year of operations of Optus Stadium. The increase in income in the 2018-19 Estimated Actual compared with the 2018-19 Budget primarily reflects updated revenues associated with Optus Stadium that were underestimated in the 2018-19 Budget.
3. The increase in FTEs in the 2018-19 Budget compared with the 2017-18 Actual primarily reflects FTEs associated
with the first full year of operations of Optus Stadium. The increase in FTEs in the 2018-19 Estimated Actual compared with the 2018-19 Budget primarily reflects FTEs associated with Optus Stadium related to in-sourced catering staff that were not included in the 2018-19 Budget.
4. The estimate set for the 2018-19 Budget is lower than the 2018-19 Estimated Actual and 2019-20 Budget Target due
to a changed methodology in the calculation of this KPI after the change in the outcome-based management structure. Based on the calculation methodology applied in the 2018-19 Estimated Actual and the 2019-20 Budget Target, the 2018-19 Budget measure would be 72%.
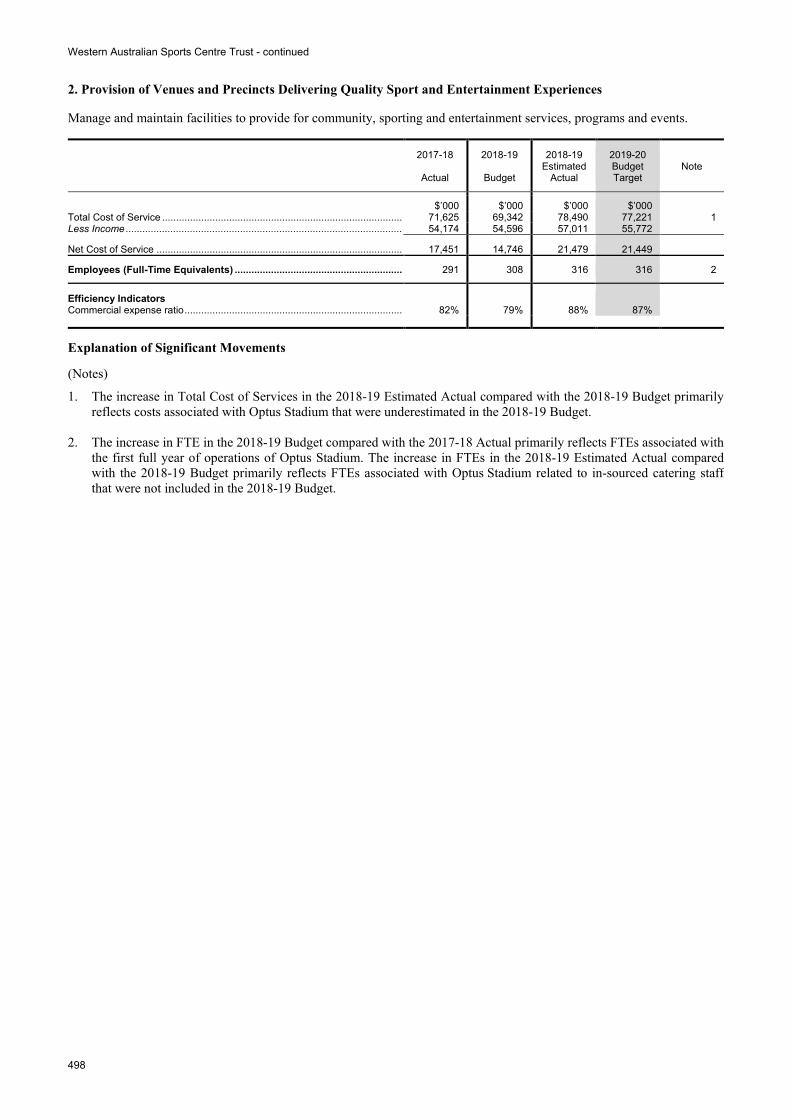
Western Australian Sports Centre Trust - continued
498
2. Provision of Venues and Precincts Delivering Quality Sport and Entertainment Experiences
Manage and maintain facilities to provide for community, sporting and entertainment services, programs and events.
2017-18
Actual
2018-19
Budget
2018-19 Estimated
Actual
2019-20 Budget Target
Note
$’000 $’000 $’000 $’000 Total Cost of Service ...................................................................................... 71,625 69,342 78,490 77,221 1 Less Income ................................................................................................... 54,174 54,596 57,011 55,772
Net Cost of Service ........................................................................................ 17,451 14,746 21,479 21,449
Employees (Full-Time Equivalents) ............................................................ 291 308 316 316 2
Efficiency Indicators Commercial expense ratio .............................................................................. 82% 79% 88% 87%
Explanation of Significant Movements
(Notes) 1. The increase in Total Cost of Services in the 2018-19 Estimated Actual compared with the 2018-19 Budget primarily
reflects costs associated with Optus Stadium that were underestimated in the 2018-19 Budget. 2. The increase in FTE in the 2018-19 Budget compared with the 2017-18 Actual primarily reflects FTEs associated with
the first full year of operations of Optus Stadium. The increase in FTEs in the 2018-19 Estimated Actual compared with the 2018-19 Budget primarily reflects FTEs associated with Optus Stadium related to in-sourced catering staff that were not included in the 2018-19 Budget.
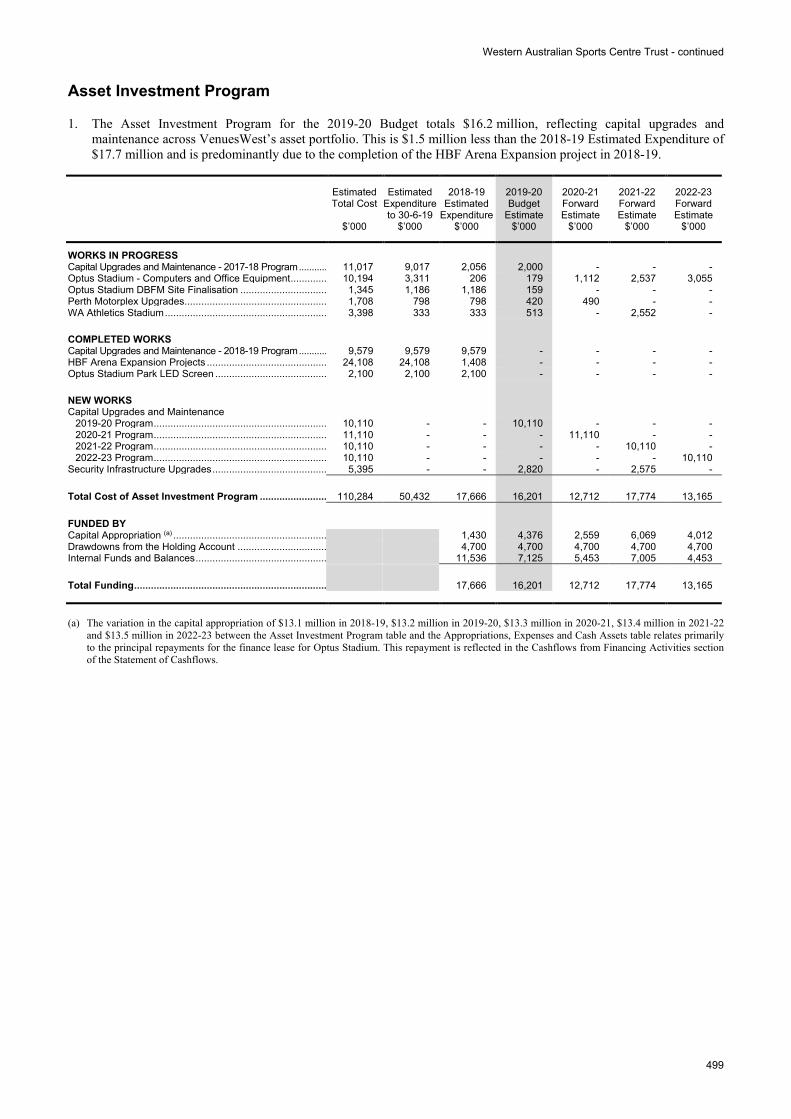
Western Australian Sports Centre Trust - continued
499
Asset Investment Program
1. The Asset Investment Program for the 2019-20 Budget totals $16.2 million, reflecting capital upgrades and maintenance across VenuesWest’s asset portfolio. This is $1.5 million less than the 2018-19 Estimated Expenditure of $17.7 million and is predominantly due to the completion of the HBF Arena Expansion project in 2018-19.
Estimated Total Cost
$’000
Estimated Expenditure to 30-6-19
$’000
2018-19 Estimated
Expenditure $’000
2019-20 Budget
Estimate $’000
2020-21 Forward Estimate
$’000
2021-22 Forward Estimate
$’000
2022-23 Forward Estimate
$’000
WORKS IN PROGRESS Capital Upgrades and Maintenance - 2017-18 Program ........... 11,017 9,017 2,056 2,000 - - - Optus Stadium - Computers and Office Equipment ............. 10,194 3,311 206 179 1,112 2,537 3,055 Optus Stadium DBFM Site Finalisation ............................... 1,345 1,186 1,186 159 - - - Perth Motorplex Upgrades ................................................... 1,708 798 798 420 490 - - WA Athletics Stadium .......................................................... 3,398 333 333 513 - 2,552 -
COMPLETED WORKS Capital Upgrades and Maintenance - 2018-19 Program ........... 9,579 9,579 9,579 - - - - HBF Arena Expansion Projects ........................................... 24,108 24,108 1,408 - - - - Optus Stadium Park LED Screen ........................................ 2,100 2,100 2,100 - - - -
NEW WORKS Capital Upgrades and Maintenance
2019-20 Program .............................................................. 10,110 - - 10,110 - - - 2020-21 Program .............................................................. 11,110 - - - 11,110 - - 2021-22 Program .............................................................. 10,110 - - - - 10,110 - 2022-23 Program .............................................................. 10,110 - - - - - 10,110
Security Infrastructure Upgrades ......................................... 5,395 - - 2,820 - 2,575 -
Total Cost of Asset Investment Program ........................ 110,284 50,432 17,666 16,201 12,712 17,774 13,165
FUNDED BY Capital Appropriation (a) ....................................................... 1,430 4,376 2,559 6,069 4,012 Drawdowns from the Holding Account ................................ 4,700 4,700 4,700 4,700 4,700 Internal Funds and Balances ............................................... 11,536 7,125 5,453 7,005 4,453
Total Funding ..................................................................... 17,666 16,201 12,712 17,774 13,165 (a) The variation in the capital appropriation of $13.1 million in 2018-19, $13.2 million in 2019-20, $13.3 million in 2020-21, $13.4 million in 2021-22
and $13.5 million in 2022-23 between the Asset Investment Program table and the Appropriations, Expenses and Cash Assets table relates primarily to the principal repayments for the finance lease for Optus Stadium. This repayment is reflected in the Cashflows from Financing Activities section of the Statement of Cashflows.
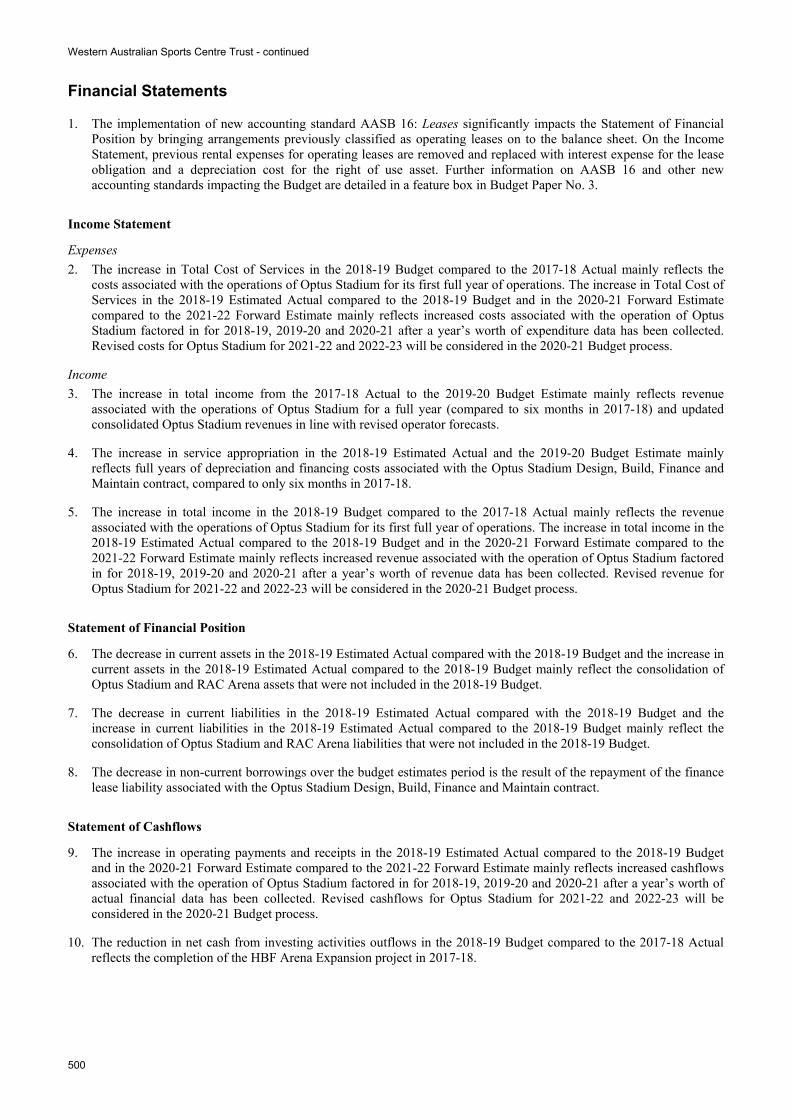
Western Australian Sports Centre Trust - continued
500
Financial Statements
1. The implementation of new accounting standard AASB 16: Leases significantly impacts the Statement of Financial Position by bringing arrangements previously classified as operating leases on to the balance sheet. On the Income Statement, previous rental expenses for operating leases are removed and replaced with interest expense for the lease obligation and a depreciation cost for the right of use asset. Further information on AASB 16 and other new accounting standards impacting the Budget are detailed in a feature box in Budget Paper No. 3.
Income Statement
Expenses 2. The increase in Total Cost of Services in the 2018-19 Budget compared to the 2017-18 Actual mainly reflects the
costs associated with the operations of Optus Stadium for its first full year of operations. The increase in Total Cost of Services in the 2018-19 Estimated Actual compared to the 2018-19 Budget and in the 2020-21 Forward Estimate compared to the 2021-22 Forward Estimate mainly reflects increased costs associated with the operation of Optus Stadium factored in for 2018-19, 2019-20 and 2020-21 after a year’s worth of expenditure data has been collected. Revised costs for Optus Stadium for 2021-22 and 2022-23 will be considered in the 2020-21 Budget process.
Income 3. The increase in total income from the 2017-18 Actual to the 2019-20 Budget Estimate mainly reflects revenue
associated with the operations of Optus Stadium for a full year (compared to six months in 2017-18) and updated consolidated Optus Stadium revenues in line with revised operator forecasts.
4. The increase in service appropriation in the 2018-19 Estimated Actual and the 2019-20 Budget Estimate mainly reflects full years of depreciation and financing costs associated with the Optus Stadium Design, Build, Finance and Maintain contract, compared to only six months in 2017-18.
5. The increase in total income in the 2018-19 Budget compared to the 2017-18 Actual mainly reflects the revenue associated with the operations of Optus Stadium for its first full year of operations. The increase in total income in the 2018-19 Estimated Actual compared to the 2018-19 Budget and in the 2020-21 Forward Estimate compared to the 2021-22 Forward Estimate mainly reflects increased revenue associated with the operation of Optus Stadium factored in for 2018-19, 2019-20 and 2020-21 after a year’s worth of revenue data has been collected. Revised revenue for Optus Stadium for 2021-22 and 2022-23 will be considered in the 2020-21 Budget process.
Statement of Financial Position
6. The decrease in current assets in the 2018-19 Estimated Actual compared with the 2018-19 Budget and the increase in current assets in the 2018-19 Estimated Actual compared to the 2018-19 Budget mainly reflect the consolidation of Optus Stadium and RAC Arena assets that were not included in the 2018-19 Budget.
7. The decrease in current liabilities in the 2018-19 Estimated Actual compared with the 2018-19 Budget and the increase in current liabilities in the 2018-19 Estimated Actual compared to the 2018-19 Budget mainly reflect the consolidation of Optus Stadium and RAC Arena liabilities that were not included in the 2018-19 Budget.
8. The decrease in non-current borrowings over the budget estimates period is the result of the repayment of the finance lease liability associated with the Optus Stadium Design, Build, Finance and Maintain contract.
Statement of Cashflows
9. The increase in operating payments and receipts in the 2018-19 Estimated Actual compared to the 2018-19 Budget and in the 2020-21 Forward Estimate compared to the 2021-22 Forward Estimate mainly reflects increased cashflows associated with the operation of Optus Stadium factored in for 2018-19, 2019-20 and 2020-21 after a year’s worth of actual financial data has been collected. Revised cashflows for Optus Stadium for 2021-22 and 2022-23 will be considered in the 2020-21 Budget process.
10. The reduction in net cash from investing activities outflows in the 2018-19 Budget compared to the 2017-18 Actual reflects the completion of the HBF Arena Expansion project in 2017-18.
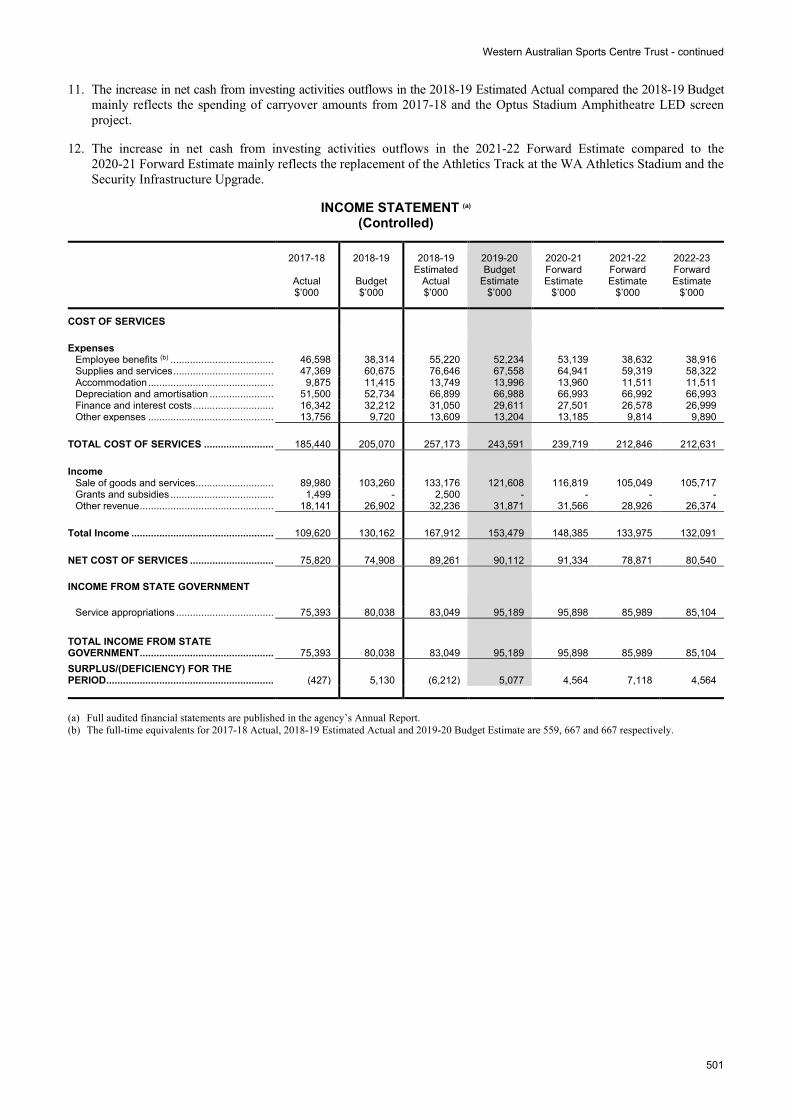
Western Australian Sports Centre Trust - continued
501
11. The increase in net cash from investing activities outflows in the 2018-19 Estimated Actual compared the 2018-19 Budget mainly reflects the spending of carryover amounts from 2017-18 and the Optus Stadium Amphitheatre LED screen project.
12. The increase in net cash from investing activities outflows in the 2021-22 Forward Estimate compared to the 2020-21 Forward Estimate mainly reflects the replacement of the Athletics Track at the WA Athletics Stadium and the Security Infrastructure Upgrade.
INCOME STATEMENT (a)
(Controlled)
2017-18
Actual $’000
2018-19
Budget $’000
2018-19 Estimated
Actual $’000
2019-20 Budget
Estimate $’000
2020-21 Forward Estimate
$’000
2021-22 Forward Estimate
$’000
2022-23 Forward Estimate
$’000
COST OF SERVICES
Expenses Employee benefits (b) ..................................... 46,598 38,314 55,220 52,234 53,139 38,632 38,916 Supplies and services .................................... 47,369 60,675 76,646 67,558 64,941 59,319 58,322 Accommodation ............................................. 9,875 11,415 13,749 13,996 13,960 11,511 11,511 Depreciation and amortisation ....................... 51,500 52,734 66,899 66,988 66,993 66,992 66,993 Finance and interest costs ............................. 16,342 32,212 31,050 29,611 27,501 26,578 26,999 Other expenses ............................................. 13,756 9,720 13,609 13,204 13,185 9,814 9,890
TOTAL COST OF SERVICES ......................... 185,440 205,070 257,173 243,591 239,719 212,846 212,631
Income Sale of goods and services ............................ 89,980 103,260 133,176 121,608 116,819 105,049 105,717 Grants and subsidies ..................................... 1,499 - 2,500 - - - - Other revenue ................................................ 18,141 26,902 32,236 31,871 31,566 28,926 26,374
Total Income ................................................... 109,620 130,162 167,912 153,479 148,385 133,975 132,091
NET COST OF SERVICES .............................. 75,820 74,908 89,261 90,112 91,334 78,871 80,540
INCOME FROM STATE GOVERNMENT
Service appropriations ................................... 75,393 80,038 83,049 95,189 95,898 85,989 85,104
TOTAL INCOME FROM STATE GOVERNMENT ................................................ 75,393 80,038 83,049 95,189 95,898 85,989 85,104 SURPLUS/(DEFICIENCY) FOR THE PERIOD ............................................................ (427) 5,130 (6,212) 5,077 4,564 7,118 4,564 (a) Full audited financial statements are published in the agency’s Annual Report. (b) The full-time equivalents for 2017-18 Actual, 2018-19 Estimated Actual and 2019-20 Budget Estimate are 559, 667 and 667 respectively.
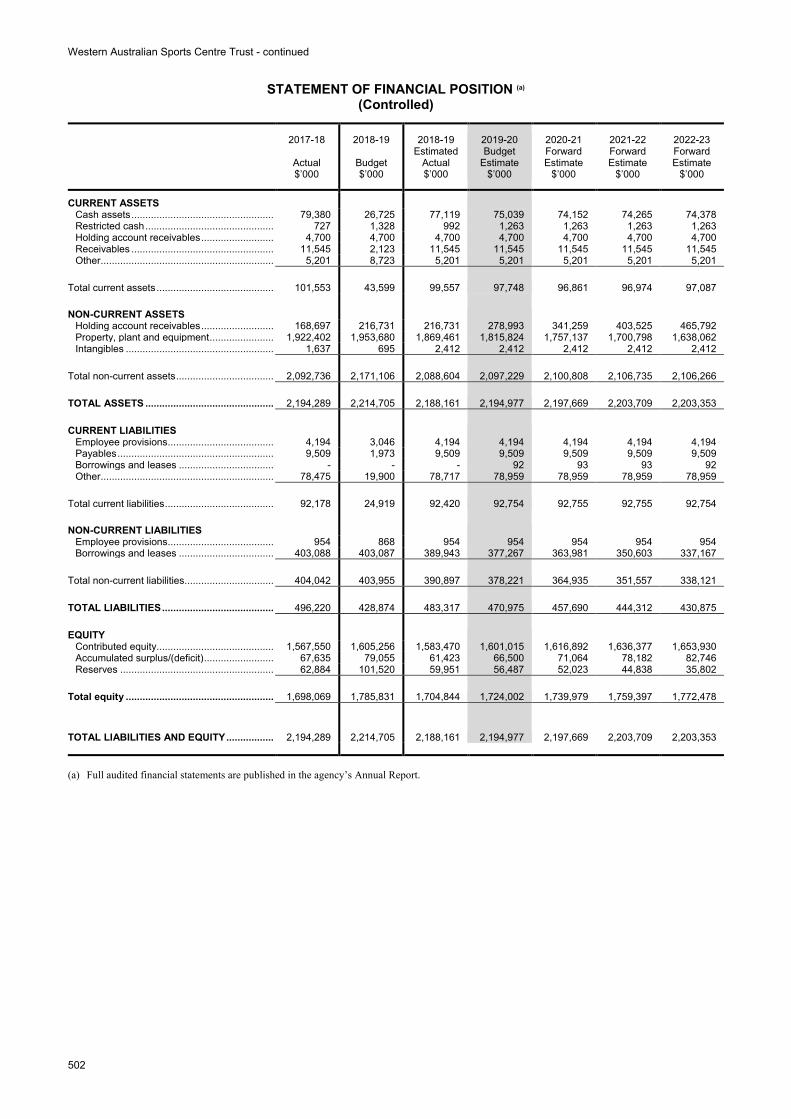
Western Australian Sports Centre Trust - continued
502
STATEMENT OF FINANCIAL POSITION (a)
(Controlled)
2017-18
Actual $’000
2018-19
Budget $’000
2018-19 Estimated
Actual $’000
2019-20 Budget
Estimate $’000
2020-21 Forward Estimate
$’000
2021-22 Forward Estimate
$’000
2022-23 Forward Estimate
$’000
CURRENT ASSETS Cash assets ................................................... 79,380 26,725 77,119 75,039 74,152 74,265 74,378 Restricted cash .............................................. 727 1,328 992 1,263 1,263 1,263 1,263 Holding account receivables .......................... 4,700 4,700 4,700 4,700 4,700 4,700 4,700 Receivables ................................................... 11,545 2,123 11,545 11,545 11,545 11,545 11,545 Other .............................................................. 5,201 8,723 5,201 5,201 5,201 5,201 5,201
Total current assets .......................................... 101,553 43,599 99,557 97,748 96,861 96,974 97,087
NON-CURRENT ASSETS Holding account receivables .......................... 168,697 216,731 216,731 278,993 341,259 403,525 465,792 Property, plant and equipment ....................... 1,922,402 1,953,680 1,869,461 1,815,824 1,757,137 1,700,798 1,638,062 Intangibles ..................................................... 1,637 695 2,412 2,412 2,412 2,412 2,412
Total non-current assets ................................... 2,092,736 2,171,106 2,088,604 2,097,229 2,100,808 2,106,735 2,106,266
TOTAL ASSETS .............................................. 2,194,289 2,214,705 2,188,161 2,194,977 2,197,669 2,203,709 2,203,353
CURRENT LIABILITIES Employee provisions ...................................... 4,194 3,046 4,194 4,194 4,194 4,194 4,194 Payables ........................................................ 9,509 1,973 9,509 9,509 9,509 9,509 9,509 Borrowings and leases .................................. - - - 92 93 93 92 Other .............................................................. 78,475 19,900 78,717 78,959 78,959 78,959 78,959
Total current liabilities ....................................... 92,178 24,919 92,420 92,754 92,755 92,755 92,754
NON-CURRENT LIABILITIES Employee provisions ...................................... 954 868 954 954 954 954 954 Borrowings and leases .................................. 403,088 403,087 389,943 377,267 363,981 350,603 337,167
Total non-current liabilities ................................ 404,042 403,955 390,897 378,221 364,935 351,557 338,121
TOTAL LIABILITIES ........................................ 496,220 428,874 483,317 470,975 457,690 444,312 430,875
EQUITY Contributed equity .......................................... 1,567,550 1,605,256 1,583,470 1,601,015 1,616,892 1,636,377 1,653,930 Accumulated surplus/(deficit) ......................... 67,635 79,055 61,423 66,500 71,064 78,182 82,746 Reserves ....................................................... 62,884 101,520 59,951 56,487 52,023 44,838 35,802
Total equity ..................................................... 1,698,069 1,785,831 1,704,844 1,724,002 1,739,979 1,759,397 1,772,478
TOTAL LIABILITIES AND EQUITY ................. 2,194,289 2,214,705 2,188,161 2,194,977 2,197,669 2,203,709 2,203,353 (a) Full audited financial statements are published in the agency’s Annual Report.
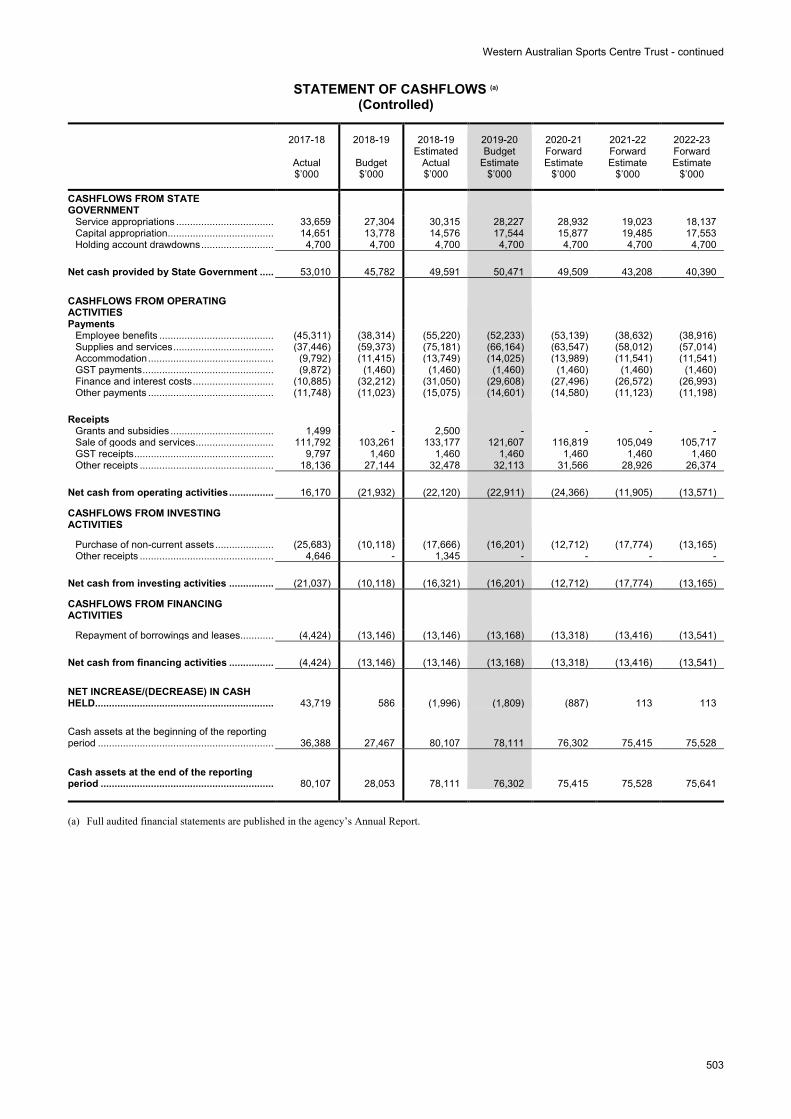
Western Australian Sports Centre Trust - continued
503
STATEMENT OF CASHFLOWS (a)
(Controlled)
2017-18
Actual $’000
2018-19
Budget $’000
2018-19 Estimated
Actual $’000
2019-20 Budget
Estimate $’000
2020-21 Forward Estimate
$’000
2021-22 Forward Estimate
$’000
2022-23 Forward Estimate
$’000
CASHFLOWS FROM STATE GOVERNMENT
Service appropriations ................................... 33,659 27,304 30,315 28,227 28,932 19,023 18,137 Capital appropriation ...................................... 14,651 13,778 14,576 17,544 15,877 19,485 17,553 Holding account drawdowns .......................... 4,700 4,700 4,700 4,700 4,700 4,700 4,700
Net cash provided by State Government ..... 53,010 45,782 49,591 50,471 49,509 43,208 40,390
CASHFLOWS FROM OPERATING ACTIVITIES Payments
Employee benefits ......................................... (45,311) (38,314) (55,220) (52,233) (53,139) (38,632) (38,916) Supplies and services .................................... (37,446) (59,373) (75,181) (66,164) (63,547) (58,012) (57,014) Accommodation ............................................. (9,792) (11,415) (13,749) (14,025) (13,989) (11,541) (11,541) GST payments ............................................... (9,872) (1,460) (1,460) (1,460) (1,460) (1,460) (1,460) Finance and interest costs ............................. (10,885) (32,212) (31,050) (29,608) (27,496) (26,572) (26,993) Other payments ............................................. (11,748) (11,023) (15,075) (14,601) (14,580) (11,123) (11,198)
Receipts Grants and subsidies ..................................... 1,499 - 2,500 - - - - Sale of goods and services ............................ 111,792 103,261 133,177 121,607 116,819 105,049 105,717 GST receipts .................................................. 9,797 1,460 1,460 1,460 1,460 1,460 1,460 Other receipts ................................................ 18,136 27,144 32,478 32,113 31,566 28,926 26,374
Net cash from operating activities ................ 16,170 (21,932) (22,120) (22,911) (24,366) (11,905) (13,571)
CASHFLOWS FROM INVESTING ACTIVITIES
Purchase of non-current assets ..................... (25,683) (10,118) (17,666) (16,201) (12,712) (17,774) (13,165) Other receipts ................................................ 4,646 - 1,345 - - - -
Net cash from investing activities ................ (21,037) (10,118) (16,321) (16,201) (12,712) (17,774) (13,165)
CASHFLOWS FROM FINANCING ACTIVITIES
Repayment of borrowings and leases ............ (4,424) (13,146) (13,146) (13,168) (13,318) (13,416) (13,541)
Net cash from financing activities ................ (4,424) (13,146) (13,146) (13,168) (13,318) (13,416) (13,541)
NET INCREASE/(DECREASE) IN CASH HELD................................................................ 43,719 586 (1,996) (1,809) (887) 113 113
Cash assets at the beginning of the reporting period ............................................................... 36,388 27,467 80,107 78,111 76,302 75,415 75,528
Cash assets at the end of the reporting period .............................................................. 80,107 28,053 78,111 76,302 75,415 75,528 75,641 (a) Full audited financial statements are published in the agency’s Annual Report.
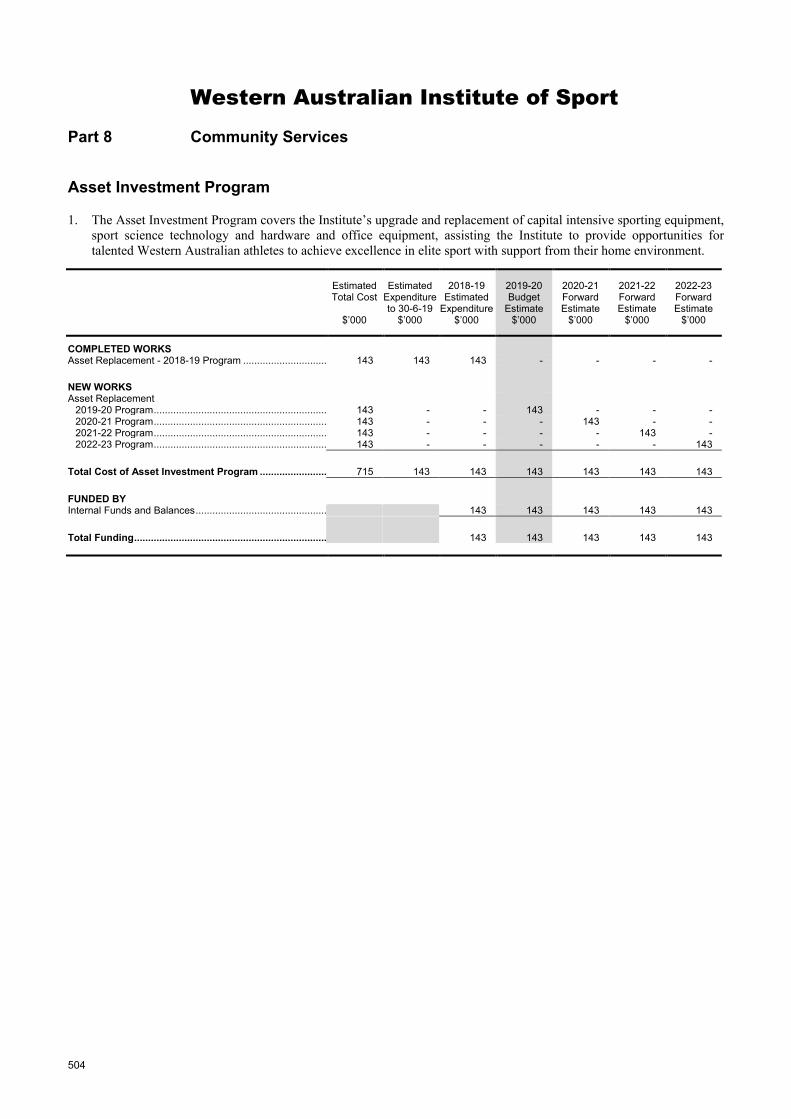
504
Western Australian Institute of Sport
Part 8 Community Services
Asset Investment Program
1. The Asset Investment Program covers the Institute’s upgrade and replacement of capital intensive sporting equipment, sport science technology and hardware and office equipment, assisting the Institute to provide opportunities for talented Western Australian athletes to achieve excellence in elite sport with support from their home environment.
Estimated Total Cost
$’000
Estimated Expenditure to 30-6-19
$’000
2018-19 Estimated
Expenditure $’000
2019-20 Budget
Estimate $’000
2020-21 Forward Estimate
$’000
2021-22 Forward Estimate
$’000
2022-23 Forward Estimate
$’000
COMPLETED WORKS Asset Replacement - 2018-19 Program .............................. 143 143 143 - - - -
NEW WORKS Asset Replacement
2019-20 Program .............................................................. 143 - - 143 - - - 2020-21 Program .............................................................. 143 - - - 143 - - 2021-22 Program .............................................................. 143 - - - - 143 - 2022-23 Program .............................................................. 143 - - - - - 143
Total Cost of Asset Investment Program ........................ 715 143 143 143 143 143 143
FUNDED BY Internal Funds and Balances ............................................... 143 143 143 143 143
Total Funding ..................................................................... 143 143 143 143 143
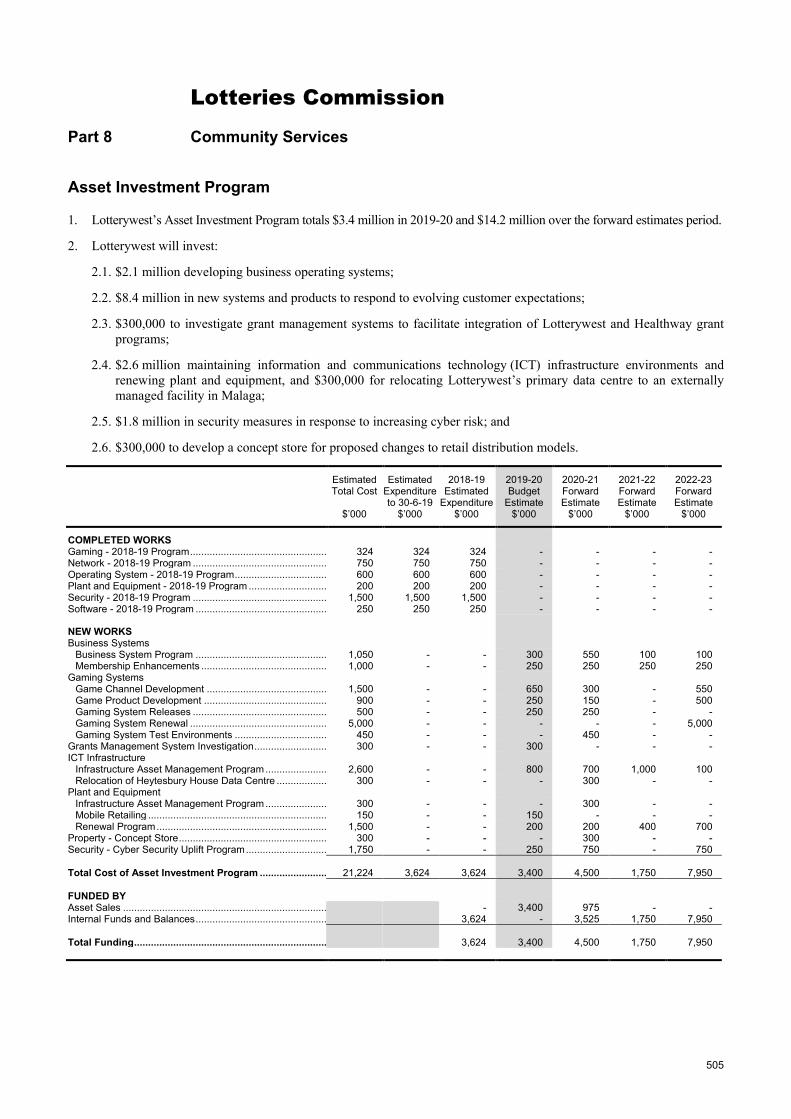
505
Lotteries Commission
Part 8 Community Services
Asset Investment Program
1. Lotterywest’s Asset Investment Program totals $3.4 million in 2019-20 and $14.2 million over the forward estimates period.
2. Lotterywest will invest:
2.1. $2.1 million developing business operating systems;
2.2. $8.4 million in new systems and products to respond to evolving customer expectations;
2.3. $300,000 to investigate grant management systems to facilitate integration of Lotterywest and Healthway grant programs;
2.4. $2.6 million maintaining information and communications technology (ICT) infrastructure environments and renewing plant and equipment, and $300,000 for relocating Lotterywest’s primary data centre to an externally managed facility in Malaga;
2.5. $1.8 million in security measures in response to increasing cyber risk; and
2.6. $300,000 to develop a concept store for proposed changes to retail distribution models.
Estimated Total Cost
$’000
Estimated Expenditure to 30-6-19
$’000
2018-19 Estimated
Expenditure $’000
2019-20 Budget
Estimate $’000
2020-21 Forward Estimate
$’000
2021-22 Forward Estimate
$’000
2022-23 Forward Estimate
$’000
COMPLETED WORKS Gaming - 2018-19 Program ................................................. 324 324 324 - - - - Network - 2018-19 Program ................................................ 750 750 750 - - - - Operating System - 2018-19 Program ................................. 600 600 600 - - - - Plant and Equipment - 2018-19 Program ............................ 200 200 200 - - - - Security - 2018-19 Program ................................................ 1,500 1,500 1,500 - - - - Software - 2018-19 Program ............................................... 250 250 250 - - - -
NEW WORKS Business Systems
Business System Program ............................................... 1,050 - - 300 550 100 100 Membership Enhancements ............................................. 1,000 - - 250 250 250 250
Gaming Systems Game Channel Development ........................................... 1,500 - - 650 300 - 550 Game Product Development ............................................ 900 - - 250 150 - 500 Gaming System Releases ................................................ 500 - - 250 250 - - Gaming System Renewal ................................................. 5,000 - - - - - 5,000 Gaming System Test Environments ................................. 450 - - - 450 - -
Grants Management System Investigation .......................... 300 - - 300 - - - ICT Infrastructure
Infrastructure Asset Management Program ...................... 2,600 - - 800 700 1,000 100 Relocation of Heytesbury House Data Centre .................. 300 - - - 300 - -
Plant and Equipment Infrastructure Asset Management Program ...................... 300 - - - 300 - - Mobile Retailing ................................................................ 150 - - 150 - - - Renewal Program ............................................................. 1,500 - - 200 200 400 700
Property - Concept Store ..................................................... 300 - - - 300 - - Security - Cyber Security Uplift Program ............................. 1,750 - - 250 750 - 750
Total Cost of Asset Investment Program ........................ 21,224 3,624 3,624 3,400 4,500 1,750 7,950
FUNDED BY Asset Sales ......................................................................... - 3,400 975 - - Internal Funds and Balances ............................................... 3,624 - 3,525 1,750 7,950
Total Funding ..................................................................... 3,624 3,400 4,500 1,750 7,950
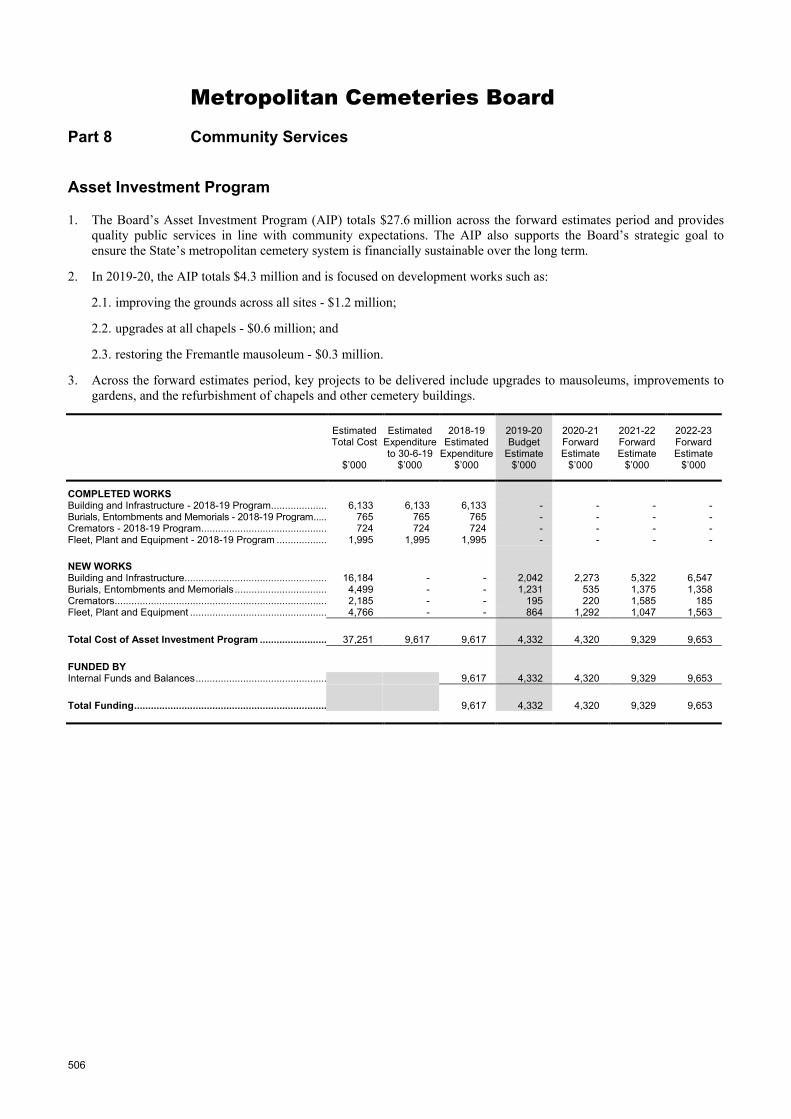
506
Metropolitan Cemeteries Board
Part 8 Community Services
Asset Investment Program
1. The Board’s Asset Investment Program (AIP) totals $27.6 million across the forward estimates period and provides quality public services in line with community expectations. The AIP also supports the Board’s strategic goal to ensure the State’s metropolitan cemetery system is financially sustainable over the long term.
2. In 2019-20, the AIP totals $4.3 million and is focused on development works such as:
2.1. improving the grounds across all sites - $1.2 million;
2.2. upgrades at all chapels - $0.6 million; and
2.3. restoring the Fremantle mausoleum - $0.3 million.
3. Across the forward estimates period, key projects to be delivered include upgrades to mausoleums, improvements to gardens, and the refurbishment of chapels and other cemetery buildings.
Estimated Total Cost
$’000
Estimated Expenditure to 30-6-19
$’000
2018-19 Estimated
Expenditure $’000
2019-20 Budget
Estimate $’000
2020-21 Forward Estimate
$’000
2021-22 Forward Estimate
$’000
2022-23 Forward Estimate
$’000
COMPLETED WORKS Building and Infrastructure - 2018-19 Program .................... 6,133 6,133 6,133 - - - - Burials, Entombments and Memorials - 2018-19 Program ..... 765 765 765 - - - - Cremators - 2018-19 Program ............................................. 724 724 724 - - - - Fleet, Plant and Equipment - 2018-19 Program .................. 1,995 1,995 1,995 - - - -
NEW WORKS Building and Infrastructure ................................................... 16,184 - - 2,042 2,273 5,322 6,547 Burials, Entombments and Memorials ................................. 4,499 - - 1,231 535 1,375 1,358 Cremators ............................................................................ 2,185 - - 195 220 1,585 185 Fleet, Plant and Equipment ................................................. 4,766 - - 864 1,292 1,047 1,563
Total Cost of Asset Investment Program ........................ 37,251 9,617 9,617 4,332 4,320 9,329 9,653
FUNDED BY Internal Funds and Balances ............................................... 9,617 4,332 4,320 9,329 9,653
Total Funding ..................................................................... 9,617 4,332 4,320 9,329 9,653