Embed Size (px)
Citation preview
RESEARCH PAPER
Particle concentration via acoustically drivenmicrocentrifugation: microPIV flow visualizationand numerical modelling studies
Rohan V. Raghavan Æ James R. Friend ÆLeslie Y. Yeo
Received: 11 February 2009 / Accepted: 16 April 2009 / Published online: 5 May 2009
� Springer-Verlag 2009
Abstract Through confocal-like microparticle image ve-
locimetry experiments, we reconstruct, for the first time, the
three-dimensional flow field structure of the azimuthal fluid
recirculation in a sessile drop induced by asymmetric surface
acoustic wave radiation, which, in previous two-dimensional
planar studies, has been shown to be a powerful mechanism
for driving inertial microcentrifugation for micromixing and
particle concentration. Supported through finite element
simulations, these insights into the three-dimensional flow
field provide valuable information on the mechanisms by
which particles suspended in the flow collect in a stack at a
central position on the substrate at the bottom of the drop
once they are convected by the fluid to the bottom region via
a helical spiral-like trajectory around the drop periphery.
Once close to the substrate, the inward radial velocity then
forces the particles into this central stagnation point where
they are trapped by sedimentary forces, provided the con-
vective force is insufficient to redisperse them along with the
fluid up a central column and into the bulk of the drop.
Keywords Surface acoustic waves �Particle concentration � Microfluidics �Microcentrifugation � Microparticle image velocimetry
1 Introduction
In the same way that unit operations constitute individual
components in a macroscopic chemical processing plant,
the lab-on-a-chip or microfluidic processor also comprises
miniature versions of these units—micropumps, microre-
actors, microvalves, micromixers, and microseparators.
Whilst considerable progress has been achieved through
the past decade, challenges remain on two fronts: the
miniaturization of the individual microfluidic components
and their integration into practical biological and chemical
analytical systems for applications in molecular analysis,
biodefence and point-of-care diagnostics (Whitesides
2006).
Amongst these various microfluidic unit operations,
microcentrifugation remains most primitive (Ducree 2008).
Just like their macroscopic counterparts, microcentrifuges
provide a powerful means for driving intense mixing or
particle separation. The procedure is vital but yet time-
consuming; for example, extraction of blood cells and other
cellular components from blood plasma takes up to one-
quarter of the entire processing time in clinical diagnostics
to provide information to provide prognosis for disease. It
is well known that simple tests on blood plasma can be
used to evaluate the blood chemistry and the health of
various organs in an individual (Blattert et al. 2004).
Facilitating the extraction of blood cells, bacteria or other
particulate matter from a sample at the scales required for
lab-on-a-chip devices has proven to be difficult in the past.
Conventional centrifugation and filtration techniques with
microfilters (Sengupta and Chang 2008) and membranes
are complex, cumbersome and complicated (Yuen et al.
2001; Brody et al. 1996; Wilding et al. 1994), requiring
pumps to force the fluid through the filters. Besides the
large size of the pumps, the act of forcing the fluid through
small membrane pores is detrimental to the viability of
biological cells, causing them to deform and denature
during the process. Other techniques involving evapora-
tion-based concentration (Walker and Beebe 2002) and
R. V. Raghavan � J. R. Friend � L. Y. Yeo (&)
Micro/Nanophysics Research Laboratory,
Department of Mechanical Engineering, Monash University,
133/31 Engineering, Clayton, VIC 3800, Australia
e-mail: [email protected]
123
Microfluid Nanofluid (2010) 8:73–84
DOI 10.1007/s10404-009-0452-3
acoustic radiation pressure (Meng et al. 1999) have also
been demonstrated as viable microfluidic concentration
techniques. However, they again require complex setups
which makes integrating them into a multi-purpose plat-
forms a greater challenge.
A simpler approach has been the ‘lab-on-a-CD’ concept,
wherein microfluidic components fabricated onto a com-
pact disk are spun by exploiting Coriolis forces (Madou
and Kellogg 1998). Rotation of the entire disk structure
provides a non-specific acceleration to the entire micro-
fluidic structure. This feature proves to be a cumbersome
limitation since all components—whether upstream or
downstream of the centrifuge area, including dispensing
and sensor components—must be designed to operate over
the entire range of accelerations. Whilst it may be possible
to isolate merely the reactor and separator to the rotated
disk, integration of the rotating component with stationary
fixtures via microfluidic connections is at best complex and
expensive.
More recently, Yeo et al. (2006a, b) and Arifin et al.
(2007) have pioneered a novel microcentrifuge by driving
an ionic wind, produced by applying a large gas phase
electric field above a circular liquid microchamber. The
bulk air flow then results in interfacial shearing of the
liquid surface which drives bulk helical-like recirculation
of the liquid in the microchamber. Over several minutes,
such motion resulted in the separation of red blood cells
from plasma. The use of large voltages—several kilo-
volts—and the fairly slow concentration speed are draw-
backs to this approach, though these issues are less of a
problem than other technologies used for the purpose in the
past.
Better yet, both the requirement for large voltages and
the problem of slow concentration were circumvented
through the use of leaky surface acoustic waves (SAWs) to
drive the microcentrifugation. As with other SAW-driven
microfluidic actuation (Yeo and Friend 2009), including
vibration-induced particle patterning and sorting (Li et al.
2008), drop translation (Wixforth 2003; Tan et al. 2007b),
jetting (Tan et al. 2009) and atomization (Friend et al.
2008; Qi et al. 2008; Alvarez et al. 2008a, b, 2009), the
microcentrifugation driven by SAW is extremely fast
(Li et al. 2007), especially with the use of elliptical
transducers to focus the SAWs (Tan et al. 2007a; Shilton
et al. 2008). The perceived difficulties of using lithium
niobate in SAW microfluidics is in some part countered by
using fluid coupling to microfluidic devices in other
materials (Hodgson et al. 2009).
When subjected to asymmetrical SAW radiation, 5 lm
particles seeded in a 30 ll drop are observed to concentrate
rapidly in the center of the drop, as shown in Fig. 1. Li
et al. (2007) attributed this phenomena to the competition
between shear induced migration—arising due to azi-
muthal velocity gradients within the drop which result in
the transport of the particles across azimuthal streamlines
into the interior of the vortex (see Fig. 1)—and acousti-
cally-driven inertial convection within the drop—acoustic
streaming—which acts to disperse the particles. Below a
critical threshold value in the applied power, approxi-
mately 300 mW, the shear diffusion process is dominant
therefore leading to the concentration of the particles in the
closed vortex. However, beyond this critical value, the
acoustic streaming-driven convection dominates, giving
rise to particle dispersion.
In Li et al. (2007) and Shilton et al. (2008), the particle
concentration dynamics were quantified using a relatively
simple two-dimensional horizontal plane pixel intensity
analysis of the temporal variation in gray-scale video
frames, omitting the particle dynamics in a direction per-
pendicular to the plane. Whilst this provides a quantitative
description of the dynamics sufficient to determine the
underlying physical mechanisms, it ignores the effect of the
three-dimensional flow field of the particle trajectory and
hence also the concentration process. Past studies, includ-
ing Yeo et al. (2006a, b) and Arifin et al. (2007), have been
less affected by the three-dimensional nature of the flow
t=0s t=3s t=8s
1mm
dropoutline
Fig. 1 Video images captured at 60 frames/s illustrating rapid particle concentration using asymmetric SAW radiation
74 Microfluid Nanofluid (2010) 8:73–84
123
field, yet even then these effects were found to be signifi-
cant. With SAW-driven acoustic streaming in fluid drops,
the flow field is certainly three-dimensional in nature and
only poorly understood when confined to a drop. Having a
fundamental understanding of the nature of the flow within
the drop would shed light on the other SAW-driven drop
microfluidic processes, including drop transport (Wixforth
et al. 1990; Tan et al. 2007b), jetting (Tan et al. 2009) and
atomization (Friend et al. 2008; Qi et al. 2008; Alvarez
et al. 2008a, b; 2009).
In this work, we employ experimental visualization
using microparticle image velocimetry (microPIV) (Pa-
pautsky et al. 2008) together with numerical simulations to
provide a qualitative and quantitative understanding of the
three-dimensional flow field and particle concentration
dynamics. In Sect. 2, we provide a brief introduction to the
SAW and how it drives microfluidic actuation as well as
the experimental techniques employed to characterize the
three-dimensional flow field within the drop. In Sect. 3, we
discuss the numerical simulation used to examine the flow
field induced by the SAW device. This is followed by the
experimental and numerical results and their interpretation
to construct a physical picture of the flow trajectories and
the particle concentration within the drop. The final section
then draws conclusions based on our findings.
2 Experimental setup
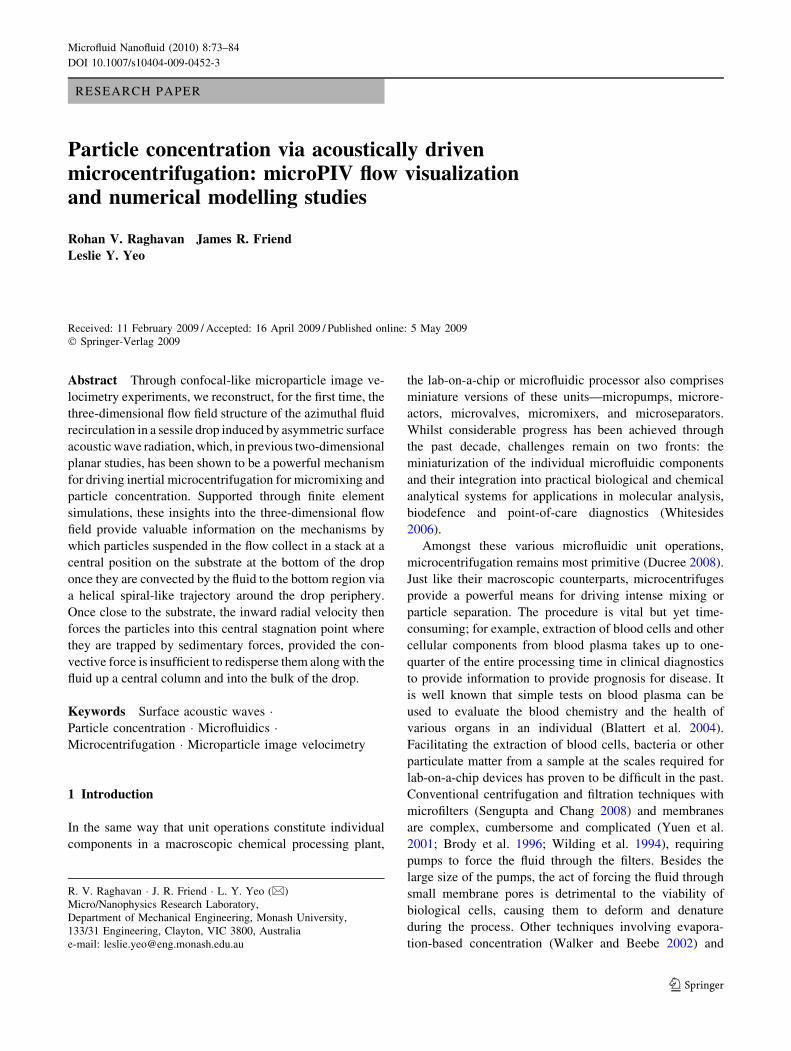
A SAW is a nanometer-order amplitude electroacoustic
traveling wave that propagates on the surface of a piezo-
electric crystal substrate, as shown in Fig. 2. When an
electric field is applied across a piezoelectric material, it
generates an elastic deformation via the converse piezo-
electric effect. Single crystal lithum niobate (LN) is one of
many such materials that is especially well-suited for use in
SAW devices for microfluidic applications, due to its low
acoustic attenuation and relatively large electromechanical
coupling from a few MHz to several GHz. The necessary
electric field is created with the help of metallic interdigital
transducers (IDTs) that are deposited onto the surface of
the crystals. When supplied with a sinusoidal electrical
signal, the IDT produces a corresponding periodic strain
pattern on the surface that results in a Rayleigh wave that
propagates away from it. Rayleigh waves decay exponen-
tially into the piezoelectric material, essentially confining
the wave energy to within a few wavelengths (typically 5–6
wavelengths) from the surface. They have displacements
both normal to the surface and along it, parallel to the wave
propagation direction (White and Voltmer 1965); the dis-
placements are temporally a quarter wavelength out of
phase and are roughly the same amplitude. Because the
frequency used in these SAW devices are at least a few
MHz, the acceleration of points along the surface in the
piezoelectric substrate is several hundred million m/s2. If a
drop is placed on the substrate in the transmission path of
the SAW, a portion of the longitudinal component of the
wave is refracted into the fluid medium at an angle known
as the Rayleigh angle hR ¼ sin�1 cl=csð Þ; cl and cs are the
sound speeds in the liquid and substrate, respectively—for
water, hR is therefore approximately 23�, defined from the
vertical axis, as shown in Fig. 2. This refracted energy
appears as a longitudinal sound wave in the fluid and is
ultimately responsible for acoustic streaming (Wixforth
2003) once the wave has reached sufficient intensity to
induce compressibility effects in the fluid. Given the tre-
mendous accelerations induced by the SAW, compression
in fluids typically considered ‘‘incompressible’’, like water,
is straightforward.
By varying the electrical power applied to the IDTs, a
parameter directly related to the amplitude of the SAW,
three modes of fluid actuation may be excited. At low
power, the drop vibrates with elastic motion of the free
fluid surface and, at a given critical value, acoustic
streaming within the drop commences (Li et al. 2008).
Increasing the applied power further, the fluid drop itself
will then move along the surface in the direction of SAW
propagation due to a horizontal body force acting on the
drop as a consequence of the longitudinal sound wave
propagating into it at the Rayleigh angle (Tan et al. 2007b).
At even higher powers, interfacial destabilization results in
the atomization of the fluid from the drop’s free surface
leading to the ejection of a fine aerosol mist (Qi et al.
Fig. 2 Schematic illustrating the propagation of the SAW on a
substrate and its interaction with a sessile fluid drop placed on the
substrate. The top image is a plan view and the bottom image is the
side view. Note the leakage of the SAW energy into the drop at the
Rayleigh angle hR. The SAW has wavelength kSAW, which is set by
the width and gap of the interdigital electrodes (IDTs)
Microfluid Nanofluid (2010) 8:73–84 75
123
2008). In this study however, the power is limited to the
amount required to induce acoustic streaming as neither
fluid translation nor atomization is of interest.
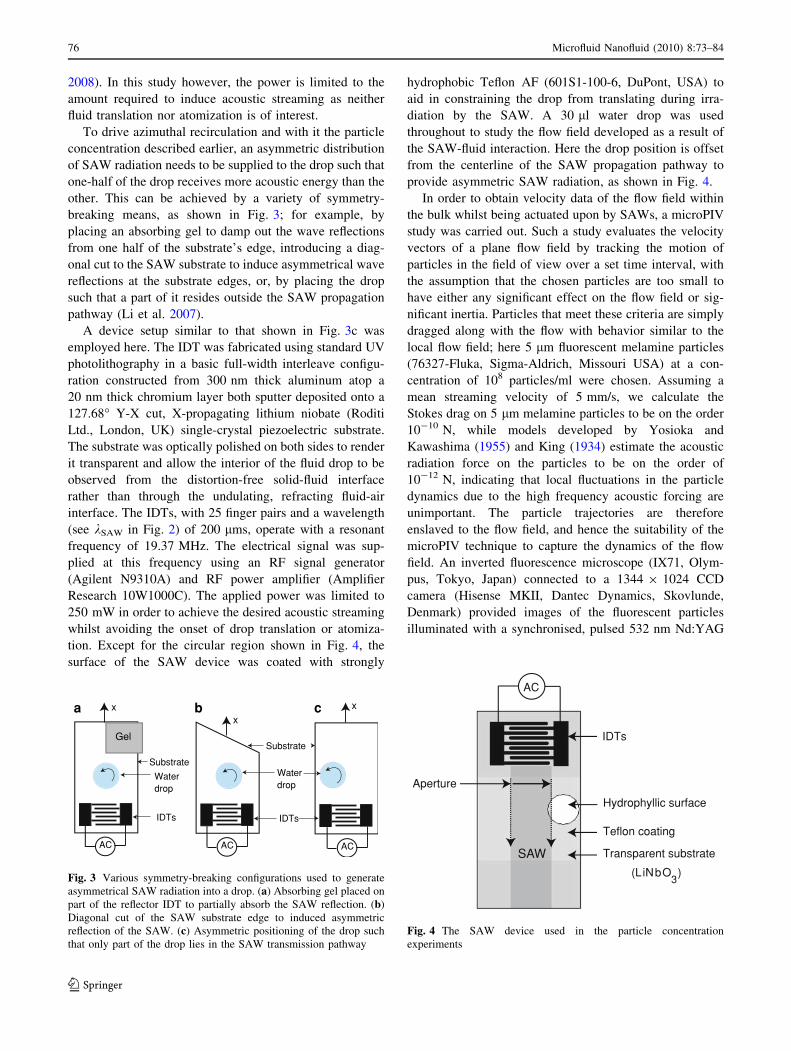
To drive azimuthal recirculation and with it the particle
concentration described earlier, an asymmetric distribution
of SAW radiation needs to be supplied to the drop such that
one-half of the drop receives more acoustic energy than the
other. This can be achieved by a variety of symmetry-
breaking means, as shown in Fig. 3; for example, by
placing an absorbing gel to damp out the wave reflections
from one half of the substrate’s edge, introducing a diag-
onal cut to the SAW substrate to induce asymmetrical wave
reflections at the substrate edges, or, by placing the drop
such that a part of it resides outside the SAW propagation
pathway (Li et al. 2007).
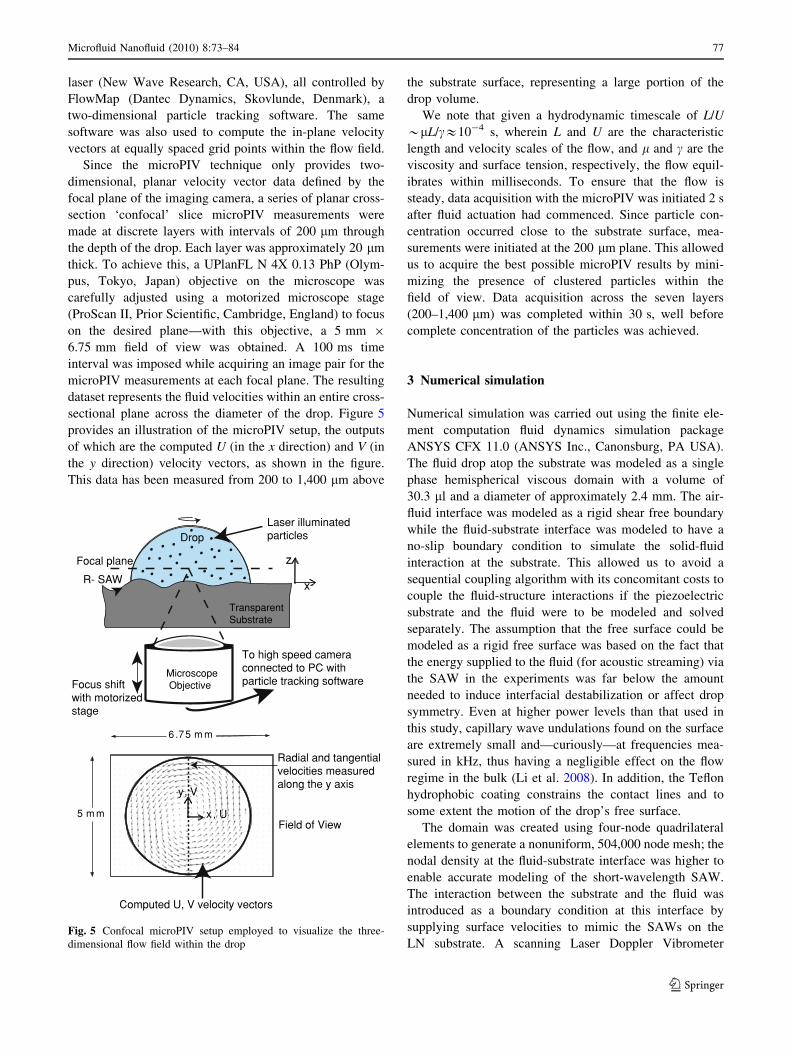
A device setup similar to that shown in Fig. 3c was
employed here. The IDT was fabricated using standard UV
photolithography in a basic full-width interleave configu-
ration constructed from 300 nm thick aluminum atop a
20 nm thick chromium layer both sputter deposited onto a
127.68� Y-X cut, X-propagating lithium niobate (Roditi
Ltd., London, UK) single-crystal piezoelectric substrate.
The substrate was optically polished on both sides to render
it transparent and allow the interior of the fluid drop to be
observed from the distortion-free solid-fluid interface
rather than through the undulating, refracting fluid-air
interface. The IDTs, with 25 finger pairs and a wavelength
(see kSAW in Fig. 2) of 200 lms, operate with a resonant
frequency of 19.37 MHz. The electrical signal was sup-
plied at this frequency using an RF signal generator
(Agilent N9310A) and RF power amplifier (Amplifier
Research 10W1000C). The applied power was limited to
250 mW in order to achieve the desired acoustic streaming
whilst avoiding the onset of drop translation or atomiza-
tion. Except for the circular region shown in Fig. 4, the
surface of the SAW device was coated with strongly
hydrophobic Teflon AF (601S1-100-6, DuPont, USA) to
aid in constraining the drop from translating during irra-
diation by the SAW. A 30 ll water drop was used
throughout to study the flow field developed as a result of
the SAW-fluid interaction. Here the drop position is offset
from the centerline of the SAW propagation pathway to
provide asymmetric SAW radiation, as shown in Fig. 4.
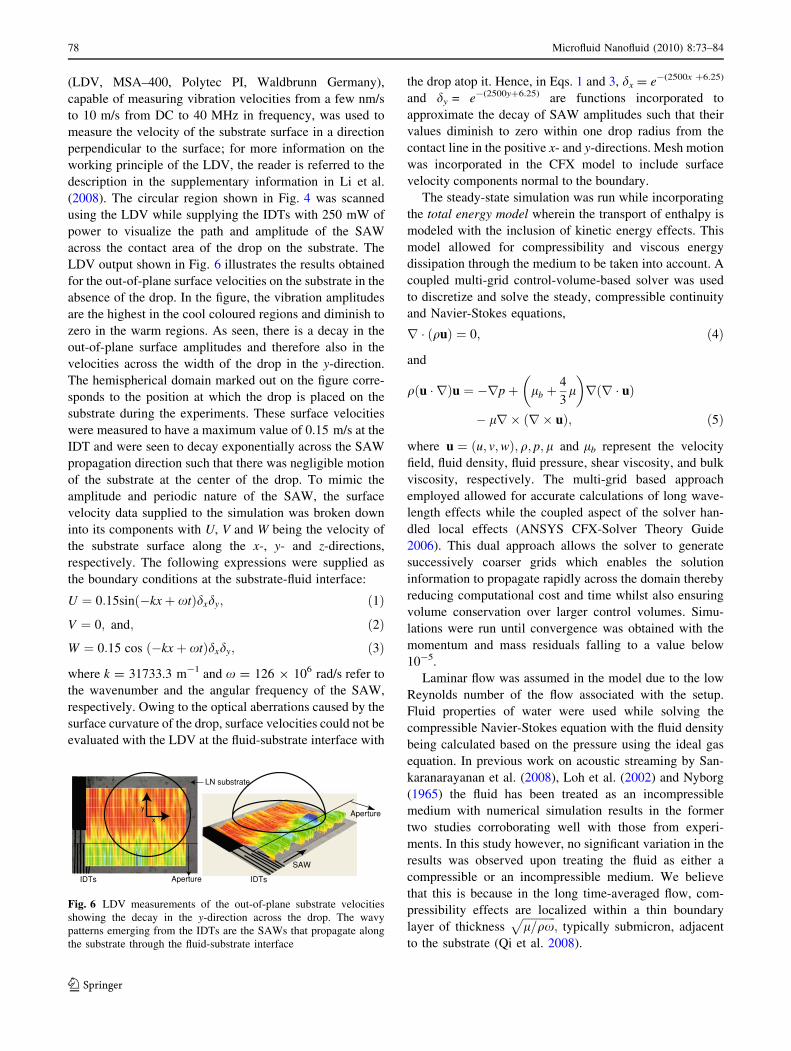
In order to obtain velocity data of the flow field within
the bulk whilst being actuated upon by SAWs, a microPIV
study was carried out. Such a study evaluates the velocity
vectors of a plane flow field by tracking the motion of
particles in the field of view over a set time interval, with
the assumption that the chosen particles are too small to
have either any significant effect on the flow field or sig-
nificant inertia. Particles that meet these criteria are simply
dragged along with the flow with behavior similar to the
local flow field; here 5 lm fluorescent melamine particles
(76327-Fluka, Sigma-Aldrich, Missouri USA) at a con-
centration of 108 particles/ml were chosen. Assuming a
mean streaming velocity of 5 mm/s, we calculate the
Stokes drag on 5 lm melamine particles to be on the order
10-10 N, while models developed by Yosioka and
Kawashima (1955) and King (1934) estimate the acoustic
radiation force on the particles to be on the order of
10-12 N, indicating that local fluctuations in the particle
dynamics due to the high frequency acoustic forcing are
unimportant. The particle trajectories are therefore
enslaved to the flow field, and hence the suitability of the
microPIV technique to capture the dynamics of the flow
field. An inverted fluorescence microscope (IX71, Olym-
pus, Tokyo, Japan) connected to a 1344 9 1024 CCD
camera (Hisense MKII, Dantec Dynamics, Skovlunde,
Denmark) provided images of the fluorescent particles
illuminated with a synchronised, pulsed 532 nm Nd:YAG
Gel
AC AC AC
IDTs IDTs
Water drop
Water drop
xx
x
Substrate
Substrate
a b c
Fig. 3 Various symmetry-breaking configurations used to generate
asymmetrical SAW radiation into a drop. (a) Absorbing gel placed on
part of the reflector IDT to partially absorb the SAW reflection. (b)
Diagonal cut of the SAW substrate edge to induced asymmetric
reflection of the SAW. (c) Asymmetric positioning of the drop such
that only part of the drop lies in the SAW transmission pathway
Teflon coating
Transparent substrate
AC
IDTs
Hydrophyllic surface
(LiNbO )3
Aperture
SAW
Fig. 4 The SAW device used in the particle concentration
experiments
76 Microfluid Nanofluid (2010) 8:73–84
123
laser (New Wave Research, CA, USA), all controlled by
FlowMap (Dantec Dynamics, Skovlunde, Denmark), a
two-dimensional particle tracking software. The same
software was also used to compute the in-plane velocity
vectors at equally spaced grid points within the flow field.
Since the microPIV technique only provides two-
dimensional, planar velocity vector data defined by the
focal plane of the imaging camera, a series of planar cross-
section ‘confocal’ slice microPIV measurements were
made at discrete layers with intervals of 200 lm through
the depth of the drop. Each layer was approximately 20 lm
thick. To achieve this, a UPlanFL N 4X 0.13 PhP (Olym-
pus, Tokyo, Japan) objective on the microscope was
carefully adjusted using a motorized microscope stage
(ProScan II, Prior Scientific, Cambridge, England) to focus
on the desired plane—with this objective, a 5 mm 9
6.75 mm field of view was obtained. A 100 ms time
interval was imposed while acquiring an image pair for the
microPIV measurements at each focal plane. The resulting
dataset represents the fluid velocities within an entire cross-
sectional plane across the diameter of the drop. Figure 5
provides an illustration of the microPIV setup, the outputs
of which are the computed U (in the x direction) and V (in
the y direction) velocity vectors, as shown in the figure.
This data has been measured from 200 to 1,400 lm above
the substrate surface, representing a large portion of the
drop volume.
We note that given a hydrodynamic timescale of L/U
*lL/c&10-4 s, wherein L and U are the characteristic
length and velocity scales of the flow, and l and c are the
viscosity and surface tension, respectively, the flow equil-
ibrates within milliseconds. To ensure that the flow is
steady, data acquisition with the microPIV was initiated 2 s
after fluid actuation had commenced. Since particle con-
centration occurred close to the substrate surface, mea-
surements were initiated at the 200 lm plane. This allowed
us to acquire the best possible microPIV results by mini-
mizing the presence of clustered particles within the
field of view. Data acquisition across the seven layers
(200–1,400 lm) was completed within 30 s, well before
complete concentration of the particles was achieved.
3 Numerical simulation
Numerical simulation was carried out using the finite ele-
ment computation fluid dynamics simulation package
ANSYS CFX 11.0 (ANSYS Inc., Canonsburg, PA USA).
The fluid drop atop the substrate was modeled as a single
phase hemispherical viscous domain with a volume of
30.3 ll and a diameter of approximately 2.4 mm. The air-
fluid interface was modeled as a rigid shear free boundary
while the fluid-substrate interface was modeled to have a
no-slip boundary condition to simulate the solid-fluid
interaction at the substrate. This allowed us to avoid a
sequential coupling algorithm with its concomitant costs to
couple the fluid-structure interactions if the piezoelectric
substrate and the fluid were to be modeled and solved
separately. The assumption that the free surface could be
modeled as a rigid free surface was based on the fact that
the energy supplied to the fluid (for acoustic streaming) via
the SAW in the experiments was far below the amount
needed to induce interfacial destabilization or affect drop
symmetry. Even at higher power levels than that used in
this study, capillary wave undulations found on the surface
are extremely small and—curiously—at frequencies mea-
sured in kHz, thus having a negligible effect on the flow
regime in the bulk (Li et al. 2008). In addition, the Teflon
hydrophobic coating constrains the contact lines and to
some extent the motion of the drop’s free surface.
The domain was created using four-node quadrilateral
elements to generate a nonuniform, 504,000 node mesh; the
nodal density at the fluid-substrate interface was higher to
enable accurate modeling of the short-wavelength SAW.
The interaction between the substrate and the fluid was
introduced as a boundary condition at this interface by
supplying surface velocities to mimic the SAWs on the
LN substrate. A scanning Laser Doppler Vibrometer
TransparentSubstrate
R- SAW
Microscope Objective
Focal plane
Drop
To high speed cameraconnected to PC withparticle tracking softwareFocus shift
with motorized stage
Laser illuminatedparticles
6 .75 m m
5 m m
y, V
x, UField of View
Computed U, V velocity vectors
z
x
Radial and tangentialvelocities measured along the y axis
Fig. 5 Confocal microPIV setup employed to visualize the three-
dimensional flow field within the drop
Microfluid Nanofluid (2010) 8:73–84 77
123
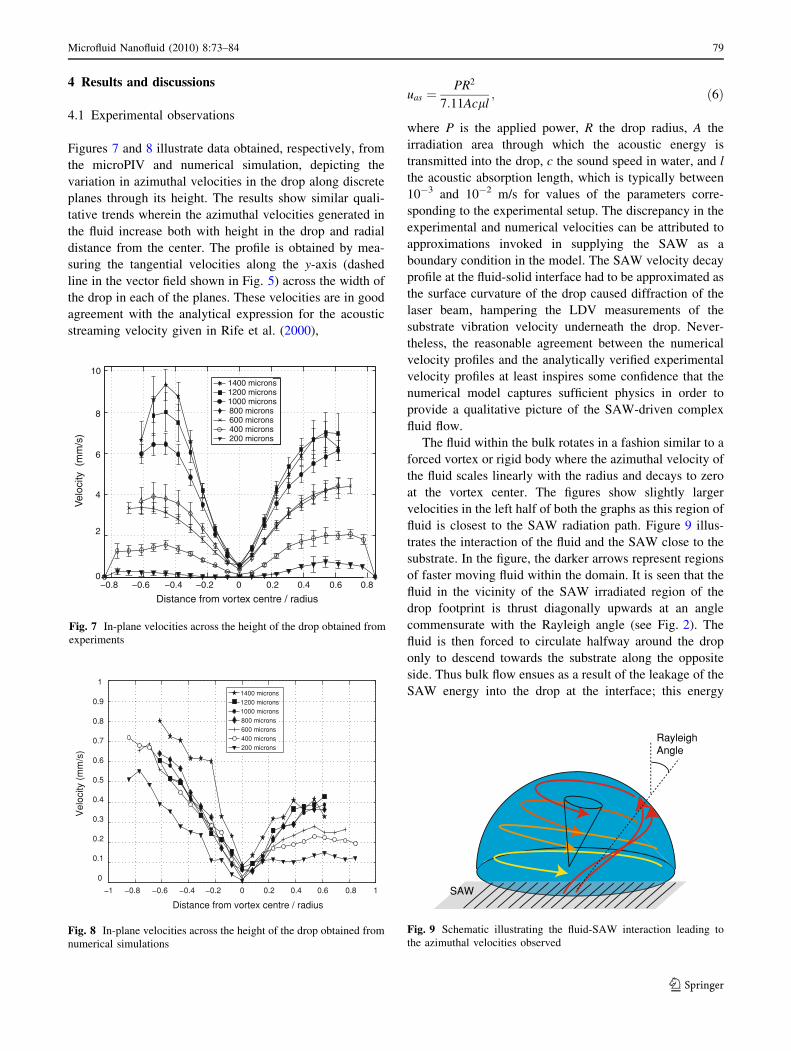
(LDV, MSA–400, Polytec PI, Waldbrunn Germany),
capable of measuring vibration velocities from a few nm/s
to 10 m/s from DC to 40 MHz in frequency, was used to
measure the velocity of the substrate surface in a direction
perpendicular to the surface; for more information on the
working principle of the LDV, the reader is referred to the
description in the supplementary information in Li et al.
(2008). The circular region shown in Fig. 4 was scanned
using the LDV while supplying the IDTs with 250 mW of
power to visualize the path and amplitude of the SAW
across the contact area of the drop on the substrate. The
LDV output shown in Fig. 6 illustrates the results obtained
for the out-of-plane surface velocities on the substrate in the
absence of the drop. In the figure, the vibration amplitudes
are the highest in the cool coloured regions and diminish to
zero in the warm regions. As seen, there is a decay in the
out-of-plane surface amplitudes and therefore also in the
velocities across the width of the drop in the y-direction.
The hemispherical domain marked out on the figure corre-
sponds to the position at which the drop is placed on the
substrate during the experiments. These surface velocities
were measured to have a maximum value of 0.15 m/s at the
IDT and were seen to decay exponentially across the SAW
propagation direction such that there was negligible motion
of the substrate at the center of the drop. To mimic the
amplitude and periodic nature of the SAW, the surface
velocity data supplied to the simulation was broken down
into its components with U, V and W being the velocity of
the substrate surface along the x-, y- and z-directions,
respectively. The following expressions were supplied as
the boundary conditions at the substrate-fluid interface:
U ¼ 0:15sinð�kxþ xtÞdxdy; ð1Þ
V ¼ 0; and; ð2ÞW ¼ 0:15 cos ð�kxþ xtÞdxdy; ð3Þ
where k = 31733.3 m-1 and x = 126 9 106 rad/s refer to
the wavenumber and the angular frequency of the SAW,
respectively. Owing to the optical aberrations caused by the
surface curvature of the drop, surface velocities could not be
evaluated with the LDV at the fluid-substrate interface with
the drop atop it. Hence, in Eqs. 1 and 3, dx = e-(2500x ?6.25)
and dy = e-(2500y?6.25) are functions incorporated to
approximate the decay of SAW amplitudes such that their
values diminish to zero within one drop radius from the
contact line in the positive x- and y-directions. Mesh motion
was incorporated in the CFX model to include surface
velocity components normal to the boundary.
The steady-state simulation was run while incorporating
the total energy model wherein the transport of enthalpy is
modeled with the inclusion of kinetic energy effects. This
model allowed for compressibility and viscous energy
dissipation through the medium to be taken into account. A
coupled multi-grid control-volume-based solver was used
to discretize and solve the steady, compressible continuity
and Navier-Stokes equations,
r � quð Þ ¼ 0; ð4Þ
and
q u � rð Þu ¼ �rpþ lb þ4
3l
� �r r � uð Þ
� lr� r� uð Þ; ð5Þ
where u ¼ u; v;wð Þ; q; p; l and lb represent the velocity
field, fluid density, fluid pressure, shear viscosity, and bulk
viscosity, respectively. The multi-grid based approach
employed allowed for accurate calculations of long wave-
length effects while the coupled aspect of the solver han-
dled local effects (ANSYS CFX-Solver Theory Guide
2006). This dual approach allows the solver to generate
successively coarser grids which enables the solution
information to propagate rapidly across the domain thereby
reducing computational cost and time whilst also ensuring
volume conservation over larger control volumes. Simu-
lations were run until convergence was obtained with the
momentum and mass residuals falling to a value below
10-5.
Laminar flow was assumed in the model due to the low
Reynolds number of the flow associated with the setup.
Fluid properties of water were used while solving the
compressible Navier-Stokes equation with the fluid density
being calculated based on the pressure using the ideal gas
equation. In previous work on acoustic streaming by San-
karanarayanan et al. (2008), Loh et al. (2002) and Nyborg
(1965) the fluid has been treated as an incompressible
medium with numerical simulation results in the former
two studies corroborating well with those from experi-
ments. In this study however, no significant variation in the
results was observed upon treating the fluid as either a
compressible or an incompressible medium. We believe
that this is because in the long time-averaged flow, com-
pressibility effects are localized within a thin boundary
layer of thicknessffiffiffiffiffiffiffiffiffiffiffiffil=qx
p; typically submicron, adjacent
to the substrate (Qi et al. 2008).
Aperturex
y
IDTs
LN substrate
IDTs Aperture
SAW
Fig. 6 LDV measurements of the out-of-plane substrate velocities
showing the decay in the y-direction across the drop. The wavy
patterns emerging from the IDTs are the SAWs that propagate along
the substrate through the fluid-substrate interface
78 Microfluid Nanofluid (2010) 8:73–84
123
4 Results and discussions
4.1 Experimental observations
Figures 7 and 8 illustrate data obtained, respectively, from
the microPIV and numerical simulation, depicting the
variation in azimuthal velocities in the drop along discrete
planes through its height. The results show similar quali-
tative trends wherein the azimuthal velocities generated in
the fluid increase both with height in the drop and radial
distance from the center. The profile is obtained by mea-
suring the tangential velocities along the y-axis (dashed
line in the vector field shown in Fig. 5) across the width of
the drop in each of the planes. These velocities are in good
agreement with the analytical expression for the acoustic
streaming velocity given in Rife et al. (2000),
uas ¼PR2
7:11Acll; ð6Þ
where P is the applied power, R the drop radius, A the
irradiation area through which the acoustic energy is
transmitted into the drop, c the sound speed in water, and l
the acoustic absorption length, which is typically between
10-3 and 10-2 m/s for values of the parameters corre-
sponding to the experimental setup. The discrepancy in the
experimental and numerical velocities can be attributed to
approximations invoked in supplying the SAW as a
boundary condition in the model. The SAW velocity decay
profile at the fluid-solid interface had to be approximated as
the surface curvature of the drop caused diffraction of the
laser beam, hampering the LDV measurements of the
substrate vibration velocity underneath the drop. Never-
theless, the reasonable agreement between the numerical
velocity profiles and the analytically verified experimental
velocity profiles at least inspires some confidence that the
numerical model captures sufficient physics in order to
provide a qualitative picture of the SAW-driven complex
fluid flow.
The fluid within the bulk rotates in a fashion similar to a
forced vortex or rigid body where the azimuthal velocity of
the fluid scales linearly with the radius and decays to zero
at the vortex center. The figures show slightly larger
velocities in the left half of both the graphs as this region of
fluid is closest to the SAW radiation path. Figure 9 illus-
trates the interaction of the fluid and the SAW close to the
substrate. In the figure, the darker arrows represent regions
of faster moving fluid within the domain. It is seen that the
fluid in the vicinity of the SAW irradiated region of the
drop footprint is thrust diagonally upwards at an angle
commensurate with the Rayleigh angle (see Fig. 2). The
fluid is then forced to circulate halfway around the drop
only to descend towards the substrate along the opposite
side. Thus bulk flow ensues as a result of the leakage of the
SAW energy into the drop at the interface; this energy
2
4
6
8
10
1400 microns1200 microns1000 microns800 microns600 microns400 microns200 microns
Vel
ocity
(m
m/s
)
0−0.8 −0.6 −0.4 −0.2 0 0.2 0.4 0.6 0.8
Distance from vortex centre / radius
Fig. 7 In-plane velocities across the height of the drop obtained from
experiments
−1 −0.8 −0.6 −0.4 −0.2 0 0.2 0.4 0.6 0.8 1
0
0.1
0.2
0.3
0.4
0.5
0.6
0.7
0.8
0.9
11400 microns1200 microns1000 microns800 microns600 microns400 microns200 microns
Vel
ocity
(m
m/s
)
Distance from vortex centre / radius
Fig. 8 In-plane velocities across the height of the drop obtained from
numerical simulations
SAW
RayleighAngle
Fig. 9 Schematic illustrating the fluid-SAW interaction leading to
the azimuthal velocities observed
Microfluid Nanofluid (2010) 8:73–84 79
123
however decays in the direction of SAW propagation. As
the fluid travels around the drop it loses velocity, as seen by
the dip in the velocity values in the right half of the Figs. 7
and 8, only to be driven faster, once again, when it re-
enters the region exposed to the SAW.
In-plane radial velocities evaluated from the microPIV
results are illustrated in Fig. 10. The data represents the
velocities measured at each plane along the y-axis (dashed
line in the vector field shown in Fig. 5) across a line
passing through the center of the vortex. Hence, a positive
radial velocity in the left half of the figure indicates a
velocity vector pointing inwards and a positive velocity
value in the right half of the figure indicates a radial
velocity directed outwards. In Fig. 10, the dashed line is a
representation of what such a profile would look like if the
flow field was perfectly solenoidal. From the results it is
evident that in the lower regions of the drop, there is a net
inwards radial velocity which gradually disappears at about
800–1000 lm above the substrate where nearly solenoidal
flow is established. In measurements made at heights above
this value, there is evidence of a radial velocity directed
outwards implying the existence of secondary flow recir-
culation up the central vortex column. Similar secondary
meridional flow recirculations structures were first
observed in Yeo et al. (2006a) and Arifin et al. (2007).
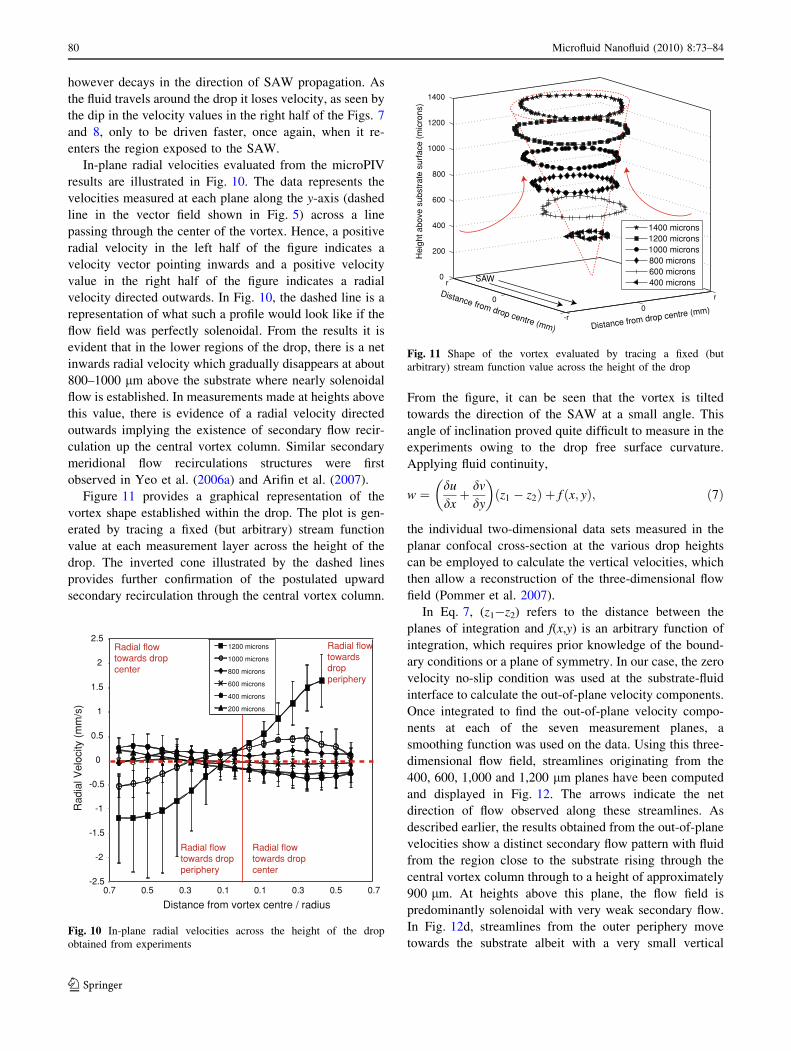
Figure 11 provides a graphical representation of the
vortex shape established within the drop. The plot is gen-
erated by tracing a fixed (but arbitrary) stream function
value at each measurement layer across the height of the
drop. The inverted cone illustrated by the dashed lines
provides further confirmation of the postulated upward
secondary recirculation through the central vortex column.
From the figure, it can be seen that the vortex is tilted
towards the direction of the SAW at a small angle. This
angle of inclination proved quite difficult to measure in the
experiments owing to the drop free surface curvature.
Applying fluid continuity,
w ¼ du
dxþ dv
dy
� �ðz1 � z2Þ þ f ðx; yÞ; ð7Þ
the individual two-dimensional data sets measured in the
planar confocal cross-section at the various drop heights
can be employed to calculate the vertical velocities, which
then allow a reconstruction of the three-dimensional flow
field (Pommer et al. 2007).
In Eq. 7, (z1-z2) refers to the distance between the
planes of integration and f(x,y) is an arbitrary function of
integration, which requires prior knowledge of the bound-
ary conditions or a plane of symmetry. In our case, the zero
velocity no-slip condition was used at the substrate-fluid
interface to calculate the out-of-plane velocity components.
Once integrated to find the out-of-plane velocity compo-
nents at each of the seven measurement planes, a
smoothing function was used on the data. Using this three-
dimensional flow field, streamlines originating from the
400, 600, 1,000 and 1,200 lm planes have been computed
and displayed in Fig. 12. The arrows indicate the net
direction of flow observed along these streamlines. As
described earlier, the results obtained from the out-of-plane
velocities show a distinct secondary flow pattern with fluid
from the region close to the substrate rising through the
central vortex column through to a height of approximately
900 lm. At heights above this plane, the flow field is
predominantly solenoidal with very weak secondary flow.
In Fig. 12d, streamlines from the outer periphery move
towards the substrate albeit with a very small vertical
-2.5
-2
-1.5
-1
-0.5
0
0.5
1
1.5
2
2.5
-
0.7 0.5 0.3 0.1 0.1 0.3 0.5 0.7
1200 microns
1000 microns
800 microns
600 microns
400 microns
200 microns
0
Distance from vortex centre / radius
Radial flow towards dropcenter
Radial flow towardsdropperiphery
Radial flow towards dropcenter
Radial flow towards dropperiphery
Rad
ial V
eloc
ity (
mm
/s)
Fig. 10 In-plane radial velocities across the height of the drop
obtained from experiments
0
200
400
600
800
1000
1200
1400
1400 microns1200 microns 1000 microns800 microns600 microns400 microns
0
-r
r
0
r
Distance from drop centre (mm)
Distance from drop centre (mm)
Hei
ght a
bove
sub
stra
te s
urfa
ce (
mic
rons
)
SAW
Fig. 11 Shape of the vortex evaluated by tracing a fixed (but
arbitrary) stream function value across the height of the drop
80 Microfluid Nanofluid (2010) 8:73–84
123
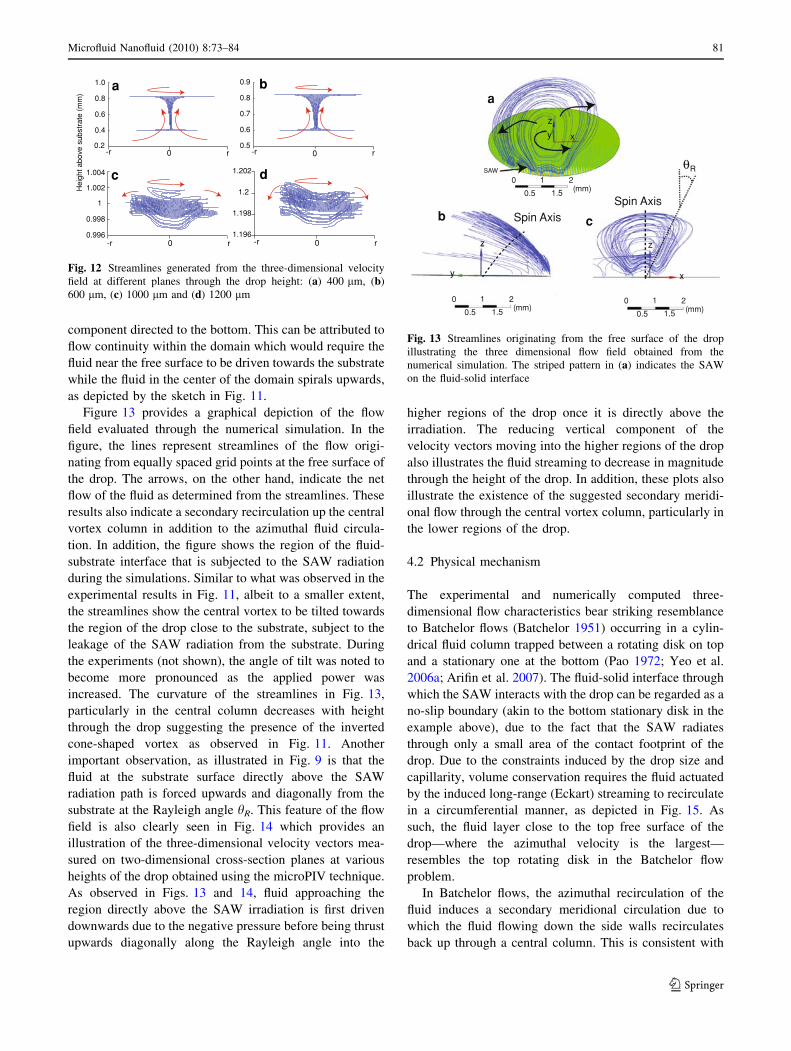
component directed to the bottom. This can be attributed to
flow continuity within the domain which would require the
fluid near the free surface to be driven towards the substrate
while the fluid in the center of the domain spirals upwards,
as depicted by the sketch in Fig. 11.
Figure 13 provides a graphical depiction of the flow
field evaluated through the numerical simulation. In the
figure, the lines represent streamlines of the flow origi-
nating from equally spaced grid points at the free surface of
the drop. The arrows, on the other hand, indicate the net
flow of the fluid as determined from the streamlines. These
results also indicate a secondary recirculation up the central
vortex column in addition to the azimuthal fluid circula-
tion. In addition, the figure shows the region of the fluid-
substrate interface that is subjected to the SAW radiation
during the simulations. Similar to what was observed in the
experimental results in Fig. 11, albeit to a smaller extent,
the streamlines show the central vortex to be tilted towards
the region of the drop close to the substrate, subject to the
leakage of the SAW radiation from the substrate. During
the experiments (not shown), the angle of tilt was noted to
become more pronounced as the applied power was
increased. The curvature of the streamlines in Fig. 13,
particularly in the central column decreases with height
through the drop suggesting the presence of the inverted
cone-shaped vortex as observed in Fig. 11. Another
important observation, as illustrated in Fig. 9 is that the
fluid at the substrate surface directly above the SAW
radiation path is forced upwards and diagonally from the
substrate at the Rayleigh angle hR. This feature of the flow
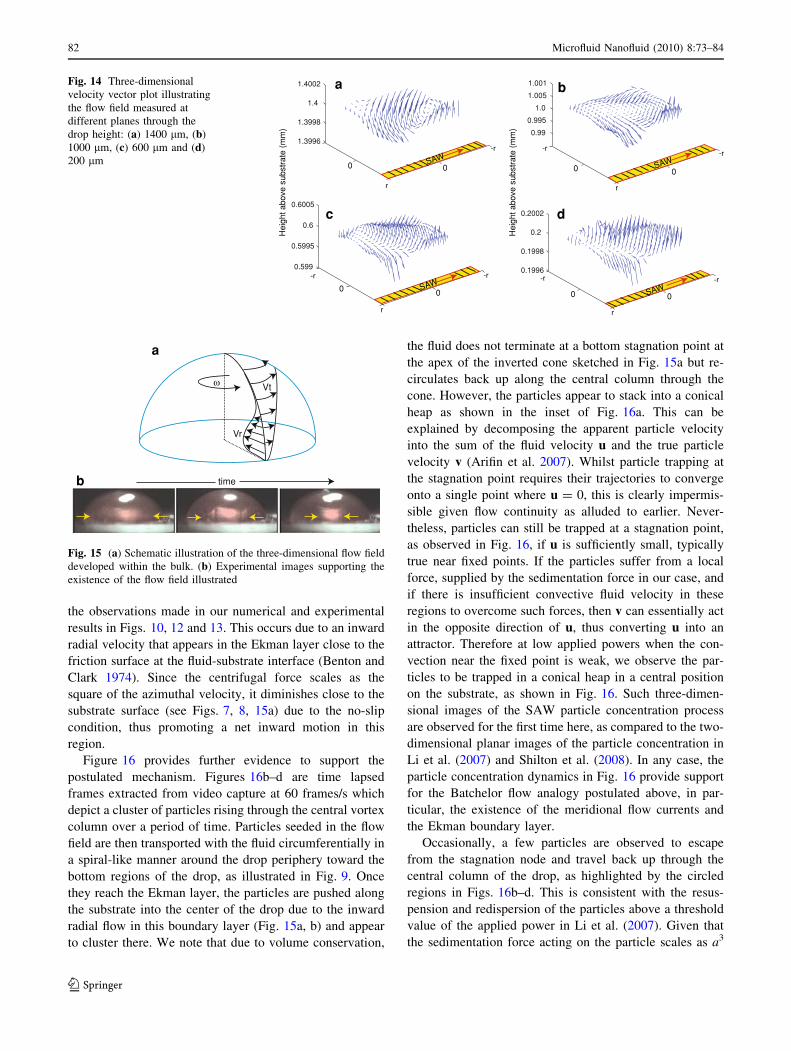
field is also clearly seen in Fig. 14 which provides an
illustration of the three-dimensional velocity vectors mea-
sured on two-dimensional cross-section planes at various
heights of the drop obtained using the microPIV technique.
As observed in Figs. 13 and 14, fluid approaching the
region directly above the SAW irradiation is first driven
downwards due to the negative pressure before being thrust
upwards diagonally along the Rayleigh angle into the
higher regions of the drop once it is directly above the
irradiation. The reducing vertical component of the
velocity vectors moving into the higher regions of the drop
also illustrates the fluid streaming to decrease in magnitude
through the height of the drop. In addition, these plots also
illustrate the existence of the suggested secondary meridi-
onal flow through the central vortex column, particularly in
the lower regions of the drop.
4.2 Physical mechanism
The experimental and numerically computed three-
dimensional flow characteristics bear striking resemblance
to Batchelor flows (Batchelor 1951) occurring in a cylin-
drical fluid column trapped between a rotating disk on top
and a stationary one at the bottom (Pao 1972; Yeo et al.
2006a; Arifin et al. 2007). The fluid-solid interface through
which the SAW interacts with the drop can be regarded as a
no-slip boundary (akin to the bottom stationary disk in the
example above), due to the fact that the SAW radiates
through only a small area of the contact footprint of the
drop. Due to the constraints induced by the drop size and
capillarity, volume conservation requires the fluid actuated
by the induced long-range (Eckart) streaming to recirculate
in a circumferential manner, as depicted in Fig. 15. As
such, the fluid layer close to the top free surface of the
drop—where the azimuthal velocity is the largest—
resembles the top rotating disk in the Batchelor flow
problem.
In Batchelor flows, the azimuthal recirculation of the
fluid induces a secondary meridional circulation due to
which the fluid flowing down the side walls recirculates
back up through a central column. This is consistent with
-r 01.196
1.198
1.2
1.202
0.996
0.998
1
1.002
1.004
0.5
0.6
0.7
0.8
0.9
0.2
0.4
0.6
0.8
1.0
r
-r 0 r
-r 0 r
-r 0 r
c
ba
Hei
ght a
bove
sub
stra
te (
mm
)
d
Fig. 12 Streamlines generated from the three-dimensional velocity
field at different planes through the drop height: (a) 400 lm, (b)
600 lm, (c) 1000 lm and (d) 1200 lm
SAW
Spin AxisSpin Axis
θR
a
b c
xy
zz
z
xy
0 1 2
0.5 1.5 (mm)0 1 2
0.5 1.5 (mm)
0 1 2
0.5 1.5 (mm)
Fig. 13 Streamlines originating from the free surface of the drop
illustrating the three dimensional flow field obtained from the
numerical simulation. The striped pattern in (a) indicates the SAW
on the fluid-solid interface
Microfluid Nanofluid (2010) 8:73–84 81
123
the observations made in our numerical and experimental
results in Figs. 10, 12 and 13. This occurs due to an inward
radial velocity that appears in the Ekman layer close to the
friction surface at the fluid-substrate interface (Benton and
Clark 1974). Since the centrifugal force scales as the
square of the azimuthal velocity, it diminishes close to the
substrate surface (see Figs. 7, 8, 15a) due to the no-slip
condition, thus promoting a net inward motion in this
region.
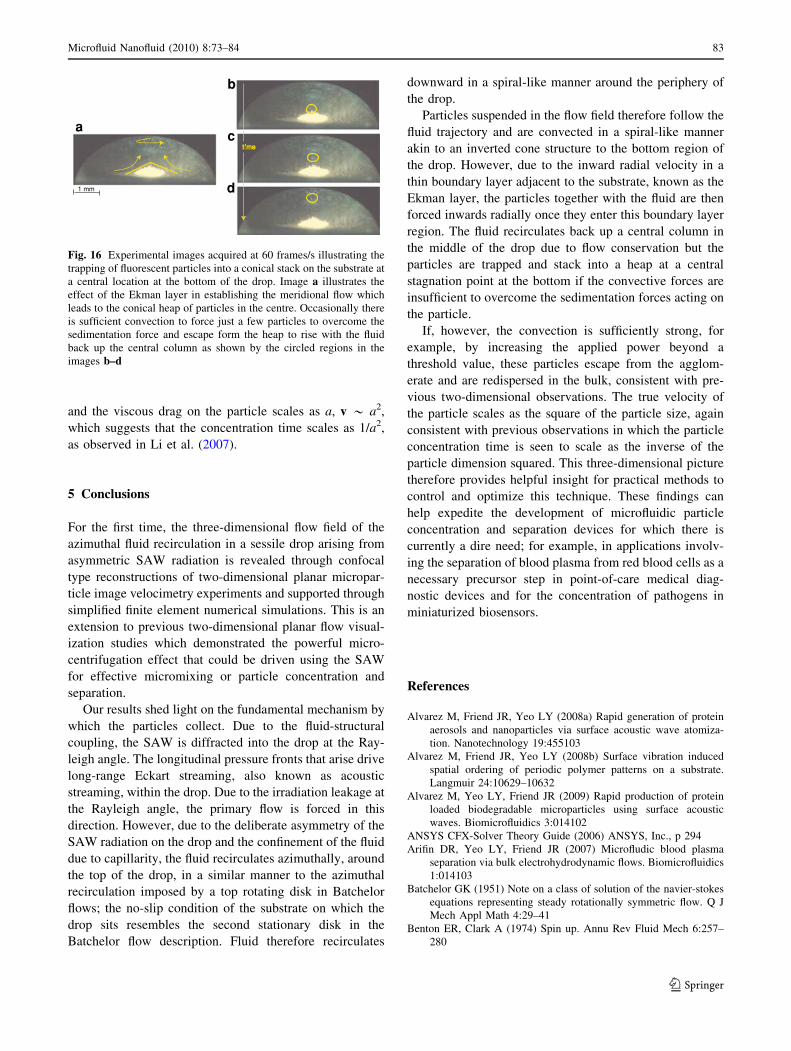
Figure 16 provides further evidence to support the
postulated mechanism. Figures 16b–d are time lapsed
frames extracted from video capture at 60 frames/s which
depict a cluster of particles rising through the central vortex
column over a period of time. Particles seeded in the flow
field are then transported with the fluid circumferentially in
a spiral-like manner around the drop periphery toward the
bottom regions of the drop, as illustrated in Fig. 9. Once
they reach the Ekman layer, the particles are pushed along
the substrate into the center of the drop due to the inward
radial flow in this boundary layer (Fig. 15a, b) and appear
to cluster there. We note that due to volume conservation,
the fluid does not terminate at a bottom stagnation point at
the apex of the inverted cone sketched in Fig. 15a but re-
circulates back up along the central column through the
cone. However, the particles appear to stack into a conical
heap as shown in the inset of Fig. 16a. This can be
explained by decomposing the apparent particle velocity
into the sum of the fluid velocity u and the true particle
velocity v (Arifin et al. 2007). Whilst particle trapping at
the stagnation point requires their trajectories to converge
onto a single point where u = 0, this is clearly impermis-
sible given flow continuity as alluded to earlier. Never-
theless, particles can still be trapped at a stagnation point,
as observed in Fig. 16, if u is sufficiently small, typically
true near fixed points. If the particles suffer from a local
force, supplied by the sedimentation force in our case, and
if there is insufficient convective fluid velocity in these
regions to overcome such forces, then v can essentially act
in the opposite direction of u, thus converting u into an
attractor. Therefore at low applied powers when the con-
vection near the fixed point is weak, we observe the par-
ticles to be trapped in a conical heap in a central position
on the substrate, as shown in Fig. 16. Such three-dimen-
sional images of the SAW particle concentration process
are observed for the first time here, as compared to the two-
dimensional planar images of the particle concentration in
Li et al. (2007) and Shilton et al. (2008). In any case, the
particle concentration dynamics in Fig. 16 provide support
for the Batchelor flow analogy postulated above, in par-
ticular, the existence of the meridional flow currents and
the Ekman boundary layer.
Occasionally, a few particles are observed to escape
from the stagnation node and travel back up through the
central column of the drop, as highlighted by the circled
regions in Figs. 16b–d. This is consistent with the resus-
pension and redispersion of the particles above a threshold
value of the applied power in Li et al. (2007). Given that
the sedimentation force acting on the particle scales as a3
0.1996
0.1998
0.2
0.2002
0.599
0.5995
0.6
0.6005
0.99
0.995
1.0
1.005
1.001
1.3996
1.3998
1.4
1.4002
-r
SAW-r
SAWSAW
SAW
a b
dc
Hei
ght a
bove
sub
stra
te (
mm
)
Hei
ght a
bove
sub
stra
te (
mm
)
-r-r
-r-r
-r
r r
r
0 0 00
0 000
r
Fig. 14 Three-dimensional
velocity vector plot illustrating
the flow field measured at
different planes through the
drop height: (a) 1400 lm, (b)
1000 lm, (c) 600 lm and (d)
200 lm
Vr
Vt
b
ω
time
a
Fig. 15 (a) Schematic illustration of the three-dimensional flow field
developed within the bulk. (b) Experimental images supporting the
existence of the flow field illustrated
82 Microfluid Nanofluid (2010) 8:73–84
123
and the viscous drag on the particle scales as a, v * a2,
which suggests that the concentration time scales as 1/a2,
as observed in Li et al. (2007).
5 Conclusions
For the first time, the three-dimensional flow field of the
azimuthal fluid recirculation in a sessile drop arising from
asymmetric SAW radiation is revealed through confocal
type reconstructions of two-dimensional planar micropar-
ticle image velocimetry experiments and supported through
simplified finite element numerical simulations. This is an
extension to previous two-dimensional planar flow visual-
ization studies which demonstrated the powerful micro-
centrifugation effect that could be driven using the SAW
for effective micromixing or particle concentration and
separation.
Our results shed light on the fundamental mechanism by
which the particles collect. Due to the fluid-structural
coupling, the SAW is diffracted into the drop at the Ray-
leigh angle. The longitudinal pressure fronts that arise drive
long-range Eckart streaming, also known as acoustic
streaming, within the drop. Due to the irradiation leakage at
the Rayleigh angle, the primary flow is forced in this
direction. However, due to the deliberate asymmetry of the
SAW radiation on the drop and the confinement of the fluid
due to capillarity, the fluid recirculates azimuthally, around
the top of the drop, in a similar manner to the azimuthal
recirculation imposed by a top rotating disk in Batchelor
flows; the no-slip condition of the substrate on which the
drop sits resembles the second stationary disk in the
Batchelor flow description. Fluid therefore recirculates
downward in a spiral-like manner around the periphery of
the drop.
Particles suspended in the flow field therefore follow the
fluid trajectory and are convected in a spiral-like manner
akin to an inverted cone structure to the bottom region of
the drop. However, due to the inward radial velocity in a
thin boundary layer adjacent to the substrate, known as the
Ekman layer, the particles together with the fluid are then
forced inwards radially once they enter this boundary layer
region. The fluid recirculates back up a central column in
the middle of the drop due to flow conservation but the
particles are trapped and stack into a heap at a central
stagnation point at the bottom if the convective forces are
insufficient to overcome the sedimentation forces acting on
the particle.
If, however, the convection is sufficiently strong, for
example, by increasing the applied power beyond a
threshold value, these particles escape from the agglom-
erate and are redispersed in the bulk, consistent with pre-
vious two-dimensional observations. The true velocity of
the particle scales as the square of the particle size, again
consistent with previous observations in which the particle
concentration time is seen to scale as the inverse of the
particle dimension squared. This three-dimensional picture
therefore provides helpful insight for practical methods to
control and optimize this technique. These findings can
help expedite the development of microfluidic particle
concentration and separation devices for which there is
currently a dire need; for example, in applications involv-
ing the separation of blood plasma from red blood cells as a
necessary precursor step in point-of-care medical diag-
nostic devices and for the concentration of pathogens in
miniaturized biosensors.
References
Alvarez M, Friend JR, Yeo LY (2008a) Rapid generation of protein
aerosols and nanoparticles via surface acoustic wave atomiza-
tion. Nanotechnology 19:455103
Alvarez M, Friend JR, Yeo LY (2008b) Surface vibration induced
spatial ordering of periodic polymer patterns on a substrate.
Langmuir 24:10629–10632
Alvarez M, Yeo LY, Friend JR (2009) Rapid production of protein
loaded biodegradable microparticles using surface acoustic
waves. Biomicrofluidics 3:014102
ANSYS CFX-Solver Theory Guide (2006) ANSYS, Inc., p 294
Arifin DR, Yeo LY, Friend JR (2007) Microfludic blood plasma
separation via bulk electrohydrodynamic flows. Biomicrofluidics
1:014103
Batchelor GK (1951) Note on a class of solution of the navier-stokes
equations representing steady rotationally symmetric flow. Q J
Mech Appl Math 4:29–41
Benton ER, Clark A (1974) Spin up. Annu Rev Fluid Mech 6:257–
280
b
c
d
atimetime
1 mm
Fig. 16 Experimental images acquired at 60 frames/s illustrating the
trapping of fluorescent particles into a conical stack on the substrate at
a central location at the bottom of the drop. Image a illustrates the
effect of the Ekman layer in establishing the meridional flow which
leads to the conical heap of particles in the centre. Occasionally there
is sufficient convection to force just a few particles to overcome the
sedimentation force and escape form the heap to rise with the fluid
back up the central column as shown by the circled regions in the
images b–d
Microfluid Nanofluid (2010) 8:73–84 83
123
Blattert C, Jurisekha R, Tahhan I, Schoth A, Kerth P, Menz K (2004)
Separation of blood in microchannel bends. In: Proceedings of
the 26th annual international conference of the IEEE. Engineer-
ing in Medicine and Biology Society, San Francisco
Brody JP, Osborn TD, Forster FK, Yager P (1996) A planar
microfabricated fluid filter. Sens Act A 54:704–708
Ducree J (2008) Centrifugal microfluidics. In: Li D (ed) Encyclopedia
of microfluidics and nanofluidics. Springer, New York
Friend J, Yeo L, Arifin D, Mechler A (2008) Evaporative self-
assembly assisted synthesis of polymer nanoparticles by surface
acoustic wave atomization. Nanotechnology 19:145301
Hodgson RP, Tan M, Yeo L, Friend J (2009) Transmitting high power
rf acoustic radiation via fluid couplants into superstrates for
microfluidics. Appl Phys Lett 94(2):024102
King L (1934) On the acoustic radiation pressure on spheres. Proc R
Soc Lond A 147:212–240
Li H, Friend JR, Yeo LY (2007) Surface acoustic wave concentration
of particle and bioparticle suspensions. Biomed Microdev
9:647–656
Li H, Friend JR, Yeo LY (2008) Microfluidic colloidal island
formation and erasure induced by surface acoustic wave
radiation. Phys Rev Lett 101:084502
Loh B-G, Hyun S, Ro PI, Kleinstreuer C (2002) Acoustic streaming
induced by ultrasonic flexural vibrations and associated enhance-
ment of convective heat transfer. J Acoust Soc Am 111:875–883
Madou M, Kellogg G (1998) LabCD: a centrifuge-based platform for
diagnostics. In: Proceedings of the SPIE, vol 3259, pp 80–93
Meng AH, Wang AW, White RM (1999) Ultrasonic sample
concentration for microfluidic systems. In: Proceedings of the
tenth international conference on solid-state sensors and actua-
tors, pp 876–879
Nyborg WL (1965) Physical acoustics, vol 2B. Academic Press,
New York
Pao H-P (1972) Numerical solution of the navier-stokes equations for
flows in the disk-cylinder system. Phys Fluids 15:4
Papautsky I, Asgar A, Bhagat S (2008) Microscale flow visualization.
In: Li D (ed) Encyclopedia of microfluidics and nanofluidics.
Springer, New York
Pommer MS, Kielhl AR, Soni G, Dakessian NS, Meinhart CD (2007)
A 3d–3c micro-piv method. In: Proceedings of the second IEEE
international conference on nano/micro engineered and molec-
ular systems, p 074103
Qi A, Yeo LY, Friend JR (2008) Interfacial destabilization and
atomization driven by surface acoustic waves. Phys Fluids
20:074103
Rife J, Bell M, Horwitz J, Kabler M, Auyeung R, Kim W (2000)
Miniature valveless ultrasonic pumps and mixers. Sens Actuators
86:135–140
Sankaranarayanan SKRS, Cular S, Bhethanabotla VR, Joseph B
(2008) Flow induced by acoustic streaming on surface-acoustic-
wave devices and its application in biofouling removal: a
computational study and comparisons to experiment. Phys Rev E
77:066308
Sengupta S, Chang H-C (2008) Microfilters. In:Li D (ed) Encyclo-
pedia of microfluidics and nanofluidics. Springer, New York
Shilton R, Tan MK, Yeo LY, Friend JR (2008) Particle concentration
and mixing in microdrops driven by focused surface acoustic
waves. J Appl Phys 104:014910
Tan MK, Friend JR, Yeo LY (2007a) Direct visualization of surface
acoustic waves along substrates using smoke particles. Appl
Phys Lett 91:224101
Tan MK, Yeo LY, Friend JR (2007b) Microparticle collection and
concentration via a miniature surface acoustic wave device. Lab
Chip 7:618–625
Tan MK, Friend JR, Yeo LY (2009) Anomalous interfacial jetting
phenomena induced by focused surface vibrations. Phys Rev
Lett (submitted)
Walker GM, Beebe DJ (2002) A passive pumping method for
microfluidic devices. Lab Chip 2:131–134
White R, Voltmer F (1965) Direct piezoelectric coupling to surface
elastic waves. Appl Phys Lett 7:314–316
Whitesides G (2006) The origins and the future of microfluidics.
Nature 442:368–373
Wilding P, Pfahler J, Bau HH, Zemel JN, Kricka LJ (1994)
Manipulation and flow of biological fluids in straight channels
micromachined in silicon. Clin Chem 40:43–47
Wixforth A (2003) Acoustically driven planar microfluidics. Super-
lattice Microst 33:389–396
Wixforth A, Strobl C, Gauer C, Toegl A, Scriba J, Guttenberg Z
(1990) Acoustic manipulation of small droplets. Anal Bioanal
Chem 319:982–991
Yeo LY, Friend JR (2009) Ultrafast microfluidics using surface
acoustic waves. Biomicrofluidics 3:012002
Yeo LY, Friend JR, Arifin DR (2006a) Electric tempest in a teacup:
the tea leaf analogy to microfluidic blood plasma separation.
Appl Phys Lett 89:103516
Yeo LY, Hou D, Maheshswari S, Chang H-C (2006b) Electrohydro-
dynamic surface micro-vortices for mixing and particle trapping.
Appl Phys Lett 88:233512
Yosioka K, Kawashima Y (1955) Acoustic radiation pressure on a
compressible sphere. Acustica 5:167–173
Yuen PK, Kricka LJ, Fortina P, Panaro NL, Sakazume T, Wilding P
(2001) Micro-fluidics module for blood sample preparation and
nucleic acid amplification reaction. Genome Res 11:405
84 Microfluid Nanofluid (2010) 8:73–84
123


![Index [assets.cambridge.org]assets.cambridge.org/97805218/60253/index/9780521860253_index… · aggregation. See bubble, aggregation; particle, aggregation; particle, concentration](https://img.pdfslide.net/doc/110x75/60634dbbe29a93467d378f87/index-aggregation-see-bubble-aggregation-particle-aggregation-particle.jpg)