Embed Size (px)
Citation preview
1
Pathomic Fusion: An Integrated Framework forFusing Histopathology and Genomic Features for
Cancer Diagnosis and PrognosisRichard J. Chen, Ming Y. Lu, Jingwen Wang, Drew F. K. Williamson, Scott J. Rodig,
Neal I. Lindeman and Faisal Mahmood∗
Abstract—Cancer diagnosis, prognosis, and therapeutic re-sponse predictions are based on morphological informationfrom histology slides and molecular profiles from genomic data.However, most deep learning-based objective outcome predictionand grading paradigms are based on histology or genomicsalone and do not make use of the complementary informationin an intuitive manner. In this work, we propose PathomicFusion, an interpretable strategy for end-to-end multimodalfusion of histology image and genomic (mutations, CNV, RNA-Seq) features for survival outcome prediction. Our approachmodels pairwise feature interactions across modalities by takingthe Kronecker product of unimodal feature representations, andcontrols the expressiveness of each representation via a gating-based attention mechanism. Following supervised learning, weare able to interpret and saliently localize features across eachmodality, and understand how feature importance shifts whenconditioning on multimodal input. We validate our approachusing glioma and clear cell renal cell carcinoma datasets fromthe Cancer Genome Atlas (TCGA), which contains paired whole-slide image, genotype, and transcriptome data with ground truthsurvival and histologic grade labels. In a 15-fold cross-validation,our results demonstrate that the proposed multimodal fusionparadigm improves prognostic determinations from ground truthgrading and molecular subtyping, as well as unimodal deepnetworks trained on histology and genomic data alone. Theproposed method establishes insight and theory on how totrain deep networks on multimodal biomedical data in anintuitive manner, which will be useful for other problems inmedicine that seek to combine heterogeneous data streams forunderstanding diseases and predicting response and resistanceto treatment. Code and trained models are made available at:https://github.com/mahmoodlab/PathomicFusion.
Index Terms—Multimodal Learning, Graph Convolutional Net-works, Survival Analysis
I. INTRODUCTION
CANCER diagnosis, prognosis and therapeutic responseprediction is usually accomplished using heterogeneous
data sources including histology slides, molecular profiles, aswell as clinical data such as the patient’s age and comorbidities.
(Corresponding Author: Faisal Mahmood [email protected]).All authors are with the Department of Pathology, Brigham and Women’s Hos-pital, Harvard Medical School, Boston, MA. R.J.C. M.L. and F.M. are also withthe Broad Institute of Harvard and MIT and the at Dana-Farber Cancer Institute,Boston, MA. R.J.C. is also with the Department of Biomedical Informatics,Harvard Medical School, Boston, MA. email: [email protected];{mlu16,jwang111,dwilliamson,srodig,nlindeman}@bwh.harvard.edu This workwas supported by NIH NIGMS R35GM138216 (to F.M.), Nvidia GPU grantprogram, Google Cloud Research Grant. R.J.C. is funded by the NationalScience Foundation Graduate Fellowship and the NIH NHGRI T32HG002295training program.
Histology-based subjective and qualitative analysis of the tumormicroenvironment coupled with quantitative examination ofgenomic assays is the standard-of-care for most cancers inmodern clinical settings [1]–[4]. As the field of anatomicpathology migrates from glass slides to digitized whole slideimages, there is a critical opportunity for development ofalgorithmic approaches for joint image-omic assays that makeuse of phenotypic and genotypic information in an integrativemanner.
The tumor microenvironment is a complex milieu of cells thatis not limited to only cancer cells, as it also contains immune,stromal, and healthy cells. Though histologic analysis of tissueprovides important spatial and morphological information ofthe tumor microenvironment, the qualitative inspection byhuman pathologists has been shown to suffer from largeinter- and intraobserver variability [5]. Moreover, subjectiveinterpretation of histology slides does not make use of therich phenotypic information that has shown to have prognosticrelevance [6]. Genomic analysis of tissue biopsies can providequantitative information on genomic expression and alterations,but cannot precisely isolate tumor-induced genotypic measuresand changes from those of non-tumor entities such as normalcells. Current modern sequencing technologies such as singlecell sequencing are able to resolve genomic information ofindividual cells in tumor specimens, with spatial transcriptomicsand multiplexed immunofluoresence able to spatially resolvehistology tissue and genomics together [7]–[12]. However, thesetechnologies currently lack clinical penetration.
Oncologists often rely on both the qualitative informationfrom histology and quantitative information from genomic datato predict clinical outcomes [13], however, most histologyanalysis paradigms do not incorporate genomic information.Moreover, such methods often do not explicitly incorporateinformation from the spatial organization and communitystructure of cells, which have known diagnostic and prognosticrelevance [6], [14]–[16]. Fusing morphological informationfrom histology and molecular information from genomicsprovides an exciting possibility to better quantify the tumor mi-croenvironment and harness deep learning for the developmentof image-omic assays for early diagnosis, prognosis, patientstratification, survival, therapeutic response and resistanceprediction.
Contributions: The contributions of this paper are high-lighted as follows:• Novel Multimodal Fusion Strategy: We propose Path-
arX
iv:1
912.
0893
7v3
[cs
.CV
] 3
Sep
202
0
2
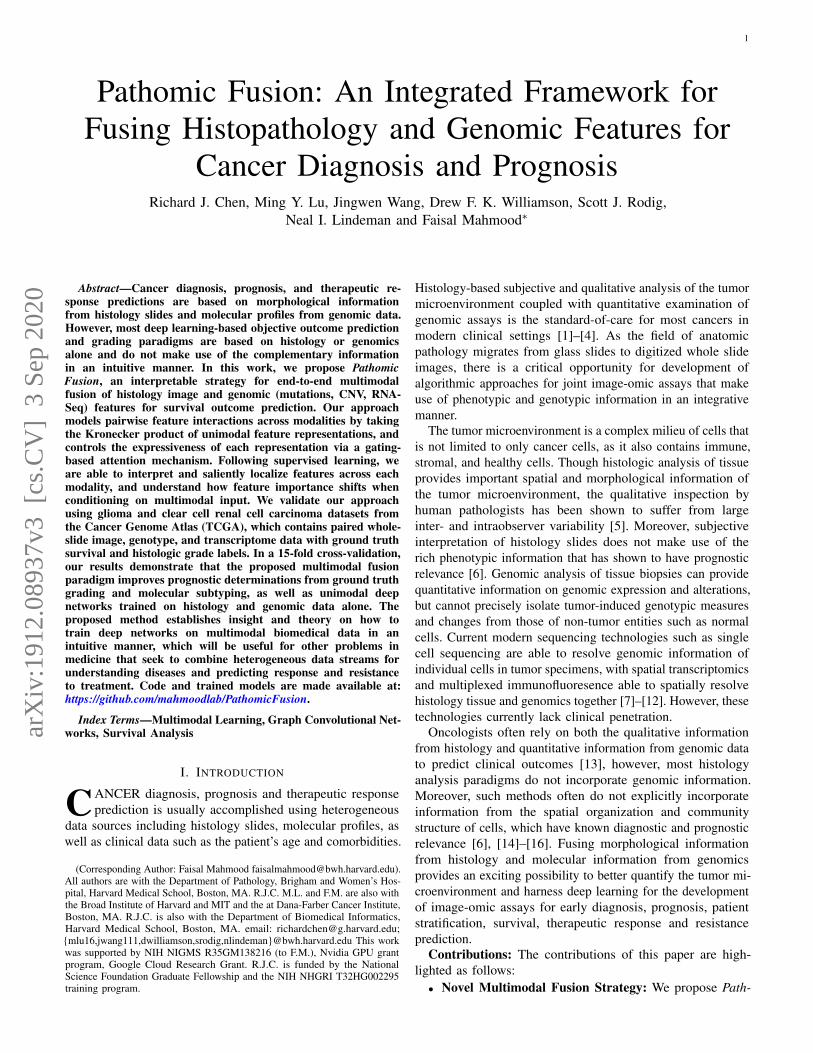
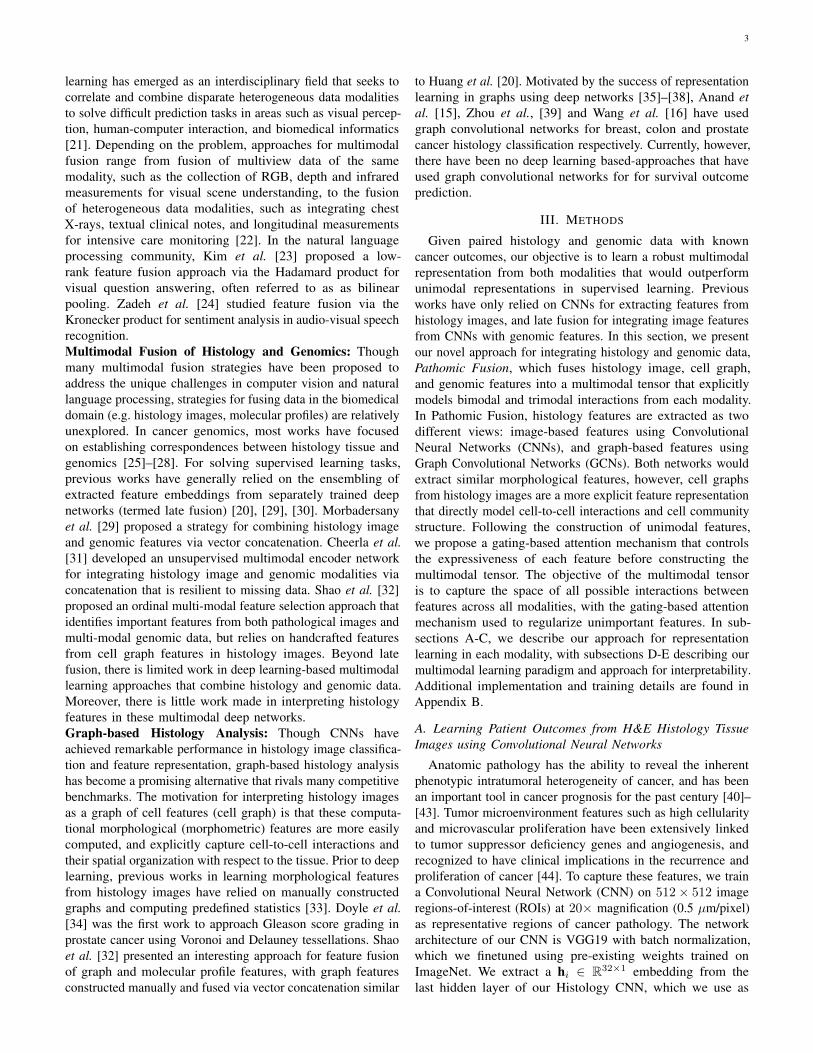
Fig. 1: Pathomic Fusion: An integrated framework for multimodal fusion of histology and genomic features for survival outcomeprediction and classification. Histology features may be extracted using CNNs, parameter efficient GCNs or a combination ofthe two. Unimodal networks for the respective image and genomic features are first trained individually for the correspondingsupervised learning task, and then used as feature extractors for multimodal fusion. Multimodal fusion is performed by applyingan gating-based attention mechanism to first control the expressiveness of each modality, followed by the Kronecker product tomodel pairwise feature interactions across modalities.
omic Fusion, a novel framework for multimodal fusionof histology and genomic features (Fig. 1). Our proposedmethod models pairwise feature interactions across modal-ities by taking the Kronecker product of gated featurerepresentations, and controls the expressiveness of eachrepresentation using a gating-based attention mechanism.
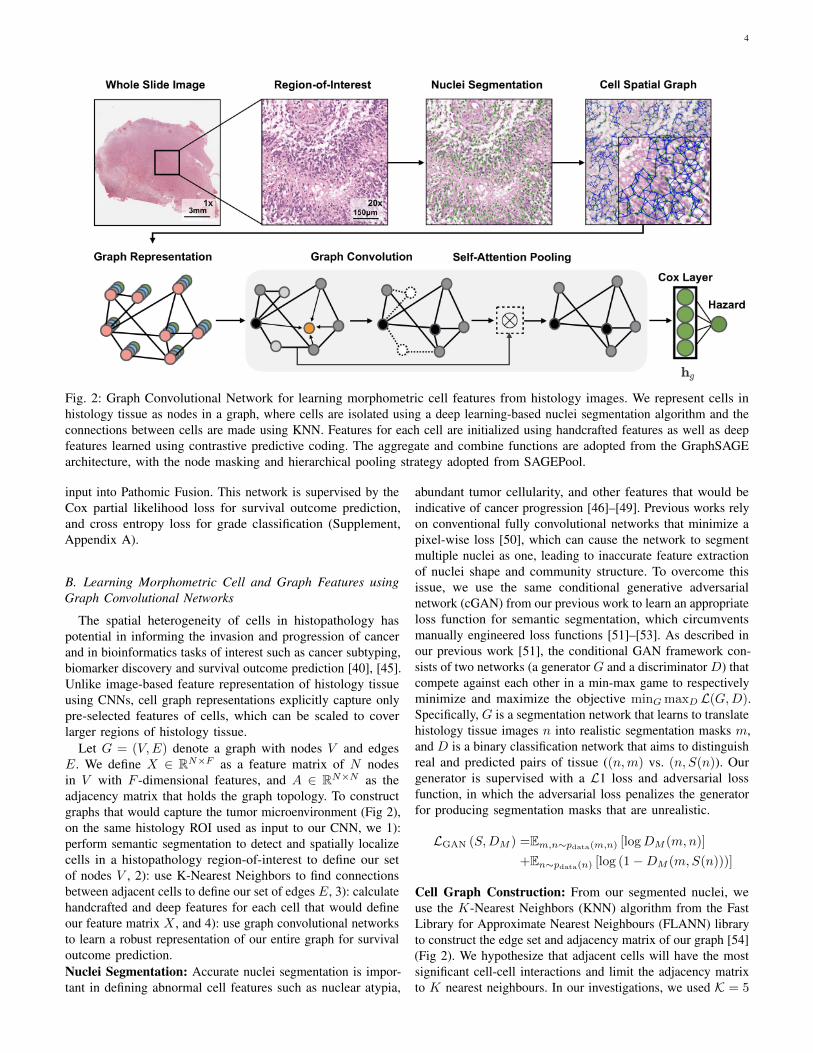
• GCNs for Cancer Outcome Prediction: We presenta novel approach for learning cell graph features inhistopathology tissue using graph convolutional networks(Fig. 2), and present the first application of GCNsfor cancer survival outcome prediction from histology.GCNs act as a complementary method to CNNs formorphological feature extraction, and may be used inileu of or in combination with CNNs during multimodalfusion for fine-grained patient stratification.
• Objective Image-Omic Quantitative Study with Mul-timodal Interpretability: In a rigorous 15-fold cross-validation-based analysis on two different disease models,we demonstrate that our image-omic fusion paradigmoutperforms subjective prognostic determinations thatuse grading and subtyping, as well as previous state-of-the-art results for patient stratification that use deeplearning. To interpret predictions made by our network insurvival analysis, we use both class-activation maps andgradient-based attribution techniques to distill prognosticmorphological and genomic features.
II. RELATED WORK
Survival Analysis for Cancer Outcome Prediction: Cancerprognosis via survival outcome prediction is a standard methodused for biomarker discovery, stratification of patients intodistinct treatment groups, and therapeutic response prediction[17]. With the availability of high-throughput data from next-generation sequencing, statistical survival models have becomeone of the mainstay approaches for performing retrospectivestudies in patient cohorts with known cancer outcomes, withcommon covariates including copy number variation (CNV),mutation status, and RNA sequencing (RNA-Seq) expression[17], [18]. Recent work has incorporated deep learning intosurvival analysis, in which the covariates for a Cox model arelearned using a series of fully connected layers. Yousefi et al.[19] proposed using stacked denoising autoencoders to learna low dimension representation of RNA-Seq data for survivalanalysis, and in a follow-up work [19], they used FeedforwardNetworks to examine the relationship between gene signaturesand survival outcomes. Huang et al. [20] proposed usingweighted gene-expression network analysis as another approachfor dimensionality reduction and learning eigen-features fromRNA-Seq and micro-RNA data for survival analysis in TCGA.However, these approaches do not incorporate the wealthof multimodal information from heterogeneous data sourcesincluding diagnostic slides, which may capture the inherentphenotypic tumor heterogeneity that has known prognosticvalue.Multimodal Deep Learning: Multimodal fusion via deep
3
learning has emerged as an interdisciplinary field that seeks tocorrelate and combine disparate heterogeneous data modalitiesto solve difficult prediction tasks in areas such as visual percep-tion, human-computer interaction, and biomedical informatics[21]. Depending on the problem, approaches for multimodalfusion range from fusion of multiview data of the samemodality, such as the collection of RGB, depth and infraredmeasurements for visual scene understanding, to the fusionof heterogeneous data modalities, such as integrating chestX-rays, textual clinical notes, and longitudinal measurementsfor intensive care monitoring [22]. In the natural languageprocessing community, Kim et al. [23] proposed a low-rank feature fusion approach via the Hadamard product forvisual question answering, often referred to as as bilinearpooling. Zadeh et al. [24] studied feature fusion via theKronecker product for sentiment analysis in audio-visual speechrecognition.Multimodal Fusion of Histology and Genomics: Thoughmany multimodal fusion strategies have been proposed toaddress the unique challenges in computer vision and naturallanguage processing, strategies for fusing data in the biomedicaldomain (e.g. histology images, molecular profiles) are relativelyunexplored. In cancer genomics, most works have focusedon establishing correspondences between histology tissue andgenomics [25]–[28]. For solving supervised learning tasks,previous works have generally relied on the ensembling ofextracted feature embeddings from separately trained deepnetworks (termed late fusion) [20], [29], [30]. Morbadersanyet al. [29] proposed a strategy for combining histology imageand genomic features via vector concatenation. Cheerla et al.[31] developed an unsupervised multimodal encoder networkfor integrating histology image and genomic modalities viaconcatenation that is resilient to missing data. Shao et al. [32]proposed an ordinal multi-modal feature selection approach thatidentifies important features from both pathological images andmulti-modal genomic data, but relies on handcrafted featuresfrom cell graph features in histology images. Beyond latefusion, there is limited work in deep learning-based multimodallearning approaches that combine histology and genomic data.Moreover, there is little work made in interpreting histologyfeatures in these multimodal deep networks.Graph-based Histology Analysis: Though CNNs haveachieved remarkable performance in histology image classifica-tion and feature representation, graph-based histology analysishas become a promising alternative that rivals many competitivebenchmarks. The motivation for interpreting histology imagesas a graph of cell features (cell graph) is that these computa-tional morphological (morphometric) features are more easilycomputed, and explicitly capture cell-to-cell interactions andtheir spatial organization with respect to the tissue. Prior to deeplearning, previous works in learning morphological featuresfrom histology images have relied on manually constructedgraphs and computing predefined statistics [33]. Doyle et al.[34] was the first work to approach Gleason score grading inprostate cancer using Voronoi and Delauney tessellations. Shaoet al. [32] presented an interesting approach for feature fusionof graph and molecular profile features, with graph featuresconstructed manually and fused via vector concatenation similar
to Huang et al. [20]. Motivated by the success of representationlearning in graphs using deep networks [35]–[38], Anand etal. [15], Zhou et al., [39] and Wang et al. [16] have usedgraph convolutional networks for breast, colon and prostatecancer histology classification respectively. Currently, however,there have been no deep learning based-approaches that haveused graph convolutional networks for for survival outcomeprediction.
III. METHODS
Given paired histology and genomic data with knowncancer outcomes, our objective is to learn a robust multimodalrepresentation from both modalities that would outperformunimodal representations in supervised learning. Previousworks have only relied on CNNs for extracting features fromhistology images, and late fusion for integrating image featuresfrom CNNs with genomic features. In this section, we presentour novel approach for integrating histology and genomic data,Pathomic Fusion, which fuses histology image, cell graph,and genomic features into a multimodal tensor that explicitlymodels bimodal and trimodal interactions from each modality.In Pathomic Fusion, histology features are extracted as twodifferent views: image-based features using ConvolutionalNeural Networks (CNNs), and graph-based features usingGraph Convolutional Networks (GCNs). Both networks wouldextract similar morphological features, however, cell graphsfrom histology images are a more explicit feature representationthat directly model cell-to-cell interactions and cell communitystructure. Following the construction of unimodal features,we propose a gating-based attention mechanism that controlsthe expressiveness of each feature before constructing themultimodal tensor. The objective of the multimodal tensoris to capture the space of all possible interactions betweenfeatures across all modalities, with the gating-based attentionmechanism used to regularize unimportant features. In sub-sections A-C, we describe our approach for representationlearning in each modality, with subsections D-E describing ourmultimodal learning paradigm and approach for interpretability.Additional implementation and training details are found inAppendix B.
A. Learning Patient Outcomes from H&E Histology TissueImages using Convolutional Neural Networks
Anatomic pathology has the ability to reveal the inherentphenotypic intratumoral heterogeneity of cancer, and has beenan important tool in cancer prognosis for the past century [40]–[43]. Tumor microenvironment features such as high cellularityand microvascular proliferation have been extensively linkedto tumor suppressor deficiency genes and angiogenesis, andrecognized to have clinical implications in the recurrence andproliferation of cancer [44]. To capture these features, we traina Convolutional Neural Network (CNN) on 512× 512 imageregions-of-interest (ROIs) at 20× magnification (0.5 µm/pixel)as representative regions of cancer pathology. The networkarchitecture of our CNN is VGG19 with batch normalization,which we finetuned using pre-existing weights trained onImageNet. We extract a hi ∈ R32×1 embedding from thelast hidden layer of our Histology CNN, which we use as
4
Fig. 2: Graph Convolutional Network for learning morphometric cell features from histology images. We represent cells inhistology tissue as nodes in a graph, where cells are isolated using a deep learning-based nuclei segmentation algorithm and theconnections between cells are made using KNN. Features for each cell are initialized using handcrafted features as well as deepfeatures learned using contrastive predictive coding. The aggregate and combine functions are adopted from the GraphSAGEarchitecture, with the node masking and hierarchical pooling strategy adopted from SAGEPool.
input into Pathomic Fusion. This network is supervised by theCox partial likelihood loss for survival outcome prediction,and cross entropy loss for grade classification (Supplement,Appendix A).
B. Learning Morphometric Cell and Graph Features usingGraph Convolutional Networks
The spatial heterogeneity of cells in histopathology haspotential in informing the invasion and progression of cancerand in bioinformatics tasks of interest such as cancer subtyping,biomarker discovery and survival outcome prediction [40], [45].Unlike image-based feature representation of histology tissueusing CNNs, cell graph representations explicitly capture onlypre-selected features of cells, which can be scaled to coverlarger regions of histology tissue.
Let G = (V,E) denote a graph with nodes V and edgesE. We define X ∈ RN×F as a feature matrix of N nodesin V with F -dimensional features, and A ∈ RN×N as theadjacency matrix that holds the graph topology. To constructgraphs that would capture the tumor microenvironment (Fig 2),on the same histology ROI used as input to our CNN, we 1):perform semantic segmentation to detect and spatially localizecells in a histopathology region-of-interest to define our setof nodes V , 2): use K-Nearest Neighbors to find connectionsbetween adjacent cells to define our set of edges E, 3): calculatehandcrafted and deep features for each cell that would defineour feature matrix X , and 4): use graph convolutional networksto learn a robust representation of our entire graph for survivaloutcome prediction.Nuclei Segmentation: Accurate nuclei segmentation is impor-tant in defining abnormal cell features such as nuclear atypia,
abundant tumor cellularity, and other features that would beindicative of cancer progression [46]–[49]. Previous works relyon conventional fully convolutional networks that minimize apixel-wise loss [50], which can cause the network to segmentmultiple nuclei as one, leading to inaccurate feature extractionof nuclei shape and community structure. To overcome thisissue, we use the same conditional generative adversarialnetwork (cGAN) from our previous work to learn an appropriateloss function for semantic segmentation, which circumventsmanually engineered loss functions [51]–[53]. As described inour previous work [51], the conditional GAN framework con-sists of two networks (a generator G and a discriminator D) thatcompete against each other in a min-max game to respectivelyminimize and maximize the objective minGmaxD L(G,D).Specifically, G is a segmentation network that learns to translatehistology tissue images n into realistic segmentation masks m,and D is a binary classification network that aims to distinguishreal and predicted pairs of tissue ((n,m) vs. (n, S(n)). Ourgenerator is supervised with a L1 loss and adversarial lossfunction, in which the adversarial loss penalizes the generatorfor producing segmentation masks that are unrealistic.
LGAN (S,DM ) =Em,n∼pdata(m,n) [logDM (m,n)]
+En∼pdata(n) [log (1−DM (m,S(n)))]
Cell Graph Construction: From our segmented nuclei, weuse the K-Nearest Neighbors (KNN) algorithm from the FastLibrary for Approximate Nearest Neighbours (FLANN) libraryto construct the edge set and adjacency matrix of our graph [54](Fig 2). We hypothesize that adjacent cells will have the mostsignificant cell-cell interactions and limit the adjacency matrixto K nearest neighbours. In our investigations, we used K = 5
5
to detect community structure and model cellular interactions.Using KNN, our adjacency matrix A is defined as:
Aij
{1 if j ∈ KNN(i) and D(i, j) < d0 otherwise
Manual Cell Feature Extraction: For each cell, we com-puted eight contour features (major axis length, minor axislength, angular orientation, eccentricity, roundness, area, andsolidity), as well as four texture features from gray-levelco-occurence matrices (GLCM) (dissimilarity, homogeneity,angular second moment, and energy). Contours were obtainedfrom segmentation results in nuclei segmentation, and GLCMswere calculated from 64× 64 image crops centered over eachcontour centroid. These twelve features were selected forinclusion in our feature matrix X , as they would describeabnormal morphological features about glioma cells such asatypia, nuclear pleomorphism, and hyperchromatism.Unsupervised Cell Feature Extraction using ContrastivePredictive Coding: Besides manually computed statistics, wealso used an unsupervised technique known as contrastivepredictive coding (CPC) [55]–[57] to extract 1024-dimensionalfeatures from tissue regions of size 64 × 64 centered aroundeach cell in a spatial graph. Given a high-dimensional datasequence {xt} (256 × 256 image crop from the histologyROI), CPC is designed to capture high-level representationsshared among different portions (64 × 64 image patches) ofthe complete signal. The encoder network genc transformseach data observation xi into a low-dimensional representationzi and learns via a contrastive loss whose optimization leadsto maximizing the mutual information between the availablecontext ct, computed from a known portion of the encodedsequence {zi}, i ≤ t and future observations zt+k, k > 0. Byminimizing the CPC objective, we are able to learn rich featurerepresentations shared among various tissue regions that arespecific to the cells in the underlying tissue site. Examplesinclude the morphology and distinct arrangement of differentcell types, inter-cellular interactions, and the microvascularpatterns surrounding each cell. To create CPC features foreach cell, we encode 64× 64 image patches centered over thecentroid of each cell. These features are concatenated with ourhandcrafted features during cell graph construction.Graph Convolutional Network: Similar to CNNs, GCNslearn abstracts feature representations for each feature in anode via message passing, in which nodes iteratively aggregatefeature vectors from their neighborhood to compute a newfeature vector at the next hidden layer in the network [38].The representation of an entire graph can be obtained throughpooling over all the nodes, which can then be used as input fortasks such as classification or survival outcome prediction. Suchconvolution and pooling operations can defined as follows:
a(k)v = AGGREGATE(k)({h(k−1)u : u ∈ N (v)
})h(k)v = COMBINE(k)
(h(k−1)v , a(k)v
)where h(k)v is the feature vector of node v at the k − 1-th
iteration of the neighborhood aggregation, a(k)v is the featurevector of node v at the next iteration, and AGGREGATE andCOMBINE are functions for combining feature vectors between
hidden layers. As defined in Hamilton et al., we adopt theAGGREGATE and COMBINE definitions from GraphSAGE[35], which for a given node, represents the next node hiddenlayer as the concatenation of the current hidden layer with theneighborhood features:
a(k)v = MAX({
ReLU(W · h(k−1)u
),∀u ∈ N (v)
})h(k)v =W ·
[h(k−1)v , a(k)v
]Unlike other graph-structured data, cell graphs exhibit a
hierarchical topology, in which the degree of eccentricity andclustered components of nodes in a graph define multiple viewsof how cells are organized in the tumor micro-environment:from fine-grained views such as local cell-to-cell interactions, tocoarser-grained views such as structural regions of cell invasionand metastasis. In order to encode the hierarchical structureof cell graphs, we adopt the self-attention pooling strategySAGPOOL presented in Lee et al. [36], which is a hierarchicalpooling method that performs local pooling operations of nodeembeddings in a graph. In attention pooling, the contributionof each node embedding in the pooling receptive field to thenext network layer is adaptively learned using an attentionmechanism. The attention score Z ∈ RN×1 for nodes in Gcan be calculated as such:
Z = σ(SAGEConv
(X,A+A2
))where X are the node features, A is the adjacency matrix,
and SAGEConv is the convolution operator from GraphSAGE.To also aggregate information from multiple scales in thenuclei graph topology, we also adopt the hierarchical poolingstrategy in Lee et al. [36]. Since we are constructing cellgraphs on the entire image, no patch averaging of predictedhazards needs to be performed. At the last hidden layer ofour Graph Convolutional SNN, we pool the node features intoa hg ∈ R32×1 feature vector, which we use as an input toPathomic Fusion.
C. Predicting Patient Outcomes from Molecular Profiles usingSelf-Normalizing Networks
Advances in next-generation sequencing data have allowedfor the profiling of transcript abundance (RNA-Seq), copynumber variation (CNV), mutation status, and other molecularcharacterizations at the gene level, and have been frequentlyused to study survival outcomes in cancer. For example,isocitrate dehydrogenase 1 (IDH1) is a gene that is importantfor cellular metabolism, epigenetic regulation and DNA repair,with its mutation associated with prolonged patient survivalin cancers such as glioma. Other genes include EGFR, VEGFand MGMT, which are implicated in angiogenesis, which isthe process of blood vessel formulation that also allows cancerto proliferate to other areas of tissue.
For learning scenarios that have hundreds to thousands offeatures with relatively few training samples, Feedforwardnetworks are prone to overfitting. Compared to other kinds ofneural network architectures such as CNNs, weights in Feed-forward networks are shared and thus more sensitive traininginstabilities from perturbation and regularization techniques
6
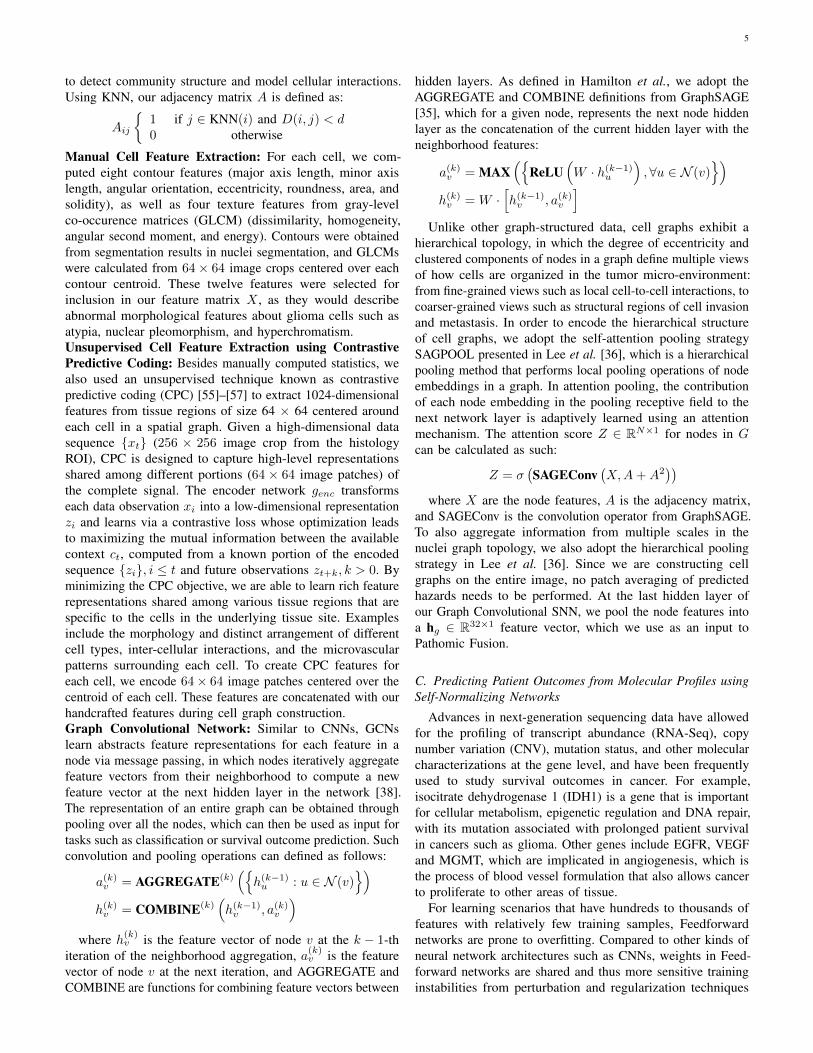
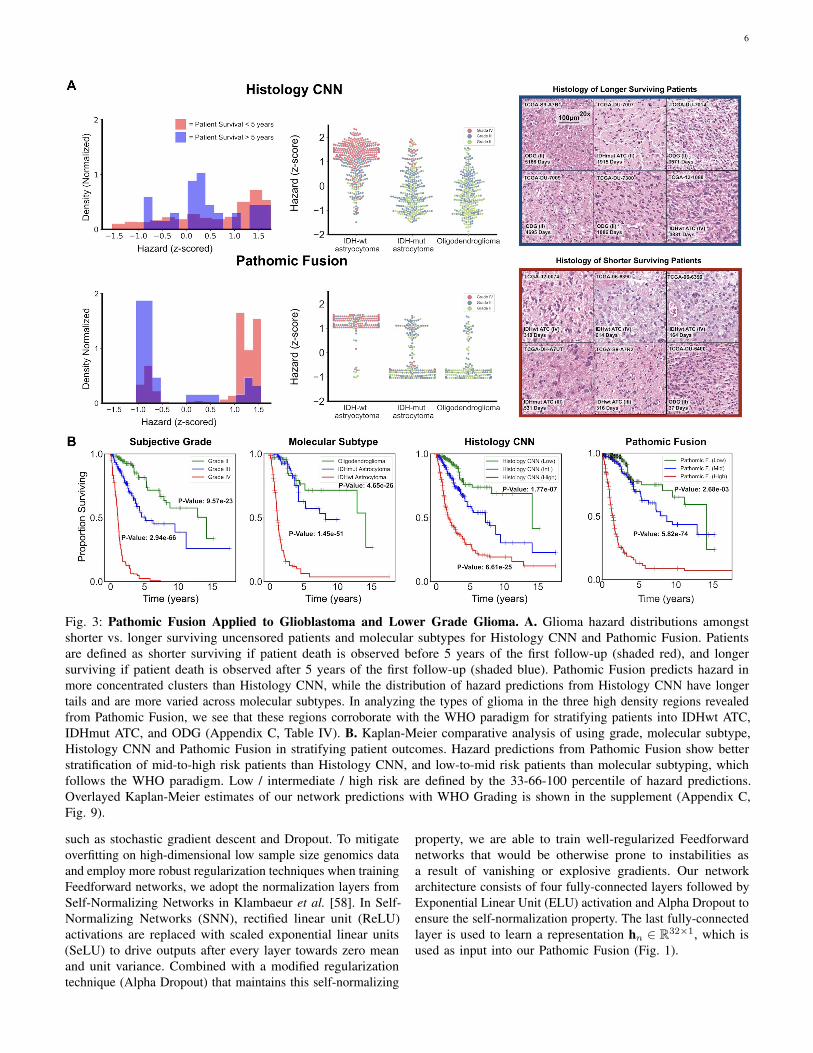
Fig. 3: Pathomic Fusion Applied to Glioblastoma and Lower Grade Glioma. A. Glioma hazard distributions amongstshorter vs. longer surviving uncensored patients and molecular subtypes for Histology CNN and Pathomic Fusion. Patientsare defined as shorter surviving if patient death is observed before 5 years of the first follow-up (shaded red), and longersurviving if patient death is observed after 5 years of the first follow-up (shaded blue). Pathomic Fusion predicts hazard inmore concentrated clusters than Histology CNN, while the distribution of hazard predictions from Histology CNN have longertails and are more varied across molecular subtypes. In analyzing the types of glioma in the three high density regions revealedfrom Pathomic Fusion, we see that these regions corroborate with the WHO paradigm for stratifying patients into IDHwt ATC,IDHmut ATC, and ODG (Appendix C, Table IV). B. Kaplan-Meier comparative analysis of using grade, molecular subtype,Histology CNN and Pathomic Fusion in stratifying patient outcomes. Hazard predictions from Pathomic Fusion show betterstratification of mid-to-high risk patients than Histology CNN, and low-to-mid risk patients than molecular subtyping, whichfollows the WHO paradigm. Low / intermediate / high risk are defined by the 33-66-100 percentile of hazard predictions.Overlayed Kaplan-Meier estimates of our network predictions with WHO Grading is shown in the supplement (Appendix C,Fig. 9).
such as stochastic gradient descent and Dropout. To mitigateoverfitting on high-dimensional low sample size genomics dataand employ more robust regularization techniques when trainingFeedforward networks, we adopt the normalization layers fromSelf-Normalizing Networks in Klambaeur et al. [58]. In Self-Normalizing Networks (SNN), rectified linear unit (ReLU)activations are replaced with scaled exponential linear units(SeLU) to drive outputs after every layer towards zero meanand unit variance. Combined with a modified regularizationtechnique (Alpha Dropout) that maintains this self-normalizing
property, we are able to train well-regularized Feedforwardnetworks that would be otherwise prone to instabilities asa result of vanishing or explosive gradients. Our networkarchitecture consists of four fully-connected layers followed byExponential Linear Unit (ELU) activation and Alpha Dropout toensure the self-normalization property. The last fully-connectedlayer is used to learn a representation hn ∈ R32×1, which isused as input into our Pathomic Fusion (Fig. 1).
7
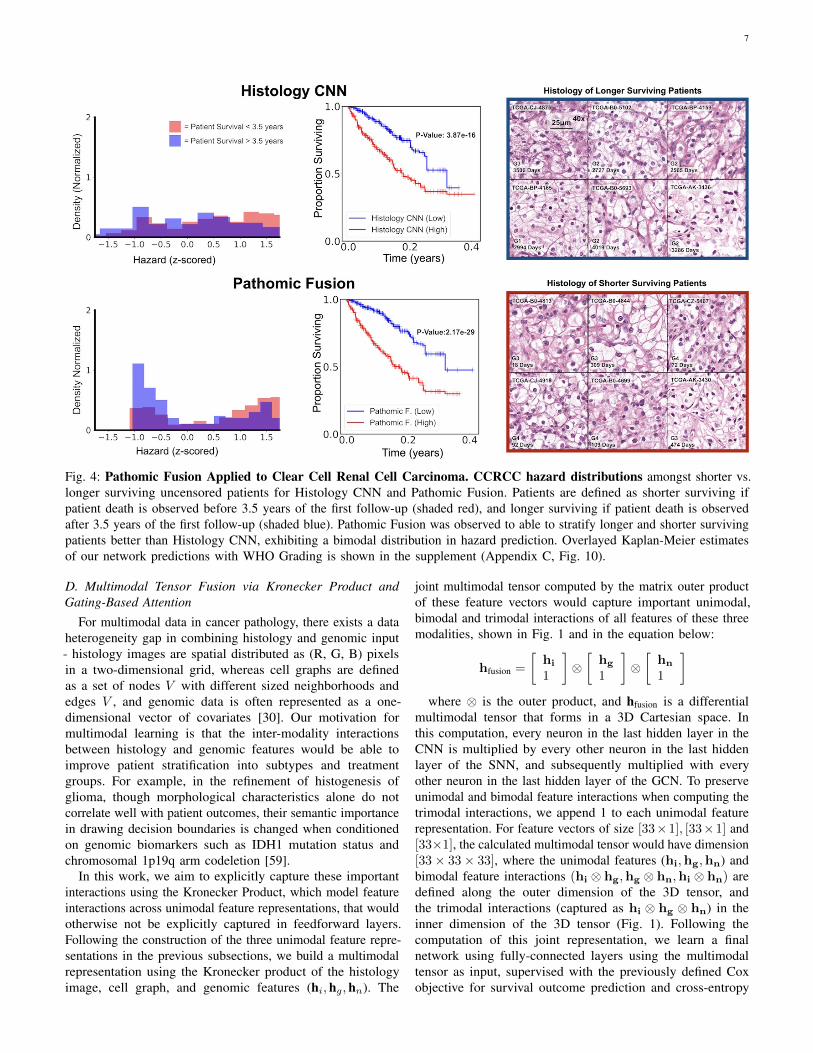
Fig. 4: Pathomic Fusion Applied to Clear Cell Renal Cell Carcinoma. CCRCC hazard distributions amongst shorter vs.longer surviving uncensored patients for Histology CNN and Pathomic Fusion. Patients are defined as shorter surviving ifpatient death is observed before 3.5 years of the first follow-up (shaded red), and longer surviving if patient death is observedafter 3.5 years of the first follow-up (shaded blue). Pathomic Fusion was observed to able to stratify longer and shorter survivingpatients better than Histology CNN, exhibiting a bimodal distribution in hazard prediction. Overlayed Kaplan-Meier estimatesof our network predictions with WHO Grading is shown in the supplement (Appendix C, Fig. 10).
D. Multimodal Tensor Fusion via Kronecker Product andGating-Based Attention
For multimodal data in cancer pathology, there exists a dataheterogeneity gap in combining histology and genomic input- histology images are spatial distributed as (R, G, B) pixelsin a two-dimensional grid, whereas cell graphs are definedas a set of nodes V with different sized neighborhoods andedges V , and genomic data is often represented as a one-dimensional vector of covariates [30]. Our motivation formultimodal learning is that the inter-modality interactionsbetween histology and genomic features would be able toimprove patient stratification into subtypes and treatmentgroups. For example, in the refinement of histogenesis ofglioma, though morphological characteristics alone do notcorrelate well with patient outcomes, their semantic importancein drawing decision boundaries is changed when conditionedon genomic biomarkers such as IDH1 mutation status andchromosomal 1p19q arm codeletion [59].
In this work, we aim to explicitly capture these importantinteractions using the Kronecker Product, which model featureinteractions across unimodal feature representations, that wouldotherwise not be explicitly captured in feedforward layers.Following the construction of the three unimodal feature repre-sentations in the previous subsections, we build a multimodalrepresentation using the Kronecker product of the histologyimage, cell graph, and genomic features (hi,hg,hn). The
joint multimodal tensor computed by the matrix outer productof these feature vectors would capture important unimodal,bimodal and trimodal interactions of all features of these threemodalities, shown in Fig. 1 and in the equation below:
hfusion =
[hi
1
]⊗[
hg
1
]⊗[
hn
1
]where ⊗ is the outer product, and hfusion is a differential
multimodal tensor that forms in a 3D Cartesian space. Inthis computation, every neuron in the last hidden layer in theCNN is multiplied by every other neuron in the last hiddenlayer of the SNN, and subsequently multiplied with everyother neuron in the last hidden layer of the GCN. To preserveunimodal and bimodal feature interactions when computing thetrimodal interactions, we append 1 to each unimodal featurerepresentation. For feature vectors of size [33×1], [33×1] and[33×1], the calculated multimodal tensor would have dimension[33× 33× 33], where the unimodal features (hi,hg,hn) andbimodal feature interactions (hi ⊗ hg,hg ⊗ hn,hi ⊗ hn) aredefined along the outer dimension of the 3D tensor, andthe trimodal interactions (captured as hi ⊗ hg ⊗ hn) in theinner dimension of the 3D tensor (Fig. 1). Following thecomputation of this joint representation, we learn a finalnetwork using fully-connected layers using the multimodaltensor as input, supervised with the previously defined Coxobjective for survival outcome prediction and cross-entropy
8
loss for grade classification. Ultimately, the value of PathomicFusion is fusing heterogeneous modalities that have disparatestructural dependencies. Our multimodal network is initializedwith pretrained weights from the unimodal networks, followedby end-to-end fine-tuning of the Histology GCN and GenomicSNN.
To decrease the impact of noisy unimodal features duringmultimodal training, before the Kronecker Product, we em-ployed a gating-based attention mechanism that controls theexpressiveness of features of each modality [60]. In fusinghistology image, cell graph, and genomic features, some ofthe captured features may have high collinearity, in whichemploying a gating mechanism can reduce the size of thefeature space before computing the Kronecker Product. Fora modality m with a unimodal feature representation hm, welearn a linear transformation Wign→m of modalities hi,hg,hnthat would score the relative importance of each feature in m,denoted as zm in the equation below.
hm,gated = zm ∗ hm,∀m ∈ {i, g, n}where, hm = ReLU(Wm · hm)
zm = σ(Wign→m · [hi,hg,hn])zm can be interpreted as an attention weight vector, in
which modalities i, g, n attend over each feature in modalitym. Wm and Wign→m are weight matrix parameters we learnfor feature gating. After taking the softmax probability, wetake the element-wise product of features hm and scores zmto calculate the gated representation.
E. Multimodal Interpretability
To interpret our network, we modified both Grad-CAM andIntegrated Gradients for visualizing image saliency featureimportance across multiple types of input. Grad-CAM is agradient-based localization technique used to produce visualexplanations in image classification, in which neurons whosegradients have positive influence on a class of interest are usedto produce a coarse heatmap [61]. Since the last layer of ournetwork is a single neuron for outputting hazard, we modifiedthe target to perform back-propagation on the single neuron. Asa result, the visual explanations from our network correspondwith image regions used in predicting hazard (values rangingfrom [-3,3]). For Histology GCN and Genomic SNN, we usedIntegrated Gradients (IG), a gradient-based feature attributionmethod that attributes the prediction of deep networks to theirinputs [62]. Similar to previous attribution-based methods suchas Layer-wise Relevance Propagation [63], IG calculates thegradients of the input tensor x across different scales againsta baseline xi (zero-scaled), and then uses the Gauss-Legendrequadrature to approximate the integral of gradients.
IGi(x) ::= (xi − x′i)×∫ 1
α=0
∂F (x′ + α× (x− x′))∂xi
dα
To adapt IG to graph-based structures, we treat the nodes inour graph input as the batch dimension, and scale each nodein the graph by the number of integral approximation steps.With multimodal inputs, we can approximate the integral ofgradients for each data modality.
IV. EXPERIMENTAL SETUP
A. Data Description
To validate our proposed multimodal paradigm for integratinghistology and genomic features, we collected glioma andclear cell renal cell carcinoma data from the TCGA, a cancerdata consortium that contains paired high-throughput genomeanalysis and diagnostic whole slide images with ground-truthsurvival outcome and histologic grade labels. For astrocytomasand glioblastomas in the merged TCGA-GBM and TCGA-LGG(TCGA-GBMLGG) project, we used 1024× 1024 region-of-interests (ROIs) from diagnostic slides curated by [29], andused sparse stain normalization [64] to match all images toa standard H&E histology image. Multiple region-of-interests(ROIs) from diagnostic slides were obtained for some patients,creating a total of 1505 images for 769 patients. 320 genomicfeatures from CNV (79), mutation status (1), and bulk RNA-Seq expression from the top 240 differentially expressed genes(240) were curated from the TCGA and the cBioPortal [65]for each patient. For clear cell renal cell carcinoma in theTCGA-KIRC project we used manually extracted 512× 512ROIs from diagnostic whole slide images. For 417 patientsin CCRCC, we collected 3 512× 512 40x ROIs per patient,yielding 1251 images total that were similarly normalized withstain normalization. We paired these images with 357 genomicfeatures from CNV of genes with alteration frequency greaterthan 7% (117) and RNA-Seq from the top 240 differentiallyexpressed genes (240). It should be noted that for TCGA-GBMLGG had approximately 40% of the patients had missingRNA-Seq expression. Details regarding genomic features anddata alignment of histology and genomics data are found inthe implementation details (Appendix B). Our experimentalsetup is also described in the reproducibility section of ourGitHub repository.
B. Quantitative Study
TCGA-GBMLGG: Gliomas are a form of brain and spinalcord tumors defined by both hallmark histopathological andgenomic heterogeneity in the tumor microenvironment, as wellas response-to-treatment heterogeneity in patient outcomes. Thecurrent World Health Organization (WHO) Paradigm for gliomaclassification stratifies diffuse gliomas based on morphologicaland molecular characteristics: glial cell type (astrocytoma,oligodendroglioma), IDH1 gene mutation status and 1p19qchromosome codeletion status [59]. WHO Grading is madeby the manual interpretation of histology using pathologicaldeterminants for malignancy (WHO Grades II, III, and IV).These characteristics form three categories of gliomas whichhave been extensively correlated with survival: 1) IDH-wildtypeastrocytomas (IDHwt ATC), 2) IDH-mutant astrocytomas(IDHmut ATC), and 3) IDH-mutant and 1p/19q-codeletedoligodendrogliomas (ODG). IDHwt ATCs (predominantlyWHO grades III and IV) have been shown to have the worstpatient survival outcomes, while IDHmut ATCs (mixture ofWHO Grades II, III, and IV) and ODGs (predominantly WHOGrades II and III) have more favorable outcomes (listed inincreasing order) [59]. As a baseline against standard statisticalapproaches / WHO paradigm for survival outcome prediction,

9
Fig. 5: Multimodal interpretability by Pathomic Fusion in glioma. A. Local explanation of histology image, cell graph, andgenomic modalities for individual patients of three molecular subtypes. In IDHwt ATC, the network detects endothelial cells ofthe microvascular proliferation in the histology image, while the cell graph localizes glial cells between the microvasculature.In IDHmut ATC, we observe similar localization of tumor cellularity in both the histology image and cell graph, however,attribution direction for IDH is flipped to have positive impact on survival. In ODG, we observe both modalities localizingtowards different regions containing "fried egg cells" that are canonical in ODG. For each of these patients, local explanationreveals the most important genomic features used for prediction. B. Global explanation of top 20 genomic features for eachmolecular subtype in glioma. Canonical oncogenes in glioma such as IDH, PTEN, MYC and CDKN2A are attributed highly asbeing important for risk prediction.
we trained Cox Proportion Hazard Models using age, gender,molecular subtypes and grade as covariates.
In our experimentation, we conducted an ablation studycomparing model configurations and fusion strategies in a15-fold cross validation on two supervised learning tasks forglioma: 1) survival outcome prediction, and 2) cancer gradeclassification. For each task, we trained six different modelconfigurations from the combination of available modalities inthe dataset. First, we trained three different unimodal networks:1) a CNN for in histology image input (Histology CNN), 2)
a GCN for cell graph input (Histology GCN), and 3) a SNNfor genomic features input (Genomic SNN). For cancer gradeclassification, we did not use mRNA-Seq expression due tomissing data, lack of paired training examples, and becausegrade is solely determined from histopathologic appearance.After training the unimodal networks, we trained three dif-ferent configurations of Pathomic Fusion: 1) GCN⊗SNN, 2)CNN⊗SNN, 3) GCN⊗CNN⊗SNN. To test for ensembling,we train multimodal networks that fused histology data withhistology data, and genomic features with genomic features.
10
We compare our fusion approach to internal benchmarks andthe previous state-of-the-art [29] approach for survival outcomeprediction in glioma, which concatenates histology ROIs withIDH1 and 1p19q genomic features. To compare with theirresults, we used their identical train-test split, which was createdusing a 15-fold Monte Carlo cross-validation [29].TCGA-KIRC: Clear cell renal cell carcinoma (CCRCC) is themost common type of renal cell carcinoma, originating fromcells in the proximal convoluted tubules. Histopathologically,CCRCC is characterized by diverse cystic grown patterns ofcells with clear or eosinophilic cytoplasm, and a network ofthin-walled "chicken wire" vasculature [66], [67]. Genetically,it is characterized by a chromosome 3p arm loss and mutationstatus of the von Hippel-Lindau (VHL) gene, which leads tolead to stabilization of hypoxia inducible factors that lead to ma-lignancy [68]. Though CCRCC is well-characterized, methodsfor staging CCRCC suffer from large intra-observer variabilityin visual histopathological examination. The Fuhrman GradingSystem for CCRCC is a nuclear grade that ranges from G1(round or nuform nuclei with absent nucleoli) to G4 (irregularand multilobular nuclei with prominent nucleoli). At the time ofthe study, the TCGA-KIRC project used the Fuhrman GradingSystem to grade CCRCC in severity from G1 to G4, however,the grading system has received scrutiny in having poor overallagreement amongst pathologists on external cohorts [66]. Asa baseline against standard statistical approaches, we trainedCox Proportion Hazard Models using age, gender, and gradeas covariates.
Similar to the ablation study conducted with glioma, wecompared model configurations and fusion strategies in a 15-fold cross validation on CCRCC, and tested for ensemblingeffects. In demonstrating the effectiveness of Pathomic Fusionin stratifying CCRCC, we use the Fuhrman Grade as acomparative baseline in survival analysis, however, we donot perform ablation experiments on grade classification. SinceCCRCC does not have multiple molecular subtypes, subtypingwas also not performed, however, we perform analyses onCCRCC patient cohorts with different survival durations(shorter surviving and longer surviving patients).Evaluation: We evaluate our method with standard quantitativeand statistical metrics for survival outcome prediction and gradeclassification. For survival analysis, we evaluate all modelsusing the Concordance Index (c-Index), which is defined as thefraction of all pairs of samples whose predicted survival timesare correctly ordered among all uncensored samples (TableI, II). On glioma and CCRCC respectively, we separate thepredicted hazards into 33-66-100 and 25-50-75-100 percentilesas digital grades, which we compared with molecular subtypingand grading. For significance testing of patient stratification,we use the Log Rank Test to measure if the difference oftwo survival curves is statistically significance [69]. Kaplan-Meir estimates and predicted hazard distribution were usedto visualize how models were stratifying patients. For gradeclassification, we evaluate our networks using Area Underthe Curve (AUC), Average Precision (AP), F1-Score (micro-averaged across all classes), F1-Score (WHO Grade IV classonly), and show ROC curves (Appendix C, Fig. 7). In total,we trained 480 models total in our ablation experiments using
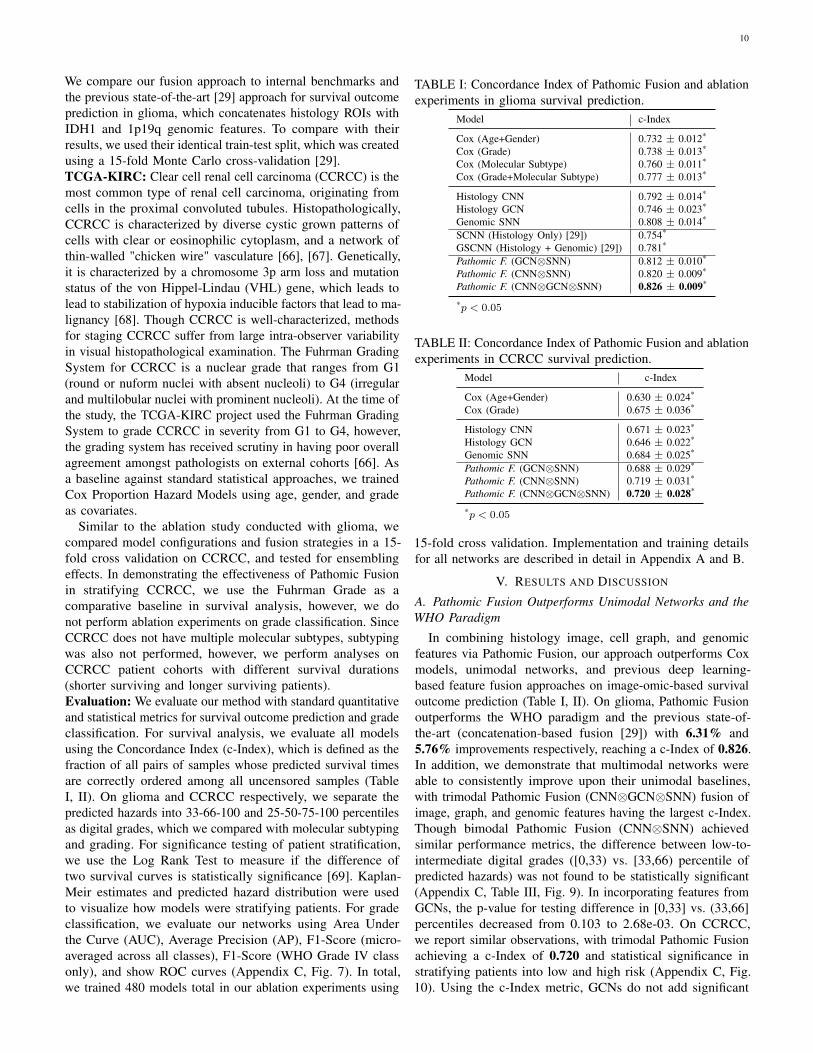
TABLE I: Concordance Index of Pathomic Fusion and ablationexperiments in glioma survival prediction.
Model c-Index
Cox (Age+Gender) 0.732 ± 0.012*
Cox (Grade) 0.738 ± 0.013*
Cox (Molecular Subtype) 0.760 ± 0.011*
Cox (Grade+Molecular Subtype) 0.777 ± 0.013*
Histology CNN 0.792 ± 0.014*
Histology GCN 0.746 ± 0.023*
Genomic SNN 0.808 ± 0.014*
SCNN (Histology Only) [29]) 0.754*
GSCNN (Histology + Genomic) [29]) 0.781*
Pathomic F. (GCN⊗SNN) 0.812 ± 0.010*
Pathomic F. (CNN⊗SNN) 0.820 ± 0.009*
Pathomic F. (CNN⊗GCN⊗SNN) 0.826 ± 0.009*
*p < 0.05
TABLE II: Concordance Index of Pathomic Fusion and ablationexperiments in CCRCC survival prediction.
Model c-Index
Cox (Age+Gender) 0.630 ± 0.024*
Cox (Grade) 0.675 ± 0.036*
Histology CNN 0.671 ± 0.023*
Histology GCN 0.646 ± 0.022*
Genomic SNN 0.684 ± 0.025*
Pathomic F. (GCN⊗SNN) 0.688 ± 0.029*
Pathomic F. (CNN⊗SNN) 0.719 ± 0.031*
Pathomic F. (CNN⊗GCN⊗SNN) 0.720 ± 0.028*
*p < 0.05
15-fold cross validation. Implementation and training detailsfor all networks are described in detail in Appendix A and B.
V. RESULTS AND DISCUSSION
A. Pathomic Fusion Outperforms Unimodal Networks and theWHO Paradigm
In combining histology image, cell graph, and genomicfeatures via Pathomic Fusion, our approach outperforms Coxmodels, unimodal networks, and previous deep learning-based feature fusion approaches on image-omic-based survivaloutcome prediction (Table I, II). On glioma, Pathomic Fusionoutperforms the WHO paradigm and the previous state-of-the-art (concatenation-based fusion [29]) with 6.31% and5.76% improvements respectively, reaching a c-Index of 0.826.In addition, we demonstrate that multimodal networks wereable to consistently improve upon their unimodal baselines,with trimodal Pathomic Fusion (CNN⊗GCN⊗SNN) fusion ofimage, graph, and genomic features having the largest c-Index.Though bimodal Pathomic Fusion (CNN⊗SNN) achievedsimilar performance metrics, the difference between low-to-intermediate digital grades ([0,33) vs. [33,66) percentile ofpredicted hazards) was not found to be statistically significant(Appendix C, Table III, Fig. 9). In incorporating features fromGCNs, the p-value for testing difference in [0,33] vs. (33,66]percentiles decreased from 0.103 to 2.68e-03. On CCRCC,we report similar observations, with trimodal Pathomic Fusionachieving a c-Index of 0.720 and statistical significance instratifying patients into low and high risk (Appendix C, Fig.10). Using the c-Index metric, GCNs do not add significant
11
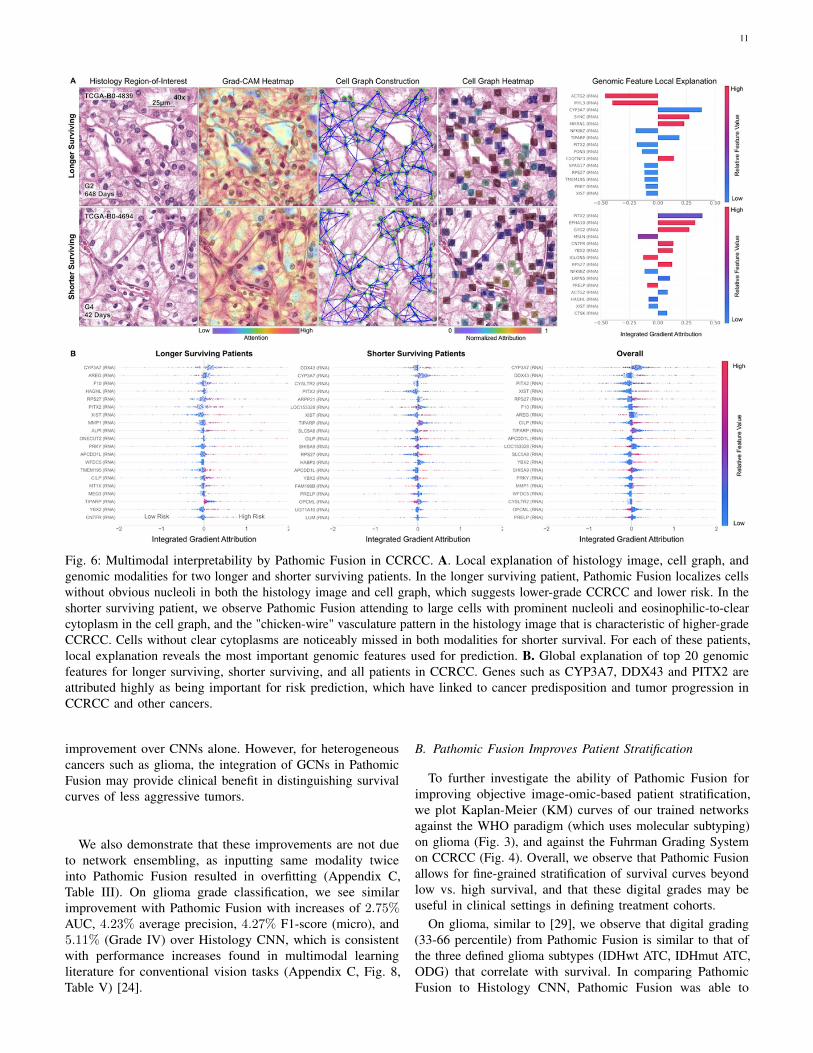
Fig. 6: Multimodal interpretability by Pathomic Fusion in CCRCC. A. Local explanation of histology image, cell graph, andgenomic modalities for two longer and shorter surviving patients. In the longer surviving patient, Pathomic Fusion localizes cellswithout obvious nucleoli in both the histology image and cell graph, which suggests lower-grade CCRCC and lower risk. In theshorter surviving patient, we observe Pathomic Fusion attending to large cells with prominent nucleoli and eosinophilic-to-clearcytoplasm in the cell graph, and the "chicken-wire" vasculature pattern in the histology image that is characteristic of higher-gradeCCRCC. Cells without clear cytoplasms are noticeably missed in both modalities for shorter survival. For each of these patients,local explanation reveals the most important genomic features used for prediction. B. Global explanation of top 20 genomicfeatures for longer surviving, shorter surviving, and all patients in CCRCC. Genes such as CYP3A7, DDX43 and PITX2 areattributed highly as being important for risk prediction, which have linked to cancer predisposition and tumor progression inCCRCC and other cancers.
improvement over CNNs alone. However, for heterogeneouscancers such as glioma, the integration of GCNs in PathomicFusion may provide clinical benefit in distinguishing survivalcurves of less aggressive tumors.
We also demonstrate that these improvements are not dueto network ensembling, as inputting same modality twiceinto Pathomic Fusion resulted in overfitting (Appendix C,Table III). On glioma grade classification, we see similarimprovement with Pathomic Fusion with increases of 2.75%AUC, 4.23% average precision, 4.27% F1-score (micro), and5.11% (Grade IV) over Histology CNN, which is consistentwith performance increases found in multimodal learningliterature for conventional vision tasks (Appendix C, Fig. 8,Table V) [24].
B. Pathomic Fusion Improves Patient Stratification
To further investigate the ability of Pathomic Fusion forimproving objective image-omic-based patient stratification,we plot Kaplan-Meier (KM) curves of our trained networksagainst the WHO paradigm (which uses molecular subtyping)on glioma (Fig. 3), and against the Fuhrman Grading Systemon CCRCC (Fig. 4). Overall, we observe that Pathomic Fusionallows for fine-grained stratification of survival curves beyondlow vs. high survival, and that these digital grades may beuseful in clinical settings in defining treatment cohorts.
On glioma, similar to [29], we observe that digital grading(33-66 percentile) from Pathomic Fusion is similar to that ofthe three defined glioma subtypes (IDHwt ATC, IDHmut ATC,ODG) that correlate with survival. In comparing PathomicFusion to Histology CNN, Pathomic Fusion was able to
12
discriminate intermediate and high risk patients better thanHistology CNN. Though Pathomic Fusion was slightly worse indefining low and intermediate risk patients, differences betweenthese survival curves were observed to be statistically significant(Appendix C, Table III). Similar confusion in discriminatinglow-to-intermediate risk patients is also shown in the KMestimates of molecular subtypes, which corroborates withknown literature that WHO Grades II and III are more difficultto distinguish than Grades III and IV [59] (Fig. 3). In analyzingthe distribution of predicted hazard scores for patients in lowvs. high surviving cohorts, we also observe that PathomicFusion is able to correctly assign risk to these patients in threehigh-density peaks / clusters, whereas Histology CNN alonelabels a majority of intermediate-to-high risk gliomas with lowhazard values. In inspecting the clusters elucidated by PathomicFusion ([-1.0, -0.5], [1.0, 1.25] and [1.25, 1.5]), we see thatthe gliomas these clusters strongly corroborate with the WHOParadigm for stratifying gliomas into IDHwt ATC, IDHmutATC, and ODG.
On CCRCC, we observe that Pathomic Fusion is able to notonly differentiate between lower and higher surviving patients,but also assign digital grades that follow patient stratification bythe Fuhrman Grading System (Fig. 4). Unlike Histology CNN,Pathomic Fusion is able to disentangle the survival curvesof G1-G3 CCRCCs, which have overall low-to-intermediatesurvival. In analyzing the distribution of hazard predictions byHistology CNN, we see that risk is almost uniformly predictedacross shorter and longer survival patients, which suggests thathistology alone is a poor prognostic indicator for survival inCCRCC.
C. Multimodal Interpretability of Pathomic Fusion
In addition to improved patient stratification, we demonstratethat our image-omic paradigm is highly interpretable, in whichwe can attribute how pixel regions inhistology images, cells incell graphs, and features in genomic inputs are used in survivaloutcome prediction.
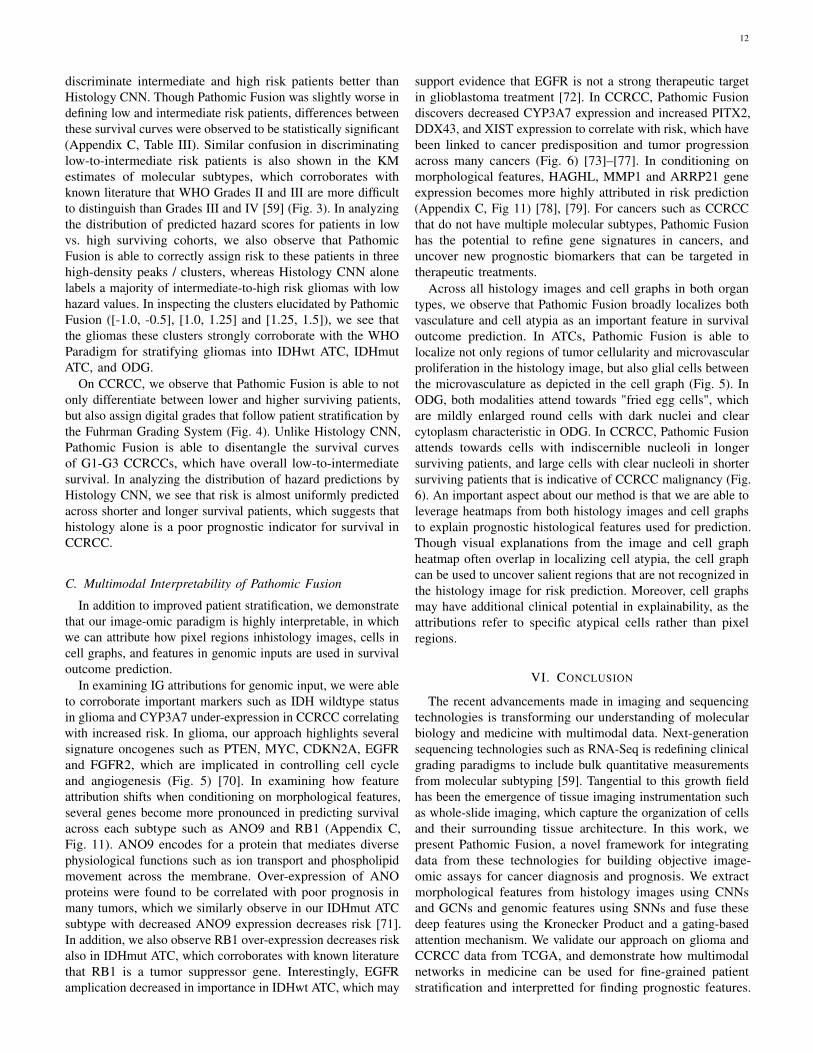
In examining IG attributions for genomic input, we were ableto corroborate important markers such as IDH wildtype statusin glioma and CYP3A7 under-expression in CCRCC correlatingwith increased risk. In glioma, our approach highlights severalsignature oncogenes such as PTEN, MYC, CDKN2A, EGFRand FGFR2, which are implicated in controlling cell cycleand angiogenesis (Fig. 5) [70]. In examining how featureattribution shifts when conditioning on morphological features,several genes become more pronounced in predicting survivalacross each subtype such as ANO9 and RB1 (Appendix C,Fig. 11). ANO9 encodes for a protein that mediates diversephysiological functions such as ion transport and phospholipidmovement across the membrane. Over-expression of ANOproteins were found to be correlated with poor prognosis inmany tumors, which we similarly observe in our IDHmut ATCsubtype with decreased ANO9 expression decreases risk [71].In addition, we also observe RB1 over-expression decreases riskalso in IDHmut ATC, which corroborates with known literaturethat RB1 is a tumor suppressor gene. Interestingly, EGFRamplication decreased in importance in IDHwt ATC, which may
support evidence that EGFR is not a strong therapeutic targetin glioblastoma treatment [72]. In CCRCC, Pathomic Fusiondiscovers decreased CYP3A7 expression and increased PITX2,DDX43, and XIST expression to correlate with risk, which havebeen linked to cancer predisposition and tumor progressionacross many cancers (Fig. 6) [73]–[77]. In conditioning onmorphological features, HAGHL, MMP1 and ARRP21 geneexpression becomes more highly attributed in risk prediction(Appendix C, Fig 11) [78], [79]. For cancers such as CCRCCthat do not have multiple molecular subtypes, Pathomic Fusionhas the potential to refine gene signatures in cancers, anduncover new prognostic biomarkers that can be targeted intherapeutic treatments.
Across all histology images and cell graphs in both organtypes, we observe that Pathomic Fusion broadly localizes bothvasculature and cell atypia as an important feature in survivaloutcome prediction. In ATCs, Pathomic Fusion is able tolocalize not only regions of tumor cellularity and microvascularproliferation in the histology image, but also glial cells betweenthe microvasculature as depicted in the cell graph (Fig. 5). InODG, both modalities attend towards "fried egg cells", whichare mildly enlarged round cells with dark nuclei and clearcytoplasm characteristic in ODG. In CCRCC, Pathomic Fusionattends towards cells with indiscernible nucleoli in longersurviving patients, and large cells with clear nucleoli in shortersurviving patients that is indicative of CCRCC malignancy (Fig.6). An important aspect about our method is that we are able toleverage heatmaps from both histology images and cell graphsto explain prognostic histological features used for prediction.Though visual explanations from the image and cell graphheatmap often overlap in localizing cell atypia, the cell graphcan be used to uncover salient regions that are not recognized inthe histology image for risk prediction. Moreover, cell graphsmay have additional clinical potential in explainability, as theattributions refer to specific atypical cells rather than pixelregions.
VI. CONCLUSION
The recent advancements made in imaging and sequencingtechnologies is transforming our understanding of molecularbiology and medicine with multimodal data. Next-generationsequencing technologies such as RNA-Seq is redefining clinicalgrading paradigms to include bulk quantitative measurementsfrom molecular subtyping [59]. Tangential to this growth fieldhas been the emergence of tissue imaging instrumentation suchas whole-slide imaging, which capture the organization of cellsand their surrounding tissue architecture. In this work, wepresent Pathomic Fusion, a novel framework for integratingdata from these technologies for building objective image-omic assays for cancer diagnosis and prognosis. We extractmorphological features from histology images using CNNsand GCNs and genomic features using SNNs and fuse thesedeep features using the Kronecker Product and a gating-basedattention mechanism. We validate our approach on glioma andCCRCC data from TCGA, and demonstrate how multimodalnetworks in medicine can be used for fine-grained patientstratification and interpretted for finding prognostic features.
13
The method presented is scalable and interpretable for multiplemodalities of different data types, and may be used for inte-grating any combination of imaging and multi-omic data. Theparadigm is general and may be used for predicting responseand resistance to treatment. Multimodal interpretability has theability to identify new and novel integrative bio-markers ofdiagnostic, prognostic and therapeutic relevance.
REFERENCES
[1] P. Y. Wen and S. Kesari, “Malignant gliomas in adults,” New EnglandJournal of Medicine, vol. 359, no. 5, pp. 492–507, Jul. 2008.
[2] L. Nayak, E. Q. Lee, and P. Y. Wen, “Epidemiology of brain metastases,”Current Oncology Reports, vol. 14, no. 1, pp. 48–54, Oct. 2011.
[3] K. Aldape, G. Zadeh, S. Mansouri, G. Reifenberger, and A. von Deimling,“Glioblastoma: pathology, molecular mechanisms and markers,” ActaNeuropathologica, vol. 129, no. 6, pp. 829–848, May 2015.
[4] A. Olar and K. D. Aldape, “Using the molecular classification ofglioblastoma to inform personalized treatment,” The Journal of Pathology,vol. 232, no. 2, pp. 165–177, Dec. 2013.
[5] J. Shanes, J. Ghali, M. Billingham, V. Ferrans, J. Fenoglio, W. Edwards,C. Tsai, J. Saffitz, J. Isner, and S. Furner, “Interobserver variability in thepathologic interpretation of endomyocardial biopsy results.” Circulation,vol. 75, no. 2, pp. 401–405, 1987.
[6] P. Courtiol, C. Maussion, M. Moarii, E. Pronier, S. Pilcer, M. Sefta,and et al., “Deep learning-based classification of mesothelioma improvesprediction of patient outcome,” Nature medicine, vol. 25, no. 10, pp.1519–1525, 2019.
[7] R. B. Puchalski, N. Shah, J. Miller, R. Dalley, S. R. Nomura, J.-G. Yoon,K. A. Smith, M. Lankerovich, D. Bertagnolli, K. Bickley et al., “Ananatomic transcriptional atlas of human glioblastoma,” Science, vol. 360,no. 6389, pp. 660–663, 2018.
[8] H. W. Jackson, J. R. Fischer, V. R. Zanotelli, H. R. Ali, R. Mechera,S. D. Soysal, H. Moch, S. Muenst, Z. Varga, W. P. Weber et al., “Thesingle-cell pathology landscape of breast cancer,” Nature, vol. 578, no.7796, pp. 615–620, 2020.
[9] D. Schapiro, H. W. Jackson, S. Raghuraman, J. R. Fischer, V. R. Zanotelli,D. Schulz, C. Giesen, R. Catena, Z. Varga, and B. Bodenmiller, “histocat:analysis of cell phenotypes and interactions in multiplex image cytometrydata,” Nature methods, vol. 14, no. 9, p. 873, 2017.
[10] A. Somarakis, V. Van Unen, F. Koning, B. P. Lelieveldt, and T. Höllt,“Imacyte: Visual exploration of cellular microenvironments for imagingmass cytometry data,” IEEE transactions on visualization and computergraphics, 2019.
[11] W. M. Abdelmoula, B. Balluff, S. Englert, J. Dijkstra, M. J. Reinders,A. Walch, L. A. McDonnell, and B. P. Lelieveldt, “Data-driven identifica-tion of prognostic tumor subpopulations using spatially mapped t-sne ofmass spectrometry imaging data,” Proceedings of the National Academyof Sciences, vol. 113, no. 43, pp. 12 244–12 249, 2016.
[12] W. M. Abdelmoula, “Data analysis for mass spectrometry imaging:methods and applications,” 2017.
[13] O. Gallego, “Nonsurgical treatment of recurrent glioblastoma,” CurrentOncology, vol. 22, no. 4, p. 273, May 2015.
[14] B. Yener, “Cell-graphs: image-driven modeling of structure-functionrelationship,” Communications of the ACM, vol. 60, no. 1, pp. 74–84,2016.
[15] S. Gadiya, D. Anand, and A. Sethi, “Histographs: Graphs in histopathol-ogy,” arXiv preprint arXiv:1908.05020, 2019.
[16] J. Wang, R. J. Chen, M. Y. Lu, A. Baras, and F. Mahmood, “Weaklysupervised prostate tma classification via graph convolutional networks,”arXiv preprint arXiv:1910.13328, 2019.
[17] S. Zuo, X. Zhang, and L. Wang, “A RNA sequencing-based six-genesignature for survival prediction in patients with glioblastoma,” ScientificReports, vol. 9, no. 1, Feb. 2019.
[18] TCGA et al., “Integrated genomic analyses of ovarian carcinoma,” Nature,vol. 474, no. 7353, p. 609, 2011.
[19] S. Yousefi, F. Amrollahi, M. Amgad, C. Dong, J. E. Lewis, C. Song, andet al., “Predicting clinical outcomes from large scale cancer genomicprofiles with deep survival models,” Scientific Reports, vol. 7, no. 1, Sep.2017.
[20] Z. Huang, X. Zhan, S. Xiang, T. S. Johnson, B. Helm, C. Y. Yu, and et al.,“Salmon: Survival analysis learning with multi-omics neural networks onbreast cancer,” Frontiers in genetics, vol. 10, p. 166, 2019.
[21] J. Ngiam, A. Khosla, M. Kim, J. Nam, H. Lee, and A. Y. Ng, “Multimodaldeep learning,” in Proceedings of the 28th international conference onmachine learning (ICML-11), 2011, pp. 689–696.
[22] H. Suresh, N. Hunt, A. Johnson, L. A. Celi, P. Szolovits, and M. Ghassemi,“Clinical intervention prediction and understanding with deep neuralnetworks,” in Machine Learning for Healthcare Conference, 2017, pp.322–337.
[23] J.-H. Kim, K.-W. On, W. Lim, J. Kim, J.-W. Ha, and B.-T. Zhang,“Hadamard product for low-rank bilinear pooling,” arXiv preprintarXiv:1610.04325, 2016.
[24] A. Zadeh, M. Chen, S. Poria, E. Cambria, and L.-P. Morency, “Tensorfusion network for multimodal sentiment analysis,” in Proceedings of the2017 Conference on Empirical Methods in Natural Language Processing.Association for Computational Linguistics, 2017.
[25] V. Subramanian, B. Chidester, J. Ma, and M. N. Do, “Correlating cellularfeatures with gene expression using cca,” in 2018 IEEE 15th InternationalSymposium on Biomedical Imaging (ISBI 2018). IEEE, 2018, pp. 805–808.
[26] I. Carmichael and J. Marron, “Joint and individual analysis of breastcancer histologic images and genomic covariates,” arXiv preprintarXiv:1912.00434, 2019.
[27] N. Coudray, P. S. Ocampo, T. Sakellaropoulos, N. Narula, M. Snuderl,Fenyö, and et al., “Classification and mutation prediction from non–smallcell lung cancer histopathology images using deep learning,” Naturemedicine, vol. 24, no. 10, p. 1559, 2018.
[28] J. N. Kather, A. T. Pearson, N. Halama, D. Jäger, J. Krause, S. H. Loosen,and et al., “Deep learning can predict microsatellite instability directlyfrom histology in gastrointestinal cancer,” Nature medicine, p. 1, 2019.
[29] P. Mobadersany, S. Yousefi, M. Amgad, D. A. Gutman, J. S. Barnholtz-Sloan, J. E. V. Vega, and et al., “Predicting cancer outcomes fromhistology and genomics using convolutional networks,” Proceedings ofthe National Academy of Sciences, vol. 115, no. 13, pp. E2970–E2979,Mar. 2018.
[30] T. Baltrusaitis, C. Ahuja, and L.-P. Morency, “Multimodal machinelearning: A survey and taxonomy,” IEEE Transactions on Pattern Analysisand Machine Intelligence, vol. 41, no. 2, pp. 423–443, Feb. 2019.
[31] A. Cheerla and O. Gevaert, “Deep learning with multimodal representa-tion for pancancer prognosis prediction,” Bioinformatics, vol. 35, no. 14,pp. i446–i454, Jul. 2019.
[32] W. Shao, Z. Han, J. Cheng, L. Cheng, T. Wang, L. Sun, Z. Lu, J. Zhang,D. Zhang, and K. Huang, “Integrative analysis of pathological imagesand multi-dimensional genomic data for early-stage cancer prognosis,”IEEE Transactions on Medical Imaging, 2019.
[33] J. M. Prewitt, “Graphs and grammars for histology: An introduction,”in Proceedings of the Annual Symposium on Computer Application inMedical Care. American Medical Informatics Association, 1979, p. 18.
[34] S. Doyle, M. Hwang, K. Shah, A. Madabhushi, M. Feldman, andJ. Tomaszeweski, “Automated grading of prostate cancer using archi-tectural and textural image features,” in 2007 4th IEEE InternationalSymposium on Biomedical Imaging: From Nano to Macro. IEEE, 2007,pp. 1284–1287.
[35] W. Hamilton, Z. Ying, and J. Leskovec, “Inductive representation learningon large graphs,” in Advances in Neural Information Processing Systems,2017, pp. 1024–1034.
[36] J. Lee, I. Lee, and J. Kang, “Self-attention graph pooling,” arXiv preprintarXiv:1904.08082, 2019.
[37] M. Defferrard, X. Bresson, and P. Vandergheynst, “Convolutional neuralnetworks on graphs with fast localized spectral filtering,” in Advances inneural information processing systems, 2016, pp. 3844–3852.
[38] T. N. Kipf and M. Welling, “Semi-supervised classification with graphconvolutional networks,” arXiv preprint arXiv:1609.02907, 2016.
[39] Y. Zhou, S. Graham, N. A. Koohbanani, M. Shaban, P.-A. Heng, andN. Rajpoot, “Cgc-net: Cell graph convolutional network for grading ofcolorectal cancer histology images,” arXiv preprint arXiv:1909.01068,2019.
[40] A. Marusyk, V. Almendro, and K. Polyak, “Intra-tumour heterogeneity:a looking glass for cancer?” Nature Reviews Cancer, vol. 12, no. 5, pp.323–334, Apr. 2012.
[41] H. Yang, J.-Y. Kim, H. Kim, and S. P. Adhikari, “Guided soft attentionnetwork for classification of breast cancer histopathology images,” IEEEtransactions on medical imaging, 2019.
[42] C. T. Sari and C. Gunduz-Demir, “Unsupervised feature extraction viadeep learning for histopathological classification of colon tissue images,”IEEE transactions on medical imaging, vol. 38, no. 5, pp. 1139–1149,2018.
[43] P. Bandi, O. Geessink, Q. Manson, M. Van Dijk, M. Balkenhol,M. Hermsen, and et al., “From detection of individual metastases to
14
classification of lymph node status at the patient level: the camelyon17challenge,” IEEE transactions on medical imaging, vol. 38, no. 2, pp.550–560, 2018.
[44] E. Guadagno, G. Borrelli, M. Califano, G. Calì, D. Solari, and M. D.B. D. Caro, “Immunohistochemical expression of stem cell markers CD44and nestin in glioblastomas: Evaluation of their prognostic significance,”Pathology - Research and Practice, vol. 212, no. 9, pp. 825–832, Sep.2016.
[45] V. E. Mikkelsen, A. L. Stensjøen, E. M. Berntsen, I. S. Nordrum,Ø. Salvesen, O. Solheim, and S. H. Torp, “Histopathologic featuresin relation to pretreatment tumor growth in patients with glioblastoma,”World Neurosurgery, vol. 109, pp. e50–e58, Jan. 2018.
[46] P. Naylor, M. Laé, F. Reyal, and T. Walter, “Segmentation of nuclei inhistopathology images by deep regression of the distance map,” IEEEtransactions on medical imaging, vol. 38, no. 2, pp. 448–459, 2018.
[47] J. Xu, L. Xiang, Q. Liu, H. Gilmore, J. Wu, J. Tang, and A. Madabhushi,“Stacked sparse autoencoder (ssae) for nuclei detection on breast cancerhistopathology images,” IEEE transactions on medical imaging, vol. 35,no. 1, pp. 119–130, 2015.
[48] H. Su, F. Xing, and L. Yang, “Robust cell detection of histopathologicalbrain tumor images using sparse reconstruction and adaptive dictionaryselection,” IEEE transactions on medical imaging, vol. 35, no. 6, pp.1575–1586, 2016.
[49] Z. Jia, X. Huang, I. Eric, C. Chang, and Y. Xu, “Constrained deep weaksupervision for histopathology image segmentation,” IEEE transactionson medical imaging, vol. 36, no. 11, pp. 2376–2388, 2017.
[50] N. Kumar, R. Verma, S. Sharma, S. Bhargava, A. Vahadane, andA. Sethi, “A dataset and a technique for generalized nuclear segmentationfor computational pathology,” IEEE Transactions on Medical Imaging,vol. 36, no. 7, pp. 1550–1560, Jul. 2017.
[51] F. Mahmood, D. Borders, R. Chen, G. McKay, K. J. Salimian, A. Baras, ,and N. J. Durr, “Adversarial training for multi-organ nuclei segmentationin computational pathology images,” in IEEE Transactions on MedicalImaging, 2018.
[52] I. Goodfellow, J. Pouget-Abadie, M. Mirza, B. Xu, D. Warde-Farley,S. Ozair, A. Courville, and Y. Bengio, “Generative adversarial nets,” inAdvances in neural information processing systems, 2014, pp. 2672–2680.
[53] P. Isola, J.-Y. Zhu, T. Zhou, and A. A. Efros, “Image-to-image translationwith conditional adversarial networks,” in Proceedings of the IEEEconference on computer vision and pattern recognition, 2017, pp. 1125–1134.
[54] M. Muja and D. G. Lowe, “Fast approximate nearest neighbors withautomatic algorithm configuration.” VISAPP (1), vol. 2, no. 331-340,p. 2, 2009.
[55] A. v. d. Oord, Y. Li, and O. Vinyals, “Representation learning withcontrastive predictive coding,” arXiv preprint arXiv:1807.03748, 2018.
[56] O. J. Hénaff, A. Razavi, C. Doersch, S. Eslami, and A. v. d. Oord, “Data-efficient image recognition with contrastive predictive coding,” arXivpreprint arXiv:1905.09272, 2019.
[57] M. Y. Lu, R. J. Chen, J. Wang, D. Dillon, and F. Mahmood, “Semi-supervised histology classification using deep multiple instance learningand contrastive predictive coding,” arXiv preprint arXiv:1910.10825,2019.
[58] G. Klambauer, T. Unterthiner, A. Mayr, and S. Hochreiter, “Self-normalizing neural networks,” in Advances in neural informationprocessing systems, 2017, pp. 971–980.
[59] D. N. Louis, A. Perry, G. Reifenberger, A. von Deimling, D. Figarella-Branger, W. K. Cavenee, and et al., “The 2016 world health organizationclassification of tumors of the central nervous system: a summary,” ActaNeuropathologica, vol. 131, no. 6, pp. 803–820, May 2016.
[60] J. Arevalo, T. Solorio, M. Montes, and F. Gonzalez, “Gated multimodalunits for information fusion,” 02 2017.
[61] R. R. Selvaraju, M. Cogswell, A. Das, R. Vedantam, D. Parikh, andD. Batra, “Grad-cam: Visual explanations from deep networks viagradient-based localization,” in Proceedings of the IEEE internationalconference on computer vision, 2017, pp. 618–626.
[62] M. Sundararajan, A. Taly, and Q. Yan, “Axiomatic attribution for deepnetworks,” in Proceedings of the 34th International Conference onMachine Learning-Volume 70. JMLR. org, 2017, pp. 3319–3328.
[63] S. Bach, A. Binder, G. Montavon, F. Klauschen, K.-R. Müller, andW. Samek, “On pixel-wise explanations for non-linear classifier decisionsby layer-wise relevance propagation,” PloS one, vol. 10, no. 7, p.e0130140, 2015.
[64] A. Vahadane, T. Peng, A. Sethi, S. Albarqouni, L. Wang, M. Baust,and et al., “Structure-preserving color normalization and sparse stainseparation for histological images,” IEEE Transactions on MedicalImaging, vol. 35, no. 8, pp. 1962–1971, Aug. 2016.
[65] E. Cerami, , J. Gao, U. Dogrusoz, B. E. Gross, S. O. Sumer, B. A.Aksoy, and et al., “The cBio cancer genomics portal: An open platformfor exploring multidimensional cancer genomics data: Figure 1.” CancerDiscovery, vol. 2, no. 5, pp. 401–404, May 2012.
[66] B. Shuch, J. N. Hofmann, M. J. Merino, J. W. Nix, S. Vourganti, W. M.Linehan, K. Schwartz, J. J. Ruterbusch, J. S. Colt, M. P. Purdue et al.,“Pathologic validation of renal cell carcinoma histology in the surveillance,epidemiology, and end results program,” in Urologic Oncology: Seminarsand Original Investigations, vol. 32, no. 1. Elsevier, 2014, pp. 23–e9.
[67] W. M. Linehan, M. M. Walther, and B. Zbar, “The genetic basis of cancerof the kidney,” The Journal of urology, vol. 170, no. 6, pp. 2163–2172,2003.
[68] P. Schraml, K. Struckmann, F. Hatz, S. Sonnet, C. Kully, T. Gasser,G. Sauter, M. J. Mihatsch, and H. Moch, “Vhl mutations and theircorrelation with tumour cell proliferation, microvessel density, and patientprognosis in clear cell renal cell carcinoma,” The Journal of Pathology:A Journal of the Pathological Society of Great Britain and Ireland, vol.196, no. 2, pp. 186–193, 2002.
[69] J. M. Bland and D. G. Altman, “The logrank test,” Bmj, vol. 328, no.7447, p. 1073, 2004.
[70] “Comprehensive, integrative genomic analysis of diffuse lower-gradegliomas,” New England Journal of Medicine, vol. 372, no. 26, pp. 2481–2498, Jun. 2015.
[71] I. Jun, H. S. Park, H. Piao, J. W. Han, M. J. An, B. G. Yun, X. Zhang,Y. H. Cha, Y. K. Shin, J. I. Yook et al., “Ano9/tmem16j promotestumourigenesis via egfr and is a novel therapeutic target for pancreaticcancer,” British journal of cancer, vol. 117, no. 12, pp. 1798–1809, 2017.
[72] M. Westphal, C. L. Maire, and K. Lamszus, “EGFR as a target forglioblastoma treatment: An unfulfilled promise,” CNS Drugs, vol. 31,no. 9, pp. 723–735, Aug. 2017.
[73] G. Murray, M. McFadyen, R. Mitchell, Y. Cheung, A. Kerr, andW. Melvin, “Cytochrome p450 cyp3a in human renal cell cancer,” Britishjournal of cancer, vol. 79, no. 11, pp. 1836–1842, 1999.
[74] T. Abdel-Fatah, S. McArdle, C. Johnson, P. Moseley, G. Ball, A. Pockley,I. Ellis, R. Rees, and S. Chan, “Hage (ddx43) is a biomarker for poorprognosis and a predictor of chemotherapy response in breast cancer,”British journal of cancer, vol. 110, no. 10, pp. 2450–2461, 2014.
[75] A. Allegra, A. Alonci, S. Campo, G. Penna, A. Petrungaro, D. Gerace,and C. Musolino, “Circulating micrornas: new biomarkers in diagnosis,prognosis and treatment of cancer,” International journal of oncology,vol. 41, no. 6, pp. 1897–1912, 2012.
[76] A. R. Jordan, J. Wang, T. J. Yates, S. L. Hasanali, S. D. Lokeshwar,D. S. Morera, N. Shamaladevi, C. S. Li, Z. Klaassen, M. K. Terris et al.,“Molecular targeting of renal cell carcinoma by an oral combination,”Oncogenesis, vol. 9, no. 5, pp. 1–13, 2020.
[77] W.-K. Lee and F. Thévenod, “Oncogenic pitx2 facilitates tumor celldrug resistance by inverse regulation of hoct3/slc22a3 and abc drugtransporters in colon and kidney cancers,” Cancer letters, vol. 449, pp.237–251, 2019.
[78] T.-C. Lin, Y.-M. Yeh, W.-L. Fan, Y.-C. Chang, W.-M. Lin, T.-Y. Yang,and M. Hsiao, “Ghrelin upregulates oncogenic aurora a to promote renalcell carcinoma invasion,” Cancers, vol. 11, no. 3, p. 303, 2019.
[79] Q.-M. Wang, L. Lv, Y. Tang, L. Zhang, and L.-F. Wang, “Mmp-1 isoverexpressed in triple-negative breast cancer tissues and the knockdownof mmp-1 expression inhibits tumor cell malignant behaviors in vitro,”Oncology letters, vol. 17, no. 2, pp. 1732–1740, 2019.
[80] D. R. Cox, “Regression models and life-tables,” Journal of the RoyalStatistical Society: Series B (Methodological), vol. 34, no. 2, pp. 187–202,1972.
[81] W. H. Wong, “Theory of partial likelihood,” The Annals of Statistics,vol. 14, no. 1, pp. 88–123, Mar. 1986.
15
APPENDIX A. DEEP LEARNING-BASED SURVIVAL ANALYSIS
Survival analysis is a task that models the time to an event, where the outcome of the event is not always observed. Suchevents are called censored, in which the date of the last known encounter is used as a lower bound of the survival time. For thetask of cancer survival outcome prediction, an uncensored event would be patient death, and a censored event would includeeither patient survival or last known follow-up.
Let T be a continuous random variable that represents patient survival time, and the survival function S(t) = P (T ≥ t0) bethe probability of a patient surviving longer than time t0. We can denote the probability that an event occurs instantaneously ata time t (after t0) as the hazard function λ(t). Integrating the hazard function over the time between t and t0 gives us thesurvival function [80].
λ(t) = lim∂t→0
P (t ≤ T ≤ t+ ∂t|T ≥ t)∂t
, S(t) = exp
(−∫ t
0
λ(x)∂x
).
The most common semi-parametric approach for estimating the hazard function is the Cox proportion hazards model, whichassumes that the hazard function can be parameterized as an exponential linear function λ(t|x) = λ0(t)e
βx, where λ0(t) isthe baseline hazard that describes how the risk of an event changes over time, β are model parameters that describe how thehazard varies with covariates / features X of a patient. In the original model, the baseline hazard λ0(t) is left unspecified,making it difficult to estimate β, however, the Cox partial log-likelihood can be derived that expresses the likelihood of anevent to be observed at time t for β,X [81].
l(β,X) = −∑i∈U
Xiβ − log∑j⊂Ri
eXjβ
,∂l(β,X)
∂Xi= δ(i)β −
∑i,j∈Cj ,U
βeXiβ∑k∈Cj
eXkβ
where U is the set of uncensored patients, Ri is the set of patients whose time of death or last follow-up is later thani. From the partial log-likelihood, β can be estimated using iterative optimization algorithms such as Newton-Raphson orStochastic Gradient Descent. To train deep networks for survival analysis, features from the hidden layer are used as covariatesin the Cox model, with the derivative of the partial log-likelihood used as error during back-propagation. To evaluate theperformance of networks for survival analysis, we use the Concordance Index (c-Index), which measures the concordance ofranking of predicted hazard scores with the ground truth survival times of patients. To demonstrate how well Pathomic Fusionperforms over other models, we used the c-Index as a comparative performance metric to measure how well each model isable to predict hazard scores amongst patients (higher is better). Our baseline for clinical practice was using the ground truthmolecular subtypes as covariates in a Cox proportional hazard model - the canonical regression technique for modeling survivaldistributions. P-Values were calculated using the Log Rank Test, which we used to assess low vs. high risk stratification on alldatasets, low vs. intermediate and intermediate vs. high (33-66-100 percentile) risk stratification in glioma, and 25-50-75-100percentile risk stratification in CCRCC [69].
APPENDIX B. IMPLEMENTATION DETAILS
A. Inclusion Criteria for Genomic and Transcriptomic Features
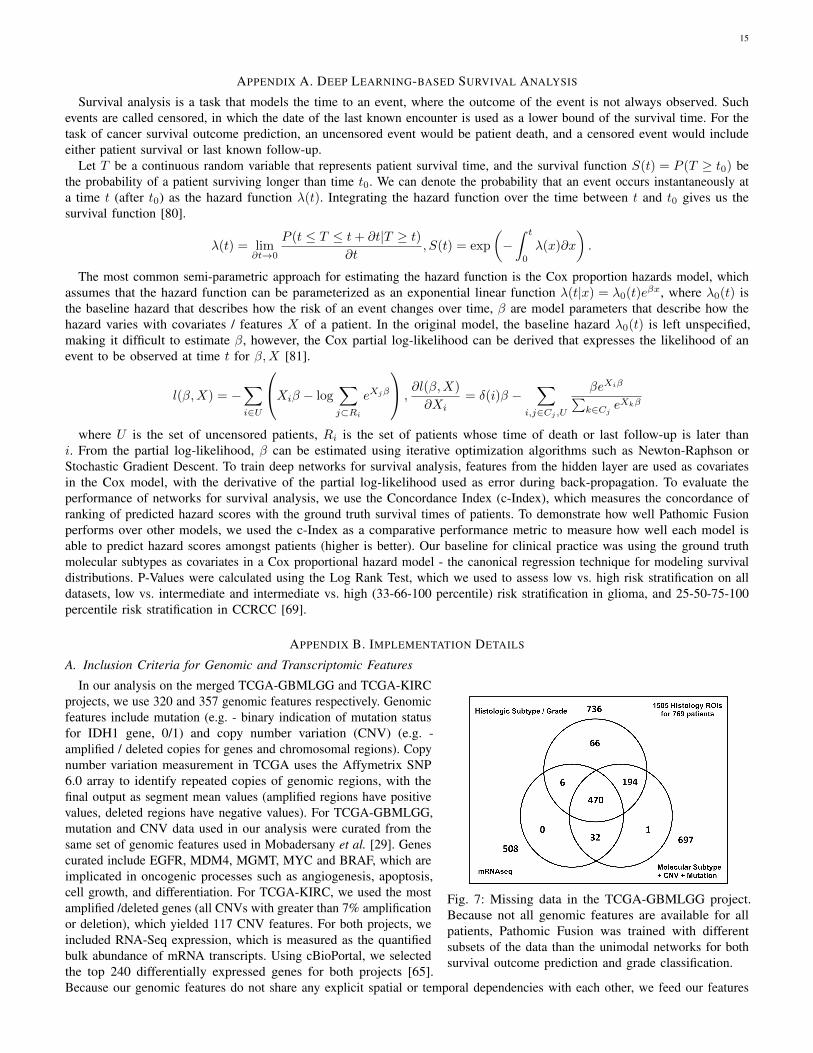
Fig. 7: Missing data in the TCGA-GBMLGG project.Because not all genomic features are available for allpatients, Pathomic Fusion was trained with differentsubsets of the data than the unimodal networks for bothsurvival outcome prediction and grade classification.
In our analysis on the merged TCGA-GBMLGG and TCGA-KIRCprojects, we use 320 and 357 genomic features respectively. Genomicfeatures include mutation (e.g. - binary indication of mutation statusfor IDH1 gene, 0/1) and copy number variation (CNV) (e.g. -amplified / deleted copies for genes and chromosomal regions). Copynumber variation measurement in TCGA uses the Affymetrix SNP6.0 array to identify repeated copies of genomic regions, with thefinal output as segment mean values (amplified regions have positivevalues, deleted regions have negative values). For TCGA-GBMLGG,mutation and CNV data used in our analysis were curated from thesame set of genomic features used in Mobadersany et al. [29]. Genescurated include EGFR, MDM4, MGMT, MYC and BRAF, which areimplicated in oncogenic processes such as angiogenesis, apoptosis,cell growth, and differentiation. For TCGA-KIRC, we used the mostamplified /deleted genes (all CNVs with greater than 7% amplificationor deletion), which yielded 117 CNV features. For both projects, weincluded RNA-Seq expression, which is measured as the quantifiedbulk abundance of mRNA transcripts. Using cBioPortal, we selectedthe top 240 differentially expressed genes for both projects [65].Because our genomic features do not share any explicit spatial or temporal dependencies with each other, we feed our features
16
through a Self-Normalizing Feedforward Network to learn a low-dimensional representation before fusing it with histology andcell graph modalities.
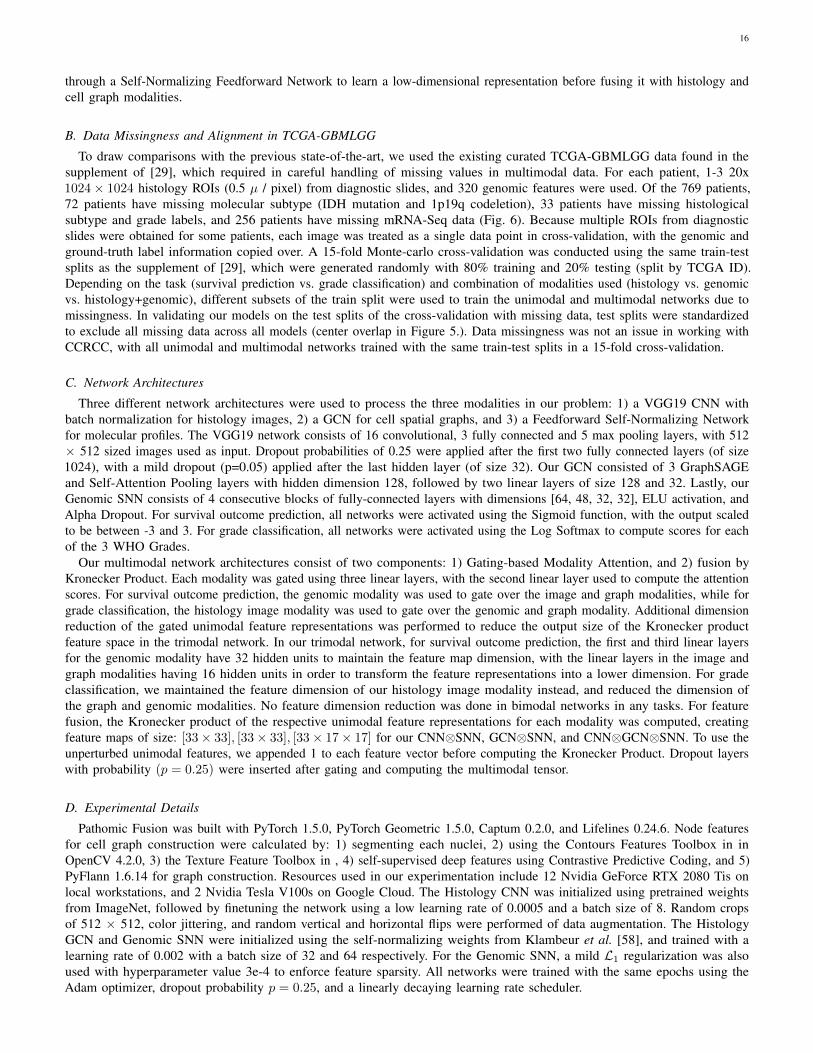
B. Data Missingness and Alignment in TCGA-GBMLGG
To draw comparisons with the previous state-of-the-art, we used the existing curated TCGA-GBMLGG data found in thesupplement of [29], which required in careful handling of missing values in multimodal data. For each patient, 1-3 20x1024× 1024 histology ROIs (0.5 µ / pixel) from diagnostic slides, and 320 genomic features were used. Of the 769 patients,72 patients have missing molecular subtype (IDH mutation and 1p19q codeletion), 33 patients have missing histologicalsubtype and grade labels, and 256 patients have missing mRNA-Seq data (Fig. 6). Because multiple ROIs from diagnosticslides were obtained for some patients, each image was treated as a single data point in cross-validation, with the genomic andground-truth label information copied over. A 15-fold Monte-carlo cross-validation was conducted using the same train-testsplits as the supplement of [29], which were generated randomly with 80% training and 20% testing (split by TCGA ID).Depending on the task (survival prediction vs. grade classification) and combination of modalities used (histology vs. genomicvs. histology+genomic), different subsets of the train split were used to train the unimodal and multimodal networks due tomissingness. In validating our models on the test splits of the cross-validation with missing data, test splits were standardizedto exclude all missing data across all models (center overlap in Figure 5.). Data missingness was not an issue in working withCCRCC, with all unimodal and multimodal networks trained with the same train-test splits in a 15-fold cross-validation.
C. Network Architectures
Three different network architectures were used to process the three modalities in our problem: 1) a VGG19 CNN withbatch normalization for histology images, 2) a GCN for cell spatial graphs, and 3) a Feedforward Self-Normalizing Networkfor molecular profiles. The VGG19 network consists of 16 convolutional, 3 fully connected and 5 max pooling layers, with 512× 512 sized images used as input. Dropout probabilities of 0.25 were applied after the first two fully connected layers (of size1024), with a mild dropout (p=0.05) applied after the last hidden layer (of size 32). Our GCN consisted of 3 GraphSAGEand Self-Attention Pooling layers with hidden dimension 128, followed by two linear layers of size 128 and 32. Lastly, ourGenomic SNN consists of 4 consecutive blocks of fully-connected layers with dimensions [64, 48, 32, 32], ELU activation, andAlpha Dropout. For survival outcome prediction, all networks were activated using the Sigmoid function, with the output scaledto be between -3 and 3. For grade classification, all networks were activated using the Log Softmax to compute scores for eachof the 3 WHO Grades.
Our multimodal network architectures consist of two components: 1) Gating-based Modality Attention, and 2) fusion byKronecker Product. Each modality was gated using three linear layers, with the second linear layer used to compute the attentionscores. For survival outcome prediction, the genomic modality was used to gate over the image and graph modalities, while forgrade classification, the histology image modality was used to gate over the genomic and graph modality. Additional dimensionreduction of the gated unimodal feature representations was performed to reduce the output size of the Kronecker productfeature space in the trimodal network. In our trimodal network, for survival outcome prediction, the first and third linear layersfor the genomic modality have 32 hidden units to maintain the feature map dimension, with the linear layers in the image andgraph modalities having 16 hidden units in order to transform the feature representations into a lower dimension. For gradeclassification, we maintained the feature dimension of our histology image modality instead, and reduced the dimension ofthe graph and genomic modalities. No feature dimension reduction was done in bimodal networks in any tasks. For featurefusion, the Kronecker product of the respective unimodal feature representations for each modality was computed, creatingfeature maps of size: [33× 33], [33× 33], [33× 17× 17] for our CNN⊗SNN, GCN⊗SNN, and CNN⊗GCN⊗SNN. To use theunperturbed unimodal features, we appended 1 to each feature vector before computing the Kronecker Product. Dropout layerswith probability (p = 0.25) were inserted after gating and computing the multimodal tensor.
D. Experimental Details
Pathomic Fusion was built with PyTorch 1.5.0, PyTorch Geometric 1.5.0, Captum 0.2.0, and Lifelines 0.24.6. Node featuresfor cell graph construction were calculated by: 1) segmenting each nuclei, 2) using the Contours Features Toolbox in inOpenCV 4.2.0, 3) the Texture Feature Toolbox in , 4) self-supervised deep features using Contrastive Predictive Coding, and 5)PyFlann 1.6.14 for graph construction. Resources used in our experimentation include 12 Nvidia GeForce RTX 2080 Tis onlocal workstations, and 2 Nvidia Tesla V100s on Google Cloud. The Histology CNN was initialized using pretrained weightsfrom ImageNet, followed by finetuning the network using a low learning rate of 0.0005 and a batch size of 8. Random cropsof 512 × 512, color jittering, and random vertical and horizontal flips were performed of data augmentation. The HistologyGCN and Genomic SNN were initialized using the self-normalizing weights from Klambeur et al. [58], and trained with alearning rate of 0.002 with a batch size of 32 and 64 respectively. For the Genomic SNN, a mild L1 regularization was alsoused with hyperparameter value 3e-4 to enforce feature sparsity. All networks were trained with the same epochs using theAdam optimizer, dropout probability p = 0.25, and a linearly decaying learning rate scheduler.
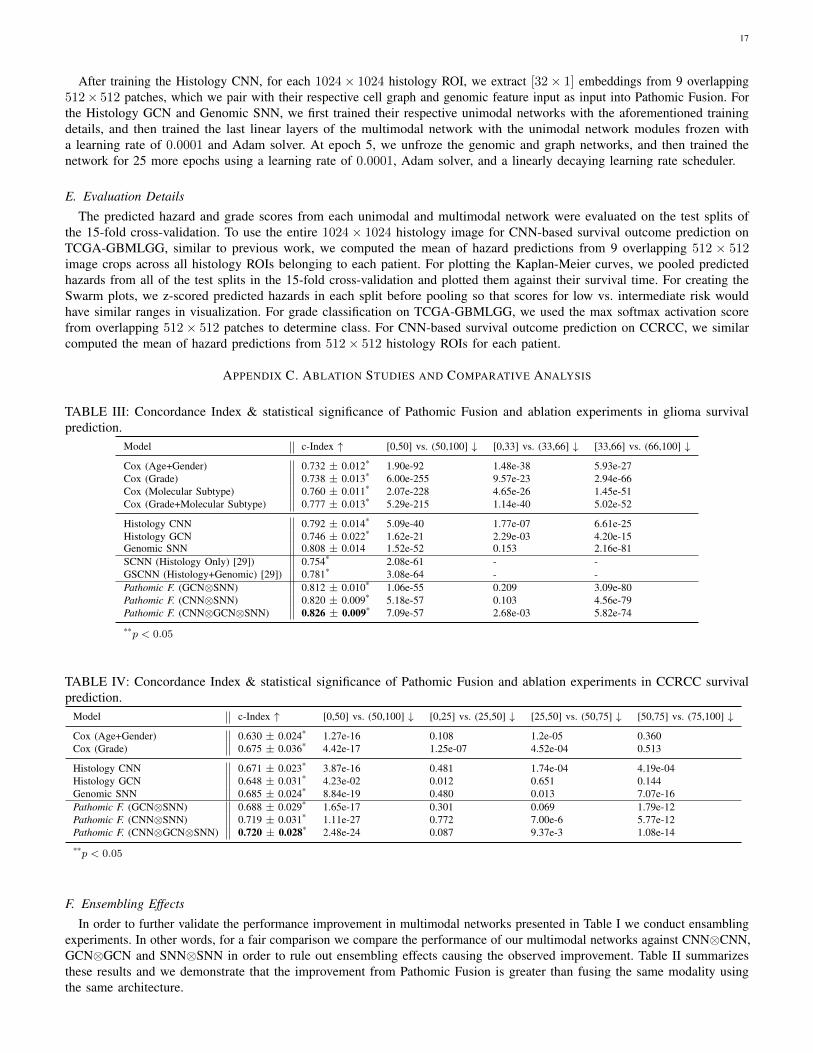
17
After training the Histology CNN, for each 1024× 1024 histology ROI, we extract [32× 1] embeddings from 9 overlapping512× 512 patches, which we pair with their respective cell graph and genomic feature input as input into Pathomic Fusion. Forthe Histology GCN and Genomic SNN, we first trained their respective unimodal networks with the aforementioned trainingdetails, and then trained the last linear layers of the multimodal network with the unimodal network modules frozen witha learning rate of 0.0001 and Adam solver. At epoch 5, we unfroze the genomic and graph networks, and then trained thenetwork for 25 more epochs using a learning rate of 0.0001, Adam solver, and a linearly decaying learning rate scheduler.
E. Evaluation Details
The predicted hazard and grade scores from each unimodal and multimodal network were evaluated on the test splits ofthe 15-fold cross-validation. To use the entire 1024× 1024 histology image for CNN-based survival outcome prediction onTCGA-GBMLGG, similar to previous work, we computed the mean of hazard predictions from 9 overlapping 512 × 512image crops across all histology ROIs belonging to each patient. For plotting the Kaplan-Meier curves, we pooled predictedhazards from all of the test splits in the 15-fold cross-validation and plotted them against their survival time. For creating theSwarm plots, we z-scored predicted hazards in each split before pooling so that scores for low vs. intermediate risk wouldhave similar ranges in visualization. For grade classification on TCGA-GBMLGG, we used the max softmax activation scorefrom overlapping 512× 512 patches to determine class. For CNN-based survival outcome prediction on CCRCC, we similarcomputed the mean of hazard predictions from 512× 512 histology ROIs for each patient.
APPENDIX C. ABLATION STUDIES AND COMPARATIVE ANALYSIS
TABLE III: Concordance Index & statistical significance of Pathomic Fusion and ablation experiments in glioma survivalprediction.
Model c-Index ↑ [0,50] vs. (50,100] ↓ [0,33] vs. (33,66] ↓ [33,66] vs. (66,100] ↓
Cox (Age+Gender) 0.732 ± 0.012* 1.90e-92 1.48e-38 5.93e-27Cox (Grade) 0.738 ± 0.013* 6.00e-255 9.57e-23 2.94e-66Cox (Molecular Subtype) 0.760 ± 0.011* 2.07e-228 4.65e-26 1.45e-51Cox (Grade+Molecular Subtype) 0.777 ± 0.013* 5.29e-215 1.14e-40 5.02e-52
Histology CNN 0.792 ± 0.014* 5.09e-40 1.77e-07 6.61e-25Histology GCN 0.746 ± 0.022* 1.62e-21 2.29e-03 4.20e-15Genomic SNN 0.808 ± 0.014 1.52e-52 0.153 2.16e-81SCNN (Histology Only) [29]) 0.754* 2.08e-61 - -GSCNN (Histology+Genomic) [29]) 0.781* 3.08e-64 - -Pathomic F. (GCN⊗SNN) 0.812 ± 0.010* 1.06e-55 0.209 3.09e-80Pathomic F. (CNN⊗SNN) 0.820 ± 0.009* 5.18e-57 0.103 4.56e-79Pathomic F. (CNN⊗GCN⊗SNN) 0.826 ± 0.009* 7.09e-57 2.68e-03 5.82e-74
**p < 0.05
TABLE IV: Concordance Index & statistical significance of Pathomic Fusion and ablation experiments in CCRCC survivalprediction.
Model c-Index ↑ [0,50] vs. (50,100] ↓ [0,25] vs. (25,50] ↓ [25,50] vs. (50,75] ↓ [50,75] vs. (75,100] ↓
Cox (Age+Gender) 0.630 ± 0.024* 1.27e-16 0.108 1.2e-05 0.360Cox (Grade) 0.675 ± 0.036* 4.42e-17 1.25e-07 4.52e-04 0.513
Histology CNN 0.671 ± 0.023* 3.87e-16 0.481 1.74e-04 4.19e-04Histology GCN 0.648 ± 0.031* 4.23e-02 0.012 0.651 0.144Genomic SNN 0.685 ± 0.024* 8.84e-19 0.480 0.013 7.07e-16Pathomic F. (GCN⊗SNN) 0.688 ± 0.029* 1.65e-17 0.301 0.069 1.79e-12Pathomic F. (CNN⊗SNN) 0.719 ± 0.031* 1.11e-27 0.772 7.00e-6 5.77e-12Pathomic F. (CNN⊗GCN⊗SNN) 0.720 ± 0.028* 2.48e-24 0.087 9.37e-3 1.08e-14
**p < 0.05
F. Ensembling Effects
In order to further validate the performance improvement in multimodal networks presented in Table I we conduct ensamblingexperiments. In other words, for a fair comparison we compare the performance of our multimodal networks against CNN⊗CNN,GCN⊗GCN and SNN⊗SNN in order to rule out ensembling effects causing the observed improvement. Table II summarizesthese results and we demonstrate that the improvement from Pathomic Fusion is greater than fusing the same modality usingthe same architecture.
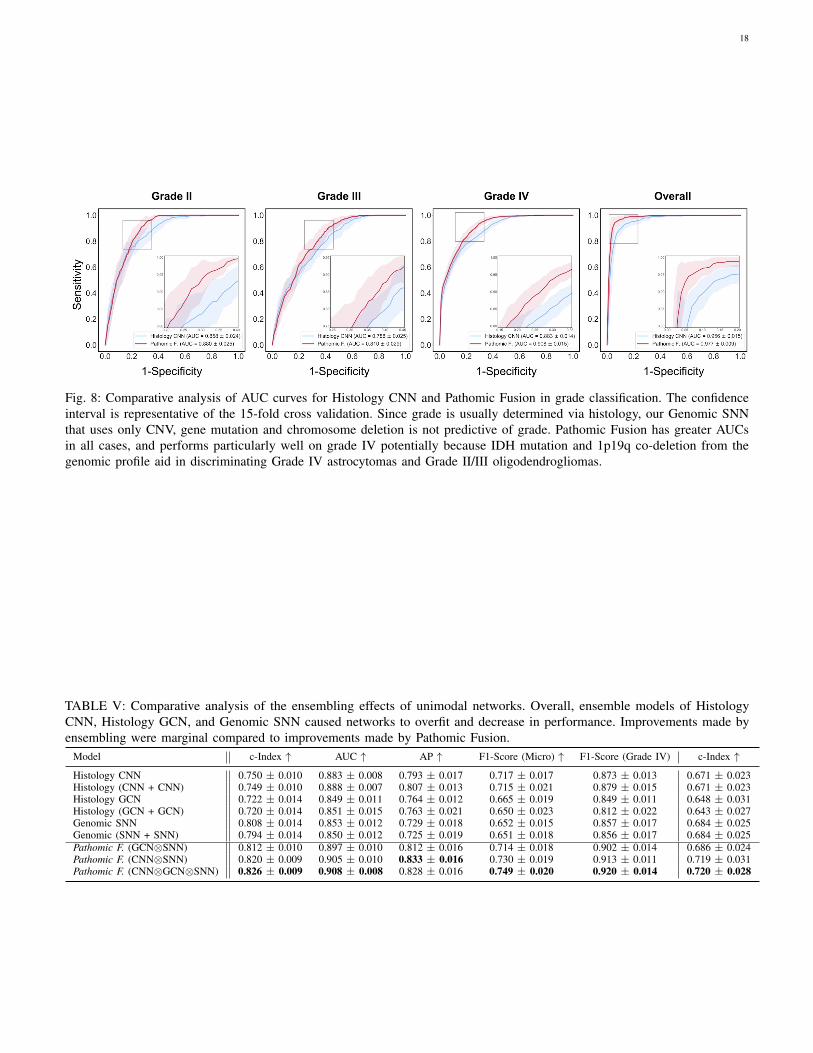
18
Fig. 8: Comparative analysis of AUC curves for Histology CNN and Pathomic Fusion in grade classification. The confidenceinterval is representative of the 15-fold cross validation. Since grade is usually determined via histology, our Genomic SNNthat uses only CNV, gene mutation and chromosome deletion is not predictive of grade. Pathomic Fusion has greater AUCsin all cases, and performs particularly well on grade IV potentially because IDH mutation and 1p19q co-deletion from thegenomic profile aid in discriminating Grade IV astrocytomas and Grade II/III oligodendrogliomas.
TABLE V: Comparative analysis of the ensembling effects of unimodal networks. Overall, ensemble models of HistologyCNN, Histology GCN, and Genomic SNN caused networks to overfit and decrease in performance. Improvements made byensembling were marginal compared to improvements made by Pathomic Fusion.
Model c-Index ↑ AUC ↑ AP ↑ F1-Score (Micro) ↑ F1-Score (Grade IV) c-Index ↑
Histology CNN 0.750 ± 0.010 0.883 ± 0.008 0.793 ± 0.017 0.717 ± 0.017 0.873 ± 0.013 0.671 ± 0.023Histology (CNN + CNN) 0.749 ± 0.010 0.888 ± 0.007 0.807 ± 0.013 0.715 ± 0.021 0.879 ± 0.015 0.671 ± 0.023Histology GCN 0.722 ± 0.014 0.849 ± 0.011 0.764 ± 0.012 0.665 ± 0.019 0.849 ± 0.011 0.648 ± 0.031Histology (GCN + GCN) 0.720 ± 0.014 0.851 ± 0.015 0.763 ± 0.021 0.650 ± 0.023 0.812 ± 0.022 0.643 ± 0.027Genomic SNN 0.808 ± 0.014 0.853 ± 0.012 0.729 ± 0.018 0.652 ± 0.015 0.857 ± 0.017 0.684 ± 0.025Genomic (SNN + SNN) 0.794 ± 0.014 0.850 ± 0.012 0.725 ± 0.019 0.651 ± 0.018 0.856 ± 0.017 0.684 ± 0.025Pathomic F. (GCN⊗SNN) 0.812 ± 0.010 0.897 ± 0.010 0.812 ± 0.016 0.714 ± 0.018 0.902 ± 0.014 0.686 ± 0.024Pathomic F. (CNN⊗SNN) 0.820 ± 0.009 0.905 ± 0.010 0.833 ± 0.016 0.730 ± 0.019 0.913 ± 0.011 0.719 ± 0.031Pathomic F. (CNN⊗GCN⊗SNN) 0.826 ± 0.009 0.908 ± 0.008 0.828 ± 0.016 0.749 ± 0.020 0.920 ± 0.014 0.720 ± 0.028
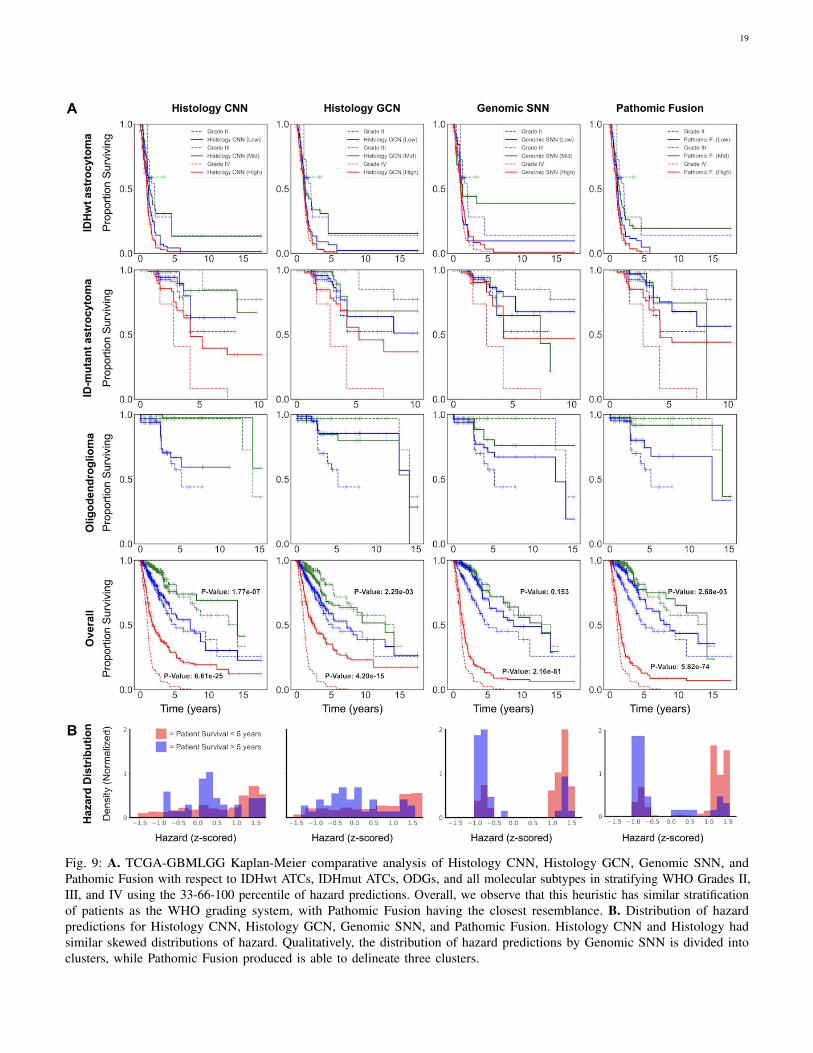
19
Fig. 9: A. TCGA-GBMLGG Kaplan-Meier comparative analysis of Histology CNN, Histology GCN, Genomic SNN, andPathomic Fusion with respect to IDHwt ATCs, IDHmut ATCs, ODGs, and all molecular subtypes in stratifying WHO Grades II,III, and IV using the 33-66-100 percentile of hazard predictions. Overall, we observe that this heuristic has similar stratificationof patients as the WHO grading system, with Pathomic Fusion having the closest resemblance. B. Distribution of hazardpredictions for Histology CNN, Histology GCN, Genomic SNN, and Pathomic Fusion. Histology CNN and Histology hadsimilar skewed distributions of hazard. Qualitatively, the distribution of hazard predictions by Genomic SNN is divided intoclusters, while Pathomic Fusion produced is able to delineate three clusters.
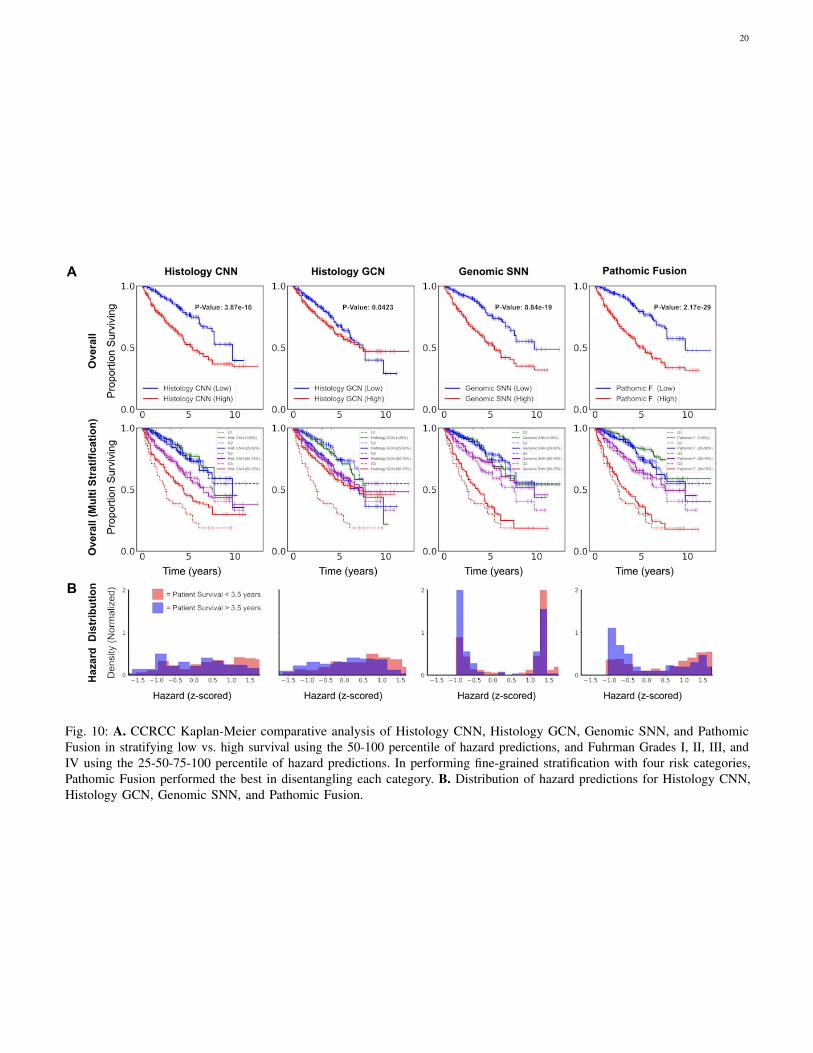
20
Fig. 10: A. CCRCC Kaplan-Meier comparative analysis of Histology CNN, Histology GCN, Genomic SNN, and PathomicFusion in stratifying low vs. high survival using the 50-100 percentile of hazard predictions, and Fuhrman Grades I, II, III, andIV using the 25-50-75-100 percentile of hazard predictions. In performing fine-grained stratification with four risk categories,Pathomic Fusion performed the best in disentangling each category. B. Distribution of hazard predictions for Histology CNN,Histology GCN, Genomic SNN, and Pathomic Fusion.
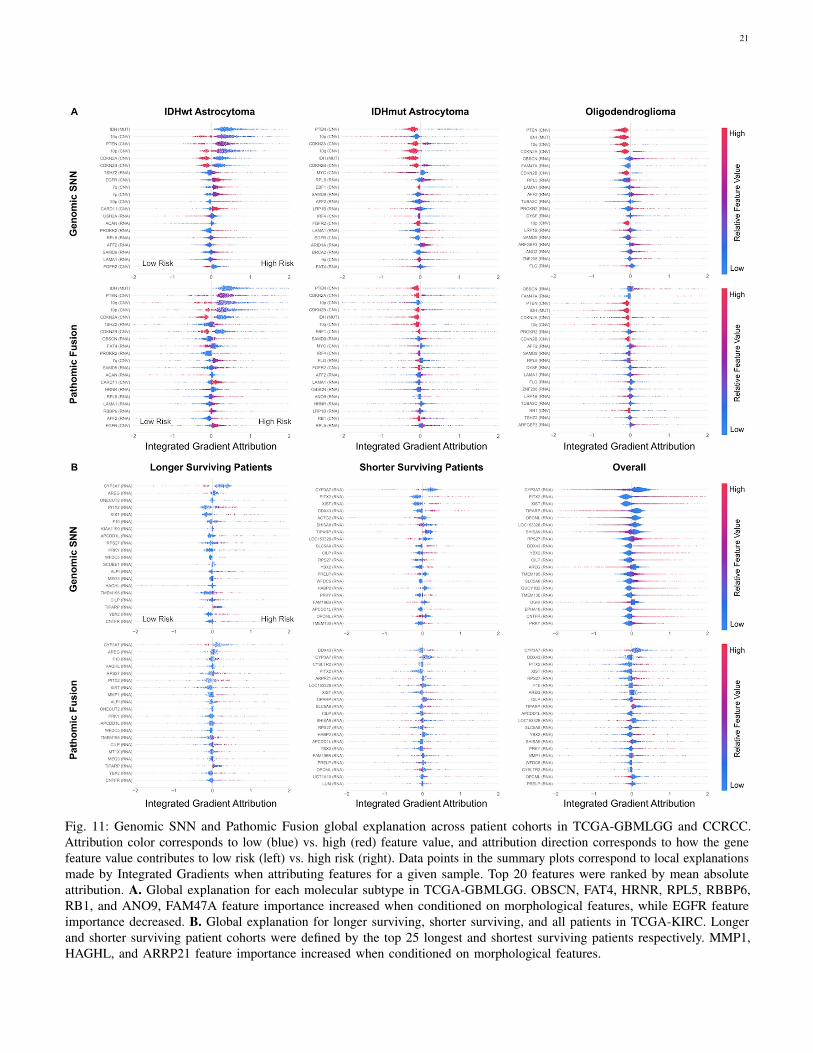
21
Fig. 11: Genomic SNN and Pathomic Fusion global explanation across patient cohorts in TCGA-GBMLGG and CCRCC.Attribution color corresponds to low (blue) vs. high (red) feature value, and attribution direction corresponds to how the genefeature value contributes to low risk (left) vs. high risk (right). Data points in the summary plots correspond to local explanationsmade by Integrated Gradients when attributing features for a given sample. Top 20 features were ranked by mean absoluteattribution. A. Global explanation for each molecular subtype in TCGA-GBMLGG. OBSCN, FAT4, HRNR, RPL5, RBBP6,RB1, and ANO9, FAM47A feature importance increased when conditioned on morphological features, while EGFR featureimportance decreased. B. Global explanation for longer surviving, shorter surviving, and all patients in TCGA-KIRC. Longerand shorter surviving patient cohorts were defined by the top 25 longest and shortest surviving patients respectively. MMP1,HAGHL, and ARRP21 feature importance increased when conditioned on morphological features.


![Endrich News Oktober 2017 dt+engl · Type C 2.5 W PERFORMANCE TYPE FUSING POWER [ FUSING TIME. ] ANCE FUSING PERFORMANCE FUSING PERFORMANCE Please note that this device](https://img.pdfslide.net/doc/110x75/5f68c7cca7d617432e4d41da/endrich-news-oktober-2017-dtengl-type-c-25-w-performance-type-fusing-power-fusing.jpg)