Embed Size (px)
Citation preview
ASIAN DEVELOPMENT BANK
Pathways to low-carbon develoPment for
vIet nam

ASIAN DEVELOPMENT BANK
Pathways to low-carbon develoPment for
vIet nam
Creative Commons Attribution 3.0 IGO license (CC BY 3.0 IGO)
© 2017 Asian Development Bank6 ADB Avenue, Mandaluyong City, 1550 Metro Manila, PhilippinesTel +63 2 632 4444; Fax +63 2 636 2444www.adb.org
Some rights reserved. Published in 2017.Printed in the Philippines.
ISBN 978-92-9261-056-2 (print), 978-92-9261-057-9 (electronic)Publication Stock No. TCS179192-2DOI: http://dx.doi.org/10.22617/TCS179192-2
The views expressed in this publication are those of the authors and do not necessarily reflect the views and policiesof the Asian Development Bank (ADB) or its Board of Governors or the governments they represent.
ADB does not guarantee the accuracy of the data included in this publication and accepts no responsibility for anyconsequence of their use. The mention of specific companies or products of manufacturers does not imply that theyare endorsed or recommended by ADB in preference to others of a similar nature that are not mentioned.
By making any designation of or reference to a particular territory or geographic area, or by using the term “country”in this document, ADB does not intend to make any judgments as to the legal or other status of any territory or area.
This work is available under the Creative Commons Attribution 3.0 IGO license (CC BY 3.0 IGO)https://creativecommons.org/licenses/by/3.0/igo/. By using the content of this publication, you agree to be boundby the terms of this license. For attribution, translations, adaptations, and permissions, please read the provisionsand terms of use at https://www.adb.org/terms-use#openaccess
This CC license does not apply to non-ADB copyright materials in this publication. If the material is attributedto another source, please contact the copyright owner or publisher of that source for permission to reproduce it.ADB cannot be held liable for any claims that arise as a result of your use of the material.
Please contact [email protected] if you have questions or comments with respect to content, or if you wishto obtain copyright permission for your intended use that does not fall within these terms, or for permission to usethe ADB logo.
Notes: In this publication, “$” refers to US dollars. ADB recognizes “China” as the People’s Republic of China, “Vietnam” as Viet Nam, and “Hanoi” as Ha Noi.
Contents
iii
tables and fIgures vforeword viiiforeword xacknowledgments xiiabbrevIatIons xiveXecutIve summary xvi
1. IntroductIon 11.1 A Low-Carbon Future Matters for Viet Nam 11.2 Viet Nam’s Energy and Emissions Context 21.3 Current Climate Change and Green Growth Policies 51.4 Results of Recent Low-Carbon Analytical Work 81.5 Objectives and Approach 9
2. methodology 112.1 Data and Assumptions in the Reference and Low-Carbon Scenarios 122.2 Methodology to Evaluate Energy Efficiency in Household Electricity Consumption 132.3 Methodology to Evaluate Energy Efficiency in Industry 132.4 Methodology to Evaluate Power Sector Supply-Side Assessment 142.5 Methodology to Evaluate Sustainable Transportation and Urban Planning 15
3. analysIs and results of energy effIcIency In household electrIcIty consumPtIon 173.1 The Reference Scenario 173.2 The Low-Carbon Development Scenario and Mitigation Opportunities 22
4. analysIs and results of energy effIcIency In Industry 244.1 The Reference Scenario 244.2 The Low-Carbon Development Scenario and Mitigation Opportunities 27
5. analysIs and results of Power sector suPPly-sIde assessment 285.1 The Reference Scenario 285.2 The Low-Carbon Development Scenario and Mitigation Opportunities 32
6. analysIs and results of sustaInable transPortatIon 416.1 The Reference Scenario 416.2 The Low-Carbon Development Scenario and Mitigation Opportunities 48
iv Contents
7. margInal abatement cost curves 557.1 Household Electricity Demand 557.2 Industry Sector 567.3 Electricity Generation – Supply Side 587.4 Transport 597.5 All Sectors 60
8. economy-wIde conseQuences of low-carbon growth 638.1 Background 638.2 Model Structure and Data 638.3 Simulations and Assessment Results 67
9. PolIcIes to realIZe low-carbon growth PotentIal 719.1 Viet Nam’s Mitigation Goals Can Be Met or Exceeded 719.2 Renewable Power Deployment Can Be Accelerated 729.3 Energy Efficiency is Essential to Low-Carbon Growth 759.4 Transportation Improvements Reduce Emissions while Generating Important Co-Benefits 779.5 Cross-Sector Planning is Needed to Realize Mitigation Potential 78
10. conclusIons 79
references 80
aPPendIX: detaIls on technIcal PotentIal to ImProve demand- sIde energy effIcIency 84
anneX a 95anneX b 108anneX c 110
tables and Figures
v
Tables1 Greenhouse Gas Emissions in Viet Nam 42 Viet Nam’s Priority Mitigation Actions to Meet Nationally Determined Contribution Pledges 73 Comparison of Recent Low-Carbon Studies 94 Household Appliances Included 175 In-Use Numbers of Selected Appliances in 2010, 2030, and 2050 186 Average Per-Unit Power Consumption of Selected In-Use Appliances 207 Household Appliances Considered in the Study 228 Viet Nam Steel Development Plan 249 Demand–Supply Scenario in the Cement Industry 2510 Demand–Supply Scenario in the Fertilizer Industry 2611 Demand–Supply Scenario in Refineries 2612 Demand–Supply Scenario in the Pulp and Paper Industry 2613 Mode Mix for Freight by Road and Inland Waterway in 2008 4614 Freight Transported by Coastal Shipping in 2008 4615 Low-Carbon Measures Selected for Inclusion in the Analysis 4916 Renewable Energy Goals of Viet Nam’s Renewable Energy Development Strategy 7317 Power Generation Mix of Viet Nam under PDP-VII-Revised 74
A1 Small-Scale Steel Producer Abatement Options 86A2 Abatement Options for Integrated Steel Plants 88A3 Cement Sector Abatement Options 89A4 Abatement Options for Fertilizer Plants 90A5 Abatement Options for Refineries 92A6 Pulp and Paper Sector Abatement Options 93
Figures1 Relative Trend in Energy Intensity of GDP Compared with 1990 in Asia 32 Relative Trend in Energy Intensity of GDP Compared with 1990 in Europe 33 Relative Trend in CO2e Emissions Intensity of GDP Compared with 1990 in Asia 44 Proposed Green Growth Strategy Road Map 55 Greenhouse Gas Emissions and Potential for Mitigation through the Viet Nam
Green Growth Strategy 86 Household Electricity Demand in the Reference Scenario 207 Household Electricity Demand by Appliance Type in the Reference Scenario 218 Reduction of Household Electricity Demand in the Low-Carbon Scenario 239 Comparison of Energy Intensity of Selected Viet Nam Industry Sectors to Global Benchmarks 25
vi tables and Figures
Figures, continued
10 Mitigation from Five Industry Subsectors 2711 Elasticity of Electricity Demand to GDP Growth for the Reference Scenario 2812 Electricity Demand and Grid Supply in the Reference Scenario 2813 Installed Capacity, Reference Scenario 2914 Installed Capacity Mix in 2030 and 2050, Reference Scenario 3015 Generation by Category, Reference Scenario 3116 Generation Mix in 2030 and 2050, Reference Scenario 3117 Elasticity of Electricity Demand to GDP Growth for the Low-Carbon Scenario 3218 Generation in the Reference and Low-Carbon Scenarios 3219 Installed Capacity, Low-Carbon Scenario 3420 Installed Capacity Mix in 2030 and 2050, Low-Carbon Scenario 3521 Generation by Category, Low-Carbon Scenario 3622 Generation Mix in 2030 and 2050, Low-Carbon Scenario 3723 Cash Flow Expenditure in the Reference Scenario 3824 Cash Flow Expenditure in the Low-Carbon Scenario 3825 Variable Cost of Generation in Both Scenarios 3926 Electricity Levelized Cost (Capital Expense, Operating Expense, and Fuel)
and Price for the Reference and Low-Carbon Scenarios 3928 Reduction of Emissions from Electricity Generation (Supply-Side Measures Only)
in the Low-Carbon Scenario 4027 Carbon Dioxide Equivalent Emissions Intensity of Both Scenarios 4029 Projected Number of Vehicles, Reference Scenario 4230 Average Annual Kilometers per Vehicle 4231 Passenger-Kilometers and Freight-Ton-Kilometers Traveled by On-Road Vehicle Class 4332 Carbon Dioxide, Hydrocarbon, Nitrogen Oxide,
and Particulate Matter Emissions from On-Road Transportation 4433 Fuel Consumption of On-Road Transportation 4534 Transport Mode of Road, Rail, Coastal, and Inland Waterways 4735 Reference Scenario Emissions by Mode 4736 The Avoid–Shift–Improve Approach 4837 Modal Share of On-Road Mass Transit 5038 Impact of Modal Shift Policies on Two-Wheeler and Passenger-Car Annual Mileage 5139 Sales-Weighted New Car and Light Duty Carbon Dioxide Equivalent Emissions 5240 Number of Electric Motorcycles and as a Percentage of Sales 5341 Two-Wheeler Annual Consumption of Electricity 5342 Two-Wheeler Emissions per Passenger-Kilometer 5343 Mitigation from Transport 5444 Marginal Abatement Cost Curve for Household Appliances 5645 Marginal Abatement Cost Curve for Five Industry Subsectors 5746 Marginal Abatement Cost Curve for Supply-Side Measures in Electricity Generation 5947 Marginal Abatement Cost Curve for Transport 6048 Total Mitigation from Power, Industry, and Transport Sectors 6149 Overall Marginal Abatement Cost Curve 6150 Production Technology and Commodity Flows in Viet Nam under the Low-Carbon CGE Model 64
viitables and Figures
Figures, continued
51 Energy Substitution in Low-Carbon CGE Model Production Functions 6552 Annual GDP Growth Rate of Reference Scenario and Low-Carbon Scenario, 2011–2050 6853 Composition of GDP under the Modeled Scenarios 6854 Poverty Headcount Rates of Modeled Scenarios during 2011–2050 6955 Average Annual Growth Rate of Household Real Consumption by Scenario 6956 Change in Greenhouse Gas Emissions of Low-Carbon Scenario Compared
with the Reference Scenario 7057 Comparison of Reference and Low-Carbon Scenario Emissions with the Viet Nam
Green Growth Strategy Targets 72
A1 Total Electricity Consumption from Refrigerators in the Reference and Low-Carbon Scenarios 84A2 Total Electricity Consumption from Lighting in the Reference and Low-Carbon Scenarios 85A3 Total Electricity Consumption from Air Conditioning in the Reference and Low-Carbon Scenarios 85A4 Total Electricity Consumption from Water Heating in the Reference and Low-Carbon Scenarios 86A5 Adoption Rate of Energy Intensity Measures for Small-Scale Steel Producers 87A6 Total Emissions from Energy and Processes in Small-Scale Steel Plants 87A7 Adoption Rate for Energy Intensity Measures for Existing Plants of Integrated Steel Producers 88A8 Total Emissions from Energy and Processes in Integrated Steel Plants 89 A9 Adoption Rate for Energy-Efficiency Measures in the Cement Industry 89A10 Cement–Total Emissions from Energy and Processes 90A11 Adoption Rate for Efficiency Options for the Fertilizer Industry 91A12 Fertilizer–Emissions from Energy and Processes 91A13 Adoption Rate of Energy-Efficiency Measures for Refinery Production 92A14 Refining–Total Emissions from Energy and Processes 93A15 Adoption Rate of Energy-Efficiency Measures for Pulp and Paper 94A16 Pulp and Paper–Total Emissions from Energy and Processes 94
foreword
viii
Viet Nam will be strongly affected by the consequences of unmitigated climate change. As one of the first countries to ratify the United Nations Framework Convention on Climate Change, the Government of Viet Nam has also long displayed commitment to doing its part to reduce greenhouse
gas (GHG) emissions. Viet Nam was also one of the first countries to ratify the Paris Agreement on Climate Change, building on the Governments repeated support for an international climate agreement that aims to contain global warming to 2 degrees Celsius above preindustrial levels. Viet Nam’s Nationally Determined Contribution to the Paris Agreement aims for 8% reduction in GHG emissions by 2030 relying solely on domestic resources, and targets 25% reduction if sufficient international support is provided.
The Government of Viet Nam has implemented an array of national programs to help reduce the carbon intensity of growth. The 2008 National Target Program to respond to Climate Change developed an array of mitigation and adaptation measures. Subsequently, the 2011 National Climate Change Strategy focuses on more use of advanced energy technologies, improved energy efficiency, increased use of public transport and cleaner transport fuels, and afforestation. The 2012 Green Growth Strategy aims to reduce GHG emissions by up to 2% annually over the long term, and identifies 66 actions to do so. The 8th Socio-Economic Development Plan (SEDP) for 2016–2020 also commits the country to increase renewable energy generation.
This study aligns closely with the Governments policy objectives and illustrates how important goals of the Nationally Determined Contribution and Green Growth Strategy can be achieved. This research has been conducted in close coordination among experts from the Ministry of Planning and Investment, the Central Institute for Economic Management (CIEM), the Institute of Energy, the Transport Development and Strategy Institute, the World Bank, the United Nations Development Program, the Asian Development Bank (ADB) and international scholars. During study conduct, experts from Viet Nam benefited from a range of capacity building events on modeling of mitigation policies and potential.
The main message of the study is that Viet Nam may achieve substantial greenhouse gas emissions reduction at low cost if it were to take targeted mitigation actions. Moreover, Viet Nam’s economic growth is actually accelerated and made more inclusive over the longer term from taking such measures. Key mitigation actions include replacement of imported coal with renewables in the future power generation mix, increased energy efficiency in building cooling and steel production, efficient vehicle technology and increased use of public transportation.
ixForeword
The Government of Viet Nam is committed to making this mitigation potential a reality. This report can help to inform future revision of power development plans, as well as implementation of the SEDP, so that the country develops toward a low carbon future. To that end, the 2016–2020 Country Partnership Strategy with ADB identifies “improving environmental sustainability and climate change response” as one its three pillars, under which “climate change mitigation” is a focus of continued investment. Under this focus, the Government of Viet Nam looks forward to continued collaboration with ADB to increase use of renewable energy, promote energy efficiency, and reduce the carbon intensity of transport, as this report suggests.
Dr. Ph .am Hoàng Mai Director General, Science, Education, Resources and Environment Department Viet Nam Ministry of Planning and Investment
foreword
x
Viet Nam’s economic development has been rapid, with an average of 7% growth in gross domestic product over the last 2 decades. However, that growth has been energy intensive, and the carbon footprint of energy has been rising. Without dedicated policies and actions, these trends are likely
to continue. This implies that future greenhouse gas (GHG) emissions may be much higher than current levels, which still remain below the global average on a per capita basis. Moving to a low-carbon development pathway can not only benefit the global climate, but also help to make the economy more efficient and competitive, increase energy security, and generate an array of co-benefits to human health and well-being.
The Government of Viet Nam has undertaken many policy measures to promote low-carbon growth. In 2012, it adopted the Viet Nam Green Growth Strategy (VGGS), which promotes low-carbon economic development and energy efficiency, and offers the first official establishment of GHG emissions intensity reduction goals. In 2015, the country pledged to reduce GHG emissions by 8% by 2030, as compared with business as usual, with a possible reduction of 25% under international support. To help reach this goal, a Renewable Energy Development Strategy was issued in 2015 to cover the period through 2030, with a vision to 2050.
This study assesses how Viet Nam’s green growth objectives can be achieved through a detailed modeling approach that draws on extensive national stakeholder input to ensure alignment with sector plans and strategies. It assesses 63 specific measures in the four key sectors in Viet Nam that dominate GHG emissions: power generation, household electricity consumption, industry, and transportation. In line with the vision of Viet Nam’s strategies, the study focuses on the period through 2050, as many low-carbon development investments will take considerable time before their full mitigation potential is realized. The approach couples bottom–up engineering-type modeling with top–down economy-wide modeling to understand broader economic and poverty impacts.
The study affirms the tremendous GHG mitigation potential in Viet Nam at low or even negative costs. Assessed measures are found to have the potential to mitigate over 4,600 million tons of carbon dioxide equivalent (MtCO2e), with nearly zero net cost per ton of carbon dioxide equivalent (tCO2e) for the period through 2050. The vast majority of abatement is generated by the power sector, where imported coal is replaced by biomass, solar, and wind power. Transport follows next, where improvements in vehicle technology and modal shifts to public transport dominate mitigation outcomes. Industry and household sectors illustrate the potential to replace inefficient equipment, particularly for the steel industry and for building cooling, to help reduce energy needs and emissions.
xiForeword
Moreover, the study has found benefits to investing in a low-carbon future. Although there are some front-loaded investment costs, economy-wide modeling reveals that economic growth is accelerated for most of the analytical period under the low-carbon scenario. That acceleration is also found to benefit lower income populations more, so that growth is more inclusive.
We would like to thank the Government of Viet Nam for its support and suggestions throughout the implementation of this study. ADB looks forward to working with Viet Nam to further mainstream low carbon growth in a range of sectors through continued dialogue and engagement.
Yasuyuki SawadaChief Economist and Director General Economic Research and Regional Cooperation Department Asian Development Bank
aCknowledgments
xii
This report has been prepared for Viet Nam’s Ministry of Planning and Investment and the Asian Development Bank (ADB) under ADB’s regional research and development technical assistance 7645, Strengthening Planning Capacity for Low Carbon Growth in Developing Asia, which was
cofinanced by the Government of the United Kingdom and the Government of Japan. A working group—chaired by Nguyen Le Thuy, Deputy Director General of the Department of Science, Education, Natural Resources and Environment and Deputy Director of the Sustainable Development Office, Ministry of Planning and Investment (MPI); Nguyen Duc Cuong (Institute of Energy [IEVN]); and Nguyen Manh Hai (Central Institute of Economic Management [CIEM])—guided the preparation of the report. Quach Tat Quang from the Ministry of Natural Resources and Environment provided advisory support.
This report was prepared by a team including members from ADB, CIEM, and an independent expert. ADB team members include David Raitzer and Jindra Samson. CIEM members include Nguyen Manh Hai and Dang Thi Thu Hoai. John Rogers served as a team member and prepared a key background paper on the bottom-up modeling for this study. Cung Nguyen Duc prepared the Vietnamese translation of this report. Copyediting was performed by Tuesday Soriano and Joe Mark Ganaban prepared the graphic design.
Edimon Ginting, Director of the Economic Analysis and Operations Support Division of the Economic Research and Regional Cooperation Department of ADB provided guidance for the study; Suphachol Suphachalasai (formerly ADB, now with the World Bank) did the initial conceptualization; and Jindra Samson, Maria Melissa Gregorio-Dela Paz, Gee Ann Burac, Do Thuy Huong, and Roslyn Perez of ADB supported the implementation. Marife Bacate (ADB consultant) assisted with research. Rehan Kausar of the Southeast Asia Department offered valuable advice and suggestions, and Lauren Sorkin (formerly of ADB’s Viet Nam Resident Mission) helped to facilitate initial implementation, as well as collaboration with the World Bank. Previous guidance was provided by Cyn-Young Park, and Juzhong Zhang former Directors of the Economic Analysis and Operations Support Division.
The analysis was made possible with considerable assistance from research teams in Viet Nam, particularly Nguyen Duc Song (IEVN), and Nguyen Phuong Hien and Hang Thi Diem Nguyen of the Transport Development Strategy Institute (TDSI). Nguyen Thi Thanh Nga and Vo Bang Nga of the Agenda 21 Office of MPI coordinated the study’s final workshop in Ha Noi.
The report builds on the underlying reports and analysis to 2030 prepared by a World Bank team led by Pierre Audinet and consisting of Bipul Singh, Duane Kexel, Suphachol Suphachalasi, Pedzi Makube, and Kristy Mayer. It also builds on parallel work performed under ADB’s policy and advisory technical assistance
xiiiaCknowledgments
on Support for the National Target Program with a Focus on Energy and Transport, the United Nations Development Programme (UNDP) technical assistance to support the Green Growth Strategy, and UNDP technical assistance on fossil fuel subsidy reform. This earlier work contained considerable analysis and input from Ernst and Young, CIEM, IEVN, and TDSI. The Ernst and Young team was led by Shuvendu Bose. The CIEM team led by Nguyen Manh Hai consisted of Dang Thu Hoai and Ho Cong Hoa. The IEVN team was co-led by Nguyen Anh Tuan and Tran Manh Hung and was made up of Nguyen Duc Song, Nguyen Khoa Dieu Ha, Le Nguyet Hang, and Nguyen Hoang Anh. The TDSI team was led by Nguyen Thi Phuong Hien and comprised Trinh Thi Bich Thuy, Cao Thi Thu Huong, Nguyen Manh Cuong, Tran Thi Kim Thanh, Nguyen Huy Hoang, Nguyen T Diem Hang, Nguyen Hung Cuong, and La Tra Linh.
abbreviations
xiv
AC air conditioningADB Asian Development BankBAU business as usualCGE computable general equilibriumCIEM Central Institute for Economic ManagementCO2 carbon dioxideEFFECT Energy Forecasting Framework and Emissions Consensus ToolESCO energy service companyEU European UnionFTKT freight-ton-kilometer traveledGDP gross domestic productGHG greenhouse gasGJ gigajouleGJ/t gigajoule per tonGW gigawattISP integrated steel plantkg kilogramIEVN Institute of EnergyIFC International Finance Corporationkm kilometerkWh kilowatt-hourLCS low-carbon scenarioLCV light commercial vehicleLNG liquefied natural gasm2 square meterMAC marginal abatement costMACC marginal abatement cost curveMEPS minimum energy performance standardsMOIT Ministry of Industry and TradeMONRE Ministry of Natural Resource and EnvironmentMPI Ministry of Planning and InvestmentMtCO2e million tons of carbon dioxide equivalentMW megawattNDC Nationally Determined ContributionNOx nitrogen oxideOPC ordinary portland cement
xvabbreviations
PDP-VII Power Development Master Plan for 2011–2020 with outlook to 2030PKT passenger-kilometer traveledPM particulate matterPPC pozzolanic portland cementPPP purchasing power parityPV photovoltaicSMEs small and medium-sized enterprisesSSP small-scale producerTDSI Transport Development and Strategy InstituteTWh terawatt-hourUNDP United Nations Development ProgrammeUNFCCC United Nations Framework Convention on Climate ChangeUS United StatesVGGS Viet Nam Green Growth StrategyVHLSS Viet Nam Household Living Standards SurveyVOC volatile organic compoundsVREDS Viet Nam Renewable Energy Development Strategy
eXeCutive summarY
xvi
Viet Nam’s economy is becoming more carbon intensive Viet Nam has developed rapidly over the past decades. However, the development of Viet Nam’s renewable energy supply (mainly hydro and biomass) has not kept pace with the needs of its economy, which has grown to rely on higher carbon energy. In 1990, over 60% of electricity was produced from hydropower and more than 70% of total energy consumption was low-carbon. By 2010, this situation had reversed with only 30% of electricity produced from hydroelectric power and over 70% of total energy consumption from fossil fuels.
Greenhouse gas emissions growth will continue to be rapid without a change of course Under a growing economy, emissions are poised to increase rapidly. As shown in this study, Viet Nam’s economy could expand by almost 14 times in real terms over the 4 decades between 2010 and 2050 under the 7% annual economic growth targeted by the Government of Viet Nam. Viet Nam’s population may grow from 85 million to over 105 million, and lifestyles will change from mainly rural to predominantly urban. Gross domestic product (GDP) per capita over this period could increase over 10 times, with the greatest growth in urban areas. As a result of this growth and an increasingly carbon-intensive energy mix, energy-associated emissions may also have a 10-fold increase between 2010 and 2050.
The Government of Viet Nam recognizes the need for low emissions growth To achieve rapid economic growth that is sustainable, a change of course in the energy sector is needed. The Government is aware of these challenges. The approvals of Viet Nam’s National Climate Change Strategy in 2011 and the Viet Nam Green Growth Strategy (VGGS) in 2012, as well as submission of a Nationally Determined Contribution (NDC) to the Paris Agreement, underscore the Government’s commitment to low-carbon development.
A low-carbon development pathway is feasible This study uses the current sectoral master plans, particularly the National Master Plan on Power Development, as its reference. It applies a detailed bottom–up analysis of household electricity demand; emissions from five energy-intensive industries; on-road, rail, inland waterway, and coastal transport; and the power sector—electricity generation—to identify a possible alternative low-carbon development scenario.
This study covers most of the energy sector and all the areas from which a marked increase in greenhouse gas (GHG) emissions can be expected over the time frame to 2050. It evaluates 63 measures to reduce GHG emissions from the energy sector and process emissions from five industries. The greatest mitigation contribution of nearly 500 million tons of carbon dioxide equivalent (MtCO2e) in 2050 comes from the power sector, based on efficiency measures that reduce the demand for electricity and a strong move toward low-carbon generation options on the supply side.
xviieXeCutive summarY
Viet Nam can meet or exceed its mitigation targets The modeled low-carbon pathway exhibits a mitigation of 7% in 2020, compared with a VGGS target of 10%. In 2030, the modeled pathway exhibits a mitigation of 18% compared with a VGGS target of 20% and, in 2050, a mitigation of 53% compared with a VGGS target of 50%. Compared with the NDC, it has nearly the same relative emissions reduction as the contribution under international support (25% reduction), and represents a lower level of 2030 emissions, due to a lower reference emission level. This suggests that national mitigation targets are achievable.
Ambitious mitigation can save costs Application of the 63 measures reduces CO2e emissions from 2010 to 2050 by over 4,600 million tons with an average mitigation cost of –$1 per ton of CO2e and a leveling off of annual GHG emissions at around 500 million tons per year from 2035 onward. Over 75% of the total mitigation can be achieved with a negative or zero mitigation cost.
The study demonstrates that a low-carbon development pathway can be economically attractive, requiring lower investment, fuel, and operating expenses in the sectors that were evaluated than in a business-as-usual “reference scenario” based on sector development plans. In the low-carbon scenario, cash flow expenditures ultimately fall because of reduced expenditure on fuel, particularly imported coal. By 2050, fossil fuel consumption in the low-carbon scenario (in million tons of oil equivalent) is approximately half that of the reference scenario.
Low-carbon development can accelerate economic growth To assess broader economic impacts, the study applies the low-carbon scenario in a computable general equilibrium model of Viet Nam’s economy. This finds some initial costs from investment requirements, which are more than offset by faster economic growth and a larger economy after 2030. The effect of growth is inclusive, as poorer populations have larger relative gains in consumption than those with higher income.
A less carbon-intensive power sector is critical to reducing emissions Power generation changes contribute more than 70% of the total mitigation potential over 2010–2050. This sector has lower GHG emissions in the low-carbon scenario than in the reference scenario because of supply-side measures and reduced demand resulting from energy-efficiency measures. End-user energy-efficiency measures contribute 15% of this reduction, while the remainder is brought about by changes in electricity generation. This study evaluates 12 supply-side measures to reduce GHG emissions, including increasing generation from biomass, solar, onshore wind, and microhydro. Together, these generate a total mitigation of nearly 3,000 MtCO2e at a negative weighted average marginal abatement cost. Under the low-carbon scenario, the direct cost of electricity generation is reduced in the future, while energy security is enhanced.
Saving household energy is a low cost mitigation strategy Electricity demand-side measures including increased household appliance efficiency coupled with building improvements add 400 MtCO2e of mitigation potential over 2010–2050. Over the 40- year analytical time frame, the greatest increase in electricity demand from households is expected to result from widespread adoption of air conditioning. To stem the demands of increasing air conditioning use on the grid, particularly from 2035 onward, simple building retrofit measures—such as low-e window glazing, window shades, and ceiling fans, plus hybrid solar/electric water heating—become cost-efficient mitigation techniques that should be considered together with comparable building standards for new construction.
xviii eXeCutive summarY
Improving appliance energy efficiency through mandatory standards costs less than increasing generation capacity. Linking such standards directly to those of a larger market can simplify implementation for both the national agency and for manufacturers involved.
There is substantial potential to enhance industrial energy efficiency A strong industrial energy-efficiency program could help Viet Nam realize these mitigation opportunities and follow through with supportive regulations, institutional frameworks, and financing until these are achieved. The energy-efficiency measures studied in five high-energy-consuming industries (iron and steel, cement, fertilizer, refining, and pulp and paper) contributed a total mitigation of over 600 MtCO2e in 2010–2050 at an overall average mitigation cost of $2/tCO2e. Of this, almost 80% of emissions savings through energy-efficiency measures come from power generation from waste heat recovered in large integrated iron and steel and cement plants. Fiscal measures, support to Energy Service Company markets, improved analysis of energy-efficiency performance, and better information dissemination can help to achieve these improvements.
Transport mitigation is important both to climate change and to quality of life Private car ownership may grow thirty-five-fold from 2010 to 2050, with attendant potential greenhouse gas and pollution emissions increases. Transport sector measures account for nearly 15% of the total 2010–2050 mitigation (contributing a reduction of 650 MtCO2e over this period). Of the 10 packages of measures considered, improving vehicle technology, biofuel use, and modal shifts from private motorized vehicles to public transit provided 540 MtCO2e of mitigation.
In future years, GHG emissions per passenger-kilometer from electric two-wheelers can effectively compete with those from public transit. However, promoting an aggressive modal shift to mass transit is still critical to health, quality of life, and urban development. Even if one-half of all motorized passenger-kilometers were handled by mass transit, total passenger-car kilometers in 2050 could be similar to that of two-wheelers in recent years, while two-wheeler vehicle kilometers may double, with severe implications for congestion, health, and productivity. Urban planning may actively promote mass transit, discourage car ownership and use within cities, and reduce the need to travel.
A low-carbon transition depends upon establishing the right enabling conditions Low-carbon development depends upon realigning incentives. Previously, Viet Nam had subsidies for fossil fuels for the power sector. Under the National Master Plan on Power Development, these subsidies are being removed, with a commensurate increase in the price of electricity to cover its cost of generation. More broadly, decarbonization will require sustained political commitment that transcends master plans to lower barriers to energy efficiency and attract investment in green growth and low-carbon development opportunities.
1. IntroductIon
1
1.1 A Low-Carbon Future Matters for Viet Nam
Viet Nam is among the world’s most vulnerable countries to unmitigated climate change. With a long, low-lying
coastline in the “typhoon belt” of Southeast Asia, the country has been ranked eighth highest globally in terms of climate vulnerability over the 1996-2015 period (Kreft et al. 2016).
The largest source of recent disaster losses in Viet Nam has been flooding, and climate change will exacerbate this risk (UNISDR 2015). As climate change progresses, precipitation is expected to become more concentrated, variable and extreme. Even as total rainfall increases, the length of the dry season is expected to grow, so that there is increased risk both from flooding and from drought (MONRE 2010).
These effects will be compounded by sea-level rise, which poses a particularly high risk to Viet Nam, due to its combination of large delta regions and an extensive coast. Sea-level rise will not only directly inundate land and assets, but will also increase damage from storm surges and flooding. As early as 2030, $250 billion in assets may already be at risk from flooding expansion under climate change (Rutten et al. 2014).
Agriculture, which accounted for 44% of national employment in 2015, is especially threatened. Increased heat stress from longer periods of peak temperatures will adversely affect crops and livestock, and drought losses will be exacerbated by prolonged dry seasons. Only considering precipitation, radiation and temperature effects,
Nelson et al. (2010) found more than 10% yield reduction for irrigated rice, the main staple crop, in 2050 under the “balanced growth” A1B climate change scenario. In addition, over 2,000,000 hectares of agricultural land are threatened by the effects of sea level rise, storm surges and related salinity intrusion (Wassmann et al. 2004), and projections of production losses due to salinity and inundation are approximately twice those of temperature, radiation and rainfall effects alone (Yu et al. 2010). Moreover, the periods over which humidity adjusted temperatures exceed limits for intense human physical activity will grow, limiting labor availability for agricultural operations (Kjellstrom et al. 2009).
Beyond agriculture, temperature increases under the A1B scenario may lead to 13% increased energy demand by 2050, as more cooling is needed (Raitzer et al. 2015). Tourism will suffer, as the climate becomes less ideal for tourist arrivals, which may be reduced by 12% by 2050. Catastrophic risk to infrastructure, assets, ecosystems, and human safety will rise along with increased storm damage. Collectively considering a range of effects, climate change may push over 1,000,000 people in Viet Nam into extreme poverty already by 2030, and many more thereafter (Rozenberg and Hallegatte 2016).
Minimizing these adverse impacts depends on concerted action to address climate change. Although adaptation is important for those effects that cannot be avoided, the first best solution is mitigation to minimize global warming. Viet Nam has important potential to contribute to achieving a low- carbon future for the world, which is very much in its own interest.
2 PathwaYs to low-Carbon develoPment For viet nam
1.2 Viet Nam’s Energy and Emissions Context
Historically, Viet Nam has not been a major contributor to climate change. However, the country’s rapid economic growth, in the context of an increasingly carbon intensive energy system, is changing this situation. Over the last 2 decades, Viet Nam doubled its gross domestic product (GDP) per capita with an average GDP growth rate of about 7%. Between 2010 and 2020, despite the global economic downturn, the Government of Viet Nam is targeting to again double GDP per capita while increasing per capita income at an even faster rate of 10% annually.
Over recent decades, growth has been resource-intensive, with relatively little diversification and value added in exports. In addition, high fossil fuel subsidies and low energy prices have undermined investment in the energy sector and discouraged efficient use of energy. The economy has also exhibited macroeconomic turbulence with double-digit inflation and loss of international reserves.
One threat to market competitiveness has been that power generation has had problems keeping pace with the growing demand. In 1990, almost three-quarters of primary energy consumption were from nonfossil fuels and over 60% of electricity came from hydroelectric generation. By 2010—the base year for this study—the situation had reversed with over 70% of total energy consumption coming from fossil fuels and less than one-third of electricity from hydro. The national supply of coal is projected to grow at a lower rate than the increase in electricity demand, resulting in a growing dependence on imported fuels that are rapidly increasing in cost. This raises energy security concerns and makes improving the economy’s energy efficiency more critical than ever.
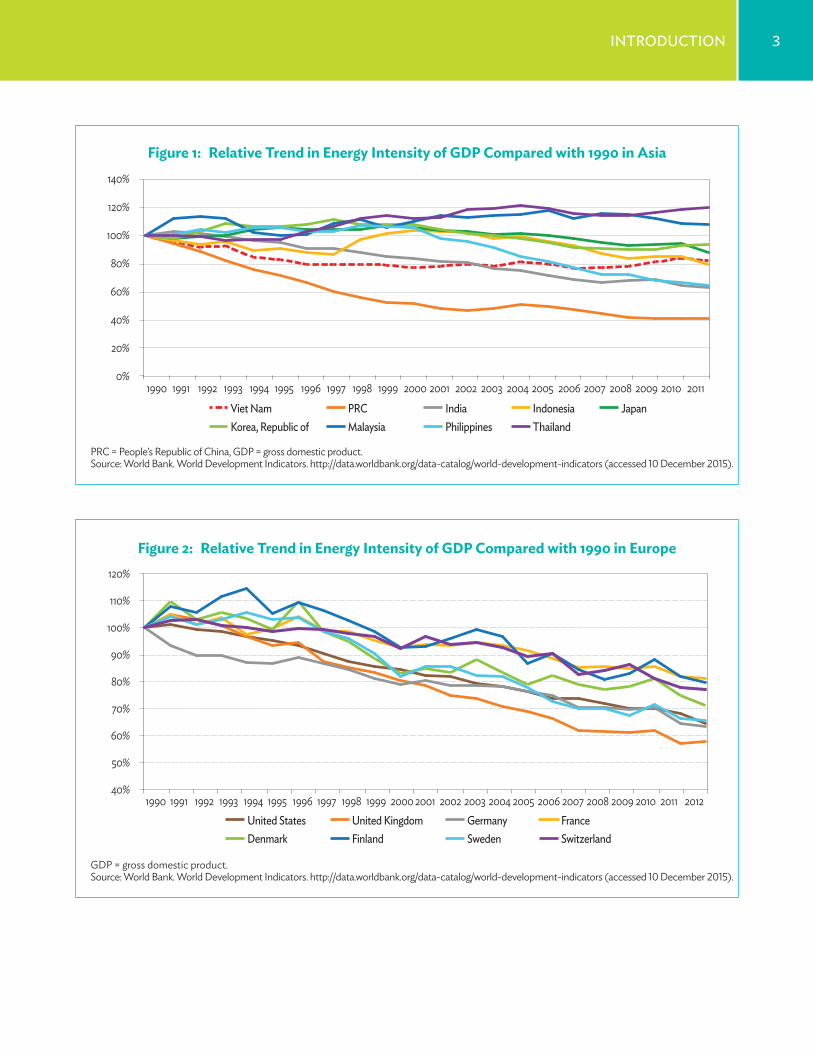
In terms of energy intensity improvement, Viet Nam has surpassed many Asian economies. In 1990, about 180 kilograms of oil equivalent of
energy was required to generate $1,000 of GDP (at constant 2011 purchasing power parity [PPP]), while in 2011, only 148 kilograms of oil equivalent of energy was required to generate $1,000 of GDP. Figure 1 shows that Viet Nam had improved its energy intensity by 2011 (from a base year of 1990) more than many Asian nations, except for People’s Republic of China, India, and the Philippines. However, highly developed economies that could be Viet Nam’s future clients for high value-added production are progressing even more consistently (see Figure 2), which may indicate a possible slow erosion of competitiveness.
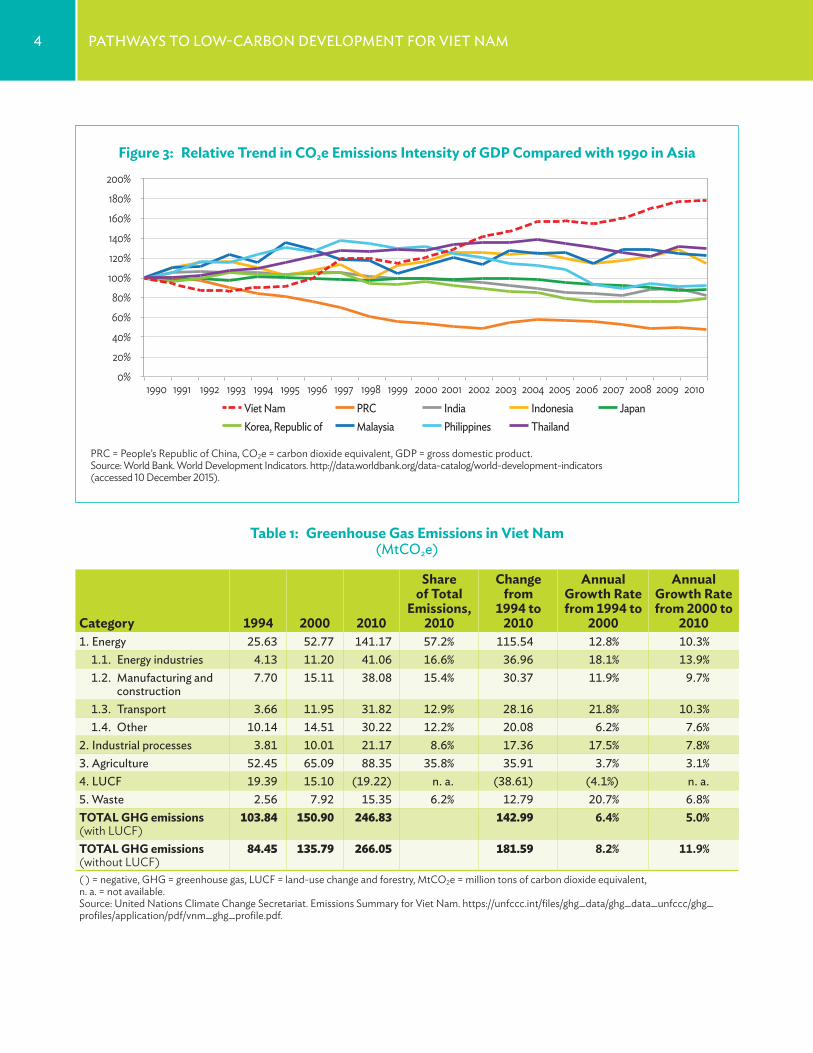
Despite this improvement in energy intensity, Viet Nam exhibited the fastest growth in carbon dioxide equivalent (CO2e) emissions intensity in the region over this same period, largely because of a growing dominance of coal in the energy mix. Viet Nam’s total emissions increased seven times and per capita emissions more than tripled while the carbon intensity of GDP increased by 78% (Figure 3)—a relative increase in CO2e emissions greater than that observed in all regional comparators including the People’s Republic of China, India, and the Republic of Korea.
This means that Viet Nam’s greenhouse gas (GHG) emissions are rising rapidly (Table 1), albeit from low per capita levels. In 2010, GHG emissions per capita were below the global average at 2.84 tons of carbon dioxide equivalent (tCO2e). At the same time, non-land-use emissions grew by 12% annually between 2000 and 2010, more rapidly than the 8% growth between 1994 and 2000. This increasing growth is attributed to emissions from energy, particularly in the power sector and other energy industries, manufacturing, and transportation, all of which have annual growth rates of 10% or more, as well as growth in emissions from industrial processes. These sectors generate the bulk of emissions, with 65% of 2010 emissions from energy and industry. Unless Viet Nam takes action toward low-carbon development, it may become a much bigger contributor to climate change in the future.
3introduCtion
0%
20%
40%
60%
80%
100%
120%
140%
1990 1991 1992 1993 1994 1995 1996 1997 1998 1999 2000 2001 2002 2003 2004 2005 2006 2007 2008 2009 2010 2011 Viet Nam PRC India Indonesia Japan Korea, Republic of Malaysia Philippines Thailand
PRC = People’s Republic of China, GDP = gross domestic product.Source: World Bank. World Development Indicators. http://data.worldbank.org/data-catalog/world-development-indicators (accessed 10 December 2015).
Figure 1: Relative Trend in Energy Intensity of GDP Compared with 1990 in Asia
40%
50%
60%
70%
80%
90%
100%
110%
120%
1990 1991 1992 1993 1994 1995 1996 1997 1998 1999 2000 2001 2002 2003 2004 2005 2006 2007 2008 2009 2010 2011 2012 United States United Kingdom Germany France Denmark Finland Sweden Switzerland
GDP = gross domestic product.Source: World Bank. World Development Indicators. http://data.worldbank.org/data-catalog/world-development-indicators (accessed 10 December 2015).
Figure 2: Relative Trend in Energy Intensity of GDP Compared with 1990 in Europe
4 PathwaYs to low-Carbon develoPment For viet nam
0% 20% 40% 60% 80%
100% 120% 140% 160% 180%
200%
1990 1991 1992 1993 1994 1995 1996 1997 1998 1999 2000 2001 2002 2003 2004 2005 2006 2007 2008 2009 2010 Viet Nam PRC India Indonesia Japan Korea, Republic of Malaysia Philippines Thailand
PRC = People’s Republic of China, CO2e = carbon dioxide equivalent, GDP = gross domestic product.Source: World Bank. World Development Indicators. http://data.worldbank.org/data-catalog/world-development-indicators (accessed 10 December 2015).
Figure 3: Relative Trend in CO2e Emissions Intensity of GDP Compared with 1990 in Asia
Table 1: Greenhouse Gas Emissions in Viet Nam (mtCo2e)
Category 1994 2000 2010
Share of Total
Emissions, 2010
Change from
1994 to 2010
Annual Growth Rate from 1994 to
2000
Annual Growth Rate from 2000 to
20101. energy 25.63 52.77 141.17 57.2% 115.54 12.8% 10.3% 1.1. energy industries 4.13 11.20 41.06 16.6% 36.96 18.1% 13.9% 1.2. manufacturing and
construction7.70 15.11 38.08 15.4% 30.37 11.9% 9.7%
1.3. transport 3.66 11.95 31.82 12.9% 28.16 21.8% 10.3% 1.4. other 10.14 14.51 30.22 12.2% 20.08 6.2% 7.6%2. industrial processes 3.81 10.01 21.17 8.6% 17.36 17.5% 7.8%3. agriculture 52.45 65.09 88.35 35.8% 35.91 3.7% 3.1%4. luCF 19.39 15.10 (19.22) n. a. (38.61) (4.1%) n. a.5. waste 2.56 7.92 15.35 6.2% 12.79 20.7% 6.8%TOTAL GHG emissions (with LUCF)
103.84 150.90 246.83 142.99 6.4% 5.0%
TOTAL GHG emissions (without LUCF)
84.45 135.79 266.05 181.59 8.2% 11.9%
( ) = negative, GHG = greenhouse gas, LUCF = land-use change and forestry, MtCO2e = million tons of carbon dioxide equivalent, n. a. = not available.Source: United Nations Climate Change Secretariat. Emissions Summary for Viet Nam. https://unfccc.int/files/ghg_data/ghg_data_unfccc/ghg_profiles/application/pdf/vnm_ghg_profile.pdf.
5introduCtion
In 2011, the National Climate Change Strategy was created, outlining the country’s objectives for 2011 through 2050. Most strategy measures relate to adaptation, but there is a strong mitigation component as well, which focuses on developing and deploying advanced energy technologies, promoting public transport and low-carbon fuels for transportation, and improving energy efficiency and afforestation.
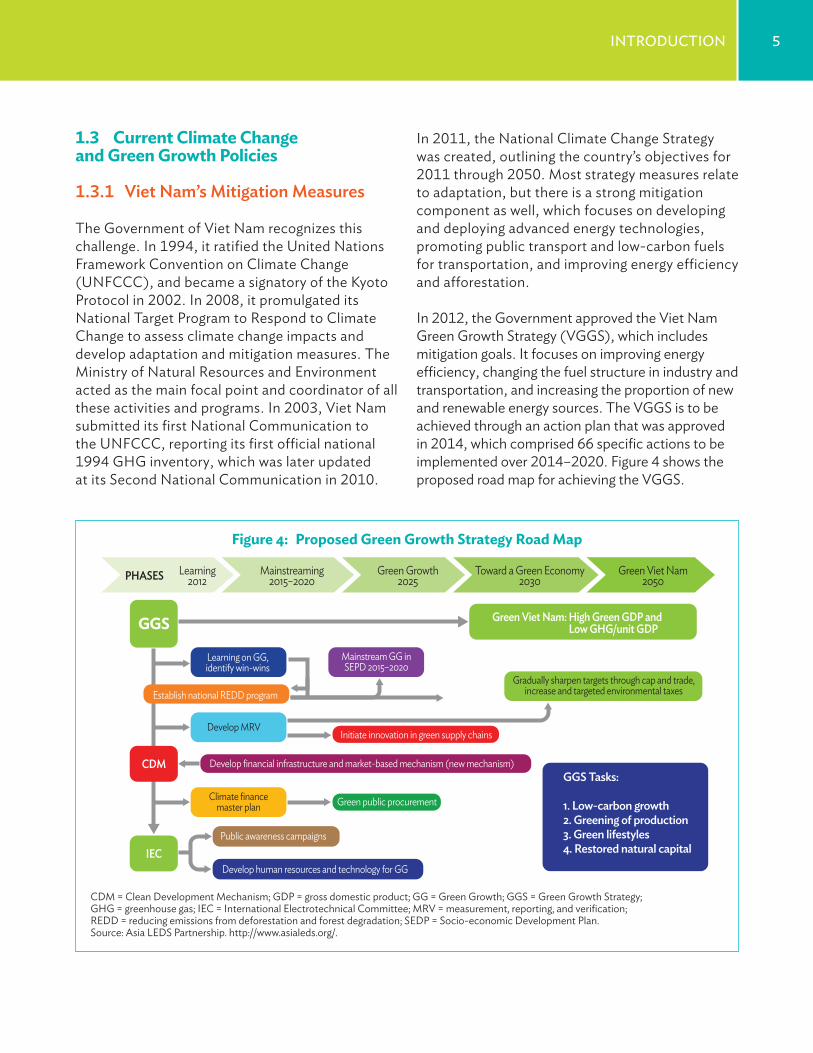
In 2012, the Government approved the Viet Nam Green Growth Strategy (VGGS), which includes mitigation goals. It focuses on improving energy efficiency, changing the fuel structure in industry and transportation, and increasing the proportion of new and renewable energy sources. The VGGS is to be achieved through an action plan that was approved in 2014, which comprised 66 specific actions to be implemented over 2014–2020. Figure 4 shows the proposed road map for achieving the VGGS.
1.3 Current Climate Change and Green Growth Policies
1.3.1 viet nam’s mitigation measures
The Government of Viet Nam recognizes this challenge. In 1994, it ratified the United Nations Framework Convention on Climate Change (UNFCCC), and became a signatory of the Kyoto Protocol in 2002. In 2008, it promulgated its National Target Program to Respond to Climate Change to assess climate change impacts and develop adaptation and mitigation measures. The Ministry of Natural Resources and Environment acted as the main focal point and coordinator of all these activities and programs. In 2003, Viet Nam submitted its first National Communication to the UNFCCC, reporting its first official national 1994 GHG inventory, which was later updated at its Second National Communication in 2010.
PHASES Learning2012
Mainstreaming2015–2020
Learning on GG,identify win-wins
Mainstream GG inSEPD 2015–2020
Green public procurement
Public awareness campaigns
Develop human resources and technology for GG
Climate financemaster plan
Gradually sharpen targets through cap and trade,increase and targeted environmental taxes
GGS Tasks:
1. Low-carbon growth2. Greening of production3. Green lifestyles4. Restored natural capital
Establish national REDD program
Develop MRVInitiate innovation in green supply chains
Develop financial infrastructure and market-based mechanism (new mechanism)
IEC
Green Growth2025
Toward a Green Economy2030
Green Viet Nam2050
Green Viet Nam: High Green GDP and Low GHG/unit GDPGGS
CDM
Figure 4: Proposed Green Growth Strategy Road Map
CDM = Clean Development Mechanism; GDP = gross domestic product; GG = Green Growth; GGS = Green Growth Strategy; GHG = greenhouse gas; IEC = International Electrotechnical Committee; MRV = measurement, reporting, and verification; REDD = reducing emissions from deforestation and forest degradation; SEDP = Socio-economic Development Plan. Source: Asia LEDS Partnership. http://www.asialeds.org/.
6 PathwaYs to low-Carbon develoPment For viet nam
At the 21st Conference of the Parties to the UNFCCC in Paris, the Government reaffirmed its goal to contribute actively to the global objective of climate change mitigation, based on domestic capacity and international support. In the Nationally Determined Contribution (NDC), Viet Nam has defined its mitigation goals over 2021–2030, with the unconditional objectives of (i) 8% reduction in emissions by 2030 relative to a BAU scenario; and (ii) a 20% reduction in emissions intensity (emissions per unit of GDP) against 2010 levels. With international support in the form of financing, capacity building, and technology transfer, this may rise to as much as a 25% reduction. Under this conditional target, the emissions intensity reduction increases to 30%.
To define how mitigation goals will be achieved, 10 measures were identified in the NDC (Table 2), of which 3 relate to the energy sector, 2 to land use, 1 on waste, and the other 4 are crosscutting. The energy measures focus on adoption of improved technology for energy efficiency in the residential, trade, and services sectors; shifts of transport modalities toward public transport and increased use of rail; and improved transport fuel efficiency and emissions standards. These are complemented by encouraging the use of cleaner fuels, increased use of natural and liquid petroleum gas in public transport, and elimination of fossil fuel subsidies. Promoting renewable energy by developing the renewable energy technology market and supporting research and deployment of advanced energy technologies will in part diversify energy use away from fossil fuels.
The VGGS specifies the following targets to reduce the emissions intensity of the economy:
ɂ For 2011–2020: Reduce the intensity of GHG emissions by 8%–10% as compared with the 2010 base, energy emissions by 10%–20% compared with business as usual (BAU) with the upper bound dependent on international support, and energy consumption per unit of GDP by 1%–1.5% per year.
ɂ Orientation toward 2030: Reduce GHG emissions by 1.5%–2% per year, reduce GHG emissions in the energy sector by 20%–30% compared with BAU (the upper bound is dependent on international support).
ɂ Orientation toward 2050: Reduce GHG emissions by 1.5%–2% per year.
It also aims to adjust sectoral master plans to ensure that (i) natural resources are used economically and efficiently; (ii) development of green industry and green agriculture is encouraged; (iii) investment in natural capital is enhanced; and (iv) pollution is actively controlled and treated.
Key goals toward 2020 are as follows:
ɂ Increase the value of high-tech and green-tech products to 42%–45% of GDP.
ɂ Increase the proportion of manufacturing facilities that meet environment standards to 80%.
ɂ Apply clean technology and development investment to protect the environment and enrich natural capital to a value of 3%–4% of GDP.
7introduCtion
version, by 2030, 53% of power generation will be from coal, with only 132 TWh from hydropower and renewable energy sources.
At the same time, the Government recognizes an ambition to develop renewable energy, although this is not yet framed as a commitment. In 2015, the Viet Nam Renewable Energy Development Strategy (VREDS) to 2030 and outlook up to 2050 was approved. According to this new strategy, the development and upscaling of renewable energy sources will help the country achieve its mitigation and green growth goals.
VREDS aims to maintain renewable energy’s share of primary energy constant at approximately 32% through 2050, even as energy generation rises rapidly to 44% by 2050. Of this share, a large portion is to be achieved in the electricity sector, where the renewable (including hydropower) share is constant at more than 30% through 2030 and will grow to 43% by 2050. Within electricity, rapid scaling up of biomass, wind, and solar power offsets a declining share of hydropower over time, as hydropower development cannot keep pace with increasing electricity demand. Outside of electricity, solar heating, biomass heating, and biofuels make up increasing shares of primary energy.
1.3.2 energy sector Policies
In 2011, Viet Nam approved the National Master Plan on Power Development (PDP-VII), which lays out a scenario of rapidly increasing electricity demand, supplied mostly by fossil fuels. Under PDP- VII, power generation rises from between 194 and 210 terrawatt-hours (TWh) in 2015, to between 695 and 834 TWh in 2030. Most of this rapid growth is to be fed by fossil fuels, which are to account for 73.6% of 2030 domestic generation, with coal dominant at 58.6%. The rationale for rapid expansion is 8.0% GDP growth from 2016 to 2020, followed by 7.8% GDP growth thereafter, combined with an elasticity of electricity demand to GDP that is above 1 until 2020.
It has been increasingly recognized that PDP-VII overestimated increases in power demand, largely due to overoptimistic GDP growth assumptions. From 2013, adjustments to PDP-VII started to be assessed. These led, in mid 2016, to PDP-VII-Revised to reflect lower levels of demand resulting from lower rates of economic growth than previously anticipated. By 2030, power generation is expected to rise to 572 TWh, rather than approximately 700 TWh under the original PDP-VII. However, the revised version retains a fossil-fuel–dominated mix. Even under the revised
Table 2: Viet Nam’s Priority Mitigation Actions to Meet Nationally Determined Contribution Pledges
1. strengthen the leading role of the state in responding to climate change.2. improve effectiveness and efficiency of energy use, reducing energy consumption.3. Change the fuel structure in industry and transportation.4. Promote effective exploitation and increase the proportion of new and renewable energy sources in energy production and
consumption.5. reduce greenhouse gas emissions through the development of sustainable agriculture, and improve the effectiveness and
competitiveness of agricultural production.6. manage and develop sustainable forests, and enhance carbon sequestration and environmental services; conserve
biodiversity associated with livelihood development and income generation for communities and forest-dependent people.7. waste management.8. Communication and awareness raising.9. enhance international cooperation.10. monitoring and evaluation.Source: UNFCCC (2016). Available at http://www4.unfccc.int/Submissions/INDC/Published%20Documents/Viet%20Nam/1/VIETNAM’S%20INDC.pdf.
8 PathwaYs to low-Carbon develoPment For viet nam
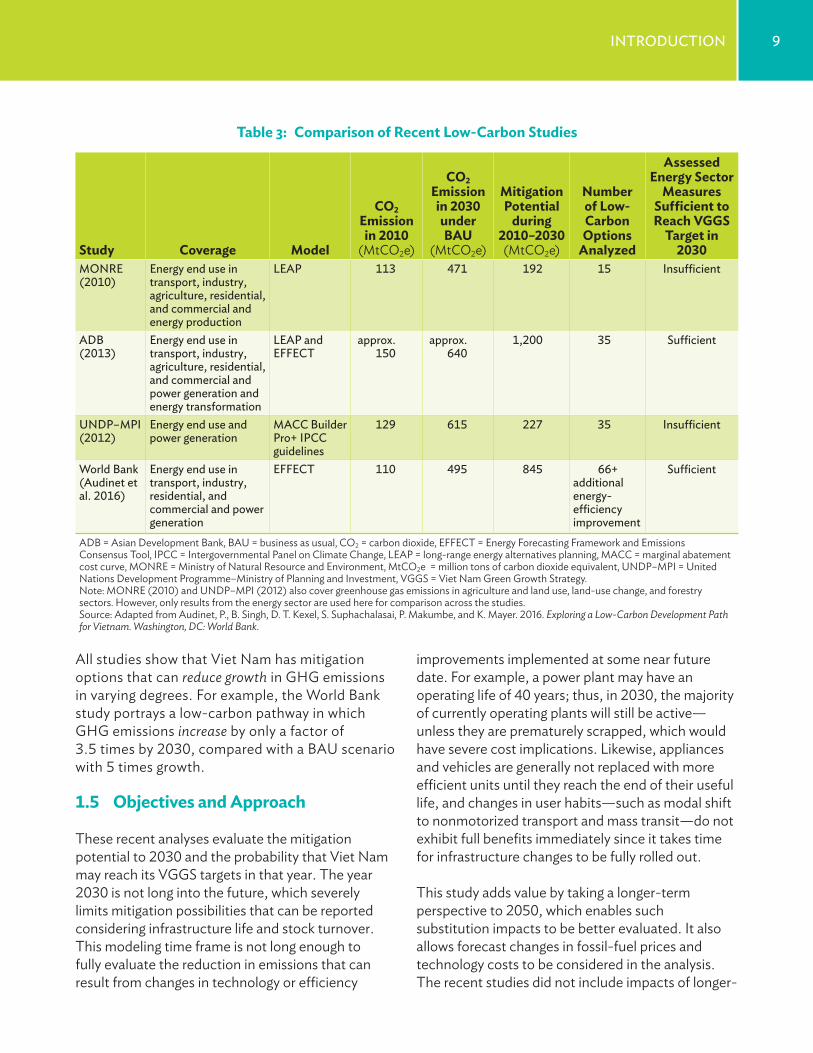
The Government has worked with international and bilateral agencies to assess low-carbon development options as part of several assessments, such as Viet Nam’s 2nd National Communication to the UNFCCC (MONRE 2010); the draft Technical Working Paper on GHG Emissions, Scenarios, and Mitigation Potentials in the Energy and Transport Sectors of Viet Nam (von Hippel et al. 2013); and the Background Analysis of Marginal Abatement Costs for the Green Growth Strategy (UNDP–MPI unpublished).
In 2016, the World Bank produced a report (Audinet et al. 2016) using a version of the Energy Forecasting Framework and Emissions Consensus Tool (EFFECT) produced in collaboration with this study, but with a focus on the period through 2030. A comparative analysis between these studies and the World Bank’s study suggests (i) a broad convergence of results—pointing to a consistent set of low-carbon actions, and (ii) the complementarity of the studies that can be viewed as a sensitivity analysis of one another. Table 3 provides a snapshot of key features and outcomes of the four studies.
The 2011 Law on Economical and Efficient Use of Energy and Measures, the Viet Nam Energy Efficiency and Conservation Program, and the National Target Program for Energy Efficiency and Conservation which was passed in 2012, are intended to promote demand-side energy-efficiency targets, such as saving 5%–8% of total national energy consumption in 2012–2015. This would be achieved by promoting the use of energy-efficient equipment, enforcing energy-efficiency management for new buildings, and establishing minimum energy performance standards for industries and public transport development.
Viet Nam thus faces a crossroad—it can continue on a pathway to energy-intensive, fossil fuel–driven growth, with a rapidly rising carbon footprint, as illustrated in plans under the original PDP-VII. Or it can follow an alternative potential future driven by green growth, as enumerated in the ambitions of the VGGS, the NDC, and VREDS. Better understanding of what the green growth pathway entails, how it can be achieved, and what it means for the economy is important for identifying how and with what consequences the country can pursue the low-carbon path.
1.4 Results of Recent Low-Carbon Analytical Work
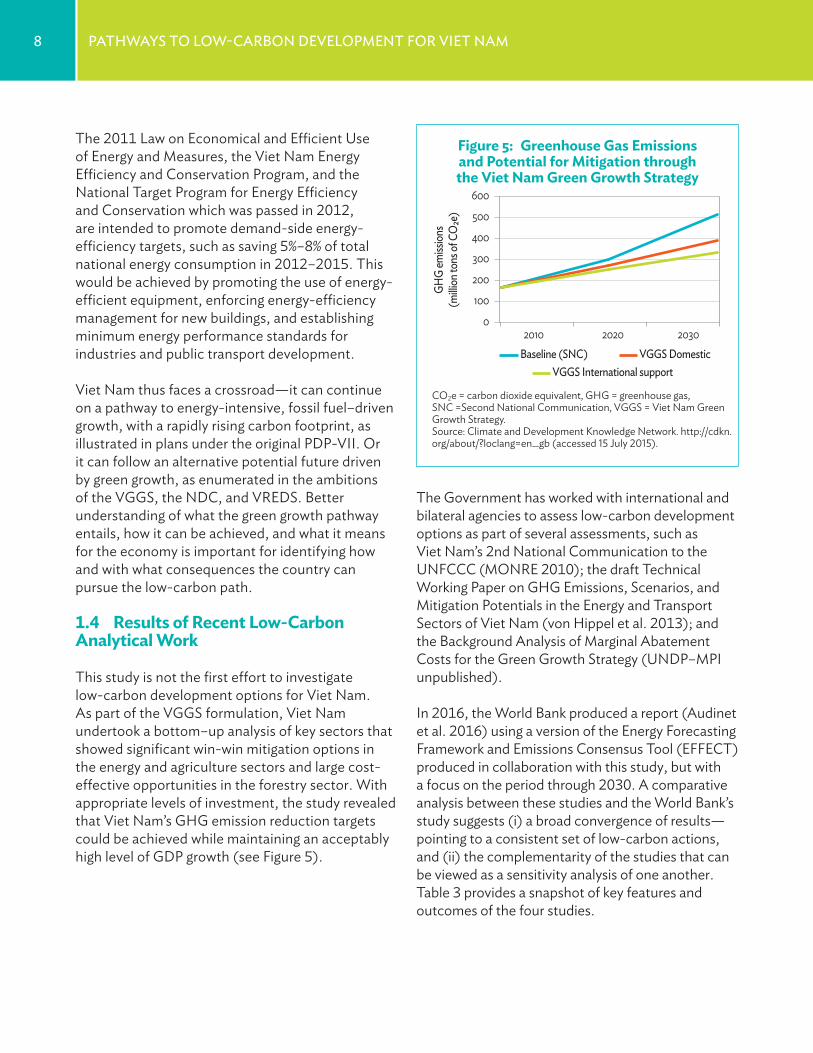
This study is not the first effort to investigate low-carbon development options for Viet Nam. As part of the VGGS formulation, Viet Nam undertook a bottom–up analysis of key sectors that showed significant win-win mitigation options in the energy and agriculture sectors and large cost-effective opportunities in the forestry sector. With appropriate levels of investment, the study revealed that Viet Nam’s GHG emission reduction targets could be achieved while maintaining an acceptably high level of GDP growth (see Figure 5).
0
100
200
300
400
500
600
2010 2020 2030
GHG
emiss
ions
(milli
on to
ns of
CO
2e)
Baseline (SNC) VGGS Domestic VGGS International support
Figure 5: Greenhouse Gas Emissions and Potential for Mitigation through the Viet Nam Green Growth Strategy
CO2e = carbon dioxide equivalent, GHG = greenhouse gas, SNC =Second National Communication, VGGS = Viet Nam Green Growth Strategy.Source: Climate and Development Knowledge Network. http://cdkn.org/about/?loclang=en_gb (accessed 15 July 2015).
9introduCtion
Table 3: Comparison of Recent Low-Carbon Studies
Study Coverage Model
CO2 Emission in 2010
(MtCO2e)
CO2 Emission in 2030 under BAU
(MtCO2e)
Mitigation Potential
during 2010–2030 (MtCO2e)
Number of Low-Carbon Options
Analyzed
Assessed Energy Sector
Measures Sufficient to Reach VGGS
Target in 2030
monre (2010)
energy end use in transport, industry, agriculture, residential, and commercial and energy production
leaP 113 471 192 15 insufficient
adb (2013)
energy end use in transport, industry, agriculture, residential, and commercial and power generation and energy transformation
leaP and eFFeCt
approx. 150
approx. 640
1,200 35 sufficient
undP–mPi (2012)
energy end use and power generation
maCC builder Pro+ iPCC guidelines
129 615 227 35 insufficient
world bank (audinet et al. 2016)
energy end use in transport, industry, residential, and commercial and power generation
eFFeCt 110 495 845 66+ additional energy-efficiency improvement
sufficient
ADB = Asian Development Bank, BAU = business as usual, CO2 = carbon dioxide, EFFECT = Energy Forecasting Framework and Emissions Consensus Tool, IPCC = Intergovernmental Panel on Climate Change, LEAP = long-range energy alternatives planning, MACC = marginal abatement cost curve, MONRE = Ministry of Natural Resource and Environment, MtCO2e = million tons of carbon dioxide equivalent, UNDP–MPI = United Nations Development Programme–Ministry of Planning and Investment, VGGS = Viet Nam Green Growth Strategy. Note: MONRE (2010) and UNDP–MPI (2012) also cover greenhouse gas emissions in agriculture and land use, land-use change, and forestry sectors. However, only results from the energy sector are used here for comparison across the studies.Source: Adapted from Audinet, P., B. Singh, D. T. Kexel, S. Suphachalasai, P. Makumbe, and K. Mayer. 2016. Exploring a Low-Carbon Development Path for Vietnam. Washington, DC: World Bank.
All studies show that Viet Nam has mitigation options that can reduce growth in GHG emissions in varying degrees. For example, the World Bank study portrays a low-carbon pathway in which GHG emissions increase by only a factor of 3.5 times by 2030, compared with a BAU scenario with 5 times growth.
1.5 Objectives and Approach
These recent analyses evaluate the mitigation potential to 2030 and the probability that Viet Nam may reach its VGGS targets in that year. The year 2030 is not long into the future, which severely limits mitigation possibilities that can be reported considering infrastructure life and stock turnover. This modeling time frame is not long enough to fully evaluate the reduction in emissions that can result from changes in technology or efficiency
improvements implemented at some near future date. For example, a power plant may have an operating life of 40 years; thus, in 2030, the majority of currently operating plants will still be active—unless they are prematurely scrapped, which would have severe cost implications. Likewise, appliances and vehicles are generally not replaced with more efficient units until they reach the end of their useful life, and changes in user habits—such as modal shift to nonmotorized transport and mass transit—do not exhibit full benefits immediately since it takes time for infrastructure changes to be fully rolled out.
This study adds value by taking a longer-term perspective to 2050, which enables such substitution impacts to be better evaluated. It also allows forecast changes in fossil-fuel prices and technology costs to be considered in the analysis. The recent studies did not include impacts of longer-
10 PathwaYs to low-Carbon develoPment For viet nam
(iii) identify policy and technical measures that can help realize mitigation potential.
This report describes two possible scenarios covering Viet Nam’s development from a base year of 2010 to 2050. The reference scenario is based on PDP- VII-interim-revision (as per a draft available in late 2014 from the Institute of Energy) and current sector plans while the low-carbon scenario investigates further migration opportunities to reduce GHG emissions and evaluates the costs and some of the benefits of following this development pathway. Each scenario portrays a plausible path of evolution for four sectors: on the supply side, electricity generation; and on the demand side, household electricity demand, transport, and industry.
This study focuses on sectors that generate the majority of GHG emissions in Viet Nam, and those that are the fastest-growing sources of emissions. However, the scenarios do not cover Viet Nam’s complete emissions inventory. Specifically, this bottom–up analysis does not include
ɂ agriculture sector emissions or fuel use other than electricity in agriculture;
ɂ land use and land-use change; ɂ waste; ɂ fuel usage other than electricity in buildings,
construction, and small and medium-sized enterprises (SMEs); and
ɂ process emissions other than those from the selected large, energy-consuming industries.
term fuel price and changes in technology cost and how these might affect decisions. In addition, whereas other studies (including by the World Bank) have been rooted in analysis of the original PDP-VII, this study takes into account more recent revisions that change the energy outlook considerably.
In line with the longer-term focus, this study also adds more consideration of technical improvement even in the absence of low-carbon specific policies. Thus, this study starts from a scenario in which the energy efficiency of energy-consuming appliances and industrial facilities increases over time, as a result of spillover effects from other markets with more stringent energy regulations.
This study takes a pragmatic, technically rooted approach to evaluating a goal of stabilizing emissions at around 500 million tons of CO2e (MtCO2e) by 2050—which is consistent with the VGGS long-term goals—with reductions over future decades, in the understanding that this is considerably more aggressive than the goal of any recent study.
The overall objectives of the study are to
(i) identify medium- to long-term energy sector mitigation opportunities for Viet Nam;
(ii) assess what abatement can be achieved at what cost through different mitigation opportunities; and
2. methodology
11
(ii) A low-carbon scenario assesses options to achieve the same or better development progress than in the “reference scenario” but with lower greenhouse gas (GHG) emissions.
The differences between these scenarios allow evaluation of mitigation opportunities, their associated co-benefits, barriers to adoption, and the cost of achieving them.
The reference scenario considered by the study is the Power Development Master Plan for 2011–2020 with outlook to 2030 (hereinafter referred to as PDP-VII) developed by the Institute of Energy (IEVN). As described in more detail subsequently, a 2014 revision of the plan is utilized.
The low-carbon scenario was prepared by analyzing the mitigation options in the power, household, and industry sectors, using 2010 as a baseline year for starting low-carbon efficiency cost and carbon dioxide equivalent (CO2e) emissions, and extended to 2050.
As portrayed in the reference scenario over the decades between 2010 and 2050, CO2e emissions are likely to increase by a factor of over 10 times, from 113 million tons to 1,073 million tons, driven by an economic growth—in real terms—of almost 14 times. The low-carbon scenario shows an alternative in which emissions grow less than five times over this modeling period for a mitigation (or annual savings) in 2050 of 574 million tons of CO2e (MtCO2e). This mitigation effort is additional to the mitigation actions already reflected in the power sector plans of the reference scenario.
The model used for this study is the Energy Forecasting Framework and Emissions Consensus Tool (EFFECT), an Excel-
based, inventory-style tool with some built-in optimization that can be opened and used easily by multiple stakeholders. The tool facilitates transparent sharing of data and assumptions used to model future scenarios, so as to help foster consensus on future actions.
The model consists of five main modules (power generation, land transport, household electricity consumption, nonresidential, and industry) of which three were used in this study. A fourth sector, industry, was later added under a sharing agreement with the World Bank, using the work performed by Ernst & Young Calcutta, and reported by Audinet et al. (2016).
EFFECT had been successfully used in many different national and subnational low-carbon development studies. It is designed to evaluate and compare different development scenarios in the specific areas focused by the modeling where important mitigation impacts can be achieved. Thus, bottom–up modeling is usually not used to model the whole economy, but to evaluate the benefits of a specific policy and/or investment by comparing scenarios:
(i) A reference scenario portrays what is likely to happen under a normal development process in which no special emphasis is placed on reducing the climate change impacts of development.
12 PathwaYs to low-Carbon develoPment For viet nam
supply technology mix to 2050. The study team from the Transport Development Strategy Institute (TDSI) gave detailed plausible pathways for transport. Modeling by the Central Institute of Economic Management (CIEM) underpinned the choice of macro indicators and the targeted improvement in income per capita for all strata of the economy.
In this study, the reference scenario is aligned with the current sector plans and policies as laid out in Annex A, except where specifically noted. With critical input from the CIEM, IEVN, and TDSI study teams, the reference scenario for 2030–2050 was modeled as a continuation of current plans and policies, taking into account the agreed macroeconomic projections (for gross domestic product [GDP] growth, sectoral mix, population, among others). The low-carbon scenario maintains consistency in all macro variables with the reference scenario, including annual GDP growth, sectoral contribution to GDP, exchange rate, demographics, fuel and electricity prices, and industrial production.
The analysis is performed using constant 2010 prices. In the current sector plans, electricity prices are increasing over the short term to remove subsidies and these price changes are reflected in both the reference and low-carbon scenarios. All the prices used in this study to 2030 were given by the IEVN study team in accordance with the PDP- VII-interim-revision, and it is assumed that after the period of adjustment to bring them in line with true costs, these will remain constant.
Although increasing energy prices—via carbon taxes or other adjustments—are likely to be important policy levers that drive low-carbon development, these have not been reflected in this study because bottom–up modeling is not an appropriate methodology for modeling substitution and consumption responses to price signals. Here, the focus is on an engineering-style analysis of technical options.
2.1 Data and Assumptions in the Reference and Low-Carbon Scenarios
Bottom–up models, by definition, need a wealth of microlevel detailed historic data to populate the base year, and EFFECT is no exception. The need to locate appropriate data for the model is important to low-carbon development research, since without a correctly built base year, it is impossible to generate a meaningful analysis of the reference and low-carbon alternative scenarios over the modeling period. This study uses 2010 as its base year to be consistent with PDP-VII.
Substantial assumptions are needed to build out the reference and low-carbon alternative scenarios to 2050. National policy documents, development plans, and related studies provided the basis for the shorter term (5- to 10-year horizon) development plans and most of the medium-term plans (to 2030), but offer little guidance as to longer-term possibilities. National institutes were consulted extensively to produce the longer-term trajectories.
This study fundamentally draws on PDP-VII in a draft revised form shared in late 2014 by IEVN, which predicated the official revision of PDP-VII (PDP-VII-Revised, approved by Prime Minister Decision No. 428/QĐ-TTg) in 2016, as the official revised version was not yet approved at the time of modeling. The draft revision has a similar level of generation and capacity of fossil fuel and nuclear plants to PDP-VII-Revised, but the latter includes more renewable capacity from the mid 2020s. The version used here is termed PDP-VII-interim-revision in this study, and can be viewed as the power development plan as it stood prior to Viet Nam’s NDC submission in 2016, which is relevant as a without-climate policy reference for evaluating mitigation measures.
IEVN experts provided detailed vision and guidance on energy-efficiency targets, industry, and the electricity
13methodologY
each appliance with the number of appliances per household—and assumptions about appliance energy efficiency and usage produce the aggregated household electricity demand.
The demand for household electricity is based on changes in household income in real terms that come from the national CGE analysis conducted under CIEM, which is consistent with the PDP-VII-Revised electricity-demand projections. These projections take into account the increase in electricity prices contained in the various versions of PDP-VII over the period to 2030.2 Although the low-carbon scenario exhibits a lower direct cost of electricity generated than the reference scenario, it is assumed that these savings do not translate to lower electricity prices.
2.3 Methodology to Evaluate Energy Efficiency in Industry
The industry sector is extremely diverse and includes a wide range of activities, many of which are particularly energy intensive, as they require energy to extract natural resources, convert them into raw materials, and manufacture finished products. This module evaluates some of the most energy-intensive industries:
ɂ Iron and steel (both integrated steel plants and small producers)
ɂ Cement ɂ Fertilizer ɂ Petroleum refining ɂ Pulp and paper
To establish levels of production activity that result in energy consumption and process emissions, each subsector is considered according to national demand (which should increase in some measure with population and economic development), modified by the import and export of the intermediate and finished product, and obeying competitive considerations in the regional market.
2 Details are documented in Annex D - Principal Input Data and Assumptions, available on request.
The low-carbon scenario is more aggressive in the mitigation of GHG emissions than the country’s current policies because it includes alternatives that become viable only when greater effort to remove barriers is applied, and when future international technical and financial support are available. However, because of this model’s detailed engineering-style approach, care has been exercised to not include “technical solutions” that do not have a scientific or practical basis.1
2.2 Methodology to Evaluate Energy Efficiency in Household Electricity Consumption
The study assesses household electricity consumption by projecting household size and income by location (urban, rural). For each location, households are further separated into 100 centiles containing an equal number of people, in order of increasing expenditure, as a surrogate for income. The study forecasts the change in the number of electrified households and the expenditure levels of each centile during each year of the modeling period based on historical data and projections from the computable general equilibrium (CGE) modeling work of CIEM. It evaluates appliance ownership for each centile as a regression-based function of household income, and usage patterns for lighting and for each of the 18 appliances. Income growth is forecasted based on GDP growth, and ownership is projected on the basis of changes in income over time.
The study uses a stock model to derive new appliance sales each year from the overall annual growth in ownership and the replacement of appliances in service that have been scrapped. The energy consumption of the new appliances that enter service each year is determined from forward-looking assumptions on appliance technology and their size, and other features that affect energy consumption. The appliance ownership by location and centile—a combination of the number of households owning
1 For example, refrigerators in 2001 consumed 75% less electrical energy than in 1974 but this does not imply that this tendency may be projected as a straight line for the following 52 years.
14 PathwaYs to low-Carbon develoPment For viet nam
2.4 Methodology to Evaluate Power Sector Supply-Side Assessment
The study first models the electrical energy end-user annual demand, imports, exports, and captive generation over the modeling period within the reference scenario. This may contain any mixture of grid-supplied electricity, off-grid, and minigrid solutions. The end-user demand calculation makes use of the other demand-side modules in EFFECT (household, nonresidential, industry, and transport) and estimates residual demand (which is not explicitly modeled within EFFECT) by determining an implicit elasticity of GDP growth. The second step is to evaluate transmission and distribution losses and programs to reduce them, together with the demand that be supplied via off-grid or minigrid solutions. This allows the amount of electricity that must be generated and supplied to the grid to be determined annually.
Drawing on the PDP-VII-interim-revision, as communicated by IEVN in late 2014, the model includes every existing generating unit within the reference framework, detailing its type, size, fuel, efficiency, commissioning date, expected life, efficiency reduction over time, operation and maintenance costs, midlife extension dates and costs, and planned and probabilistic down time. A second database models the PDP-VII-interim-revision’s future planned plant construction and retirement using the incorporated 74 types of technology and to the same level of detail, including land, construction, installation, and equipment-projected costs plus commissioning and contingency costs. A third construct evaluates the plant mix, which the model may build annually over the modeling period for periods beyond the planning horizon of the PDP-VII-interim-revision.
The next step involves defining the fraction of this national production for each subsector, which can be done by using existing installations and determining the capacity and start-up date for new productive installations that are needed to meet the demand. As new facilities are brought online, these can be expected to comply with, or be close to, the international energy-efficiency standards for new plants at the time they are built. Existing facilities typically have higher energy consumption but can be retrofitted with different energy-efficiency measures. An existing retrofitted plant is considered unlikely to achieve the energy-efficiency levels that are close to those of a new installation.
Light industries (such as food processing, textiles, wood products, printing and publishing, and metal processing) and small and medium-sized enterprises (SMEs) are outside the scope of this study, despite their importance to economic growth. However, many energy-efficiency measures for these can be handled in the same way as efficiency standards for household appliances. Transformers, pumps, motors, and fans are some of the most energy-consuming appliances in SMEs given the large number in use, which can benefit directly from the implementation of standards and other policy measures.
Fossil fuel prices for industry and power generation used in the study are given by the IEVN to 2030 for the PDP-VII-interim-revision. These were further increased by the study team to 2050 in real terms using normalized average annual price change for 2030– 2050 (European Commission 2014). Natural gas prices used in the study from 2015 onward are based on landed liquefied natural gas price.
15methodologY
By 2050, the investment cost for renewable power generation falls in real terms to less than that for nonrenewable, with utility scale photovoltaic (PV) and solar thermal showing the greatest improvement. Combined with rising fossil fuel costs, this changes the dynamics for adopting renewables in generation. Both scenarios use the same fuel and capital cost projections, which for consistency come from the same sources.
2.5 Methodology to Evaluate Sustainable Transportation and Urban Planning
The starting point for this study’s reference scenario is “Adjustments to the Transport Development Strategy 2020 with a Vision toward 2050,” also known as “Transport Strategy 2020.” This document stresses the importance of developing transportation in a sustainable manner, and promotes infrastructure development for transport, including mass transit. To translate this reference into a concrete scenario, the following transport modes are assessed:
Private vehicle (car and motorcycle) ownership is taken as a function of household income, using nonlinear regressions based on the Viet Nam Household Living Standards Survey (VHLSS) 2010 data (General Statistics Office of Viet Nam n.d.). Household income by centile is projected over time as a function of overall GDP growth, and growth in vehicle ownership is forecasted on the basis of relationships between income and ownership.
To this, the additional (nonhousehold) ownership of cars and motorcycles—by private commercial, industrial enterprises, and other institutions—is identified and added. The baseline vehicle population is then disaggregated—by vehicle type, subtype, engine displacement, technology, gross vehicle weight, age, and fuel use—for EFFECT to determine by using historic vehicle sales through a vehicle stock (or mortality) model the applicable
A load-duration curve and changes to its shape are constructed across the modeling time frame for the grid-supplied demand. This is used to dispatch all the plants on a merit order low-variable cost basis. For each year, first the hydro availability (taking into account seasonal variation) is located at 50 percentile “knee” of the load duration curve, and the amount of “must-run” nondispatchable renewables, and nuclear energy is determined. Then the lowest variable cost base load is dispatched up to the start of hydro, which is dispatched plant by plant. Above hydro, the lowest variable cost dispatch continues until the curve is topped out by low latency generation. Off-grid or minigrid generating plants are not dispatched and are handled separately via unique modifiable utilization factors. Outputs are calculated for each year of the modeling period. As generation is an output of the model, but plant construction is an input, while the capacity mix aligns with the PDP-VII-interim-revision, generation may differ from Government targets.
The analysis has two significant additions as compared with other recent studies:
(i) The increase in fuel prices in real terms over the modeling period, referred to above. Previous studies maintained fuel prices as constant.
(ii) A learning-curve effect that reduces capital costs for generating equipment over the modeling period in real terms. Other studies maintained capital costs constant. CAPEX trends to 2050 from the study, EU Energy, Transport and GHG Emissions Trends to 2050 Reference Scenario 2013 (European Commission 2014) were used while respecting any current cost differences between capital costs for projects in Viet Nam and international experiences.3
3 Described in Annex D - Principal Input Data and Assumptions, available on request.
16 PathwaYs to low-Carbon develoPment For viet nam
expansion plans are used to evaluate projected carrying capacity.
Modeling transport demands: Total PKT and total FTKT are then forecast over the modeling period based on population and economic growth indicators using cross-country comparisons where necessary to estimate probable changes in PKT and FTKT travel distance at different levels of economic development. The forecast car and motorcycle PKT in each future year is subtracted and the mass transport remnant is apportioned to each travel mode under differing investment and transport expansion scenario. New vehicle prices and in-use (nonfuel) operating costs are estimated.
Average local operating conditions—for on-road vehicles considering percentage of vehicle-kilometers-traveled under different urban, rural, and highway road speed conditions; biofuel usage; vehicle load and average road grade; ambient temperature; and the impact of inspection and maintenance programs on vehicle maintenance quality—are then determined for each modeled year. This additional information helps to determine the fuel consumption and emissions factors for each mode and specific vehicle type and usage per year using the international COPERT4 model, which is then calibrated to local conditions (Ntziachristos et al. 2009).5 Scenarios are elaborated with improvements in infrastructure and vehicle efficiency to evaluate the impact of these on energy consumption and emissions for each mode and vehicle type.
5 COPERT 4 model is a model to calculate road transport emissions in accordance with the requirements of international conventions and protocols and the EU legislation.
fuel consumption and emissions factors. Using industry information, the percentage sales mix of new vehicles is projected at the same level of disaggregation. A vehicle mortality calculation using a modified Winfrey S3 survival curve is applied to determine the number of vehicles in the active population that must be replaced annually, project annual sales volumes of new vehicles and the annual changes to the vehicle population mix.4 The annual per-vehicle age-sensitive usage (kilometers [km] per year) by vehicle type and subtype is determined from surveys or estimated from cross-country comparisons. By projecting average ridership by vehicle type and subtype, the number of passenger-kilometers traveled per year (PKT) in private vehicles may be estimated.
For other on-road passenger vehicles (light duty vans, multiuse vehicles, buses, and coaches), the base-year vehicle population is disaggregated as above and the annual per-vehicle age-sensitive usage (kilometers per year) is surveyed or estimated, which together with average vehicle ridership or goods transported, will give the PKT and freight-ton-km-transported (FTKT) in the base year. The sales mix of new vehicles at the level of disaggregation is also estimated from industry sources for future years.
Rail and waterborne modes of transportation are treated in the same way as trucks and buses. Their total activity is determined in the base year, which together with estimates (or survey data) on goods and passengers carried will determine the PKT and FTKT on a per-transportation-unit basis. Future
4 The Winfrey function is used to estimate vehicle mortality based on the calibrated average maximum vehicle scrappage age.
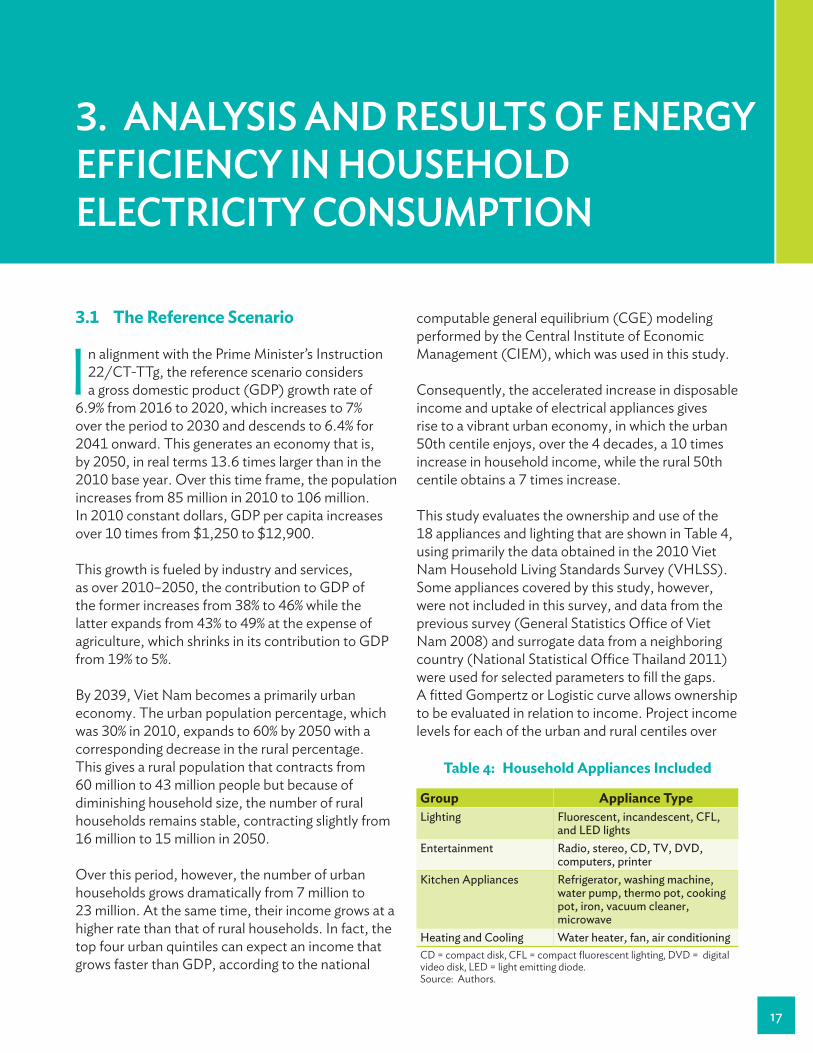
3. analysIs and results of energy effIcIency In household electrIcIty consumPtIon
17
computable general equilibrium (CGE) modeling performed by the Central Institute of Economic Management (CIEM), which was used in this study.
Consequently, the accelerated increase in disposable income and uptake of electrical appliances gives rise to a vibrant urban economy, in which the urban 50th centile enjoys, over the 4 decades, a 10 times increase in household income, while the rural 50th centile obtains a 7 times increase.
This study evaluates the ownership and use of the 18 appliances and lighting that are shown in Table 4, using primarily the data obtained in the 2010 Viet Nam Household Living Standards Survey (VHLSS). Some appliances covered by this study, however, were not included in this survey, and data from the previous survey (General Statistics Office of Viet Nam 2008) and surrogate data from a neighboring country (National Statistical Office Thailand 2011) were used for selected parameters to fill the gaps. A fitted Gompertz or Logistic curve allows ownership to be evaluated in relation to income. Project income levels for each of the urban and rural centiles over
3.1 The Reference Scenario
In alignment with the Prime Minister’s Instruction 22/CT-TTg, the reference scenario considers a gross domestic product (GDP) growth rate of
6.9% from 2016 to 2020, which increases to 7% over the period to 2030 and descends to 6.4% for 2041 onward. This generates an economy that is, by 2050, in real terms 13.6 times larger than in the 2010 base year. Over this time frame, the population increases from 85 million in 2010 to 106 million. In 2010 constant dollars, GDP per capita increases over 10 times from $1,250 to $12,900.
This growth is fueled by industry and services, as over 2010–2050, the contribution to GDP of the former increases from 38% to 46% while the latter expands from 43% to 49% at the expense of agriculture, which shrinks in its contribution to GDP from 19% to 5%.
By 2039, Viet Nam becomes a primarily urban economy. The urban population percentage, which was 30% in 2010, expands to 60% by 2050 with a corresponding decrease in the rural percentage. This gives a rural population that contracts from 60 million to 43 million people but because of diminishing household size, the number of rural households remains stable, contracting slightly from 16 million to 15 million in 2050.
Over this period, however, the number of urban households grows dramatically from 7 million to 23 million. At the same time, their income grows at a higher rate than that of rural households. In fact, the top four urban quintiles can expect an income that grows faster than GDP, according to the national
Table 4: Household Appliances Included
Group Appliance Typelighting Fluorescent, incandescent, CFl,
and led lightsentertainment radio, stereo, Cd, tv, dvd,
computers, printerkitchen appliances refrigerator, washing machine,
water pump, thermo pot, cooking pot, iron, vacuum cleaner, microwave
heating and Cooling water heater, fan, air conditioningCD = compact disk, CFL = compact fluorescent lighting, DVD = digital video disk, LED = light emitting diode. Source: Authors.
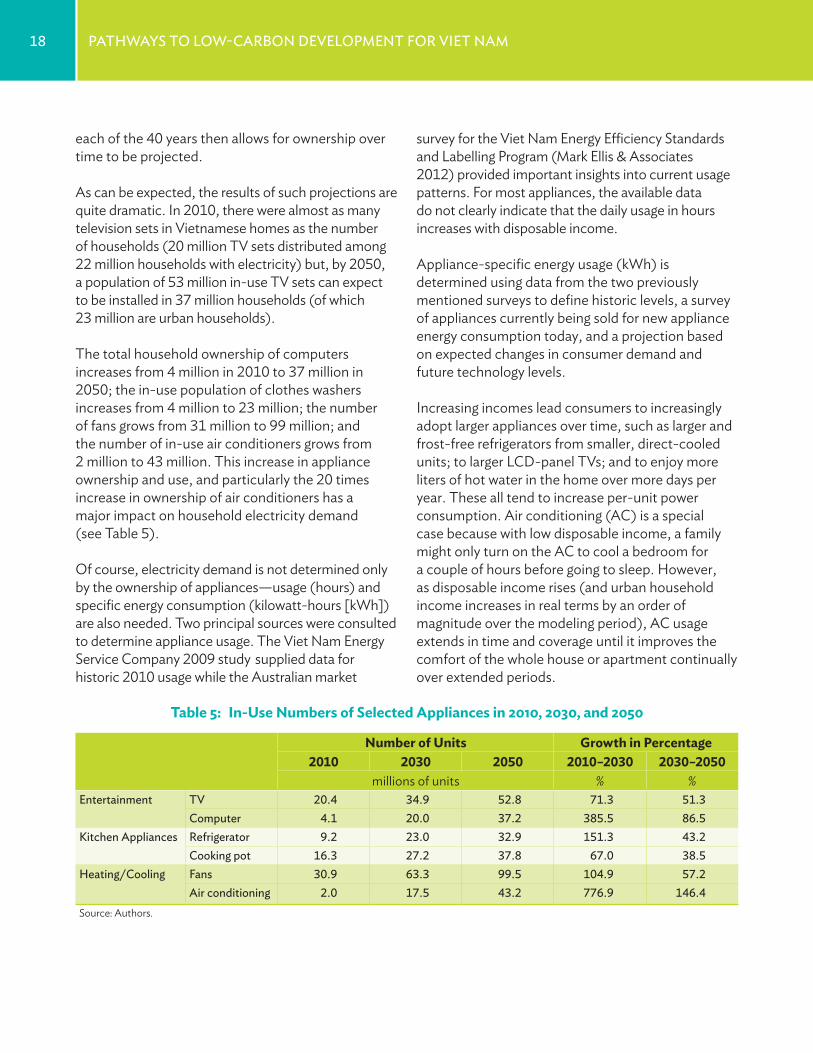
18 PathwaYs to low-Carbon develoPment For viet nam
survey for the Viet Nam Energy Efficiency Standards and Labelling Program (Mark Ellis & Associates 2012) provided important insights into current usage patterns. For most appliances, the available data do not clearly indicate that the daily usage in hours increases with disposable income.
Appliance-specific energy usage (kWh) is determined using data from the two previously mentioned surveys to define historic levels, a survey of appliances currently being sold for new appliance energy consumption today, and a projection based on expected changes in consumer demand and future technology levels.
Increasing incomes lead consumers to increasingly adopt larger appliances over time, such as larger and frost-free refrigerators from smaller, direct-cooled units; to larger LCD-panel TVs; and to enjoy more liters of hot water in the home over more days per year. These all tend to increase per-unit power consumption. Air conditioning (AC) is a special case because with low disposable income, a family might only turn on the AC to cool a bedroom for a couple of hours before going to sleep. However, as disposable income rises (and urban household income increases in real terms by an order of magnitude over the modeling period), AC usage extends in time and coverage until it improves the comfort of the whole house or apartment continually over extended periods.
each of the 40 years then allows for ownership over time to be projected.
As can be expected, the results of such projections are quite dramatic. In 2010, there were almost as many television sets in Vietnamese homes as the number of households (20 million TV sets distributed among 22 million households with electricity) but, by 2050, a population of 53 million in-use TV sets can expect to be installed in 37 million households (of which 23 million are urban households).
The total household ownership of computers increases from 4 million in 2010 to 37 million in 2050; the in-use population of clothes washers increases from 4 million to 23 million; the number of fans grows from 31 million to 99 million; and the number of in-use air conditioners grows from 2 million to 43 million. This increase in appliance ownership and use, and particularly the 20 times increase in ownership of air conditioners has a major impact on household electricity demand (see Table 5).
Of course, electricity demand is not determined only by the ownership of appliances—usage (hours) and specific energy consumption (kilowatt-hours [kWh]) are also needed. Two principal sources were consulted to determine appliance usage. The Viet Nam Energy Service Company 2009 study supplied data for historic 2010 usage while the Australian market
Table 5: In-Use Numbers of Selected Appliances in 2010, 2030, and 2050
Number of Units Growth in Percentage2010 2030 2050 2010–2030 2030–2050
millions of units % %entertainment tv 20.4 34.9 52.8 71.3 51.3
Computer 4.1 20.0 37.2 385.5 86.5kitchen appliances refrigerator 9.2 23.0 32.9 151.3 43.2
Cooking pot 16.3 27.2 37.8 67.0 38.5heating/Cooling Fans 30.9 63.3 99.5 104.9 57.2
air conditioning 2.0 17.5 43.2 776.9 146.4Source: Authors.
19analYsis and results oF energY eFFiCienCY in household eleCtriCitY ConsumPtion
ɂ Energy Star 25%: The average power consumption of the most efficient 25% of the appliances exceeding 2010 efficiency standards
Although even the most stringent level (Energy Star 25%) requires no technological breakthrough for implementation (as such products are already in the market), substantial effort may be required to attain such efficiency. Local manufacturing plants may need time, technical assistance, and access to financing to update their production technology to meet this upcoming average power requirement. In the reference scenario, it is assumed that market forces by themselves will allow future appliance sales to meet three average power levels: Energy Star 75% in 2025, 50% in 2033, and 25% in 2041.7
Table 6 shows for selected appliances the combined effect of changes in size, technology, and the stock model that incorporates new sales into the in-use population on average per-unit power consumption over the modeling period. Although air conditioning units become much more efficient, they exhibit an increase in power consumption driven by a move to larger whole-house units in the upper household centiles particularly over the later years of the modeling period.
Figure 6 presents the overall impact of increasing ownership and use of appliances coupled with the improved energy efficiency that can be expected in the market, assuming no specific efforts from the Government to improve appliance energy efficiency in Viet Nam. Over the 40-year period to 2050, household energy consumption increases by 7.9 times, driven by average urban household income growing in real terms by 10.5 times and a 3.3 times increase in the number of urban households from 2010 to 2050.
7 Annex D, Household Module gives full details for each of the 18 appliance types and lighting, available on request.
Other appliance adoption patterns (such as from desktop computers to laptops) have opposite tendencies. At the same time, appliance efficiency will increase over the coming years even if the Government of Viet Nam does not make any concerted effort, or enact a policy to promote this. Earlier studies have demonstrated a clear relationship between appliance energy efficiency and the age of the manufacturing plant. Thus, the assumption in the reference scenario is that appliance energy efficiency will improve but more slowly than could be achieved through a focused national policy to promote energy efficiency in new appliance sales.
The reference scenario assumes that appliances sold in 2011 met, on average, the equivalent Energy Star 2002 standard applicable to each appliance type. This implies a weighted sales mix of more efficient units together with others whose market attractiveness is based primarily on price. Similarly, the reference scenario assumes that appliances sold in 2015 will meet on average, the equivalent Energy Star 2008 standard applicable to each appliance type.6 To assume sales-weighted appliance efficiency in future years, a study was made of all appliances worldwide (by type) that currently meet the Energy Star standard. For many appliance types, this consisted of hundreds or thousands of discrete models from different manufacturers from which three specific power consumption levels were determined:
ɂ Energy Star 75%: The average power consumption of the most efficient 75% of the appliances exceeding 2010 efficiency standards
ɂ Energy Star 50%: The average power consumption of the most efficient 50% of the appliances exceeding 2010 efficiency standards
6 Energy Star is an international standard for energy efficient consumer product.
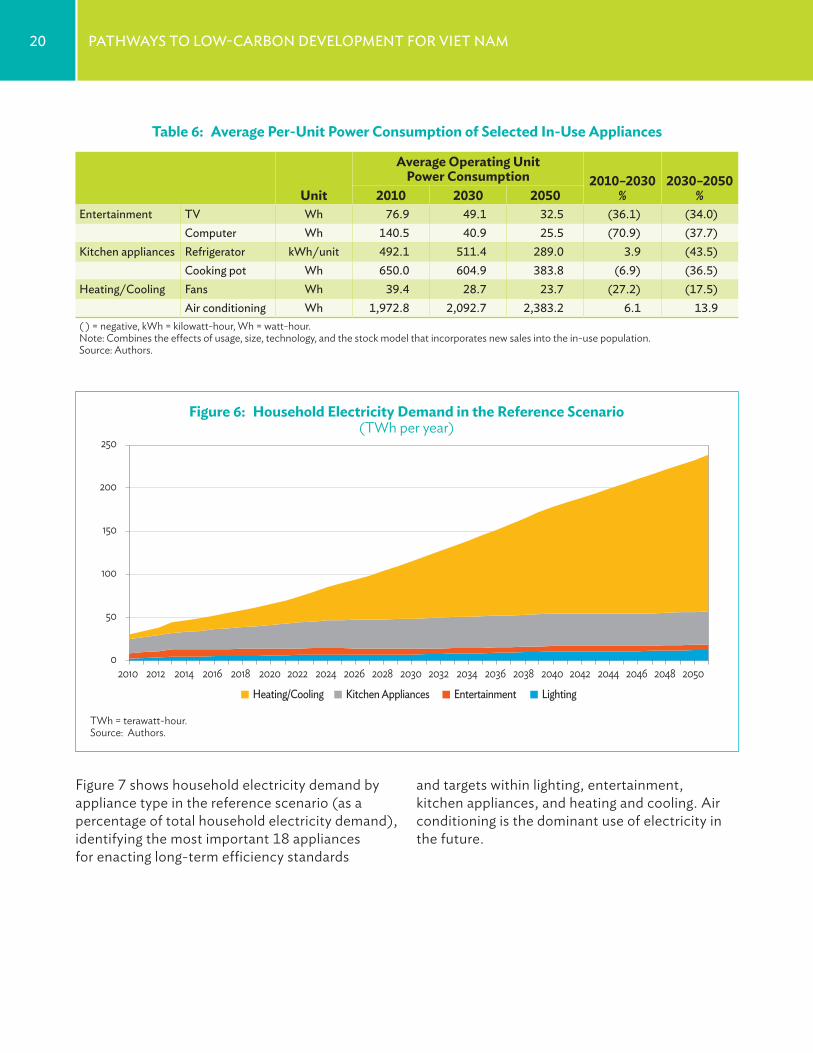
20 PathwaYs to low-Carbon develoPment For viet nam
and targets within lighting, entertainment, kitchen appliances, and heating and cooling. Air conditioning is the dominant use of electricity in the future.
Figure 7 shows household electricity demand by appliance type in the reference scenario (as a percentage of total household electricity demand), identifying the most important 18 appliances for enacting long-term efficiency standards
Table 6: Average Per-Unit Power Consumption of Selected In-Use Appliances
Unit
Average Operating Unit Power Consumption 2010–2030
%2030–2050
%2010 2030 2050entertainment tv wh 76.9 49.1 32.5 (36.1) (34.0)
Computer wh 140.5 40.9 25.5 (70.9) (37.7)kitchen appliances refrigerator kwh/unit 492.1 511.4 289.0 3.9 (43.5)
Cooking pot wh 650.0 604.9 383.8 (6.9) (36.5)heating/Cooling Fans wh 39.4 28.7 23.7 (27.2) (17.5)
air conditioning wh 1,972.8 2,092.7 2,383.2 6.1 13.9( ) = negative, kWh = kilowatt-hour, Wh = watt-hour.Note: Combines the effects of usage, size, technology, and the stock model that incorporates new sales into the in-use population.Source: Authors.
0
50
100
150
200
250
2010 2012 2014 2016 2018 2020 2022 2024 2026 2028 2030 2032 2034 2036 2038 2040 2042 2044 2046 2048 2050
Heating/Cooling Kitchen Appliances Entertainment Lighting
Figure 6: Household Electricity Demand in the Reference Scenario (TWh per year)
TWh = terawatt-hour.Source: Authors.
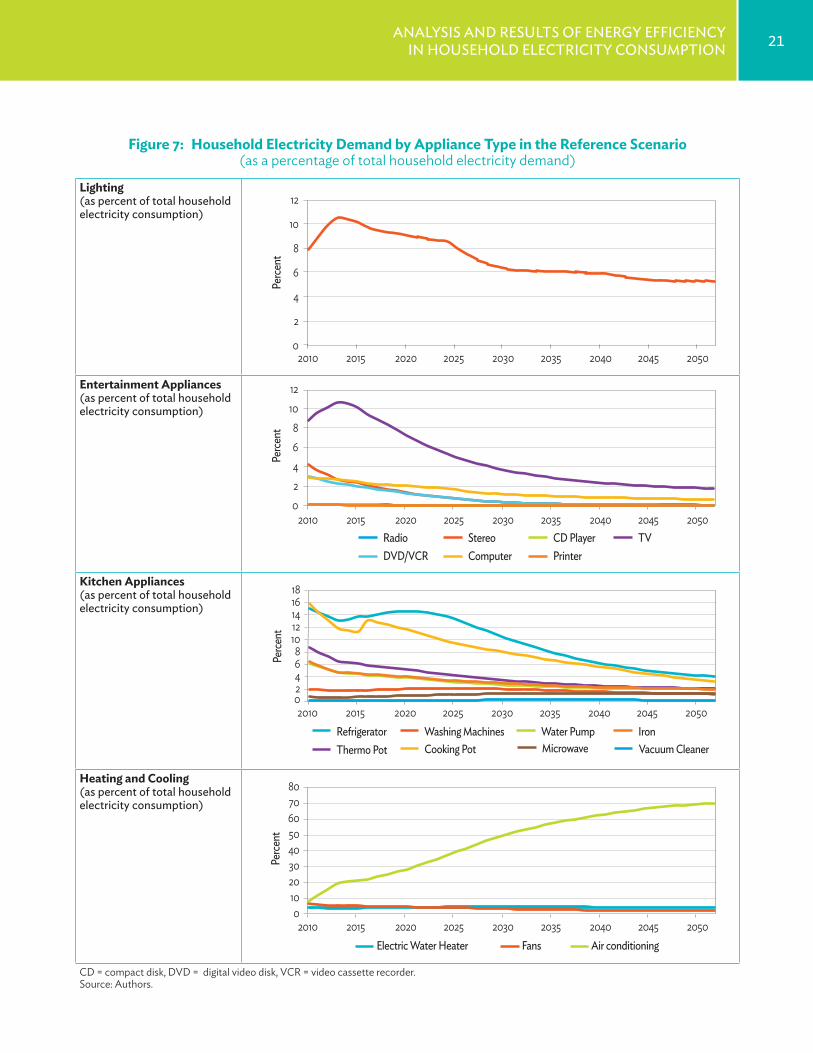
21analYsis and results oF energY eFFiCienCY in household eleCtriCitY ConsumPtion
Figure 7: Household Electricity Demand by Appliance Type in the Reference Scenario (as a percentage of total household electricity demand)
Lighting(as percent of total household electricity consumption)
Perc
ent
0
2
4
6
8
10
12
2010 2015 2020 2025 2030 2035 2040 2045 2050
Entertainment Appliances(as percent of total household electricity consumption)
Perc
ent
0 2 4 6 8
10 12
2010 2015 2020 2025 2030 2035 2040 2045 2050 Radio Stereo CD Player TV DVD/VCR Computer Printer
Kitchen Appliances(as percent of total household electricity consumption)
Perce
nt
0 2 4 6 8
10 12 14 16 18
2010 2015 2020 2025 2030 2035 2040 2045 2050 Refrigerator Washing Machines Water Pump Thermo Pot Cooking Pot
Iron Vacuum Cleaner Microwave
Heating and Cooling(as percent of total household electricity consumption)
Perc
ent
0 10 20 30 40 50 60 70 80
2010 2015 2020 2025 2030 2035 2040 2045 2050 Electric Water Heater Fans Air conditioning
CD = compact disk, DVD = digital video disk, VCR = video cassette recorder.Source: Authors.
22 PathwaYs to low-Carbon develoPment For viet nam
By 2050, the promotion of energy-efficient technologies could cut much of residential electricity consumption by nearly 50% (see Appendix for more details). More efficient cooling will achieve the bulk of reductions, as air conditioning is a leading driver of increased electricity consumption in the baseline scenario. The modeled approach includes initially accelerating air conditioning efficiency, then supplementing this with building efficiency measures, such as low-e glass and deployment of ceiling fans. More efficient lighting, including more rapid adoption of more efficient light-emitting diode (LED) lamps, follows, after which higher efficiency cooking appliances, water heaters, entertainment devices, and refrigerators make additional contributions (Figure 8).
There is a vast expansion of mitigation potential from improved cooling after the mid 2030s, as air conditioning becomes widely adopted under higher incomes. Achieving more efficient cooling depends on both efficiency in air conditioning units and on efficiency of building construction. This suggests an important role for green building codes in realizing this potential.
3.2 The Low-Carbon Development Scenario and Mitigation Opportunities
In the low-carbon scenario, appliance ownership and use patterns remain unchanged from the reference scenario because no changes have been made to any of the macroeconomic indicators (or to electricity prices). However, it is assumed that the Government enacts policies and regulations to incorporate quickly more efficient appliances into the new appliance sales.
The underlying assumption is that in the global market for household appliances, manufacturers will always attempt to make best use of their manufacturing facilities, and often have at their disposition newer manufacturing lines that produce the most recent—and efficient—models, and older lines that are worth keeping in operation while there is a market for less efficient and older underlying technology models. The models that are offered in any specific marketplace will depend on consumers’ level of sophistication and any regulatory restrictions or standards to which new appliances offered for sale must comply.
A total of 23 appliance types in four groups (see Table 7) were appraised in improvement of potential efficiency. Specifically, in the low-carbon scenario, it is assumed that an average weighted-sales efficiency equivalent to Energy Star 75% could be accelerated by 5 years from 2025 (in the reference scenario) to 2020; reaching Energy Star 50% could be accelerated by 8 years to 2025; and Energy Star 25% could be accelerated to 2030 instead of by 2041 in the reference scenario. To achieve this, a mixture of policies, regulations, and possibly assistance to consumers would be required.
Table 7: Household Appliances Considered in the Study
Group Applianceslighting Fluorescent, CFl, led, and incandescententertainment radio, stereo, Cd player, tv, dvd/vCr,
computer, and printerkitchen (white) appliances
refrigerator, washing machines, water pump, toaster, thermo pot, cooking pot, iron, vacuum cleaner, and microwave
heating/Cooling water heater, fans, and air conditioningCD = compact disk; CFL = compact fluorescent lighting; DVD = digital video disk; LED = light emitting diode.Source: Authors.
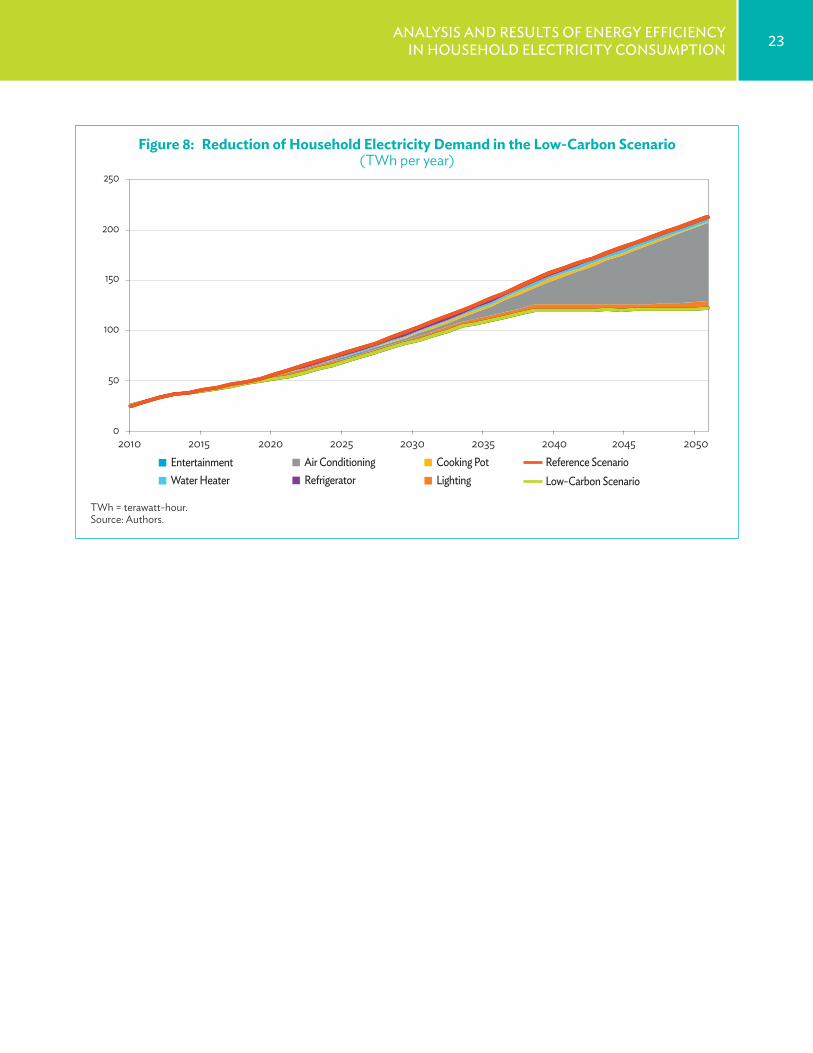
23analYsis and results oF energY eFFiCienCY in household eleCtriCitY ConsumPtion
Reference ScenarioLow-Carbon Scenario
0
50
100
150
200
250
2010 2015 2020 2025 2030 2035 2040 2045 2050Entertainment
RefrigeratorWater HeaterCooking PotAir ConditioningLighting
Figure 8: Reduction of Household Electricity Demand in the Low-Carbon Scenario (TWh per year)
TWh = terawatt-hour.Source: Authors.
4. analysIs and results of energy effIcIency In Industry
24
2050, registering an average annual growth rate of 3.5%. The targets set in Viet Nam’s master plan on the development of its steel industry include an increase in export volumes of finished steel products over the next 2 decades. As Viet Nam’s production becomes more sophisticated as projected in the steel sector plan, the share of flat steel products in the product mix is likely to increase by ~50% by 2020.9
The reference scenario considers that the future growth of this industry will be via ISPs through the blast furnace–basic oxygen route (Credit Suisse 2012) and that the production from imported scrap via small-scale producers will not exhibit growth. Future capacity additions are not envisaged in this route because of global scrap unavailability (Credit Suisse 2012). Table 8 details the Viet Nam Industry Steel Development Plan, which underpins this scenario.
9 Decision No. 145/2007/QD-TTg dated 4 September 2007 of the Prime Minister, approving the Master Plan on the Development of Viet Nam’s Steel Industry in the 2007–2015 Period, with the 2025 Vision Taken into Consideration; and SBS Research. Steel Industry Outlook 2011.
4.1 The Reference Scenario
The reference scenario is based on existing master plans related to industry (see Annex A for more details) and consultation
with industry. This analysis concentrates on five energy-intensive industries: iron and steel including integrated steel plants (ISP) and small-scale producers (SSP), cement, fertilizer, petroleum refining, and pulp and paper.
There is a significant gap in the availability of energy audit data for small and medium-sized enterprises (SMEs) that defines recent energy usage, so they were not included in this analysis. However, fans, motors, lighting, computers, and other tools and appliances can benefit from similar regulations and financial incentives as household appliances (see Chapter 3).
4.1.1 Iron and steel
Viet Nam’s steel market has already evolved into Asia’s seventh largest with a per-capita steel consumption of approximately 150 kilograms annually, ranking it ninth in Asia.8 Construction steel products produced mainly from imported scrap make up domestic production. High-grade steel and flat-plate products have been mainly imported. Total domestic production of finished iron and steel products is projected to increase from 9.2 million tons (Mt) in 2010 to 23 Mt in 2030 and 36 Mt by
8 After (in descending order) the People’s Republic of China; Japan; India; the Republic of Korea; Taipei,China; and Thailand.
Table 8: Viet Nam Steel Development Plan (million tons)
2010 2015 2020 2025domestic demand 15.3 16.0 21.0 25.0export 1.2 1.9 2.4 2.9import 7.2 5.6 7.4 8.8total production 9.2 12.2 16.1 19.1integrated steel plant 0.8 4.0 7.8 10.9small-scale producers 8.4 8.2 8.2 8.2Source: Ministry of Industry and Trade. 2007. Viet Nam Industry Steel Development Plan for the period 2007–2015 with Outlook to 2025. Hanoi.
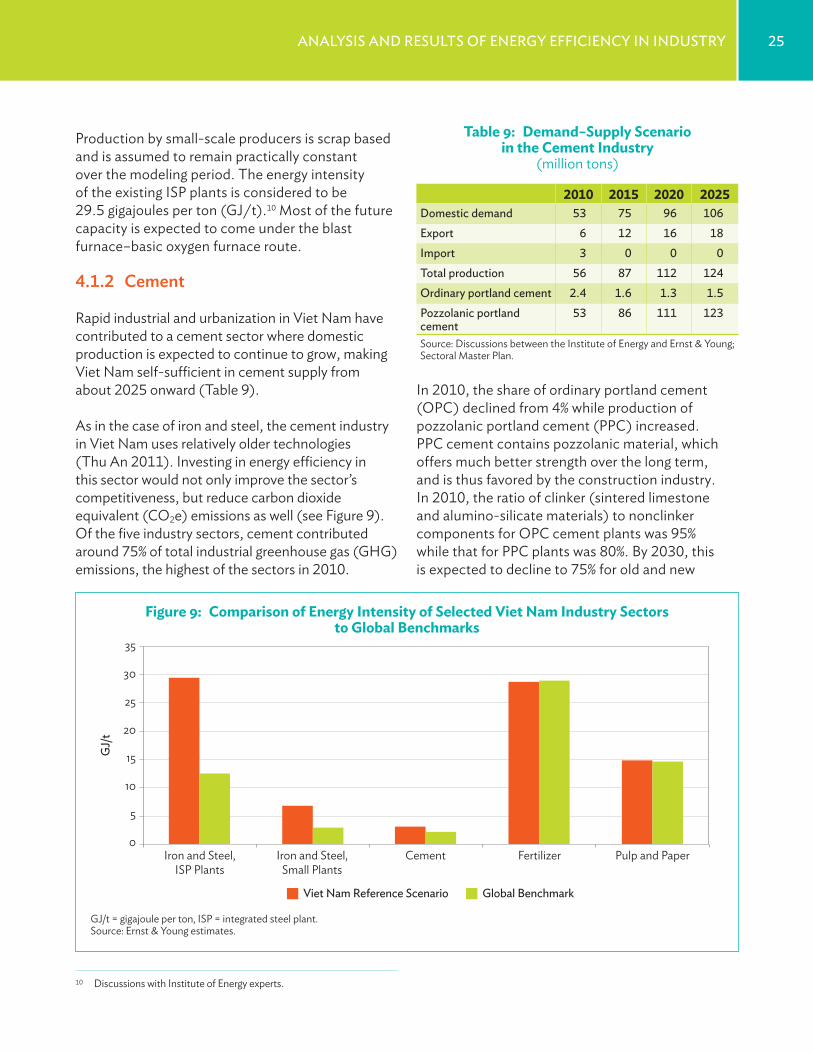
25analYsis and results oF energY eFFiCienCY in industrY
GJ/
t
0
5
10
15
20
25
30
35
CementIron and Steel,Small Plants
Iron and Steel,ISP Plants
Fertilizer Pulp and Paper
Viet Nam Reference Scenario Global Benchmark
In 2010, the share of ordinary portland cement (OPC) declined from 4% while production of pozzolanic portland cement (PPC) increased. PPC cement contains pozzolanic material, which offers much better strength over the long term, and is thus favored by the construction industry. In 2010, the ratio of clinker (sintered limestone and alumino-silicate materials) to nonclinker components for OPC cement plants was 95% while that for PPC plants was 80%. By 2030, this is expected to decline to 75% for old and new
Production by small-scale producers is scrap based and is assumed to remain practically constant over the modeling period. The energy intensity of the existing ISP plants is considered to be 29.5 gigajoules per ton (GJ/t).10 Most of the future capacity is expected to come under the blast furnace–basic oxygen furnace route.
4.1.2 cement
Rapid industrial and urbanization in Viet Nam have contributed to a cement sector where domestic production is expected to continue to grow, making Viet Nam self-sufficient in cement supply from about 2025 onward (Table 9).
As in the case of iron and steel, the cement industry in Viet Nam uses relatively older technologies (Thu An 2011). Investing in energy efficiency in this sector would not only improve the sector’s competitiveness, but reduce carbon dioxide equivalent (CO2e) emissions as well (see Figure 9). Of the five industry sectors, cement contributed around 75% of total industrial greenhouse gas (GHG) emissions, the highest of the sectors in 2010.
10 Discussions with Institute of Energy experts.
Table 9: Demand–Supply Scenario in the Cement Industry
(million tons)
2010 2015 2020 2025domestic demand 53 75 96 106export 6 12 16 18import 3 0 0 0total production 56 87 112 124ordinary portland cement 2.4 1.6 1.3 1.5Pozzolanic portland cement
53 86 111 123
Source: Discussions between the Institute of Energy and Ernst & Young; Sectoral Master Plan.
Figure 9: Comparison of Energy Intensity of Selected Viet Nam Industry Sectors to Global Benchmarks
GJ/t = gigajoule per ton, ISP = integrated steel plant.Source: Ernst & Young estimates.
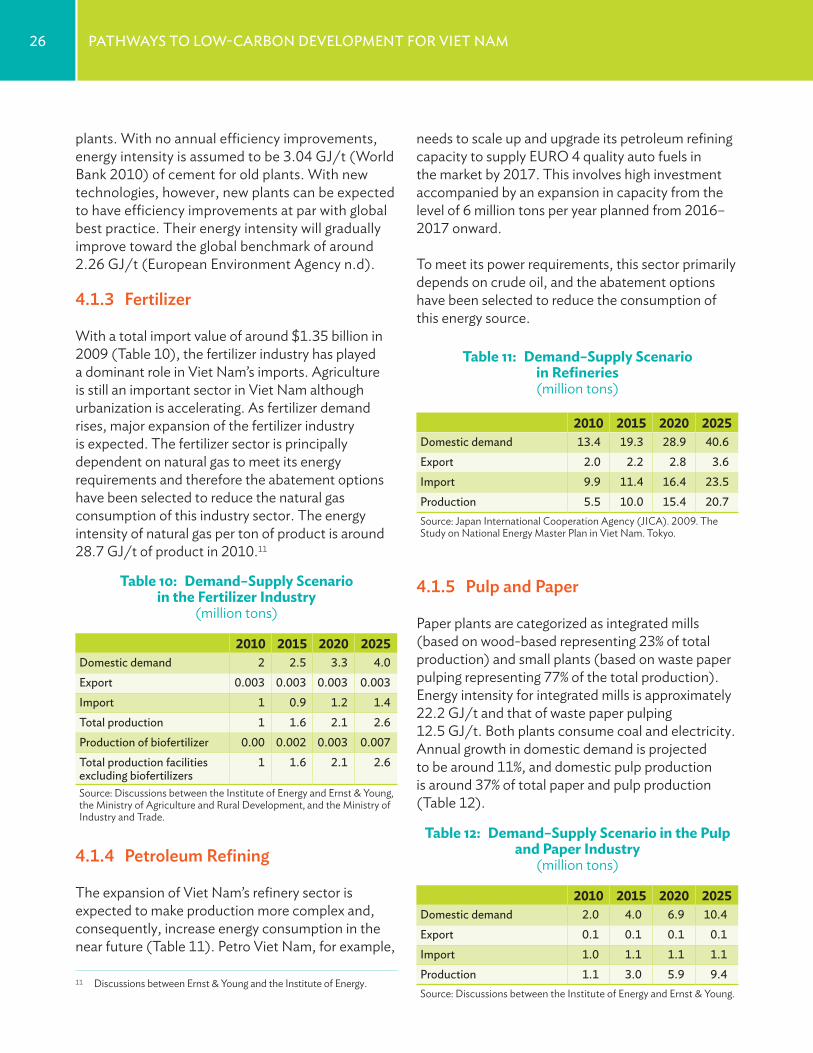
26 PathwaYs to low-Carbon develoPment For viet nam
needs to scale up and upgrade its petroleum refining capacity to supply EURO 4 quality auto fuels in the market by 2017. This involves high investment accompanied by an expansion in capacity from the level of 6 million tons per year planned from 2016–2017 onward.
To meet its power requirements, this sector primarily depends on crude oil, and the abatement options have been selected to reduce the consumption of this energy source.
4.1.5 Pulp and Paper
Paper plants are categorized as integrated mills (based on wood-based representing 23% of total production) and small plants (based on waste paper pulping representing 77% of the total production). Energy intensity for integrated mills is approximately 22.2 GJ/t and that of waste paper pulping 12.5 GJ/t. Both plants consume coal and electricity. Annual growth in domestic demand is projected to be around 11%, and domestic pulp production is around 37% of total paper and pulp production (Table 12).
Table 12: Demand–Supply Scenario in the Pulp and Paper Industry
(million tons)
2010 2015 2020 2025domestic demand 2.0 4.0 6.9 10.4export 0.1 0.1 0.1 0.1import 1.0 1.1 1.1 1.1Production 1.1 3.0 5.9 9.4Source: Discussions between the Institute of Energy and Ernst & Young.
plants. With no annual efficiency improvements, energy intensity is assumed to be 3.04 GJ/t (World Bank 2010) of cement for old plants. With new technologies, however, new plants can be expected to have efficiency improvements at par with global best practice. Their energy intensity will gradually improve toward the global benchmark of around 2.26 GJ/t (European Environment Agency n.d).
4.1.3 fertilizer
With a total import value of around $1.35 billion in 2009 (Table 10), the fertilizer industry has played a dominant role in Viet Nam’s imports. Agriculture is still an important sector in Viet Nam although urbanization is accelerating. As fertilizer demand rises, major expansion of the fertilizer industry is expected. The fertilizer sector is principally dependent on natural gas to meet its energy requirements and therefore the abatement options have been selected to reduce the natural gas consumption of this industry sector. The energy intensity of natural gas per ton of product is around 28.7 GJ/t of product in 2010.11
4.1.4 Petroleum refining
The expansion of Viet Nam’s refinery sector is expected to make production more complex and, consequently, increase energy consumption in the near future (Table 11). Petro Viet Nam, for example,
11 Discussions between Ernst & Young and the Institute of Energy.
Table 10: Demand–Supply Scenario in the Fertilizer Industry
(million tons)
2010 2015 2020 2025domestic demand 2 2.5 3.3 4.0export 0.003 0.003 0.003 0.003import 1 0.9 1.2 1.4total production 1 1.6 2.1 2.6Production of biofertilizer 0.00 0.002 0.003 0.007total production facilities excluding biofertilizers
1 1.6 2.1 2.6
Source: Discussions between the Institute of Energy and Ernst & Young, the Ministry of Agriculture and Rural Development, and the Ministry of Industry and Trade.
Table 11: Demand–Supply Scenario in Refineries (million tons)
2010 2015 2020 2025domestic demand 13.4 19.3 28.9 40.6export 2.0 2.2 2.8 3.6import 9.9 11.4 16.4 23.5Production 5.5 10.0 15.4 20.7Source: Japan International Cooperation Agency (JICA). 2009. The Study on National Energy Master Plan in Viet Nam. Tokyo.
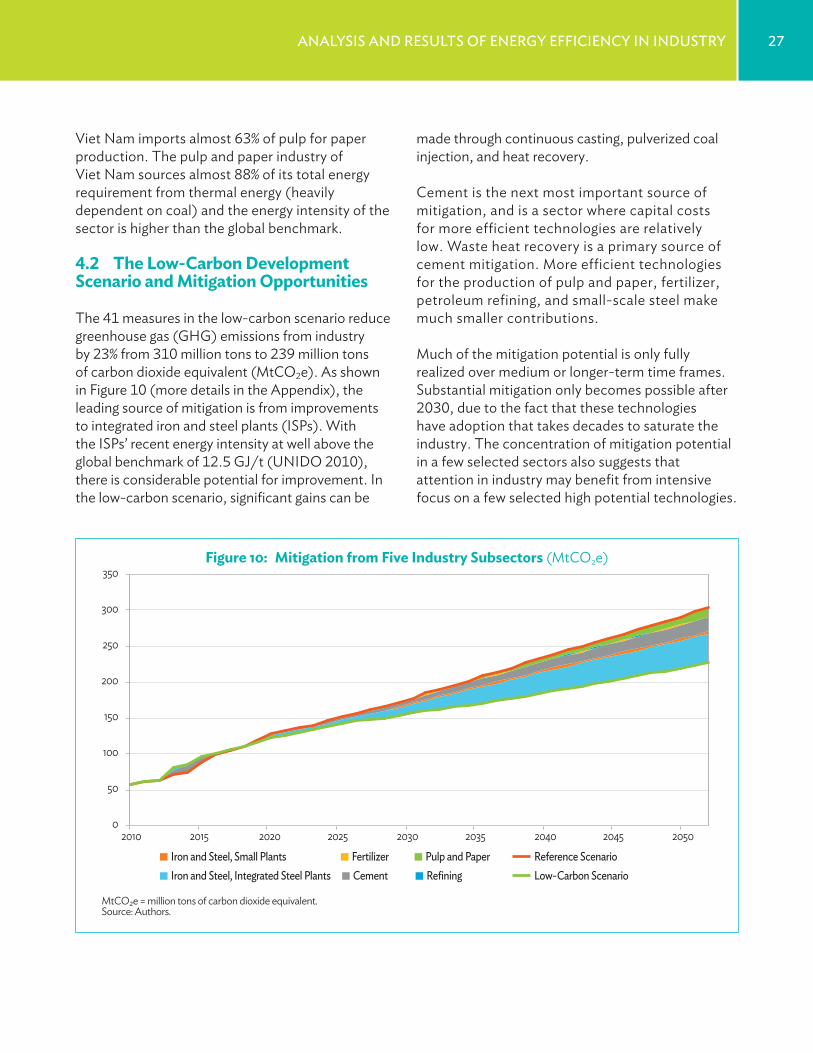
27analYsis and results oF energY eFFiCienCY in industrY
made through continuous casting, pulverized coal injection, and heat recovery.
Cement is the next most important source of mitigation, and is a sector where capital costs for more efficient technologies are relatively low. Waste heat recovery is a primary source of cement mitigation. More efficient technologies for the production of pulp and paper, fertilizer, petroleum refining, and small-scale steel make much smaller contributions.
Much of the mitigation potential is only fully realized over medium or longer-term time frames. Substantial mitigation only becomes possible after 2030, due to the fact that these technologies have adoption that takes decades to saturate the industry. The concentration of mitigation potential in a few selected sectors also suggests that attention in industry may benefit from intensive focus on a few selected high potential technologies.
Viet Nam imports almost 63% of pulp for paper production. The pulp and paper industry of Viet Nam sources almost 88% of its total energy requirement from thermal energy (heavily dependent on coal) and the energy intensity of the sector is higher than the global benchmark.
4.2 The Low-Carbon Development Scenario and Mitigation Opportunities
The 41 measures in the low-carbon scenario reduce greenhouse gas (GHG) emissions from industry by 23% from 310 million tons to 239 million tons of carbon dioxide equivalent (MtCO2e). As shown in Figure 10 (more details in the Appendix), the leading source of mitigation is from improvements to integrated iron and steel plants (ISPs). With the ISPs’ recent energy intensity at well above the global benchmark of 12.5 GJ/t (UNIDO 2010), there is considerable potential for improvement. In the low-carbon scenario, significant gains can be
MtCO2e = million tons of carbon dioxide equivalent.Source: Authors.
0
50
100
150
200
250
300
350
2010 2015 2020 2025 2030 2035 2040 2045 2050
Iron and Steel, Integrated Steel Plants Iron and Steel, Small Plants
Cement Fertilizer
Refining Pulp and Paper Reference Scenario
Low-Carbon Scenario
Figure 10: Mitigation from Five Industry Subsectors (MtCO2e)
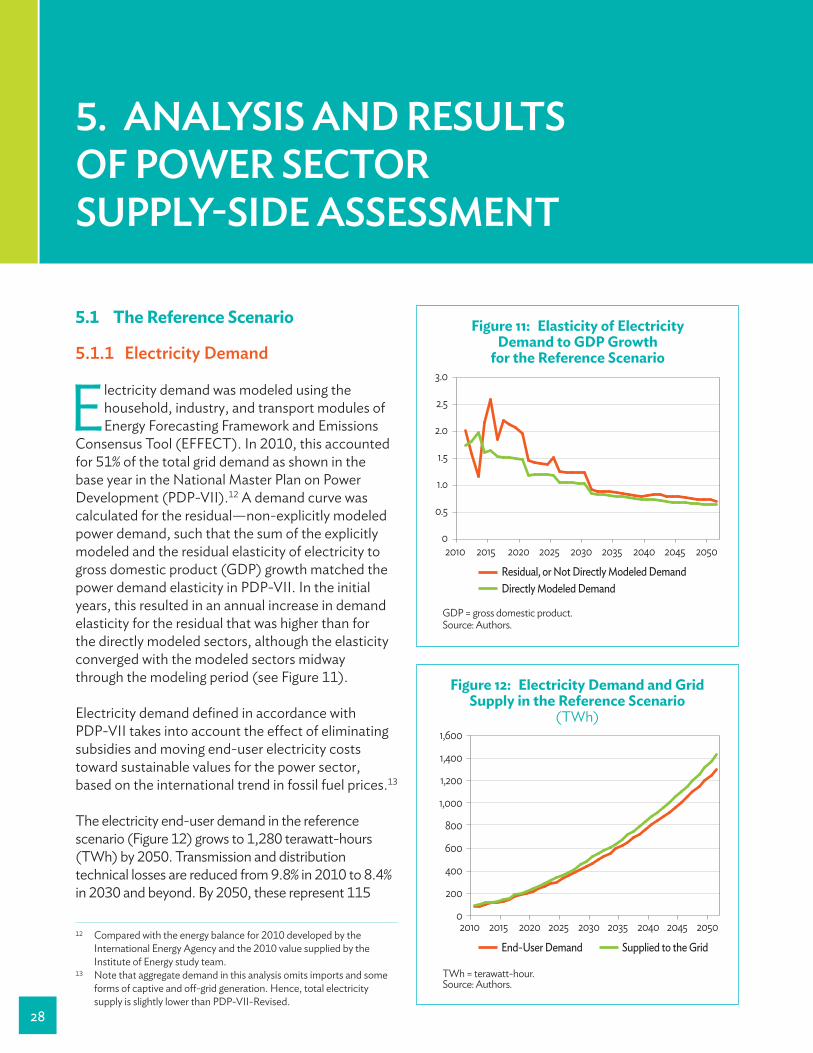
5. analysIs and results of Power sector suPPly-sIde assessment
28
5.1 The Reference Scenario
5.1.1 electricity demand
Electricity demand was modeled using the household, industry, and transport modules of Energy Forecasting Framework and Emissions
Consensus Tool (EFFECT). In 2010, this accounted for 51% of the total grid demand as shown in the base year in the National Master Plan on Power Development (PDP-VII).12 A demand curve was calculated for the residual—non-explicitly modeled power demand, such that the sum of the explicitly modeled and the residual elasticity of electricity to gross domestic product (GDP) growth matched the power demand elasticity in PDP-VII. In the initial years, this resulted in an annual increase in demand elasticity for the residual that was higher than for the directly modeled sectors, although the elasticity converged with the modeled sectors midway through the modeling period (see Figure 11).
Electricity demand defined in accordance with PDP-VII takes into account the effect of eliminating subsidies and moving end-user electricity costs toward sustainable values for the power sector, based on the international trend in fossil fuel prices.13
The electricity end-user demand in the reference scenario (Figure 12) grows to 1,280 terawatt-hours (TWh) by 2050. Transmission and distribution technical losses are reduced from 9.8% in 2010 to 8.4% in 2030 and beyond. By 2050, these represent 115
12 Compared with the energy balance for 2010 developed by the International Energy Agency and the 2010 value supplied by the Institute of Energy study team.
13 Note that aggregate demand in this analysis omits imports and some forms of captive and off-grid generation. Hence, total electricity supply is slightly lower than PDP-VII-Revised.
GDP = gross domestic product.Source: Authors.
0
0.5
1.o
1.5
2.0
2.5
3.0
2010 2015 2020 2025 2030 2035 2040 2045 2050 Residual, or Not Directly Modeled Demand Directly Modeled Demand
Figure 11: Elasticity of Electricity Demand to GDP Growth
for the Reference Scenario
TWh = terawatt-hour.Source: Authors.
0
200
400
600
800
1,000
1,200
1,400
1,600
2010 2015 2020 2025 2030 2035 2040 2045 2050
End-User Demand Supplied to the Grid
Figure 12: Electricity Demand and Grid Supply in the Reference Scenario
(TWh)
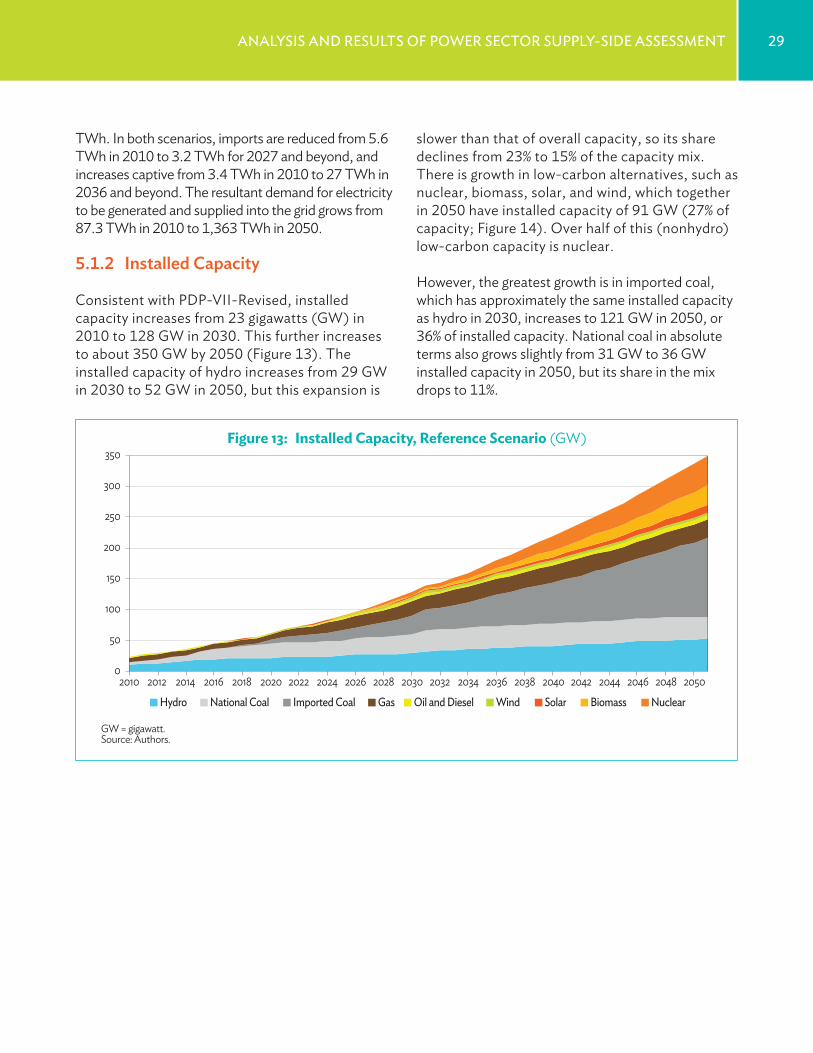
29analYsis and results oF Power seCtor suPPlY-side assessment
slower than that of overall capacity, so its share declines from 23% to 15% of the capacity mix. There is growth in low-carbon alternatives, such as nuclear, biomass, solar, and wind, which together in 2050 have installed capacity of 91 GW (27% of capacity; Figure 14). Over half of this (nonhydro) low-carbon capacity is nuclear.
However, the greatest growth is in imported coal, which has approximately the same installed capacity as hydro in 2030, increases to 121 GW in 2050, or 36% of installed capacity. National coal in absolute terms also grows slightly from 31 GW to 36 GW installed capacity in 2050, but its share in the mix drops to 11%.
TWh. In both scenarios, imports are reduced from 5.6 TWh in 2010 to 3.2 TWh for 2027 and beyond, and increases captive from 3.4 TWh in 2010 to 27 TWh in 2036 and beyond. The resultant demand for electricity to be generated and supplied into the grid grows from 87.3 TWh in 2010 to 1,363 TWh in 2050.
5.1.2 Installed capacity
Consistent with PDP-VII-Revised, installed capacity increases from 23 gigawatts (GW) in 2010 to 128 GW in 2030. This further increases to about 350 GW by 2050 (Figure 13). The installed capacity of hydro increases from 29 GW in 2030 to 52 GW in 2050, but this expansion is
GW = gigawatt.Source: Authors.
Hydro National Coal Imported Coal Gas Oil and Diesel Wind Solar Biomass Nuclear
0
50
100
150
200
250
300
350
2010 2012 2014 2016 2018 2020 2022 2024 2026 2028 2030 2032 2034 2036 2038 2040 2042 2044 2046 2048 2050
Figure 13: Installed Capacity, Reference Scenario (GW)
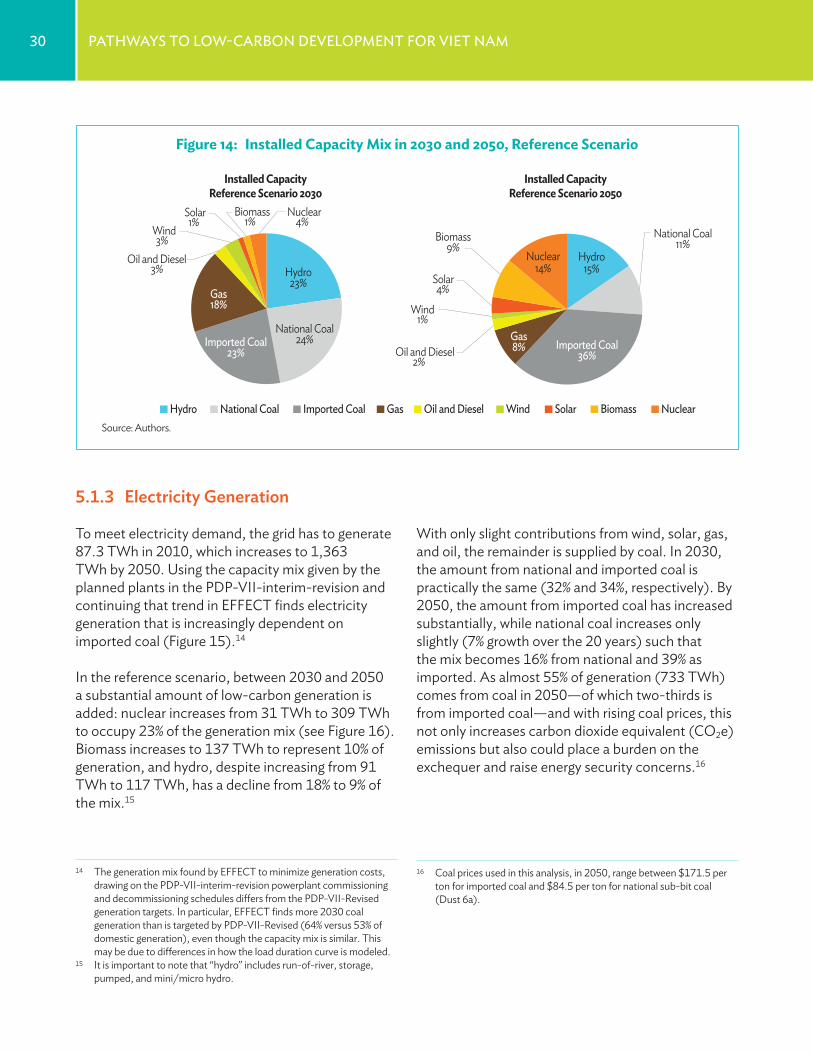
30 PathwaYs to low-Carbon develoPment For viet nam
With only slight contributions from wind, solar, gas, and oil, the remainder is supplied by coal. In 2030, the amount from national and imported coal is practically the same (32% and 34%, respectively). By 2050, the amount from imported coal has increased substantially, while national coal increases only slightly (7% growth over the 20 years) such that the mix becomes 16% from national and 39% as imported. As almost 55% of generation (733 TWh) comes from coal in 2050—of which two-thirds is from imported coal—and with rising coal prices, this not only increases carbon dioxide equivalent (CO2e) emissions but also could place a burden on the exchequer and raise energy security concerns.16
16 Coal prices used in this analysis, in 2050, range between $171.5 per ton for imported coal and $84.5 per ton for national sub-bit coal (Dust 6a).
5.1.3 electricity generation
To meet electricity demand, the grid has to generate 87.3 TWh in 2010, which increases to 1,363 TWh by 2050. Using the capacity mix given by the planned plants in the PDP-VII-interim-revision and continuing that trend in EFFECT finds electricity generation that is increasingly dependent on imported coal (Figure 15).14
In the reference scenario, between 2030 and 2050 a substantial amount of low-carbon generation is added: nuclear increases from 31 TWh to 309 TWh to occupy 23% of the generation mix (see Figure 16). Biomass increases to 137 TWh to represent 10% of generation, and hydro, despite increasing from 91 TWh to 117 TWh, has a decline from 18% to 9% of the mix.15
14 The generation mix found by EFFECT to minimize generation costs, drawing on the PDP-VII-interim-revision powerplant commissioning and decommissioning schedules differs from the PDP-VII-Revised generation targets. In particular, EFFECT finds more 2030 coal generation than is targeted by PDP-VII-Revised (64% versus 53% of domestic generation), even though the capacity mix is similar. This may be due to differences in how the load duration curve is modeled.
15 It is important to note that “hydro” includes run-of-river, storage, pumped, and mini/micro hydro.
Hydro15%
National Coal11%
Imported Coal36%
Gas8%Oil and Diesel
2%
Wind 1%
Solar 4%
Biomass9%
Nuclear14%
Installed CapacityReference Scenario 2050
Hydro23%
National Coal24%Imported Coal
23%
Gas18%
Oil and Diesel 3%
Wind 3%
Solar 1%
Biomass 1%
Nuclear 4%
Installed CapacityReference Scenario 2030
Source: Authors.
Hydro National Coal Imported Coal Gas Oil and Diesel Wind Solar Biomass Nuclear
Figure 14: Installed Capacity Mix in 2030 and 2050, Reference Scenario
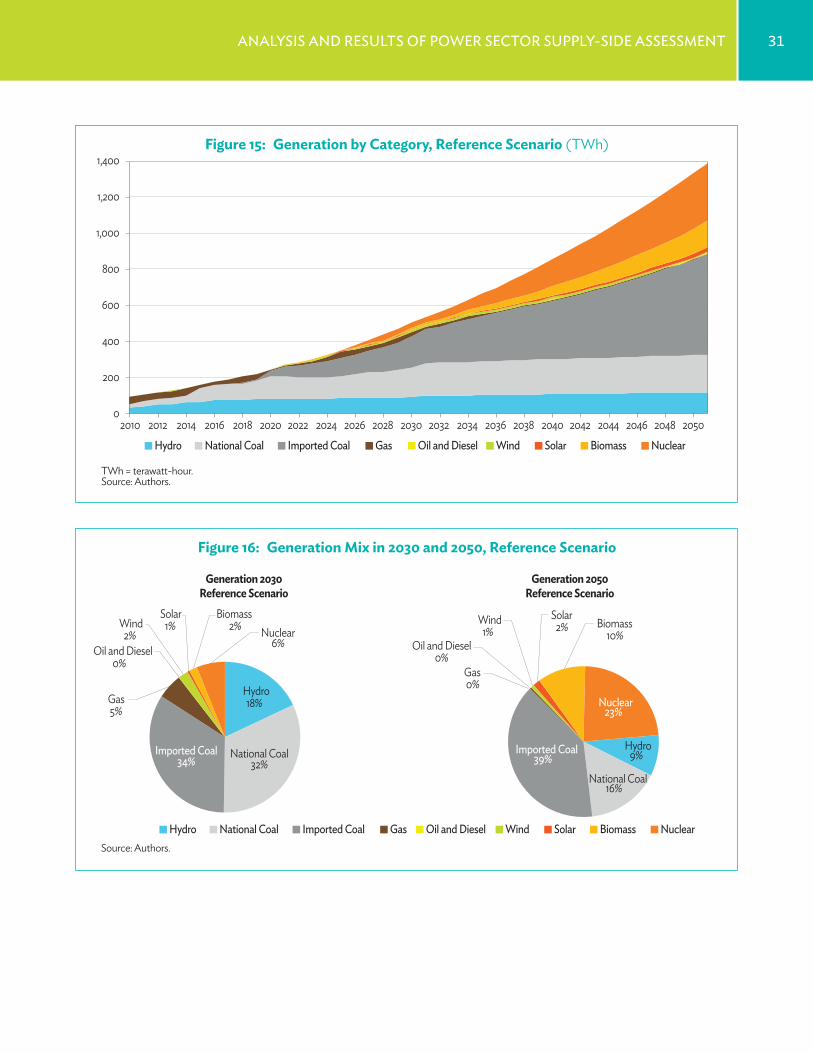
31analYsis and results oF Power seCtor suPPlY-side assessment
TWh = terawatt-hour.Source: Authors.
0
200
400
600
800
1,000
1,200
1,400
2010 2012 2014 2016 2018 2020 2022 2024 2026 2028 2030 2032 2034 2036 2038 2040 2042 2044 2046 2048 2050
Hydro National Coal Imported Coal Gas Oil and Diesel Wind Solar Biomass Nuclear
Figure 15: Generation by Category, Reference Scenario (TWh)
Source: Authors.
Hydro National Coal Imported Coal Gas Oil and Diesel Wind Solar Biomass Nuclear
Gas 5%
Oil and Diesel 0%
Wind 2%
Solar 1%
Biomass 2% Nuclear
6%
Generation 2030Reference Scenario
Generation 2050Reference Scenario
Hydro 9%
National Coal 16%
Imported Coal 39%
Gas 0%
Oil and Diesel 0%
Wind 1%
Solar 2% Biomass
10%
Nuclear 23%
National Coal 32%
Imported Coal 34%
Hydro 18%
Figure 16: Generation Mix in 2030 and 2050, Reference Scenario
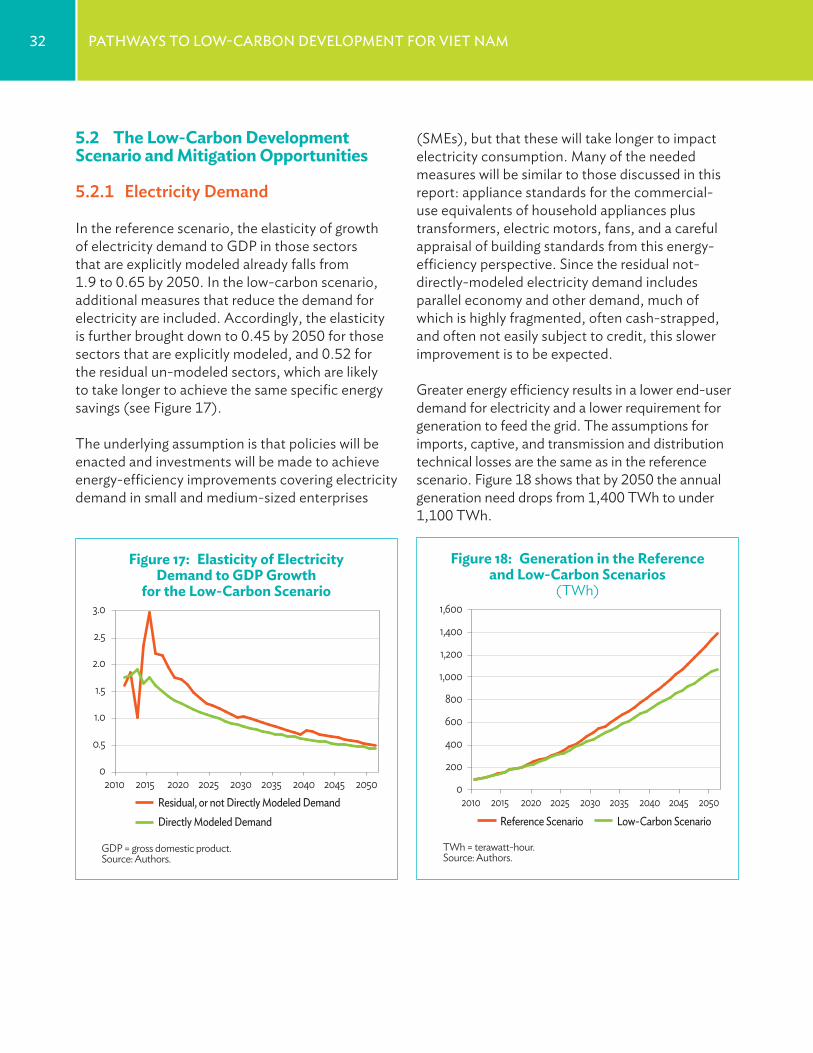
32 PathwaYs to low-Carbon develoPment For viet nam
(SMEs), but that these will take longer to impact electricity consumption. Many of the needed measures will be similar to those discussed in this report: appliance standards for the commercial-use equivalents of household appliances plus transformers, electric motors, fans, and a careful appraisal of building standards from this energy-efficiency perspective. Since the residual not-directly-modeled electricity demand includes parallel economy and other demand, much of which is highly fragmented, often cash-strapped, and often not easily subject to credit, this slower improvement is to be expected.
Greater energy efficiency results in a lower end-user demand for electricity and a lower requirement for generation to feed the grid. The assumptions for imports, captive, and transmission and distribution technical losses are the same as in the reference scenario. Figure 18 shows that by 2050 the annual generation need drops from 1,400 TWh to under 1,100 TWh.
5.2 The Low-Carbon Development Scenario and Mitigation Opportunities
5.2.1 electricity demand
In the reference scenario, the elasticity of growth of electricity demand to GDP in those sectors that are explicitly modeled already falls from 1.9 to 0.65 by 2050. In the low-carbon scenario, additional measures that reduce the demand for electricity are included. Accordingly, the elasticity is further brought down to 0.45 by 2050 for those sectors that are explicitly modeled, and 0.52 for the residual un-modeled sectors, which are likely to take longer to achieve the same specific energy savings (see Figure 17).
The underlying assumption is that policies will be enacted and investments will be made to achieve energy-efficiency improvements covering electricity demand in small and medium-sized enterprises
GDP = gross domestic product.Source: Authors.
0
0.5
1.0
1.5
2.0
2.5
3.0
2010 2015 2020 2025 2030 2035 2040 2045 2050 Residual, or not Directly Modeled Demand Directly Modeled Demand
Figure 17: Elasticity of Electricity Demand to GDP Growth
for the Low-Carbon Scenario
TWh = terawatt-hour.Source: Authors.
Reference Scenario Low-Carbon Scenario
0
200
400
600
800
1,000
1,200
1,400
1,600
2010 2015 2020 2025 2030 2035 2040 2045 2050
Figure 18: Generation in the Reference and Low-Carbon Scenarios
(TWh)
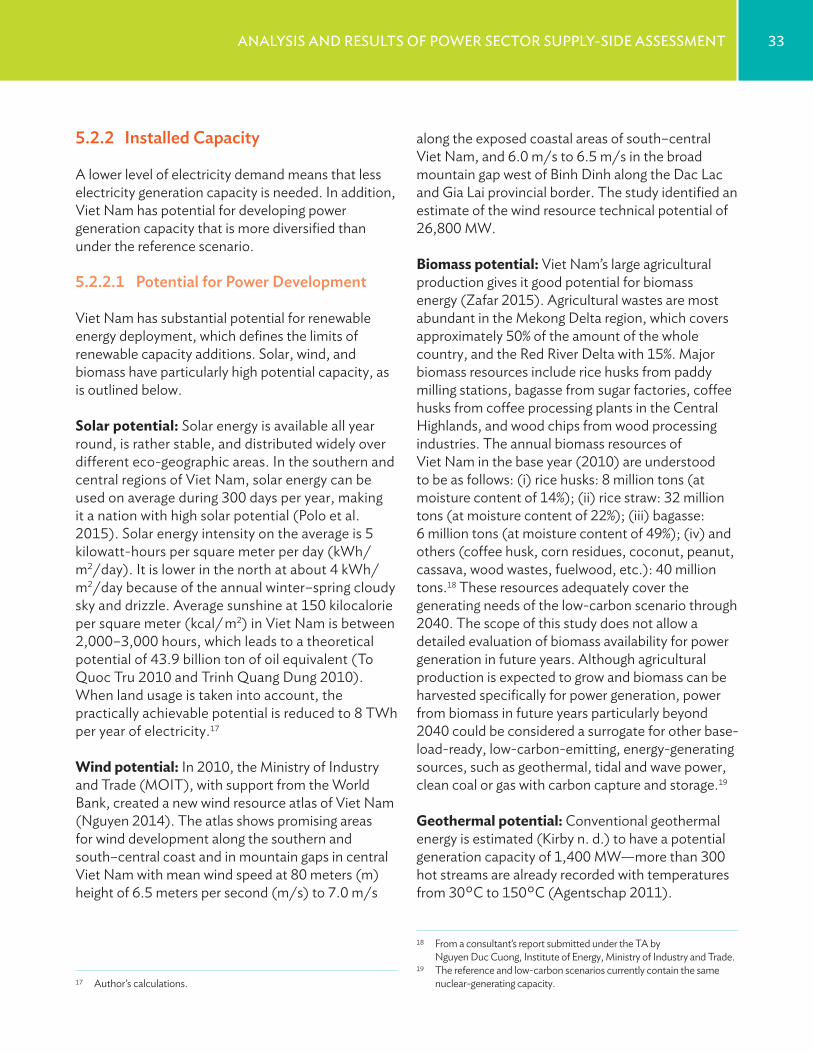
33analYsis and results oF Power seCtor suPPlY-side assessment
along the exposed coastal areas of south–central Viet Nam, and 6.0 m/s to 6.5 m/s in the broad mountain gap west of Binh Dinh along the Dac Lac and Gia Lai provincial border. The study identified an estimate of the wind resource technical potential of 26,800 MW.
Biomass potential: Viet Nam’s large agricultural production gives it good potential for biomass energy (Zafar 2015). Agricultural wastes are most abundant in the Mekong Delta region, which covers approximately 50% of the amount of the whole country, and the Red River Delta with 15%. Major biomass resources include rice husks from paddy milling stations, bagasse from sugar factories, coffee husks from coffee processing plants in the Central Highlands, and wood chips from wood processing industries. The annual biomass resources of Viet Nam in the base year (2010) are understood to be as follows: (i) rice husks: 8 million tons (at moisture content of 14%); (ii) rice straw: 32 million tons (at moisture content of 22%); (iii) bagasse: 6 million tons (at moisture content of 49%); (iv) and others (coffee husk, corn residues, coconut, peanut, cassava, wood wastes, fuelwood, etc.): 40 million tons.18 These resources adequately cover the generating needs of the low-carbon scenario through 2040. The scope of this study does not allow a detailed evaluation of biomass availability for power generation in future years. Although agricultural production is expected to grow and biomass can be harvested specifically for power generation, power from biomass in future years particularly beyond 2040 could be considered a surrogate for other base-load-ready, low-carbon-emitting, energy-generating sources, such as geothermal, tidal and wave power, clean coal or gas with carbon capture and storage.19
Geothermal potential: Conventional geothermal energy is estimated (Kirby n. d.) to have a potential generation capacity of 1,400 MW—more than 300 hot streams are already recorded with temperatures from 30°C to 150°C (Agentschap 2011).
18 From a consultant’s report submitted under the TA by Nguyen Duc Cuong, Institute of Energy, Ministry of Industry and Trade.
19 The reference and low-carbon scenarios currently contain the same nuclear-generating capacity.
5.2.2 Installed capacity
A lower level of electricity demand means that less electricity generation capacity is needed. In addition, Viet Nam has potential for developing power generation capacity that is more diversified than under the reference scenario.
5.2.2.1 Potential for Power development
Viet Nam has substantial potential for renewable energy deployment, which defines the limits of renewable capacity additions. Solar, wind, and biomass have particularly high potential capacity, as is outlined below.
Solar potential: Solar energy is available all year round, is rather stable, and distributed widely over different eco-geographic areas. In the southern and central regions of Viet Nam, solar energy can be used on average during 300 days per year, making it a nation with high solar potential (Polo et al. 2015). Solar energy intensity on the average is 5 kilowatt-hours per square meter per day (kWh/m2/day). It is lower in the north at about 4 kWh/m2/day because of the annual winter–spring cloudy sky and drizzle. Average sunshine at 150 kilocalorie per square meter (kcal/ m2) in Viet Nam is between 2,000–3,000 hours, which leads to a theoretical potential of 43.9 billion ton of oil equivalent (To Quoc Tru 2010 and Trinh Quang Dung 2010). When land usage is taken into account, the practically achievable potential is reduced to 8 TWh per year of electricity.17
Wind potential: In 2010, the Ministry of Industry and Trade (MOIT), with support from the World Bank, created a new wind resource atlas of Viet Nam (Nguyen 2014). The atlas shows promising areas for wind development along the southern and south–central coast and in mountain gaps in central Viet Nam with mean wind speed at 80 meters (m) height of 6.5 meters per second (m/s) to 7.0 m/s
17 Author’s calculations.
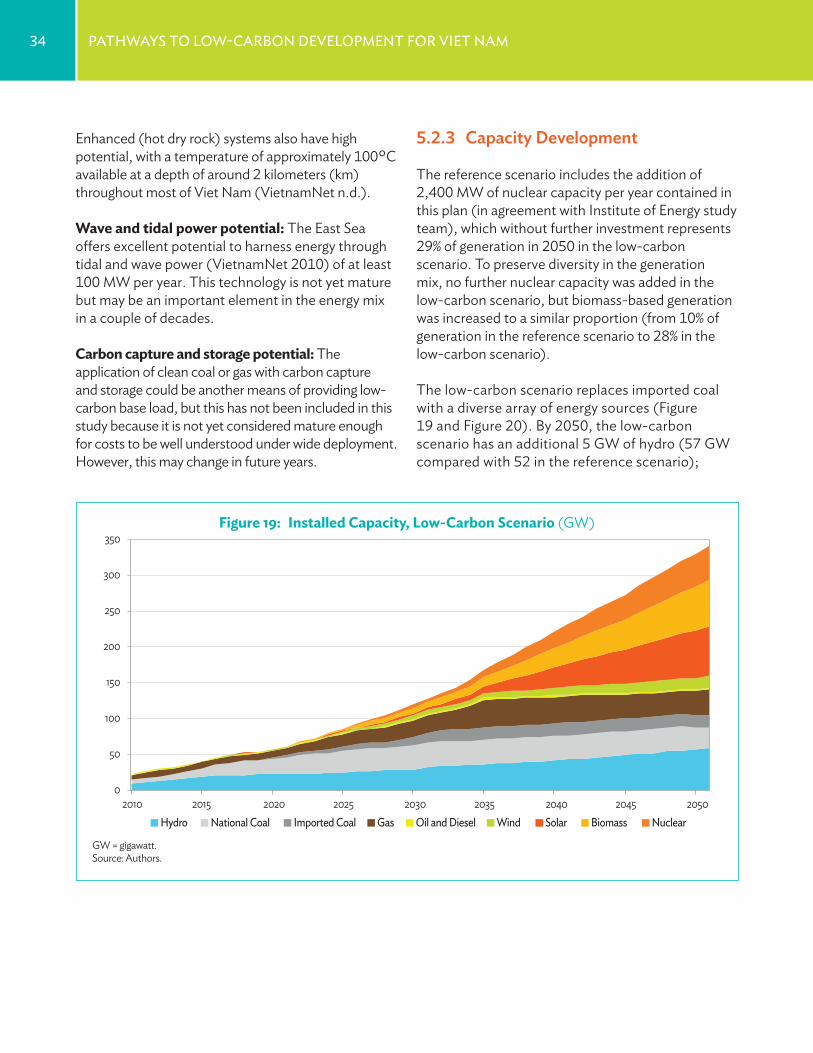
34 PathwaYs to low-Carbon develoPment For viet nam
GW = gigawatt.Source: Authors.
Hydro National Coal Imported Coal Gas Oil and Diesel Wind Solar Biomass Nuclear
0
50
100
150
200
250
300
350
2010 2015 2020 2025 2030 2035 2040 2045 2050
Figure 19: Installed Capacity, Low-Carbon Scenario (GW)
Enhanced (hot dry rock) systems also have high potential, with a temperature of approximately 100°C available at a depth of around 2 kilometers (km) throughout most of Viet Nam (VietnamNet n.d.).
Wave and tidal power potential: The East Sea offers excellent potential to harness energy through tidal and wave power (VietnamNet 2010) of at least 100 MW per year. This technology is not yet mature but may be an important element in the energy mix in a couple of decades.
Carbon capture and storage potential: The application of clean coal or gas with carbon capture and storage could be another means of providing low-carbon base load, but this has not been included in this study because it is not yet considered mature enough for costs to be well understood under wide deployment. However, this may change in future years.
5.2.3 capacity development
The reference scenario includes the addition of 2,400 MW of nuclear capacity per year contained in this plan (in agreement with Institute of Energy study team), which without further investment represents 29% of generation in 2050 in the low-carbon scenario. To preserve diversity in the generation mix, no further nuclear capacity was added in the low-carbon scenario, but biomass-based generation was increased to a similar proportion (from 10% of generation in the reference scenario to 28% in the low-carbon scenario).
The low-carbon scenario replaces imported coal with a diverse array of energy sources (Figure 19 and Figure 20). By 2050, the low-carbon scenario has an additional 5 GW of hydro (57 GW compared with 52 in the reference scenario);
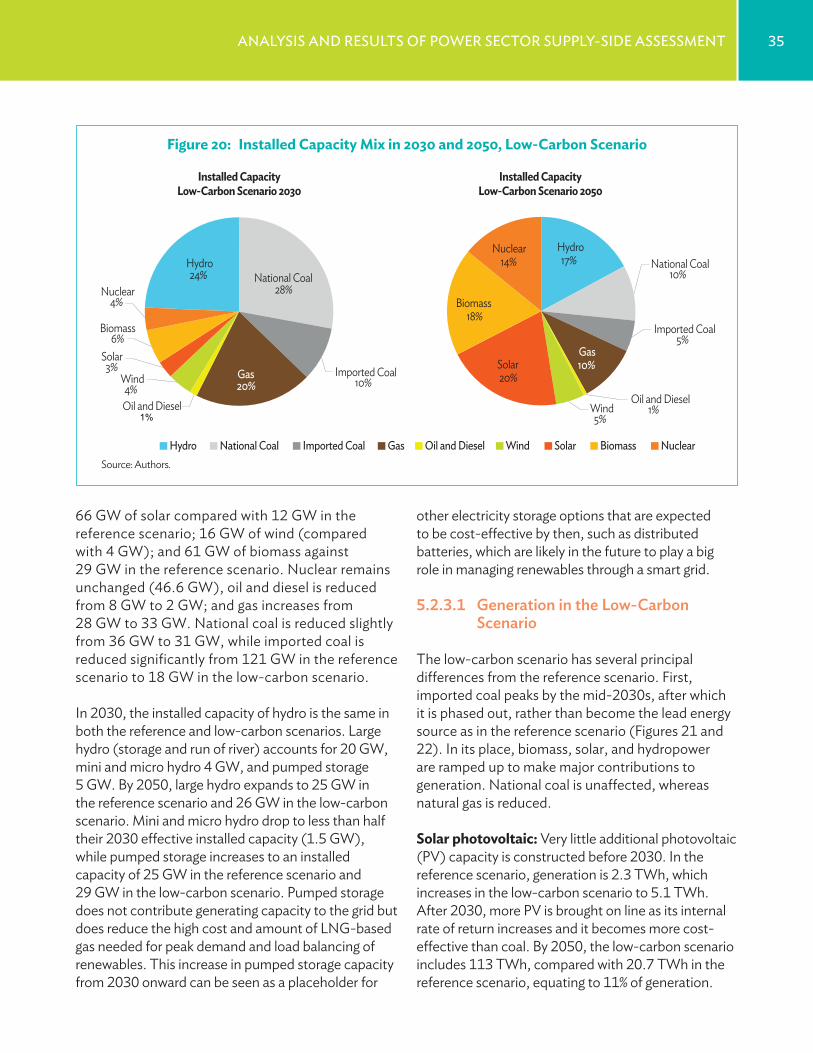
35analYsis and results oF Power seCtor suPPlY-side assessment
other electricity storage options that are expected to be cost-effective by then, such as distributed batteries, which are likely in the future to play a big role in managing renewables through a smart grid.
5.2.3.1 generation in the low-carbon scenario
The low-carbon scenario has several principal differences from the reference scenario. First, imported coal peaks by the mid-2030s, after which it is phased out, rather than become the lead energy source as in the reference scenario (Figures 21 and 22). In its place, biomass, solar, and hydropower are ramped up to make major contributions to generation. National coal is unaffected, whereas natural gas is reduced.
Solar photovoltaic: Very little additional photovoltaic (PV) capacity is constructed before 2030. In the reference scenario, generation is 2.3 TWh, which increases in the low-carbon scenario to 5.1 TWh. After 2030, more PV is brought on line as its internal rate of return increases and it becomes more cost-effective than coal. By 2050, the low-carbon scenario includes 113 TWh, compared with 20.7 TWh in the reference scenario, equating to 11% of generation.
66 GW of solar compared with 12 GW in the reference scenario; 16 GW of wind (compared with 4 GW); and 61 GW of biomass against 29 GW in the reference scenario. Nuclear remains unchanged (46.6 GW), oil and diesel is reduced from 8 GW to 2 GW; and gas increases from 28 GW to 33 GW. National coal is reduced slightly from 36 GW to 31 GW, while imported coal is reduced significantly from 121 GW in the reference scenario to 18 GW in the low-carbon scenario.
In 2030, the installed capacity of hydro is the same in both the reference and low-carbon scenarios. Large hydro (storage and run of river) accounts for 20 GW, mini and micro hydro 4 GW, and pumped storage 5 GW. By 2050, large hydro expands to 25 GW in the reference scenario and 26 GW in the low-carbon scenario. Mini and micro hydro drop to less than half their 2030 effective installed capacity (1.5 GW), while pumped storage increases to an installed capacity of 25 GW in the reference scenario and 29 GW in the low-carbon scenario. Pumped storage does not contribute generating capacity to the grid but does reduce the high cost and amount of LNG-based gas needed for peak demand and load balancing of renewables. This increase in pumped storage capacity from 2030 onward can be seen as a placeholder for
Hydro 17% National Coal
10%
Imported Coal 5%
Gas 10%
Oil and Diesel 1% Wind
5%
Solar 20%
Biomass 18%
Nuclear 14%
Installed CapacityLow-Carbon Scenario 2050
Hydro 24% National Coal
28%
Imported Coal 10%
Gas 20%
Oil and Diesel 1%
Wind 4%
Solar 3%
Biomass 6%
Nuclear 4%
Installed CapacityLow-Carbon Scenario 2030
Source: Authors.
Hydro National Coal Imported Coal Gas Oil and Diesel Wind Solar Biomass Nuclear
Figure 20: Installed Capacity Mix in 2030 and 2050, Low-Carbon Scenario
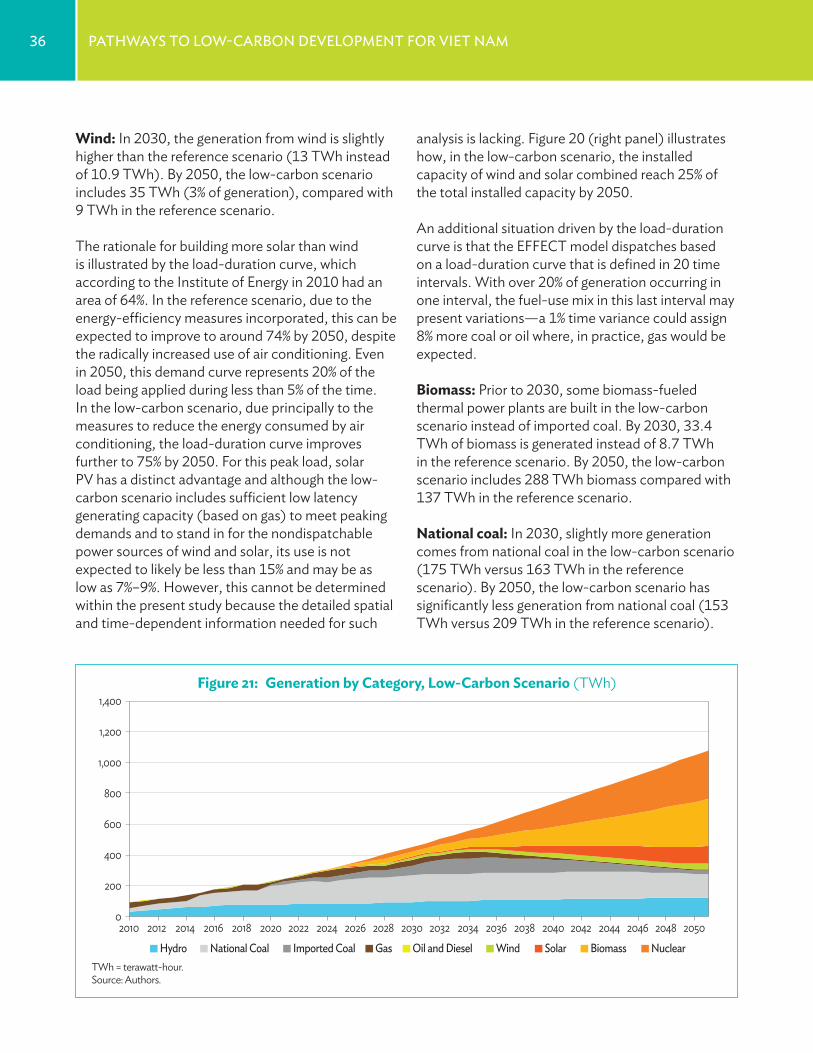
36 PathwaYs to low-Carbon develoPment For viet nam
analysis is lacking. Figure 20 (right panel) illustrates how, in the low-carbon scenario, the installed capacity of wind and solar combined reach 25% of the total installed capacity by 2050.
An additional situation driven by the load-duration curve is that the EFFECT model dispatches based on a load-duration curve that is defined in 20 time intervals. With over 20% of generation occurring in one interval, the fuel-use mix in this last interval may present variations—a 1% time variance could assign 8% more coal or oil where, in practice, gas would be expected.
Biomass: Prior to 2030, some biomass-fueled thermal power plants are built in the low-carbon scenario instead of imported coal. By 2030, 33.4 TWh of biomass is generated instead of 8.7 TWh in the reference scenario. By 2050, the low-carbon scenario includes 288 TWh biomass compared with 137 TWh in the reference scenario.
National coal: In 2030, slightly more generation comes from national coal in the low-carbon scenario (175 TWh versus 163 TWh in the reference scenario). By 2050, the low-carbon scenario has significantly less generation from national coal (153 TWh versus 209 TWh in the reference scenario).
Wind: In 2030, the generation from wind is slightly higher than the reference scenario (13 TWh instead of 10.9 TWh). By 2050, the low-carbon scenario includes 35 TWh (3% of generation), compared with 9 TWh in the reference scenario.
The rationale for building more solar than wind is illustrated by the load-duration curve, which according to the Institute of Energy in 2010 had an area of 64%. In the reference scenario, due to the energy-efficiency measures incorporated, this can be expected to improve to around 74% by 2050, despite the radically increased use of air conditioning. Even in 2050, this demand curve represents 20% of the load being applied during less than 5% of the time. In the low-carbon scenario, due principally to the measures to reduce the energy consumed by air conditioning, the load-duration curve improves further to 75% by 2050. For this peak load, solar PV has a distinct advantage and although the low-carbon scenario includes sufficient low latency generating capacity (based on gas) to meet peaking demands and to stand in for the nondispatchable power sources of wind and solar, its use is not expected to likely be less than 15% and may be as low as 7%–9%. However, this cannot be determined within the present study because the detailed spatial and time-dependent information needed for such
0
200
400
600
800
1,000
1,200
1,400
2010 2012 2014 2016 2018 2020 2022 2024 2026 2028 2030 2032 2034 2036 2038 2040 2042 2044 2046 2048 2050
TWh = terawatt-hour.Source: Authors.
Hydro National Coal Imported Coal Gas Oil and Diesel Wind Solar Biomass Nuclear
Figure 21: Generation by Category, Low-Carbon Scenario (TWh)
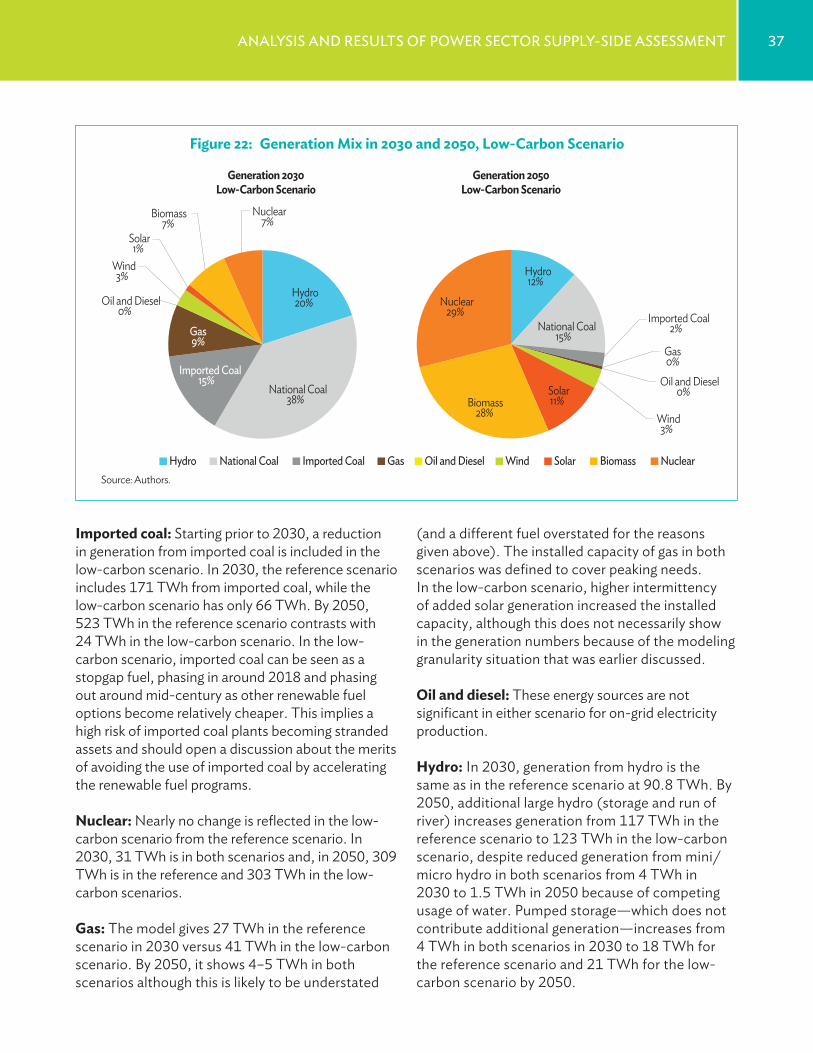
37analYsis and results oF Power seCtor suPPlY-side assessment
Imported coal: Starting prior to 2030, a reduction in generation from imported coal is included in the low-carbon scenario. In 2030, the reference scenario includes 171 TWh from imported coal, while the low-carbon scenario has only 66 TWh. By 2050, 523 TWh in the reference scenario contrasts with 24 TWh in the low-carbon scenario. In the low-carbon scenario, imported coal can be seen as a stopgap fuel, phasing in around 2018 and phasing out around mid-century as other renewable fuel options become relatively cheaper. This implies a high risk of imported coal plants becoming stranded assets and should open a discussion about the merits of avoiding the use of imported coal by accelerating the renewable fuel programs.
Nuclear: Nearly no change is reflected in the low-carbon scenario from the reference scenario. In 2030, 31 TWh is in both scenarios and, in 2050, 309 TWh is in the reference and 303 TWh in the low-carbon scenarios.
Gas: The model gives 27 TWh in the reference scenario in 2030 versus 41 TWh in the low-carbon scenario. By 2050, it shows 4–5 TWh in both scenarios although this is likely to be understated
(and a different fuel overstated for the reasons given above). The installed capacity of gas in both scenarios was defined to cover peaking needs. In the low-carbon scenario, higher intermittency of added solar generation increased the installed capacity, although this does not necessarily show in the generation numbers because of the modeling granularity situation that was earlier discussed.
Oil and diesel: These energy sources are not significant in either scenario for on-grid electricity production.
Hydro: In 2030, generation from hydro is the same as in the reference scenario at 90.8 TWh. By 2050, additional large hydro (storage and run of river) increases generation from 117 TWh in the reference scenario to 123 TWh in the low-carbon scenario, despite reduced generation from mini/micro hydro in both scenarios from 4 TWh in 2030 to 1.5 TWh in 2050 because of competing usage of water. Pumped storage—which does not contribute additional generation—increases from 4 TWh in both scenarios in 2030 to 18 TWh for the reference scenario and 21 TWh for the low-carbon scenario by 2050.
Hydro 20%
National Coal 38%
Imported Coal 15%
Gas 9%
Oil and Diesel 0%
Wind 3%
Solar 1%
Biomass 7%
Nuclear 7%
Generation 2030Low-Carbon Scenario
Hydro 12%
National Coal 15%
Imported Coal 2%
Gas 0%
Oil and Diesel 0%
Wind 3%
Solar 11% Biomass
28%
Nuclear 29%
Generation 2050Low-Carbon Scenario
Source: Authors.
Hydro National Coal Imported Coal Gas Oil and Diesel Wind Solar Biomass Nuclear
Figure 22: Generation Mix in 2030 and 2050, Low-Carbon Scenario
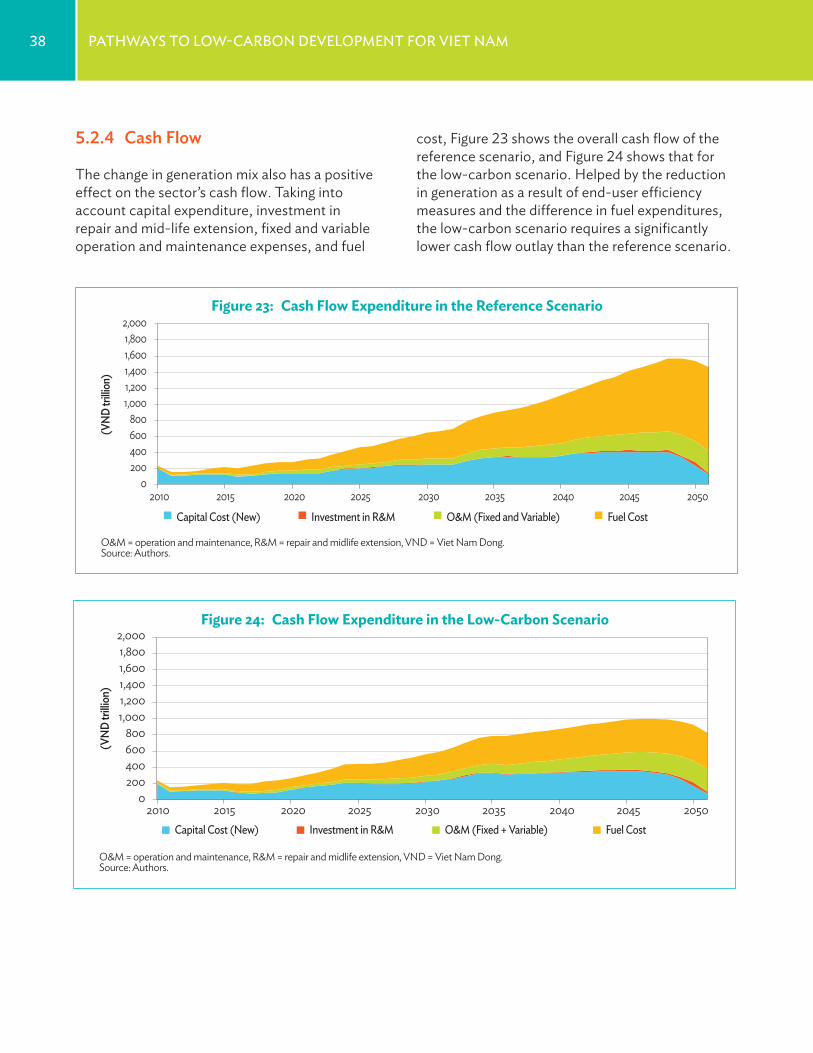
38 PathwaYs to low-Carbon develoPment For viet nam
O&M = operation and maintenance, R&M = repair and midlife extension, VND = Viet Nam Dong.Source: Authors.
0 200 400 600 800
1,000
(VND
trilli
on)
1,200 1,400 1,600 1,800
2,000
2010 2015 2020 2025 2030 2035 2040 2045 2050
Capital Cost (New) Investment in R&M O&M (Fixed and Variable) Fuel Cost
Figure 23: Cash Flow Expenditure in the Reference Scenario
0 200 400 600 800
1,000 1,200 1,400 1,600 1,800
2,000
2010 2015 2020 2025 2030 2035 2040 2045 2050
O&M = operation and maintenance, R&M = repair and midlife extension, VND = Viet Nam Dong.Source: Authors.
Capital Cost (New) Investment in R&M
(VND
trilli
on)
O&M (Fixed + Variable) Fuel Cost
Figure 24: Cash Flow Expenditure in the Low-Carbon Scenario
5.2.4 cash flow
The change in generation mix also has a positive effect on the sector’s cash flow. Taking into account capital expenditure, investment in repair and mid-life extension, fixed and variable operation and maintenance expenses, and fuel
cost, Figure 23 shows the overall cash flow of the reference scenario, and Figure 24 shows that for the low-carbon scenario. Helped by the reduction in generation as a result of end-user efficiency measures and the difference in fuel expenditures, the low-carbon scenario requires a significantly lower cash flow outlay than the reference scenario.
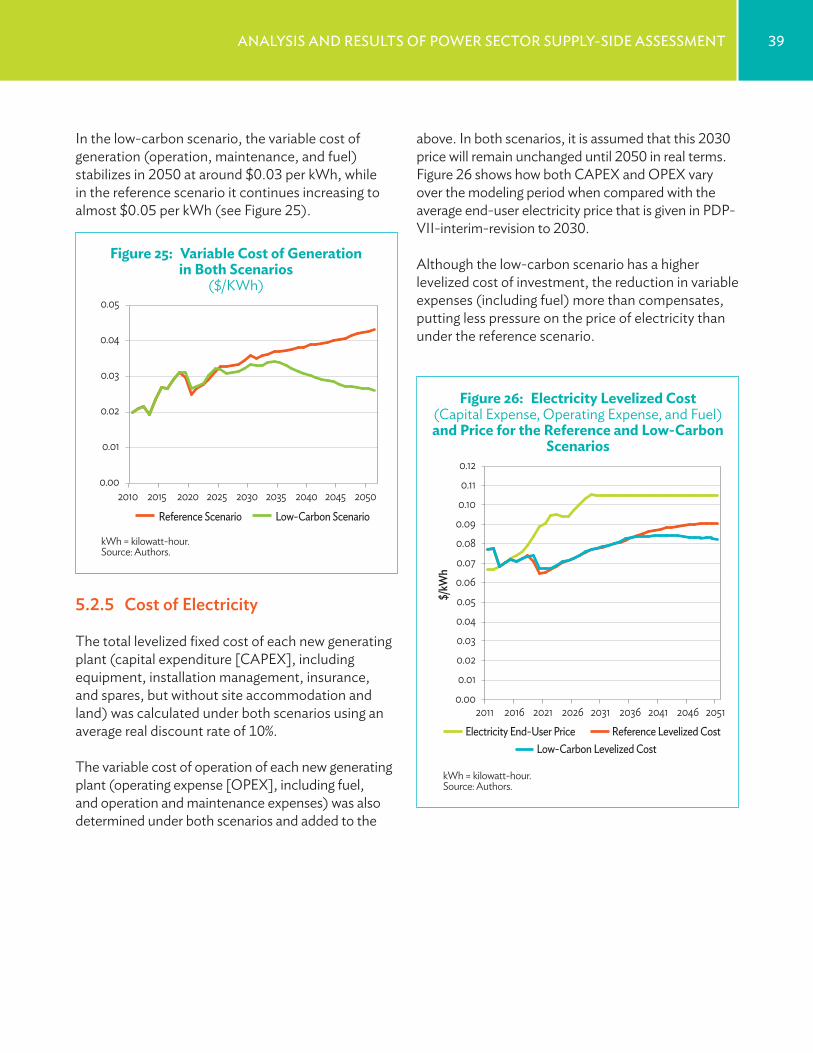
39analYsis and results oF Power seCtor suPPlY-side assessment
above. In both scenarios, it is assumed that this 2030 price will remain unchanged until 2050 in real terms. Figure 26 shows how both CAPEX and OPEX vary over the modeling period when compared with the average end-user electricity price that is given in PDP-VII-interim-revision to 2030.
Although the low-carbon scenario has a higher levelized cost of investment, the reduction in variable expenses (including fuel) more than compensates, putting less pressure on the price of electricity than under the reference scenario.
kWh = kilowatt-hour.Source: Authors.
Reference Scenario Low-Carbon Scenario
0.00
0.01
0.02
0.03
0.04
0.05
2010 2015 2020 2025 2030 2035 2040 2045 2050
Figure 25: Variable Cost of Generation in Both Scenarios
($/KWh)
kWh = kilowatt-hour.Source: Authors.
0.00 0.01 0.02 0.03 0.04 0.05 0.06 0.07 0.08 0.09 0.10 0.11 0.12
2011 2016 2021 2026 2031 2036 2041 2046 2051 Electricity End-User Price Reference Levelized Cost
Low-Carbon Levelized Cost
$/kW
h
Figure 26: Electricity Levelized Cost (Capital Expense, Operating Expense, and Fuel) and Price for the Reference and Low-Carbon
Scenarios
In the low-carbon scenario, the variable cost of generation (operation, maintenance, and fuel) stabilizes in 2050 at around $0.03 per kWh, while in the reference scenario it continues increasing to almost $0.05 per kWh (see Figure 25).
5.2.5 cost of electricity
The total levelized fixed cost of each new generating plant (capital expenditure [CAPEX], including equipment, installation management, insurance, and spares, but without site accommodation and land) was calculated under both scenarios using an average real discount rate of 10%.
The variable cost of operation of each new generating plant (operating expense [OPEX], including fuel, and operation and maintenance expenses) was also determined under both scenarios and added to the
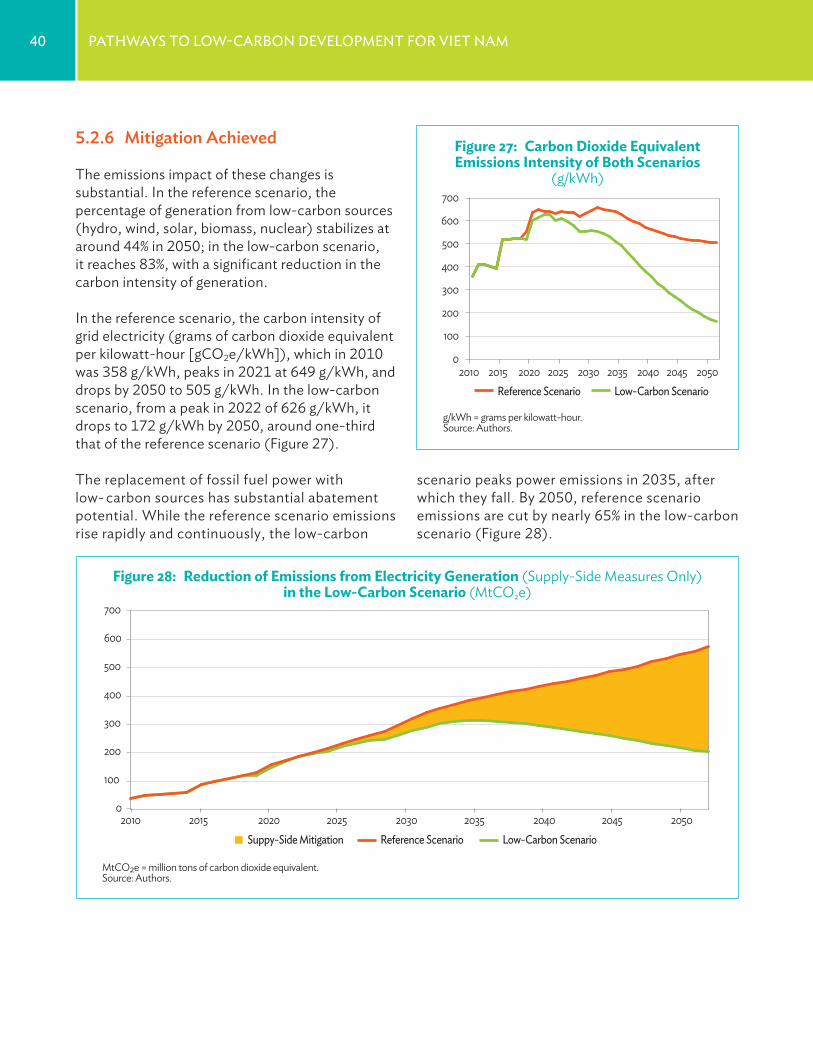
40 PathwaYs to low-Carbon develoPment For viet nam
g/kWh = grams per kilowatt-hour. Source: Authors.
Reference Scenario Low-Carbon Scenario
0
100
200
300
400
500
600
700
2010 2015 2020 2025 2030 2035 2040 2045 2050
Figure 27: Carbon Dioxide Equivalent Emissions Intensity of Both Scenarios
(g/kWh)
MtCO2e = million tons of carbon dioxide equivalent.Source: Authors.
Reference Scenario Low-Carbon Scenario
0
100
200
300
400
500
600
700
2010 2015 2020 2025 2030 2035 2040 2045 2050 Suppy-Side Mitigation
Figure 28: Reduction of Emissions from Electricity Generation (Supply-Side Measures Only) in the Low-Carbon Scenario (MtCO2e)
5.2.6 mitigation achieved
The emissions impact of these changes is substantial. In the reference scenario, the percentage of generation from low-carbon sources (hydro, wind, solar, biomass, nuclear) stabilizes at around 44% in 2050; in the low-carbon scenario, it reaches 83%, with a significant reduction in the carbon intensity of generation.
In the reference scenario, the carbon intensity of grid electricity (grams of carbon dioxide equivalent per kilowatt-hour [gCO2e/kWh]), which in 2010 was 358 g/kWh, peaks in 2021 at 649 g/kWh, and drops by 2050 to 505 g/kWh. In the low-carbon scenario, from a peak in 2022 of 626 g/kWh, it drops to 172 g/kWh by 2050, around one-third that of the reference scenario (Figure 27).
The replacement of fossil fuel power with low- carbon sources has substantial abatement potential. While the reference scenario emissions rise rapidly and continuously, the low-carbon
scenario peaks power emissions in 2035, after which they fall. By 2050, reference scenario emissions are cut by nearly 65% in the low-carbon scenario (Figure 28).
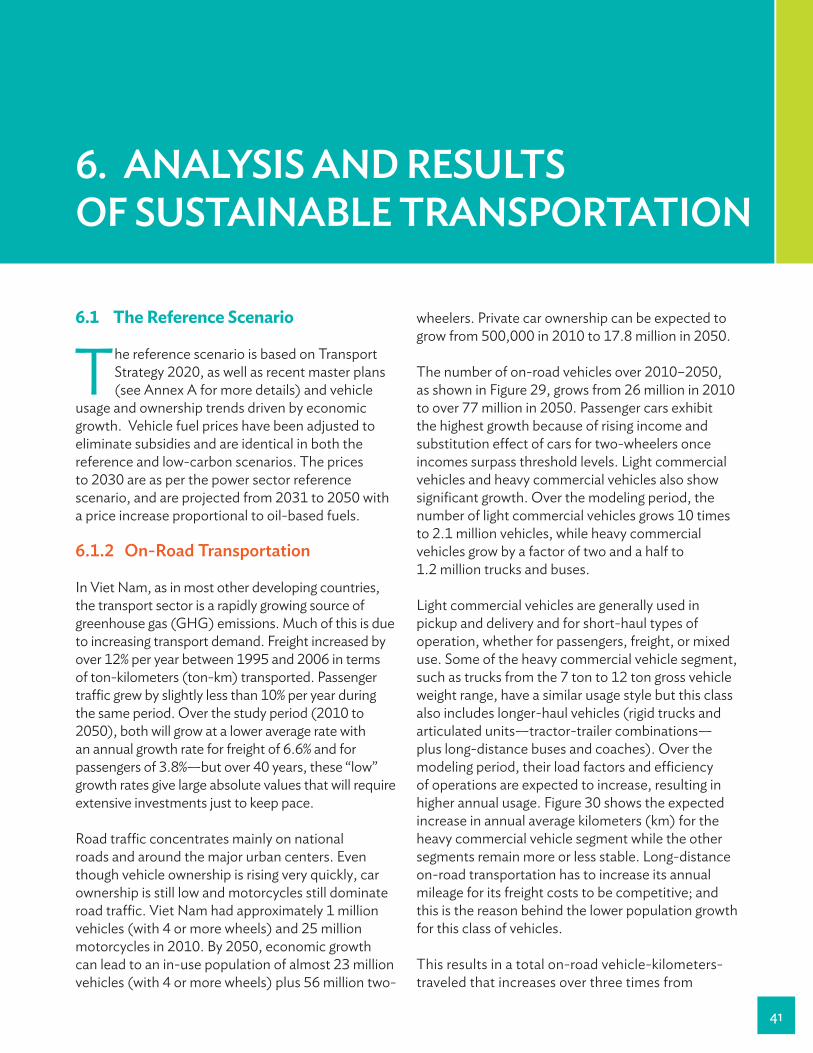
6. analysIs and results of sustaInable transPortatIon
41
6.1 The Reference Scenario
The reference scenario is based on Transport Strategy 2020, as well as recent master plans (see Annex A for more details) and vehicle
usage and ownership trends driven by economic growth. Vehicle fuel prices have been adjusted to eliminate subsidies and are identical in both the reference and low-carbon scenarios. The prices to 2030 are as per the power sector reference scenario, and are projected from 2031 to 2050 with a price increase proportional to oil-based fuels.
6.1.2 on-road transportation
In Viet Nam, as in most other developing countries, the transport sector is a rapidly growing source of greenhouse gas (GHG) emissions. Much of this is due to increasing transport demand. Freight increased by over 12% per year between 1995 and 2006 in terms of ton-kilometers (ton-km) transported. Passenger traffic grew by slightly less than 10% per year during the same period. Over the study period (2010 to 2050), both will grow at a lower average rate with an annual growth rate for freight of 6.6% and for passengers of 3.8%—but over 40 years, these “low” growth rates give large absolute values that will require extensive investments just to keep pace.
Road traffic concentrates mainly on national roads and around the major urban centers. Even though vehicle ownership is rising very quickly, car ownership is still low and motorcycles still dominate road traffic. Viet Nam had approximately 1 million vehicles (with 4 or more wheels) and 25 million motorcycles in 2010. By 2050, economic growth can lead to an in-use population of almost 23 million vehicles (with 4 or more wheels) plus 56 million two-
wheelers. Private car ownership can be expected to grow from 500,000 in 2010 to 17.8 million in 2050.
The number of on-road vehicles over 2010–2050, as shown in Figure 29, grows from 26 million in 2010 to over 77 million in 2050. Passenger cars exhibit the highest growth because of rising income and substitution effect of cars for two-wheelers once incomes surpass threshold levels. Light commercial vehicles and heavy commercial vehicles also show significant growth. Over the modeling period, the number of light commercial vehicles grows 10 times to 2.1 million vehicles, while heavy commercial vehicles grow by a factor of two and a half to 1.2 million trucks and buses.
Light commercial vehicles are generally used in pickup and delivery and for short-haul types of operation, whether for passengers, freight, or mixed use. Some of the heavy commercial vehicle segment, such as trucks from the 7 ton to 12 ton gross vehicle weight range, have a similar usage style but this class also includes longer-haul vehicles (rigid trucks and articulated units—tractor-trailer combinations—plus long-distance buses and coaches). Over the modeling period, their load factors and efficiency of operations are expected to increase, resulting in higher annual usage. Figure 30 shows the expected increase in annual average kilometers (km) for the heavy commercial vehicle segment while the other segments remain more or less stable. Long-distance on-road transportation has to increase its annual mileage for its freight costs to be competitive; and this is the reason behind the lower population growth for this class of vehicles.
This results in a total on-road vehicle-kilometers-traveled that increases over three times from
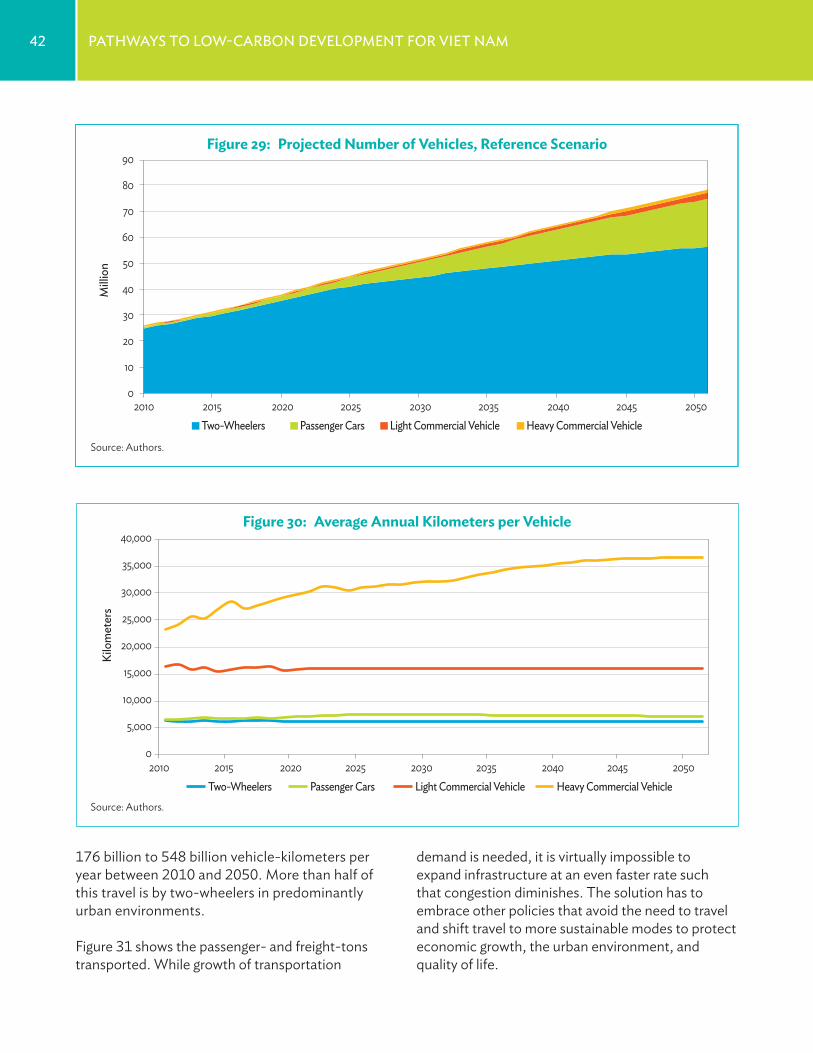
42 PathwaYs to low-Carbon develoPment For viet nam
0
5,000
10,000
15,000
20,000
25,000
30,000
35,000
40,000
2010 2015 2020 2025 2030 2035 2040 2045 2050 Two-Wheelers Passenger Cars Light Commercial Vehicle Heavy Commercial Vehicle
Kilo
met
ers
0
10
20
30
40
50
60
70
80
90
2010 2015 2020 2025 2030 2035 2040 2045 2050 Two-Wheelers Passenger Cars Light Commercial Vehicle Heavy Commercial Vehicle
Mill
ion
Figure 29: Projected Number of Vehicles, Reference Scenario
Source: Authors.
Source: Authors.
Figure 30: Average Annual Kilometers per Vehicle
176 billion to 548 billion vehicle-kilometers per year between 2010 and 2050. More than half of this travel is by two-wheelers in predominantly urban environments.
Figure 31 shows the passenger- and freight-tons transported. While growth of transportation
demand is needed, it is virtually impossible to expand infrastructure at an even faster rate such that congestion diminishes. The solution has to embrace other policies that avoid the need to travel and shift travel to more sustainable modes to protect economic growth, the urban environment, and quality of life.
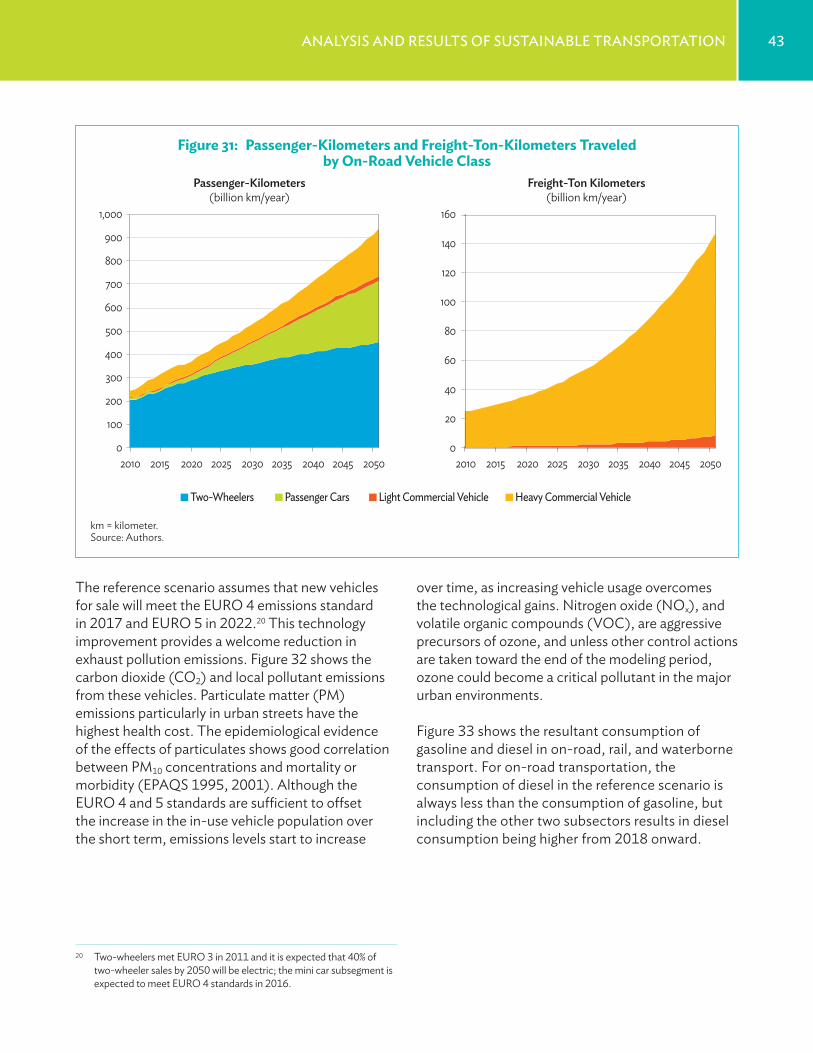
43analYsis and results oF sustainable transPortation
Two-Wheelers Passenger Cars Light Commercial Vehicle Heavy Commercial Vehicle
0
100
200
300
400
500
600
700
800
900
1,000
2010 2015 2020 2025 2030 2035 2040 2045 2050
Freight-Ton Kilometers(billion km/year)
Passenger-Kilometers(billion km/year)
0
20
40
60
80
100
120
140
160
2010 2015 2020 2025 2030 2035 2040 2045 2050
over time, as increasing vehicle usage overcomes the technological gains. Nitrogen oxide (NOx), and volatile organic compounds (VOC), are aggressive precursors of ozone, and unless other control actions are taken toward the end of the modeling period, ozone could become a critical pollutant in the major urban environments.
Figure 33 shows the resultant consumption of gasoline and diesel in on-road, rail, and waterborne transport. For on-road transportation, the consumption of diesel in the reference scenario is always less than the consumption of gasoline, but including the other two subsectors results in diesel consumption being higher from 2018 onward.
The reference scenario assumes that new vehicles for sale will meet the EURO 4 emissions standard in 2017 and EURO 5 in 2022.20 This technology improvement provides a welcome reduction in exhaust pollution emissions. Figure 32 shows the carbon dioxide (CO2) and local pollutant emissions from these vehicles. Particulate matter (PM) emissions particularly in urban streets have the highest health cost. The epidemiological evidence of the effects of particulates shows good correlation between PM10 concentrations and mortality or morbidity (EPAQS 1995, 2001). Although the EURO 4 and 5 standards are sufficient to offset the increase in the in-use vehicle population over the short term, emissions levels start to increase
20 Two-wheelers met EURO 3 in 2011 and it is expected that 40% of two-wheeler sales by 2050 will be electric; the mini car subsegment is expected to meet EURO 4 standards in 2016.
km = kilometer. Source: Authors.
Figure 31: Passenger-Kilometers and Freight-Ton-Kilometers Traveled by On-Road Vehicle Class
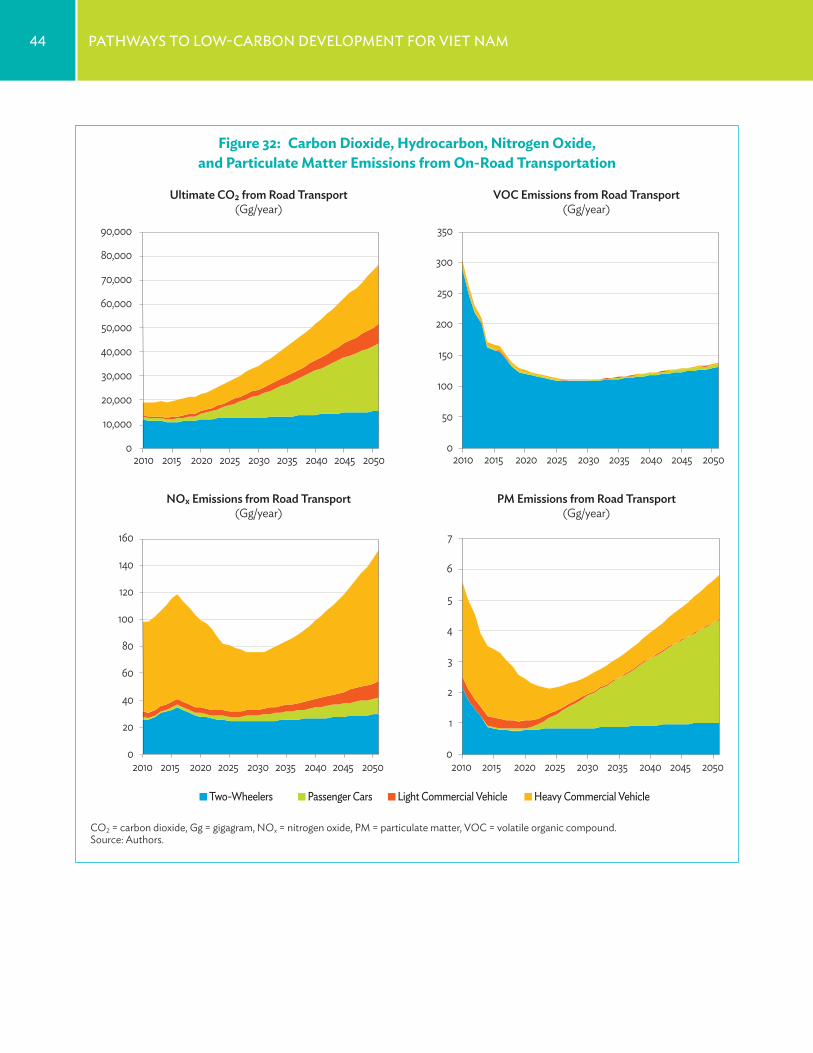
44 PathwaYs to low-Carbon develoPment For viet nam
Two-Wheelers Passenger Cars Light Commercial Vehicle Heavy Commercial Vehicle
Ultimate CO2 from Road Transport(Gg/year)
VOC Emissions from Road Transport(Gg/year)
NOx Emissions from Road Transport(Gg/year)
PM Emissions from Road Transport(Gg/year)
0
10,000
20,000
30,000
40,000
50,000
60,000
70,000
80,000
90,000
2010 2015 2020 2025 2030 2035 2040 2045 2050 0
50
100
150
200
250
300
350
2010 2015 2020 2025 2030 2035 2040 2045 2050
0
20
40
60
80
100
120
140
160
2010 2015 2020 2025 2030 2035 2040 2045 2050 0
1
2
3
4
5
6
7
2010 2015 2020 2025 2030 2035 2040 2045 2050
Figure 32: Carbon Dioxide, Hydrocarbon, Nitrogen Oxide, and Particulate Matter Emissions from On-Road Transportation
CO2 = carbon dioxide, Gg = gigagram, NOx = nitrogen oxide, PM = particulate matter, VOC = volatile organic compound.Source: Authors.
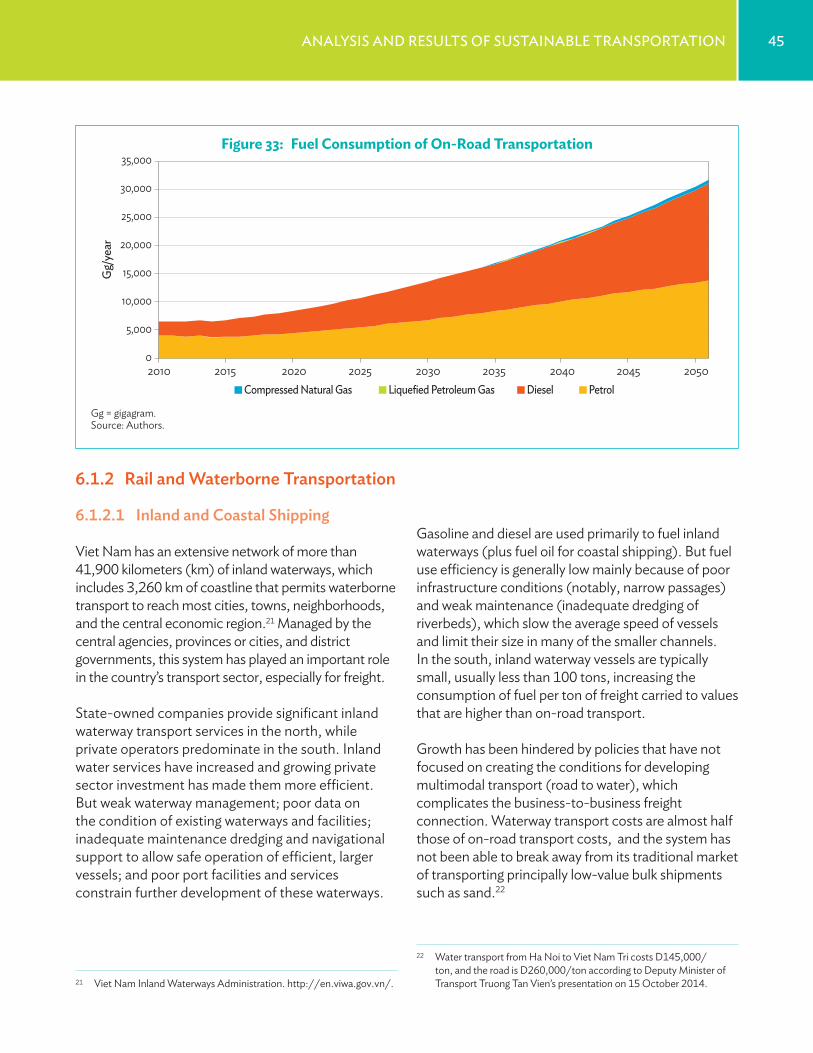
45analYsis and results oF sustainable transPortation
Gasoline and diesel are used primarily to fuel inland waterways (plus fuel oil for coastal shipping). But fuel use efficiency is generally low mainly because of poor infrastructure conditions (notably, narrow passages) and weak maintenance (inadequate dredging of riverbeds), which slow the average speed of vessels and limit their size in many of the smaller channels. In the south, inland waterway vessels are typically small, usually less than 100 tons, increasing the consumption of fuel per ton of freight carried to values that are higher than on-road transport.
Growth has been hindered by policies that have not focused on creating the conditions for developing multimodal transport (road to water), which complicates the business-to-business freight connection. Waterway transport costs are almost half those of on-road transport costs, and the system has not been able to break away from its traditional market of transporting principally low-value bulk shipments such as sand.22
22 Water transport from Ha Noi to Viet Nam Tri costs D145,000/ton, and the road is D260,000/ton according to Deputy Minister of Transport Truong Tan Vien’s presentation on 15 October 2014.
6.1.2 rail and waterborne transportation
6.1.2.1 Inland and coastal shipping
Viet Nam has an extensive network of more than 41,900 kilometers (km) of inland waterways, which includes 3,260 km of coastline that permits waterborne transport to reach most cities, towns, neighborhoods, and the central economic region.21 Managed by the central agencies, provinces or cities, and district governments, this system has played an important role in the country’s transport sector, especially for freight.
State-owned companies provide significant inland waterway transport services in the north, while private operators predominate in the south. Inland water services have increased and growing private sector investment has made them more efficient. But weak waterway management; poor data on the condition of existing waterways and facilities; inadequate maintenance dredging and navigational support to allow safe operation of efficient, larger vessels; and poor port facilities and services constrain further development of these waterways.
21 Viet Nam Inland Waterways Administration. http://en.viwa.gov.vn/.
Compressed Natural Gas Liquefied Petroleum Gas Diesel Petrol
0
5,000
10,000
15,000
20,000
25,000
30,000
35,000
2010 2015 2020 2025 2030 2035 2040 2045 2050
Gg/
year
Figure 33: Fuel Consumption of On-Road Transportation
Gg = gigagram. Source: Authors.
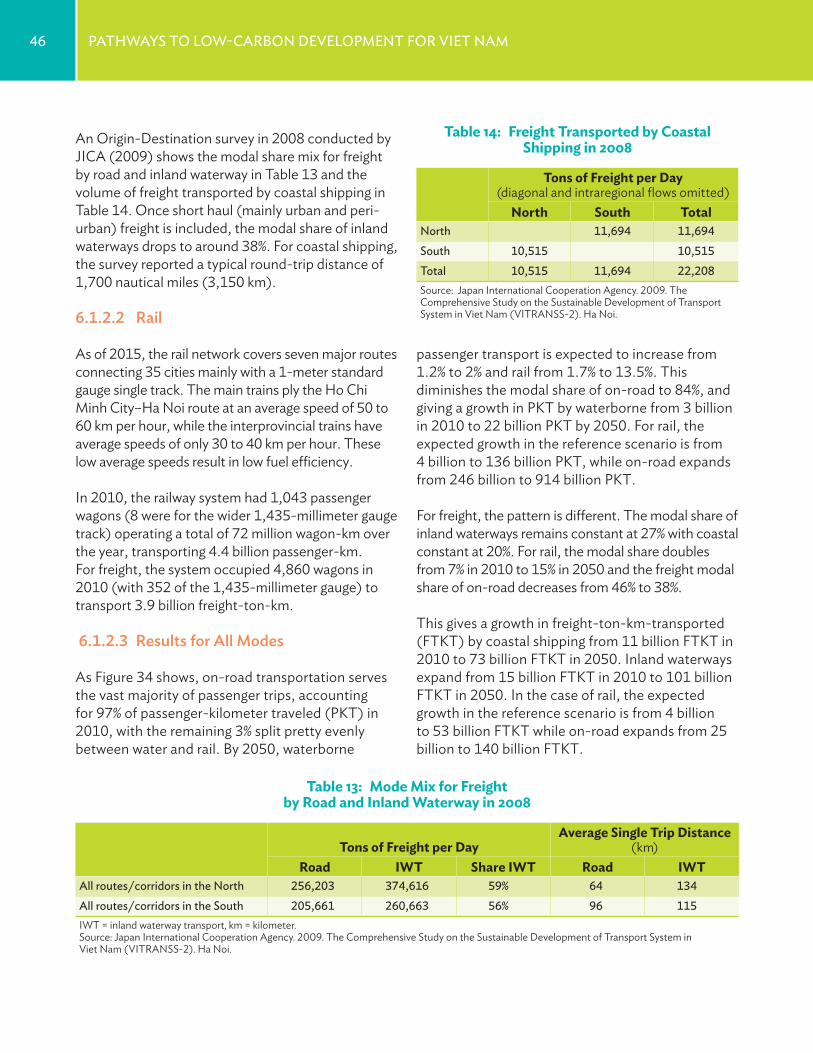
46 PathwaYs to low-Carbon develoPment For viet nam
An Origin-Destination survey in 2008 conducted by JICA (2009) shows the modal share mix for freight by road and inland waterway in Table 13 and the volume of freight transported by coastal shipping in Table 14. Once short haul (mainly urban and peri-urban) freight is included, the modal share of inland waterways drops to around 38%. For coastal shipping, the survey reported a typical round-trip distance of 1,700 nautical miles (3,150 km).
6.1.2.2 rail
As of 2015, the rail network covers seven major routes connecting 35 cities mainly with a 1-meter standard gauge single track. The main trains ply the Ho Chi Minh City–Ha Noi route at an average speed of 50 to 60 km per hour, while the interprovincial trains have average speeds of only 30 to 40 km per hour. These low average speeds result in low fuel efficiency.
In 2010, the railway system had 1,043 passenger wagons (8 were for the wider 1,435-millimeter gauge track) operating a total of 72 million wagon-km over the year, transporting 4.4 billion passenger-km. For freight, the system occupied 4,860 wagons in 2010 (with 352 of the 1,435-millimeter gauge) to transport 3.9 billion freight-ton-km.
6.1.2.3 results for all modes
As Figure 34 shows, on-road transportation serves the vast majority of passenger trips, accounting for 97% of passenger-kilometer traveled (PKT) in 2010, with the remaining 3% split pretty evenly between water and rail. By 2050, waterborne
passenger transport is expected to increase from 1.2% to 2% and rail from 1.7% to 13.5%. This diminishes the modal share of on-road to 84%, and giving a growth in PKT by waterborne from 3 billion in 2010 to 22 billion PKT by 2050. For rail, the expected growth in the reference scenario is from 4 billion to 136 billion PKT, while on-road expands from 246 billion to 914 billion PKT.
For freight, the pattern is different. The modal share of inland waterways remains constant at 27% with coastal constant at 20%. For rail, the modal share doubles from 7% in 2010 to 15% in 2050 and the freight modal share of on-road decreases from 46% to 38%.
This gives a growth in freight-ton-km-transported (FTKT) by coastal shipping from 11 billion FTKT in 2010 to 73 billion FTKT in 2050. Inland waterways expand from 15 billion FTKT in 2010 to 101 billion FTKT in 2050. In the case of rail, the expected growth in the reference scenario is from 4 billion to 53 billion FTKT while on-road expands from 25 billion to 140 billion FTKT.
Table 13: Mode Mix for Freight by Road and Inland Waterway in 2008
Tons of Freight per DayAverage Single Trip Distance
(km)Road IWT Share IWT Road IWT
all routes/corridors in the north 256,203 374,616 59% 64 134all routes/corridors in the south 205,661 260,663 56% 96 115IWT = inland waterway transport, km = kilometer.Source: Japan International Cooperation Agency. 2009. The Comprehensive Study on the Sustainable Development of Transport System in Viet Nam (VITRANSS-2). Ha Noi.
Table 14: Freight Transported by Coastal Shipping in 2008
Tons of Freight per Day (diagonal and intraregional flows omitted)
North South Totalnorth 11,694 11,694 south 10,515 10,515 total 10,515 11,694 22,208 Source: Japan International Cooperation Agency. 2009. The Comprehensive Study on the Sustainable Development of Transport System in Viet Nam (VITRANSS-2). Ha Noi.
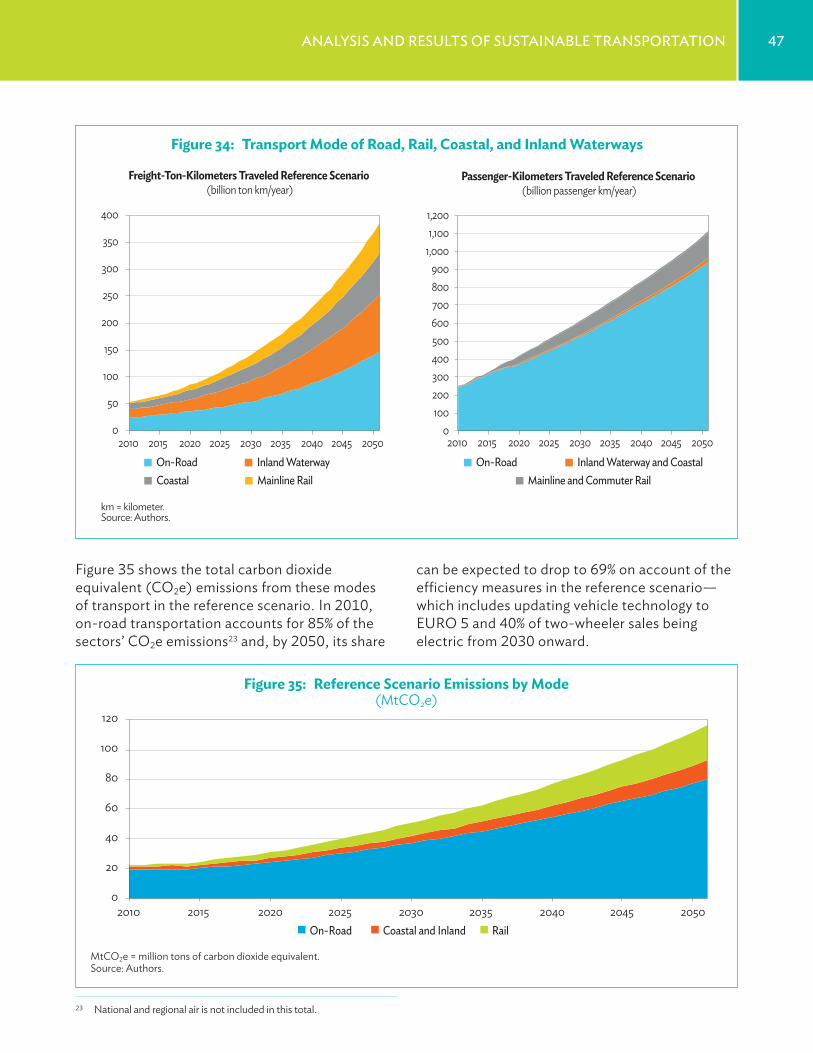
47analYsis and results oF sustainable transPortation
can be expected to drop to 69% on account of the efficiency measures in the reference scenario—which includes updating vehicle technology to EURO 5 and 40% of two-wheeler sales being electric from 2030 onward.
Figure 35 shows the total carbon dioxide equivalent (CO2e) emissions from these modes of transport in the reference scenario. In 2010, on-road transportation accounts for 85% of the sectors’ CO2e emissions23 and, by 2050, its share
23 National and regional air is not included in this total.
km = kilometer. Source: Authors.
0
50
100
150
200
250
300
350
400
2010 2015 2020 2025 2030 2035 2040 2045 2050 On-Road Inland Waterway Coastal Mainline Rail
0 100 200 300 400 500 600 700 800 900
1,000 1,100 1,200
2010 2015 2020 2025 2030 2035 2040 2045 2050 On-Road Inland Waterway and Coastal
Mainline and Commuter Rail
Freight-Ton-Kilometers Traveled Reference Scenario (billion ton km/year)
Passenger-Kilometers Traveled Reference Scenario (billion passenger km/year)
Figure 34: Transport Mode of Road, Rail, Coastal, and Inland Waterways
0
20
40
60
80
100
120
2010 2015 2020 2025 2030 2035 2040 2045 2050 On-Road Coastal and Inland Rail
Figure 35: Reference Scenario Emissions by Mode (MtCO2e)
MtCO2e = million tons of carbon dioxide equivalent.Source: Authors.
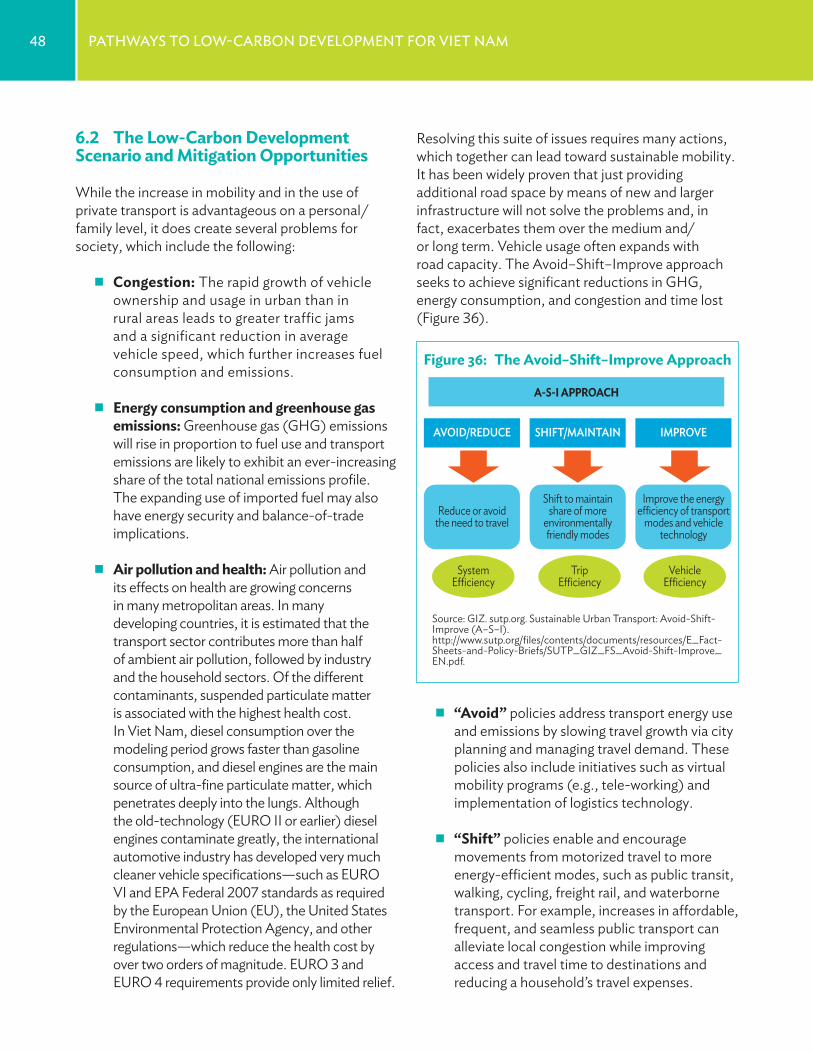
48 PathwaYs to low-Carbon develoPment For viet nam
Resolving this suite of issues requires many actions, which together can lead toward sustainable mobility. It has been widely proven that just providing additional road space by means of new and larger infrastructure will not solve the problems and, in fact, exacerbates them over the medium and/or long term. Vehicle usage often expands with road capacity. The Avoid–Shift–Improve approach seeks to achieve significant reductions in GHG, energy consumption, and congestion and time lost (Figure 36).
ɂ “Avoid” policies address transport energy use and emissions by slowing travel growth via city planning and managing travel demand. These policies also include initiatives such as virtual mobility programs (e.g., tele-working) and implementation of logistics technology.
ɂ “Shift” policies enable and encourage movements from motorized travel to more energy-efficient modes, such as public transit, walking, cycling, freight rail, and waterborne transport. For example, increases in affordable, frequent, and seamless public transport can alleviate local congestion while improving access and travel time to destinations and reducing a household’s travel expenses.
6.2 The Low-Carbon Development Scenario and Mitigation Opportunities
While the increase in mobility and in the use of private transport is advantageous on a personal/family level, it does create several problems for society, which include the following:
ɂ Congestion: The rapid growth of vehicle ownership and usage in urban than in rural areas leads to greater traffic jams and a significant reduction in average vehicle speed, which further increases fuel consumption and emissions.
ɂ Energy consumption and greenhouse gas emissions: Greenhouse gas (GHG) emissions will rise in proportion to fuel use and transport emissions are likely to exhibit an ever-increasing share of the total national emissions profile. The expanding use of imported fuel may also have energy security and balance-of-trade implications.
ɂ Air pollution and health: Air pollution and its effects on health are growing concerns in many metropolitan areas. In many developing countries, it is estimated that the transport sector contributes more than half of ambient air pollution, followed by industry and the household sectors. Of the different contaminants, suspended particulate matter is associated with the highest health cost. In Viet Nam, diesel consumption over the modeling period grows faster than gasoline consumption, and diesel engines are the main source of ultra-fine particulate matter, which penetrates deeply into the lungs. Although the old-technology (EURO II or earlier) diesel engines contaminate greatly, the international automotive industry has developed very much cleaner vehicle specifications—such as EURO VI and EPA Federal 2007 standards as required by the European Union (EU), the United States Environmental Protection Agency, and other regulations—which reduce the health cost by over two orders of magnitude. EURO 3 and EURO 4 requirements provide only limited relief.
Source: GIZ. sutp.org. Sustainable Urban Transport: Avoid-Shift-Improve (A–S–I). http://www.sutp.org/files/contents/documents/resources/E_Fact-Sheets-and-Policy-Briefs/SUTP_GIZ_FS_Avoid-Shift-Improve_EN.pdf.
A-S-I APPROACH
AVOID/REDUCE
Reduce or avoidthe need to travel
SystemEfficiency
TripEfficiency
VehicleEfficiency
Shift to maintainshare of more
environmentallyfriendly modes
Improve the energyefficiency of transport
modes and vehicletechnology
SHIFT/MAINTAIN IMPROVE
Figure 36: The Avoid–Shift–Improve Approach
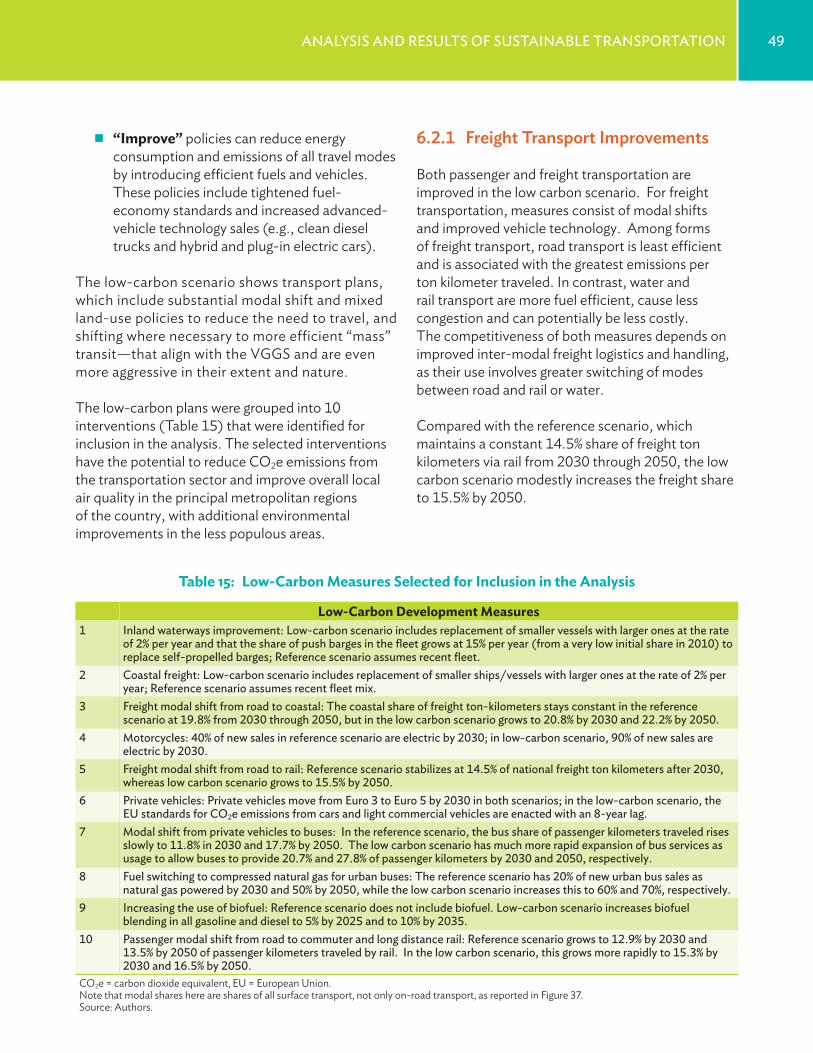
49analYsis and results oF sustainable transPortation
6.2.1 freight transport Improvements
Both passenger and freight transportation are improved in the low carbon scenario. For freight transportation, measures consist of modal shifts and improved vehicle technology. Among forms of freight transport, road transport is least efficient and is associated with the greatest emissions per ton kilometer traveled. In contrast, water and rail transport are more fuel efficient, cause less congestion and can potentially be less costly. The competitiveness of both measures depends on improved inter-modal freight logistics and handling, as their use involves greater switching of modes between road and rail or water.
Compared with the reference scenario, which maintains a constant 14.5% share of freight ton kilometers via rail from 2030 through 2050, the low carbon scenario modestly increases the freight share to 15.5% by 2050.
ɂ “Improve” policies can reduce energy consumption and emissions of all travel modes by introducing efficient fuels and vehicles. These policies include tightened fuel-economy standards and increased advanced-vehicle technology sales (e.g., clean diesel trucks and hybrid and plug-in electric cars).
The low-carbon scenario shows transport plans, which include substantial modal shift and mixed land-use policies to reduce the need to travel, and shifting where necessary to more efficient “mass” transit—that align with the VGGS and are even more aggressive in their extent and nature.
The low-carbon plans were grouped into 10 interventions (Table 15) that were identified for inclusion in the analysis. The selected interventions have the potential to reduce CO2e emissions from the transportation sector and improve overall local air quality in the principal metropolitan regions of the country, with additional environmental improvements in the less populous areas.
Table 15: Low-Carbon Measures Selected for Inclusion in the Analysis
Low-Carbon Development Measures1 inland waterways improvement: low-carbon scenario includes replacement of smaller vessels with larger ones at the rate
of 2% per year and that the share of push barges in the fleet grows at 15% per year (from a very low initial share in 2010) to replace self-propelled barges; reference scenario assumes recent fleet.
2 Coastal freight: low-carbon scenario includes replacement of smaller ships/vessels with larger ones at the rate of 2% per year; reference scenario assumes recent fleet mix.
3 Freight modal shift from road to coastal: the coastal share of freight ton-kilometers stays constant in the reference scenario at 19.8% from 2030 through 2050, but in the low carbon scenario grows to 20.8% by 2030 and 22.2% by 2050.
4 motorcycles: 40% of new sales in reference scenario are electric by 2030; in low-carbon scenario, 90% of new sales are electric by 2030.
5 Freight modal shift from road to rail: reference scenario stabilizes at 14.5% of national freight ton kilometers after 2030, whereas low carbon scenario grows to 15.5% by 2050.
6 Private vehicles: Private vehicles move from euro 3 to euro 5 by 2030 in both scenarios; in the low-carbon scenario, the eu standards for Co2e emissions from cars and light commercial vehicles are enacted with an 8-year lag.
7 modal shift from private vehicles to buses: in the reference scenario, the bus share of passenger kilometers traveled rises slowly to 11.8% in 2030 and 17.7% by 2050. the low carbon scenario has much more rapid expansion of bus services as usage to allow buses to provide 20.7% and 27.8% of passenger kilometers by 2030 and 2050, respectively.
8 Fuel switching to compressed natural gas for urban buses: the reference scenario has 20% of new urban bus sales as natural gas powered by 2030 and 50% by 2050, while the low carbon scenario increases this to 60% and 70%, respectively.
9 increasing the use of biofuel: reference scenario does not include biofuel. low-carbon scenario increases biofuel blending in all gasoline and diesel to 5% by 2025 and to 10% by 2035.
10 Passenger modal shift from road to commuter and long distance rail: reference scenario grows to 12.9% by 2030 and 13.5% by 2050 of passenger kilometers traveled by rail. in the low carbon scenario, this grows more rapidly to 15.3% by 2030 and 16.5% by 2050.
CO2e = carbon dioxide equivalent, EU = European Union.Note that modal shares here are shares of all surface transport, not only on-road transport, as reported in Figure 37.Source: Authors.
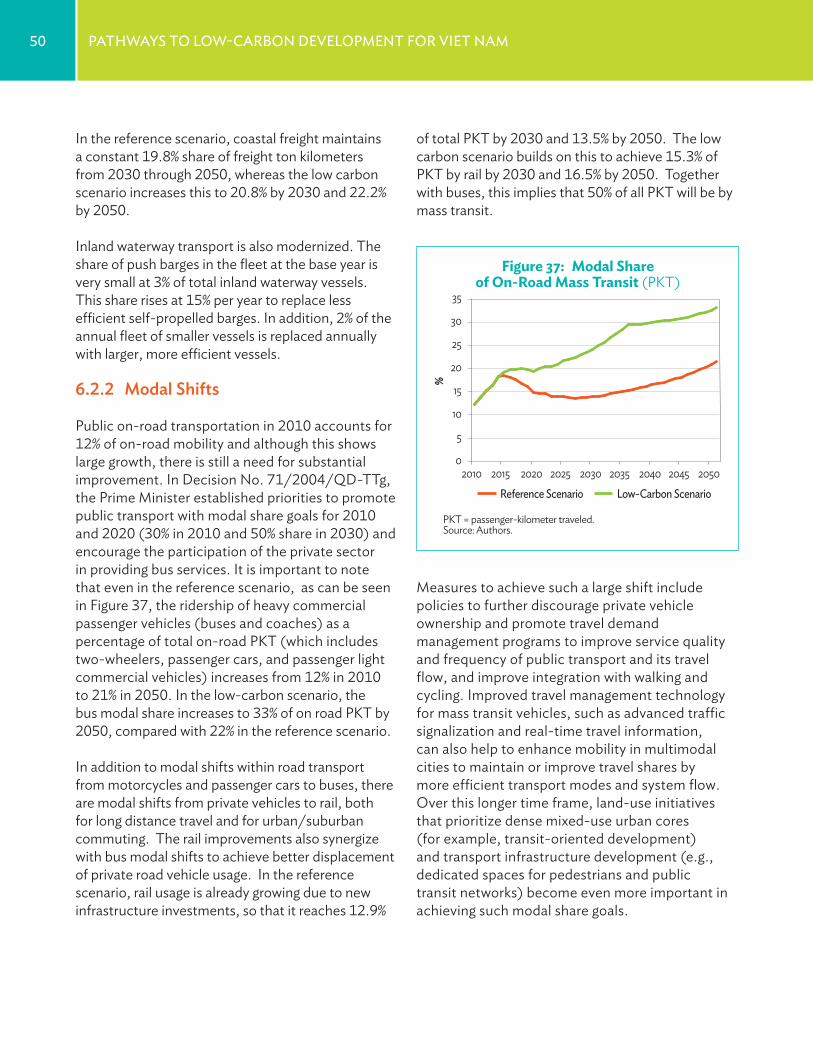
50 PathwaYs to low-Carbon develoPment For viet nam
In the reference scenario, coastal freight maintains a constant 19.8% share of freight ton kilometers from 2030 through 2050, whereas the low carbon scenario increases this to 20.8% by 2030 and 22.2% by 2050.
Inland waterway transport is also modernized. The share of push barges in the fleet at the base year is very small at 3% of total inland waterway vessels. This share rises at 15% per year to replace less efficient self-propelled barges. In addition, 2% of the annual fleet of smaller vessels is replaced annually with larger, more efficient vessels.
6.2.2 modal shifts
Public on-road transportation in 2010 accounts for 12% of on-road mobility and although this shows large growth, there is still a need for substantial improvement. In Decision No. 71/2004/QD-TTg, the Prime Minister established priorities to promote public transport with modal share goals for 2010 and 2020 (30% in 2010 and 50% share in 2030) and encourage the participation of the private sector in providing bus services. It is important to note that even in the reference scenario, as can be seen in Figure 37, the ridership of heavy commercial passenger vehicles (buses and coaches) as a percentage of total on-road PKT (which includes two-wheelers, passenger cars, and passenger light commercial vehicles) increases from 12% in 2010 to 21% in 2050. In the low-carbon scenario, the bus modal share increases to 33% of on road PKT by 2050, compared with 22% in the reference scenario.
In addition to modal shifts within road transport from motorcycles and passenger cars to buses, there are modal shifts from private vehicles to rail, both for long distance travel and for urban/suburban commuting. The rail improvements also synergize with bus modal shifts to achieve better displacement of private road vehicle usage. In the reference scenario, rail usage is already growing due to new infrastructure investments, so that it reaches 12.9%
PKT = passenger-kilometer traveled.Source: Authors.
Reference Scenario Low-Carbon Scenario
0
5
10
15
20
%
25
30
35
2010 2015 2020 2025 2030 2035 2040 2045 2050
Figure 37: Modal Share of On-Road Mass Transit (PKT)
of total PKT by 2030 and 13.5% by 2050. The low carbon scenario builds on this to achieve 15.3% of PKT by rail by 2030 and 16.5% by 2050. Together with buses, this implies that 50% of all PKT will be by mass transit.
Measures to achieve such a large shift include policies to further discourage private vehicle ownership and promote travel demand management programs to improve service quality and frequency of public transport and its travel flow, and improve integration with walking and cycling. Improved travel management technology for mass transit vehicles, such as advanced traffic signalization and real-time travel information, can also help to enhance mobility in multimodal cities to maintain or improve travel shares by more efficient transport modes and system flow. Over this longer time frame, land-use initiatives that prioritize dense mixed-use urban cores (for example, transit-oriented development) and transport infrastructure development (e.g., dedicated spaces for pedestrians and public transit networks) become even more important in achieving such modal share goals.
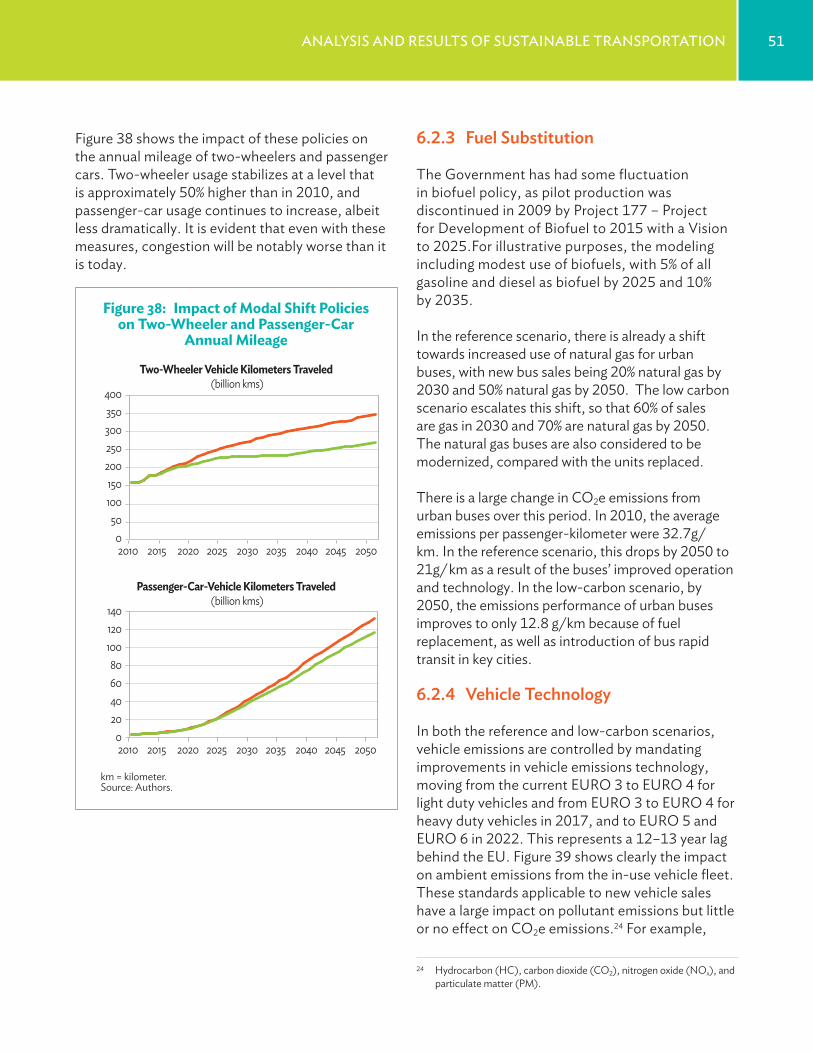
51analYsis and results oF sustainable transPortation
km = kilometer.Source: Authors.
0 50
100 150
200 250 300 350 400
2010 2015 2020 2025 2030 2035 2040 2045 2050
0 20 40 60 80
100 120 140
2010 2015 2020 2025 2030 2035 2040 2045 2050
Two-Wheeler Vehicle Kilometers Traveled (billion kms)
Passenger-Car-Vehicle Kilometers Traveled (billion kms)
Figure 38: Impact of Modal Shift Policies on Two-Wheeler and Passenger-Car
Annual Mileage
Figure 38 shows the impact of these policies on the annual mileage of two-wheelers and passenger cars. Two-wheeler usage stabilizes at a level that is approximately 50% higher than in 2010, and passenger-car usage continues to increase, albeit less dramatically. It is evident that even with these measures, congestion will be notably worse than it is today.
6.2.3 fuel substitution
The Government has had some fluctuation in biofuel policy, as pilot production was discontinued in 2009 by Project 177 – Project for Development of Biofuel to 2015 with a Vision to 2025.For illustrative purposes, the modeling including modest use of biofuels, with 5% of all gasoline and diesel as biofuel by 2025 and 10% by 2035.
In the reference scenario, there is already a shift towards increased use of natural gas for urban buses, with new bus sales being 20% natural gas by 2030 and 50% natural gas by 2050. The low carbon scenario escalates this shift, so that 60% of sales are gas in 2030 and 70% are natural gas by 2050. The natural gas buses are also considered to be modernized, compared with the units replaced.
There is a large change in CO2e emissions from urban buses over this period. In 2010, the average emissions per passenger-kilometer were 32.7g/km. In the reference scenario, this drops by 2050 to 21g/ km as a result of the buses’ improved operation and technology. In the low-carbon scenario, by 2050, the emissions performance of urban buses improves to only 12.8 g/km because of fuel replacement, as well as introduction of bus rapid transit in key cities.
6.2.4 vehicle technology
In both the reference and low-carbon scenarios, vehicle emissions are controlled by mandating improvements in vehicle emissions technology, moving from the current EURO 3 to EURO 4 for light duty vehicles and from EURO 3 to EURO 4 for heavy duty vehicles in 2017, and to EURO 5 and EURO 6 in 2022. This represents a 12–13 year lag behind the EU. Figure 39 shows clearly the impact on ambient emissions from the in-use vehicle fleet. These standards applicable to new vehicle sales have a large impact on pollutant emissions but little or no effect on CO2e emissions.24 For example,
24 Hydrocarbon (HC), carbon dioxide (CO2), nitrogen oxide (NOx), and particulate matter (PM).
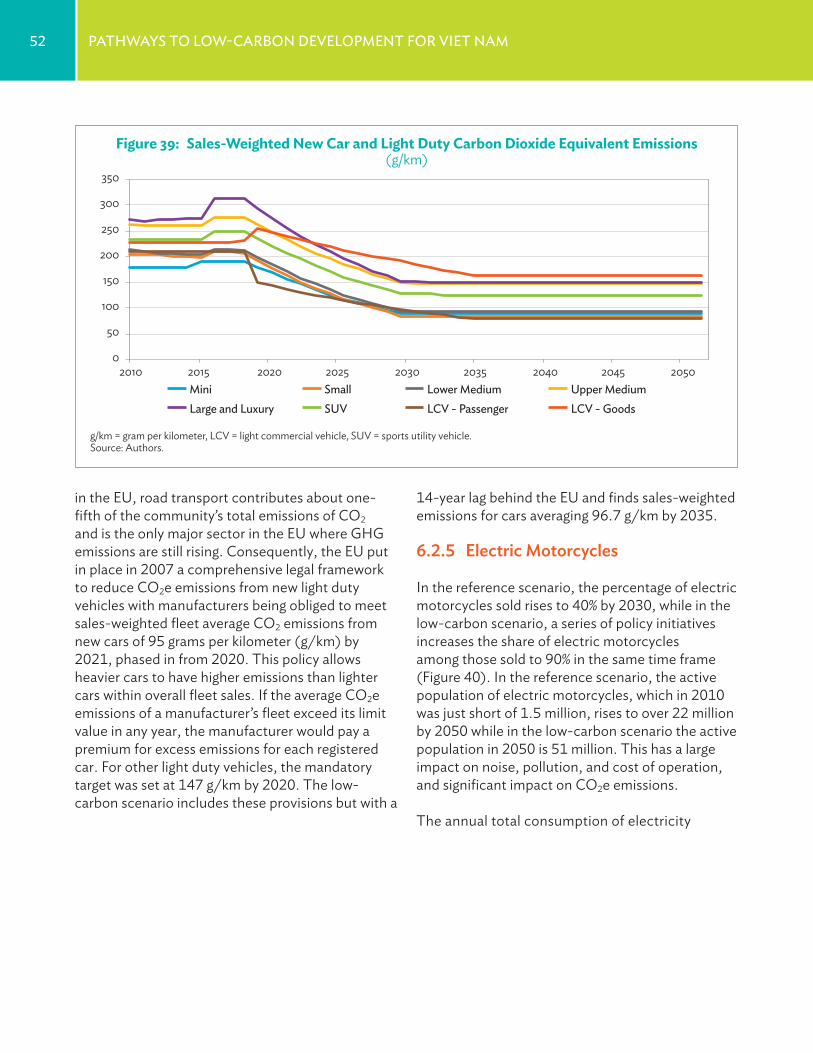
52 PathwaYs to low-Carbon develoPment For viet nam
2010 2015 2020 2025 2030 2035 2040 2045 2050 0
50
100
150
200
250
300
350
Mini Small Lower Medium Upper Medium Large and Luxury SUV LCV - Passenger LCV - Goods
Figure 39: Sales-Weighted New Car and Light Duty Carbon Dioxide Equivalent Emissions (g/km)
g/km = gram per kilometer, LCV = light commercial vehicle, SUV = sports utility vehicle.Source: Authors.
in the EU, road transport contributes about one-fifth of the community’s total emissions of CO2 and is the only major sector in the EU where GHG emissions are still rising. Consequently, the EU put in place in 2007 a comprehensive legal framework to reduce CO2e emissions from new light duty vehicles with manufacturers being obliged to meet sales-weighted fleet average CO2 emissions from new cars of 95 grams per kilometer (g/km) by 2021, phased in from 2020. This policy allows heavier cars to have higher emissions than lighter cars within overall fleet sales. If the average CO2e emissions of a manufacturer’s fleet exceed its limit value in any year, the manufacturer would pay a premium for excess emissions for each registered car. For other light duty vehicles, the mandatory target was set at 147 g/km by 2020. The low-carbon scenario includes these provisions but with a
14-year lag behind the EU and finds sales-weighted emissions for cars averaging 96.7 g/km by 2035.
6.2.5 electric motorcycles
In the reference scenario, the percentage of electric motorcycles sold rises to 40% by 2030, while in the low-carbon scenario, a series of policy initiatives increases the share of electric motorcycles among those sold to 90% in the same time frame (Figure 40). In the reference scenario, the active population of electric motorcycles, which in 2010 was just short of 1.5 million, rises to over 22 million by 2050 while in the low-carbon scenario the active population in 2050 is 51 million. This has a large impact on noise, pollution, and cost of operation, and significant impact on CO2e emissions.
The annual total consumption of electricity
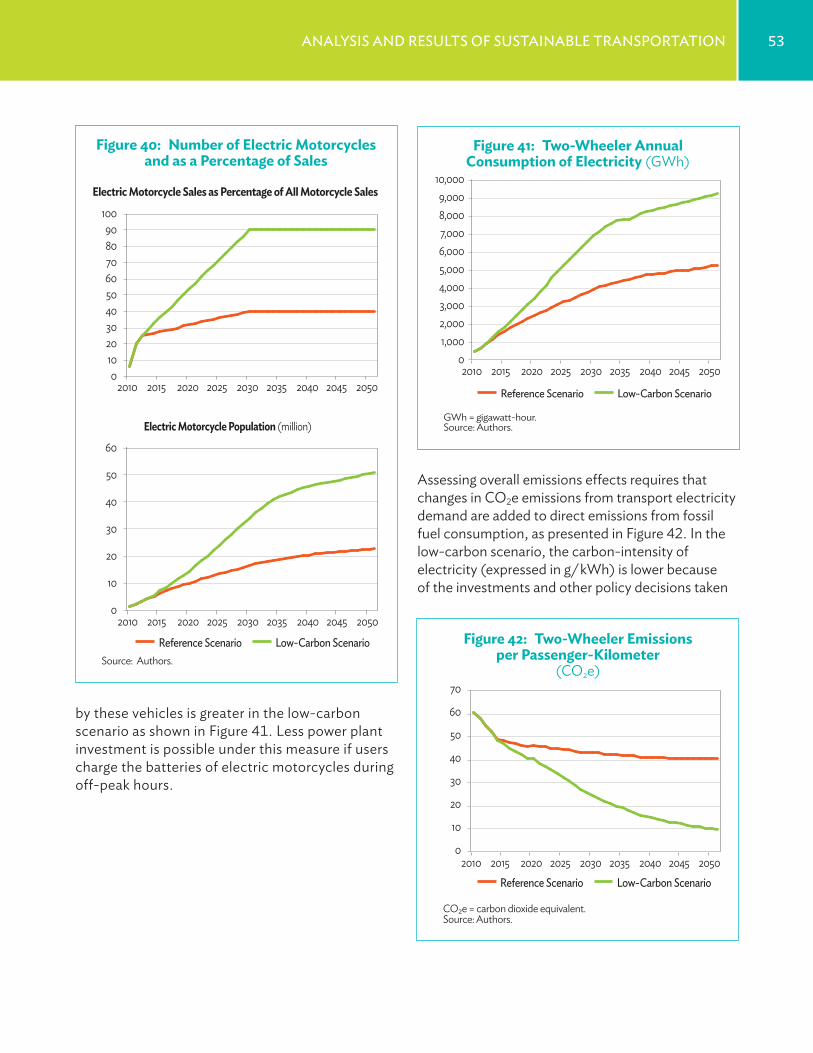
53analYsis and results oF sustainable transPortation
Assessing overall emissions effects requires that changes in CO2e emissions from transport electricity demand are added to direct emissions from fossil fuel consumption, as presented in Figure 42. In the low-carbon scenario, the carbon-intensity of electricity (expressed in g/ kWh) is lower because of the investments and other policy decisions taken
Source: Authors.Reference Scenario Low-Carbon Scenario
0 10 20 30 40 50 60 70 80 90
100
2010 2015 2020 2025 2030 2035 2040 2045 2050
Electric Motorcycle Sales as Percentage of All Motorcycle Sales
0
10
20
30
40
50
60
2010 2015 2020 2025 2030 2035 2040 2045 2050
Electric Motorcycle Population (million)
Figure 40: Number of Electric Motorcycles and as a Percentage of Sales
GWh = gigawatt-hour.Source: Authors.
Reference Scenario Low-Carbon Scenario
0 1,000 2,000 3,000 4,000 5,000 6,000 7,000 8,000 9,000
10,000
2010 2015 2020 2025 2030 2035 2040 2045 2050
Figure 41: Two-Wheeler Annual Consumption of Electricity (GWh)
CO2e = carbon dioxide equivalent.Source: Authors.
Reference Scenario Low-Carbon Scenario
0
10
20
30
40
50
60
70
2010 2015 2020 2025 2030 2035 2040 2045 2050
Figure 42: Two-Wheeler Emissions per Passenger-Kilometer
(CO2e)
by these vehicles is greater in the low-carbon scenario as shown in Figure 41. Less power plant investment is possible under this measure if users charge the batteries of electric motorcycles during off-peak hours.
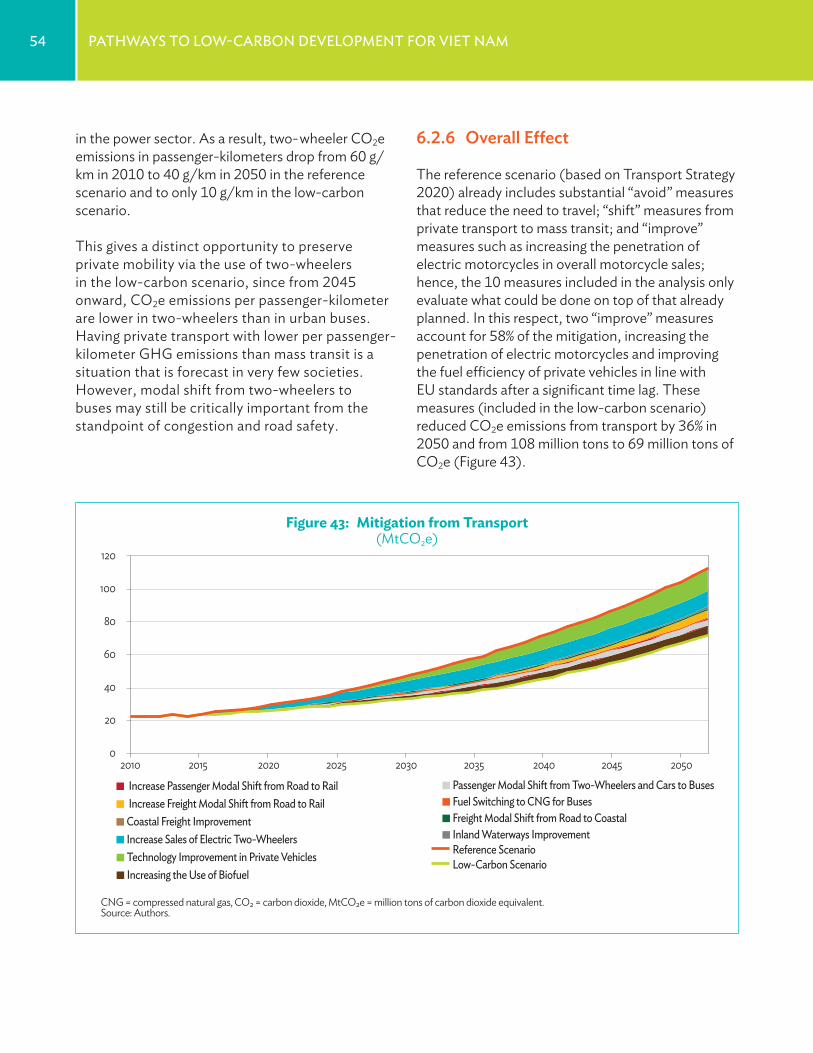
54 PathwaYs to low-Carbon develoPment For viet nam
6.2.6 overall effect
The reference scenario (based on Transport Strategy 2020) already includes substantial “avoid” measures that reduce the need to travel; “shift” measures from private transport to mass transit; and “improve” measures such as increasing the penetration of electric motorcycles in overall motorcycle sales; hence, the 10 measures included in the analysis only evaluate what could be done on top of that already planned. In this respect, two “improve” measures account for 58% of the mitigation, increasing the penetration of electric motorcycles and improving the fuel efficiency of private vehicles in line with EU standards after a significant time lag. These measures (included in the low-carbon scenario) reduced CO2e emissions from transport by 36% in 2050 and from 108 million tons to 69 million tons of CO2e (Figure 43).
in the power sector. As a result, two- wheeler CO2e emissions in passenger-kilometers drop from 60 g/km in 2010 to 40 g/km in 2050 in the reference scenario and to only 10 g/km in the low-carbon scenario.
This gives a distinct opportunity to preserve private mobility via the use of two-wheelers in the low-carbon scenario, since from 2045 onward, CO2e emissions per passenger-kilometer are lower in two-wheelers than in urban buses. Having private transport with lower per passenger-kilometer GHG emissions than mass transit is a situation that is forecast in very few societies. However, modal shift from two-wheelers to buses may still be critically important from the standpoint of congestion and road safety.
CNG = compressed natural gas, CO2 = carbon dioxide, MtCO2e = million tons of carbon dioxide equivalent. Source: Authors.
0
20
40
60
80
100
120
2010 2015 2020 2025 2030 2035 2040 2045 2050
Increasing the Use of Biofuel
Increase Passenger Modal Shift from Road to Rail Passenger Modal Shift from Two-Wheelers and Cars to BusesFuel Switching to CNG for Buses Increase Freight Modal Shift from Road to RailFreight Modal Shift from Road to Coastal Coastal Freight Improvement Inland Waterways Improvement Increase Sales of Electric Two-Wheelers
Technology Improvement in Private Vehicles Low-Carbon ScenarioReference Scenario
Figure 43: Mitigation from Transport (MtCO2e)
7. margInal abatement cost curves
55
include the investments required for a plant’s midlife extension, and also take into account a terminal value for each unit that is operational in the last year of this study. The terminal value is taken to be equal to the proportion of its initial investment in relation to the un-generated electricity that can be expected over the operating life of the plant; the same being recovered into the MAC calculation 1 year after the end of the study time frame.
A discount rate of 10% has been used, calculated at midyear. This rate corresponds to the assumption that the private sector is likely to be a predominant source of investment funds.
7.1 Household Electricity Demand
The study evaluated the electricity consumption of 23 appliance types in four groups. Over 2010–2050, this results in a total mitigation of 405 million tons of carbon dioxide equivalent (MtCO2e) at an average mitigation cost of –$2.4 per ton of carbon dioxide equivalent (tCO2e) and allows the electricity demands of a rising, more affluent population to be met without an increase in total household electricity demand.
Figure 44 shows the marginal abatement cost curve (MACC) of these measures. Two measures have a positive MAC, while all the others imply a net savings. Improved cooling has a MAC of $10.3 with a savings of 186 MtCO2e. Since this measure reduces peak load, its additional cost is more than offset by reduced investment in the power sector—which would benefit directly from financing this measure.
The previous sections have illustrated the potential of different energy and transport options to mitigate emissions. The question
then is to compare this potential magnitude with costs. A marginal abatement cost (MAC) curve presents a standard summary of each of the proposed energy-efficiency measures and supply technology by comparing their marginal net cost per unit of abatement and the related abatement potential. The curve is ordered from the intervention with the lowest abatement cost to that with the highest abatement cost.
The MAC is given by
MAC= NPVa – NPVb
CO2eb – CO2ea
where
PVA is the net present value of the expenditure cash flow for the activity “A” with higher costs
PVB is the net present value of the expenditure cash flow for the activity “B” with lower costs
CO2eA is the undiscounted cumulative CO2 equivalent emitted for option A
CO2eB is the undiscounted cumulative CO2 equivalent emitted for option B
All the MAC numbers presented here have the net present value of cash outflows calculated to 2010, the base year of this study. They include the investments, operation and maintenance costs, fuel costs, and emissions over the study time frame (2010–2050). In the case of power plants, they
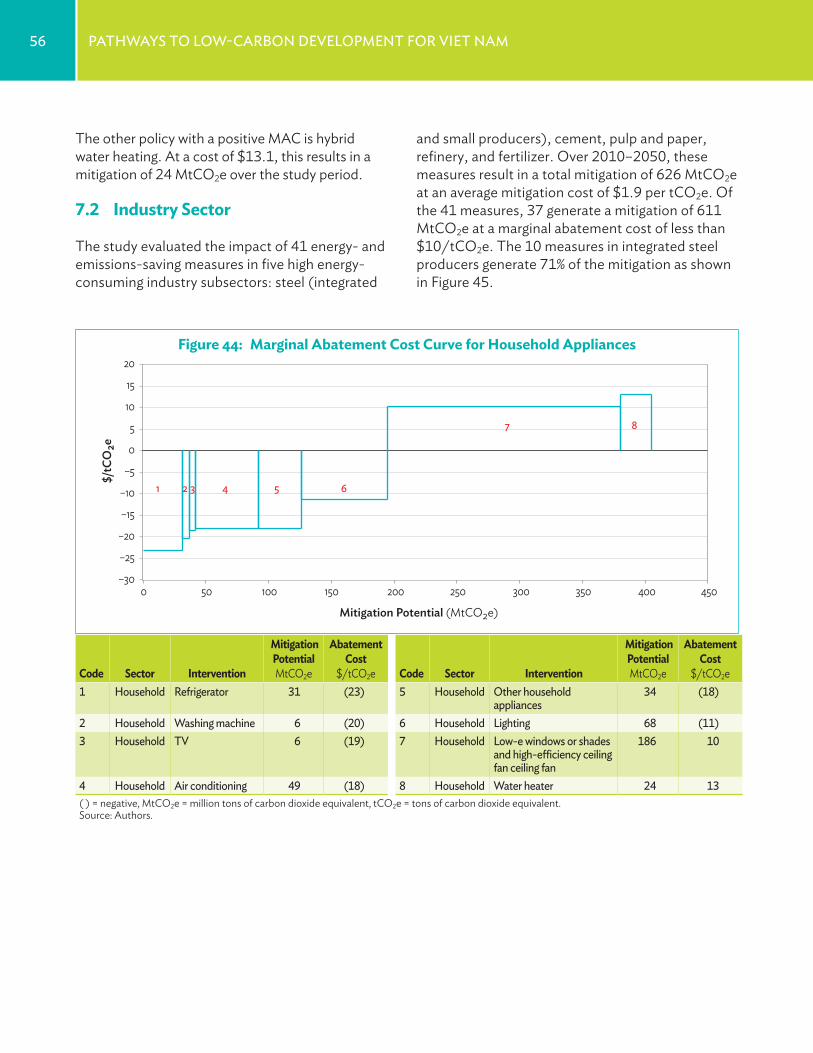
56 PathwaYs to low-Carbon develoPment For viet nam
and small producers), cement, pulp and paper, refinery, and fertilizer. Over 2010–2050, these measures result in a total mitigation of 626 MtCO2e at an average mitigation cost of $1.9 per tCO2e. Of the 41 measures, 37 generate a mitigation of 611 MtCO2e at a marginal abatement cost of less than $10/tCO2e. The 10 measures in integrated steel producers generate 71% of the mitigation as shown in Figure 45.
The other policy with a positive MAC is hybrid water heating. At a cost of $13.1, this results in a mitigation of 24 MtCO2e over the study period.
7.2 Industry Sector
The study evaluated the impact of 41 energy- and emissions-saving measures in five high energy-consuming industry subsectors: steel (integrated
Code Sector Intervention
Mitigation Potential MtCO2e
Abatement Cost
$/tCO2e Code Sector Intervention
Mitigation Potential MtCO2e
Abatement Cost
$/tCO2e1 household refrigerator 31 (23) 5 household other household
appliances34 (18)
2 household washing machine 6 (20) 6 household lighting 68 (11)3 household tv 6 (19) 7 household low-e windows or shades
and high-efficiency ceiling fan ceiling fan
186 10
4 household air conditioning 49 (18) 8 household water heater 24 13( ) = negative, MtCO2e = million tons of carbon dioxide equivalent, tCO2e = tons of carbon dioxide equivalent.Source: Authors.
$/tC
O2e
Mitigation Potential (MtCO2e)
–30
–25
–20
–15
–10
–5
0
5
10
15
20
0 50 100 150 200 250 300 350 400 450
1 2 3 4 5 6
7 8
Figure 44: Marginal Abatement Cost Curve for Household Appliances
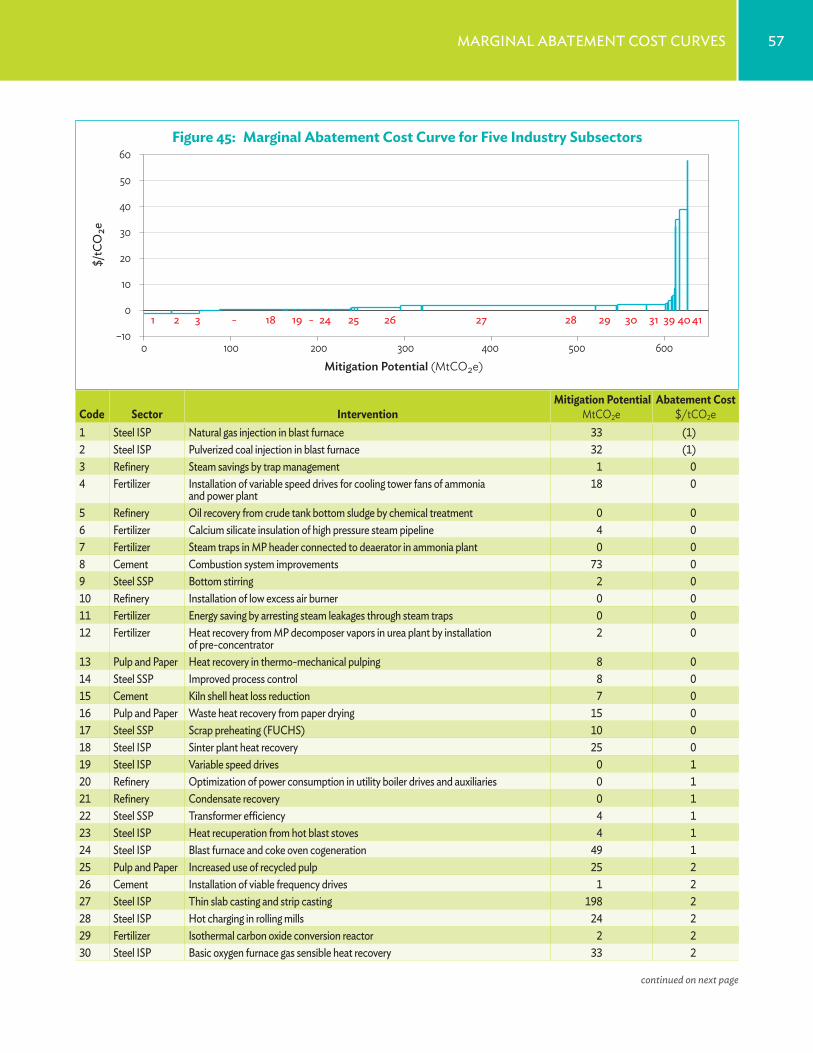
57marginal abatement Cost Curves
Mitigation Potential (MtCO2e)
$/tC
O2e
–10
0
10
20
30
40
50
60
0 100 200 300 400 500 600
1 2 3 - 18 19 - 24 25 26 27 28 29 30 31 39 4041
Figure 45: Marginal Abatement Cost Curve for Five Industry Subsectors
Code Sector Intervention Mitigation Potential
MtCO2eAbatement Cost
$/tCO2e1 steel isP natural gas injection in blast furnace 33 (1)2 steel isP Pulverized coal injection in blast furnace 32 (1)3 refinery steam savings by trap management 1 04 Fertilizer installation of variable speed drives for cooling tower fans of ammonia
and power plant18 0
5 refinery oil recovery from crude tank bottom sludge by chemical treatment 0 06 Fertilizer Calcium silicate insulation of high pressure steam pipeline 4 07 Fertilizer steam traps in mP header connected to deaerator in ammonia plant 0 08 Cement Combustion system improvements 73 09 steel ssP bottom stirring 2 010 refinery installation of low excess air burner 0 011 Fertilizer energy saving by arresting steam leakages through steam traps 0 012 Fertilizer heat recovery from mP decomposer vapors in urea plant by installation
of pre-concentrator2 0
13 Pulp and Paper heat recovery in thermo-mechanical pulping 8 014 steel ssP improved process control 8 015 Cement kiln shell heat loss reduction 7 016 Pulp and Paper waste heat recovery from paper drying 15 017 steel ssP scrap preheating (FuChs) 10 018 steel isP sinter plant heat recovery 25 019 steel isP variable speed drives 0 120 refinery optimization of power consumption in utility boiler drives and auxiliaries 0 121 refinery Condensate recovery 0 122 steel ssP transformer efficiency 4 123 steel isP heat recuperation from hot blast stoves 4 124 steel isP blast furnace and coke oven cogeneration 49 125 Pulp and Paper increased use of recycled pulp 25 226 Cement installation of viable frequency drives 1 227 steel isP thin slab casting and strip casting 198 228 steel isP hot charging in rolling mills 24 229 Fertilizer isothermal carbon oxide conversion reactor 2 230 steel isP basic oxygen furnace gas sensible heat recovery 33 2
continued on next page
58 PathwaYs to low-Carbon develoPment For viet nam
This substitution of generation technology results in a total mitigation over 2010–2050 of 2,962 MtCO2e at an average mitigation cost of –$1.1 per tCO2e. In 2050, these supply-side measures reduce electricity sector emissions by 348 MtCO2e.
Figure 46 shows the marginal abatement cost curve of these measures. Of the four technologies employed, three exhibit net savings. Only wind has a positive MAC of $1.7/tCO2e.
7.3 Electricity Generation – Supply Side
The electricity sector, as the main focus of this study, underwent a significant transformation between the reference scenario, which is rooted in the PDP-VII-interim-revision, and the low-carbon scenario. Over the study period (2010–2050), energy-efficiency measures reduced the demand for electricity compared with the reference scenario, consequently lowering absolute emissions from the electricity sector significantly. On top of this, the abatement potential of cleaner generation technologies is substantial.
Code Sector Intervention Mitigation Potential
MtCO2eAbatement Cost
$/tCO2e31 steel isP installation of the top pressure recovery turbine 22 232 Pulp and Paper extended nip press 2 333 Pulp and Paper rts pulping 1 334 steel ssP oxyfuel burners 3 435 Pulp and Paper black liquor gasification 2 536 refinery Flare gas recovery and utilization of recovered flare gas for process heating
requirements 2 6
37 steel ssP eccentric bottom tapping 1 838 Fertilizer high conversion rate synthesis reactor 0 3339 Cement vertical rolling mill 5 3540 Cement dry kilns with multistage preheaters and pre-calcination 10 3941 refinery online cleaning of furnace 0 58( ) = negative, ISP = integrated steel plant, MtCO2e = million tons of carbon dioxide equivalent, SSP = small-scale producer, tCO2e = tons of carbon dioxide equivalent.Source: Authors.
Figure 45 continued
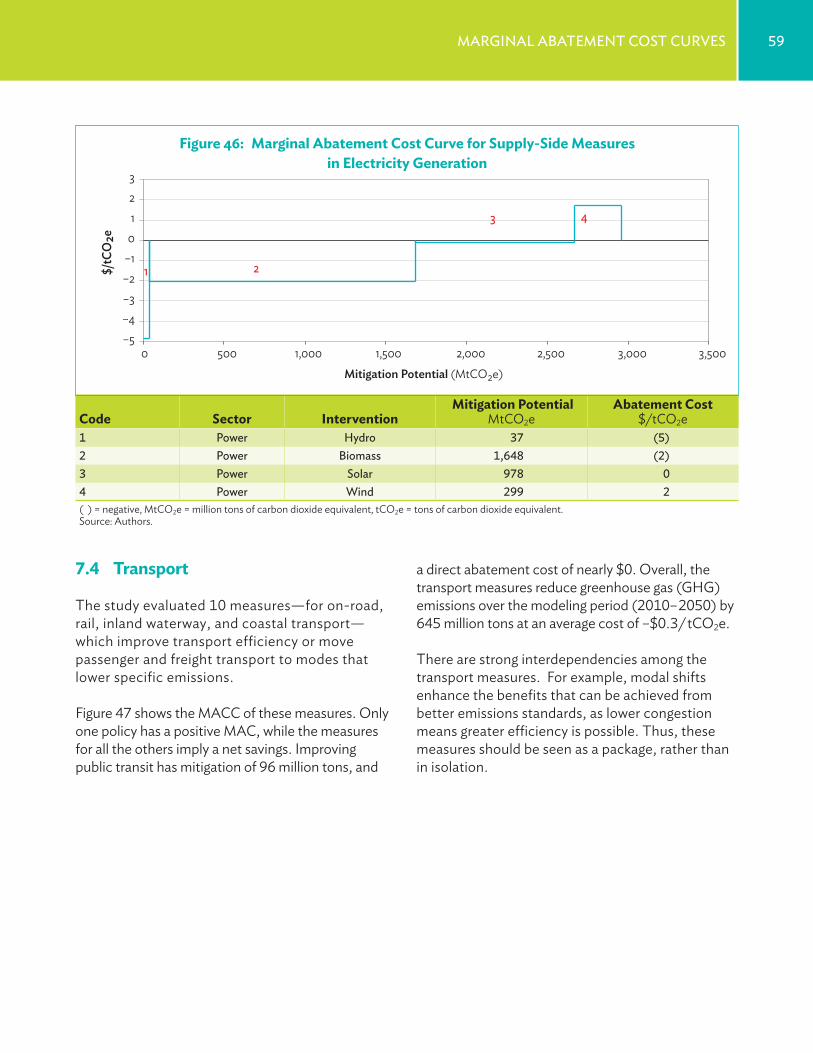
59marginal abatement Cost Curves
a direct abatement cost of nearly $0. Overall, the transport measures reduce greenhouse gas (GHG) emissions over the modeling period (2010– 2050) by 645 million tons at an average cost of –$0.3/ tCO2e.
There are strong interdependencies among the transport measures. For example, modal shifts enhance the benefits that can be achieved from better emissions standards, as lower congestion means greater efficiency is possible. Thus, these measures should be seen as a package, rather than in isolation.
7.4 Transport
The study evaluated 10 measures—for on-road, rail, inland waterway, and coastal transport—which improve transport efficiency or move passenger and freight transport to modes that lower specific emissions.
Figure 47 shows the MACC of these measures. Only one policy has a positive MAC, while the measures for all the others imply a net savings. Improving public transit has mitigation of 96 million tons, and
Code Sector Intervention Mitigation Potential
MtCO2eAbatement Cost
$/tCO2e1 Power hydro 37 (5)2 Power biomass 1,648 (2)3 Power solar 978 04 Power wind 299 2( ) = negative, MtCO2e = million tons of carbon dioxide equivalent, tCO2e = tons of carbon dioxide equivalent.Source: Authors.
–5 –4 –3 –2 –1 0 1 2 3
0 500 1,000 1,500 2,000 2,500 3,000 3,500
$/tC
O2e
Mitigation Potential (MtCO2e)
1 2
3 4
Figure 46: Marginal Abatement Cost Curve for Supply-Side Measures in Electricity Generation
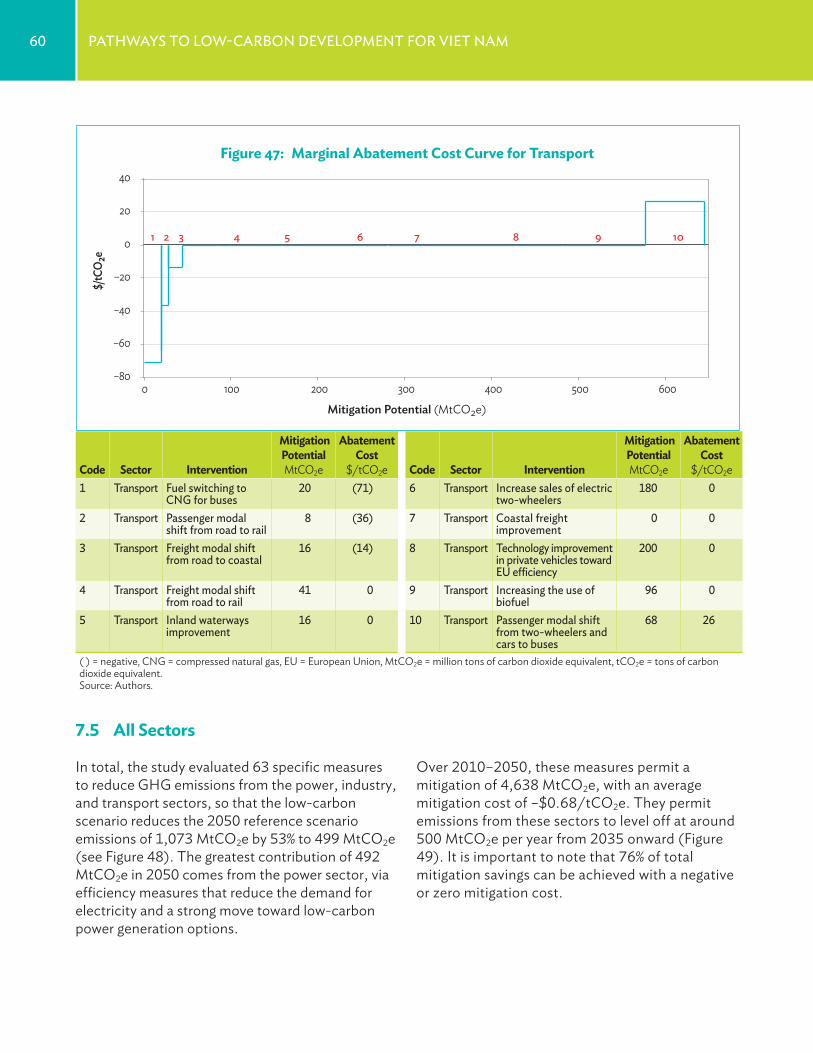
60 PathwaYs to low-Carbon develoPment For viet nam
Over 2010–2050, these measures permit a mitigation of 4,638 MtCO2e, with an average mitigation cost of –$0.68/tCO2e. They permit emissions from these sectors to level off at around 500 MtCO2e per year from 2035 onward (Figure 49). It is important to note that 76% of total mitigation savings can be achieved with a negative or zero mitigation cost.
7.5 All Sectors
In total, the study evaluated 63 specific measures to reduce GHG emissions from the power, industry, and transport sectors, so that the low-carbon scenario reduces the 2050 reference scenario emissions of 1,073 MtCO2e by 53% to 499 MtCO2e (see Figure 48). The greatest contribution of 492 MtCO2e in 2050 comes from the power sector, via efficiency measures that reduce the demand for electricity and a strong move toward low-carbon power generation options.
Mitigation Potential (MtCO2e)
$/tC
O2e
1 2 3 4 5 6 7 8 9 10
–80
–60
–40
–20
0
20
40
0 100 200 300 400 500 600
Code Sector Intervention
Mitigation Potential MtCO2e
Abatement Cost
$/tCO2e Code Sector Intervention
Mitigation Potential MtCO2e
Abatement Cost
$/tCO2e1 transport Fuel switching to
Cng for buses20 (71) 6 transport increase sales of electric
two-wheelers180 0
2 transport Passenger modal shift from road to rail
8 (36) 7 transport Coastal freight improvement
0 0
3 transport Freight modal shift from road to coastal
16 (14) 8 transport technology improvement in private vehicles toward eu efficiency
200 0
4 transport Freight modal shift from road to rail
41 0 9 transport increasing the use of biofuel
96 0
5 transport inland waterways improvement
16 0 10 transport Passenger modal shift from two-wheelers and cars to buses
68 26
( ) = negative, CNG = compressed natural gas, EU = European Union, MtCO2e = million tons of carbon dioxide equivalent, tCO2e = tons of carbon dioxide equivalent.Source: Authors.
Figure 47: Marginal Abatement Cost Curve for Transport
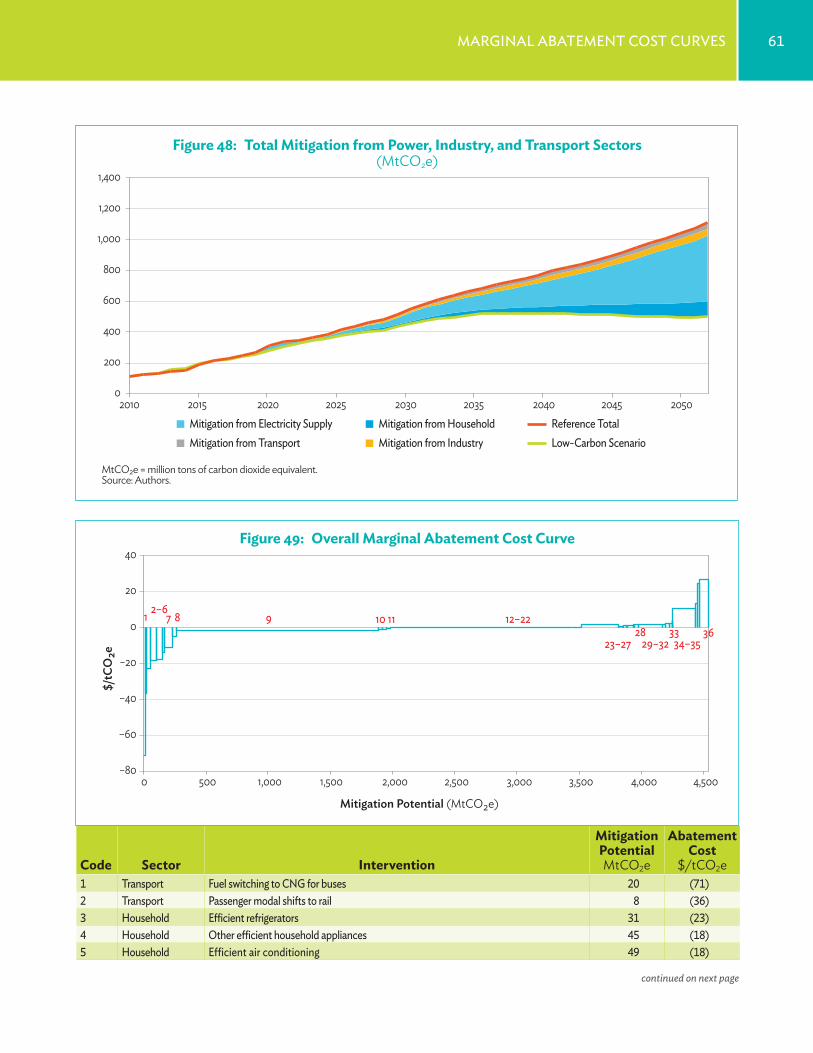
61marginal abatement Cost Curves
Code Sector Intervention
Mitigation Potential MtCO2e
Abatement Cost
$/tCO2e1 transport Fuel switching to Cng for buses 20 (71)2 transport Passenger modal shifts to rail 8 (36)3 household efficient refrigerators 31 (23)4 household other efficient household appliances 45 (18)5 household efficient air conditioning 49 (18)
MtCO2e = million tons of carbon dioxide equivalent.Source: Authors.
0
200
400
600
800
1,000
1,200
1,400
2010 2015 2020 2025 2030 2035 2040 2045 2050 Mitigation from Household Mitigation from Electricity Supply Mitigation from Industry Mitigation from Transport Low-Carbon Scenario
Reference Total
Figure 48: Total Mitigation from Power, Industry, and Transport Sectors (MtCO2e)
continued on next page
$/tC
O2e
Mitigation Potential (MtCO2e)
–80
–60
–40
–20
0
20
40
0 500 1,000 1,500 2,000 2,500 3,000 3,500 4,000 4,500
1 2–6 7 10 11 8 9 12–22
23–27 363328
29–32 34–35
Figure 49: Overall Marginal Abatement Cost Curve
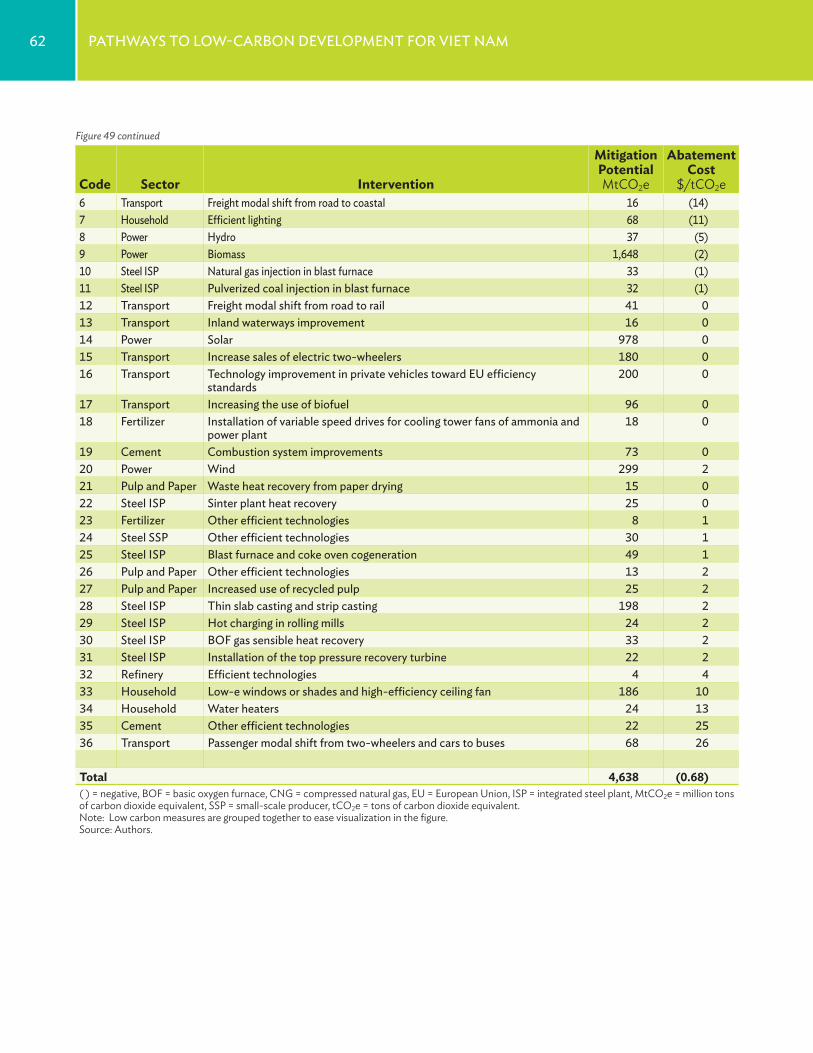
62 PathwaYs to low-Carbon develoPment For viet nam
Code Sector Intervention
Mitigation Potential MtCO2e
Abatement Cost
$/tCO2e6 transport Freight modal shift from road to coastal 16 (14)7 household efficient lighting 68 (11)8 Power hydro 37 (5)9 Power biomass 1,648 (2)10 steel isP natural gas injection in blast furnace 33 (1)11 steel isP Pulverized coal injection in blast furnace 32 (1)12 transport Freight modal shift from road to rail 41 013 transport inland waterways improvement 16 014 Power solar 978 015 transport increase sales of electric two-wheelers 180 016 transport technology improvement in private vehicles toward eu efficiency
standards200 0
17 transport increasing the use of biofuel 96 018 Fertilizer installation of variable speed drives for cooling tower fans of ammonia and
power plant18 0
19 Cement Combustion system improvements 73 020 Power wind 299 221 Pulp and Paper waste heat recovery from paper drying 15 022 steel isP sinter plant heat recovery 25 023 Fertilizer other efficient technologies 8 124 steel ssP other efficient technologies 30 125 steel isP blast furnace and coke oven cogeneration 49 126 Pulp and Paper other efficient technologies 13 227 Pulp and Paper increased use of recycled pulp 25 228 steel isP thin slab casting and strip casting 198 229 steel isP hot charging in rolling mills 24 230 steel isP boF gas sensible heat recovery 33 231 steel isP installation of the top pressure recovery turbine 22 232 refinery efficient technologies 4 433 household low-e windows or shades and high-efficiency ceiling fan 186 1034 household water heaters 24 1335 Cement other efficient technologies 22 2536 transport Passenger modal shift from two-wheelers and cars to buses 68 26
Total 4,638 (0.68)( ) = negative, BOF = basic oxygen furnace, CNG = compressed natural gas, EU = European Union, ISP = integrated steel plant, MtCO2e = million tons of carbon dioxide equivalent, SSP = small-scale producer, tCO2e = tons of carbon dioxide equivalent.Note: Low carbon measures are grouped together to ease visualization in the figure.Source: Authors.
Figure 49 continued
8. economy-wIde conseQuences of low-carbon growth
63
James Thurlow (CIEM and University of Copenhagen 2010).25 In collaboration with the World Institute for Development Economics Research, United Nations University, CIEM constructed the 2011 social accounting matrix (SAM), which underpins the latest version of the model. The main features are briefly presented below.
Overall, the model has 32 production sectors, which include 9 energy sectors (crude oil, natural gas, coal, fuels/refined oil, and coal-based, gas-based, oil-based electricity, hydropower, and renewable electricity); 32 corresponding commodities; 3 labor factors classified by skill level (skilled, semiskilled, and unskilled); and a land factor and a capital factor. The three labor factors are then further disaggregated into location category (rural and urban); and 20 types of representative households in the model are divided by quintile consumption and location (rural and urban). The model also includes the public sector, investment and savings, and the rest of the world.
Producers in the model maximize their profits subject to several types of constraints, which are presented in Figure 50. First, the combinations between energy-production factors composite and other intermediate inputs, among intermediate inputs, and between the commodities produced, follow the Leontief function. This specification implies that combinations are determined by the technology, not by the producers. Second, energy and different production factors are combined in a constant elasticity of substitution function. This specification allows the substitution between production factors
25 For more on the development of this CGE type model, see Lofgren, Harris, and Robinson (2002) and Dervis, de Melo, and Robinson (1982).
8.1 Background
The previous chapters assess the effects of low-carbon development measures in a partial equilibrium framework, where
rebound effects and macroeconomic responses are not represented. However, the changes in demand for fossil fuels and in electricity prices can have general equilibrium effects, based on substitution within and across markets that vary on where and how costs occur. To assess these effects, a different approach is required.
This chapter investigates the economic and social impacts of the low-carbon options package presented in the previous chapters using the computable general equilibrium (CGE) model. By its nature, the model captures the behavior of main entities in the economy (producers and consumers) as well as the main linkages (among production sectors, income, and consumption). Changes in one variable or parameter will trigger changes in the economy in order to reach a new balance. These characteristics make the model relevant by capturing multi-round interaction effects to assess the impact of low-carbon options.
8.2 Model Structure and Data
The CGE model developed in this report is a recursive dynamic type with a combined neoclassical-structural feature, extended from an original static CGE model built by the International Food Policy Research Institute and the dynamic model for Viet Nam by
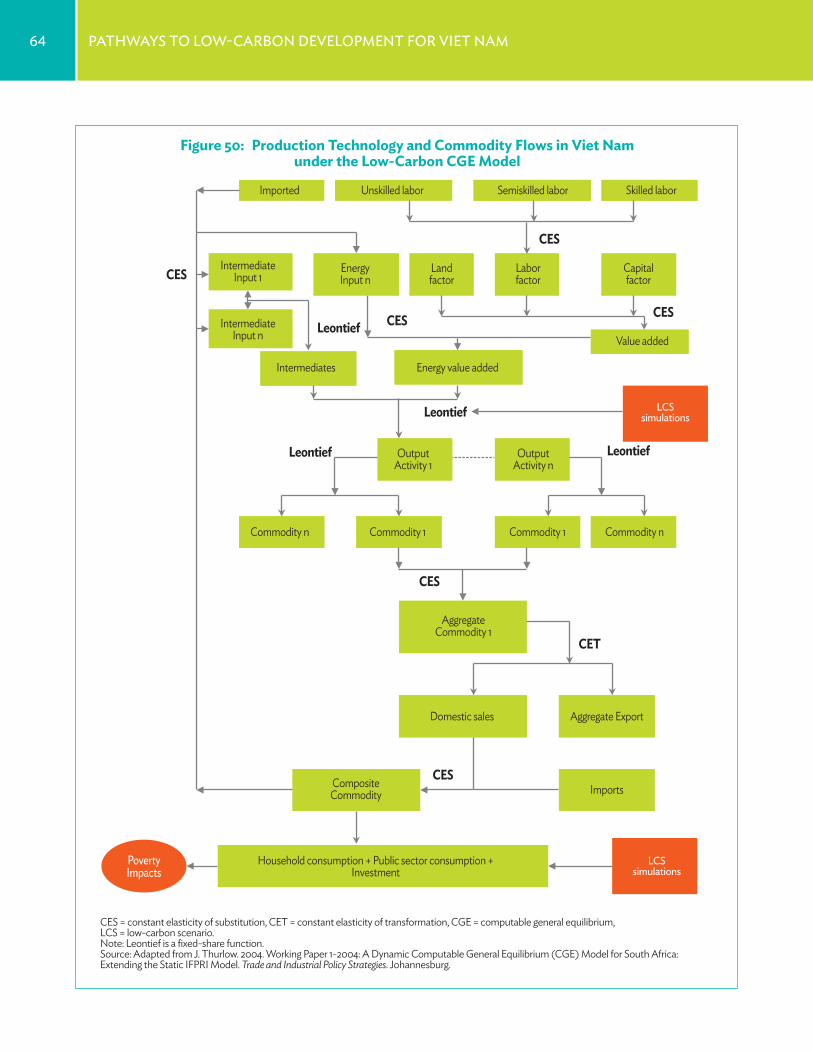
64 PathwaYs to low-Carbon develoPment For viet nam
CES
Imported Unskilled labor Semiskilled labor Skilled labor
LeontiefCES
Leontief
CES
CES
CET
Leontief Leontief
CES
CES
CES = constant elasticity of substitution, CET = constant elasticity of transformation, CGE = computable general equilibrium, LCS = low-carbon scenario.Note: Leontief is a fixed-share function. Source: Adapted from J. Thurlow. 2004. Working Paper 1-2004: A Dynamic Computable General Equilibrium (CGE) Model for South Africa: Extending the Static IFPRI Model. Trade and Industrial Policy Strategies. Johannesburg.
IntermediateInput 1
IntermediateInput n
EnergyInput n
OutputActivity 1
AggregateCommodity 1
CompositeCommodity Imports
Aggregate Export
OutputActivity n
LCSsimulations
LCSsimulations
Landfactor
Laborfactor
Capitalfactor
Intermediates
Commodity n
PovertyImpacts
Commodity 1
Domestic sales
Commodity 1 Commodity n
Energy value added
Value added
Household consumption + Public sector consumption +Investment
Figure 50: Production Technology and Commodity Flows in Viet Nam under the Low-Carbon CGE Model
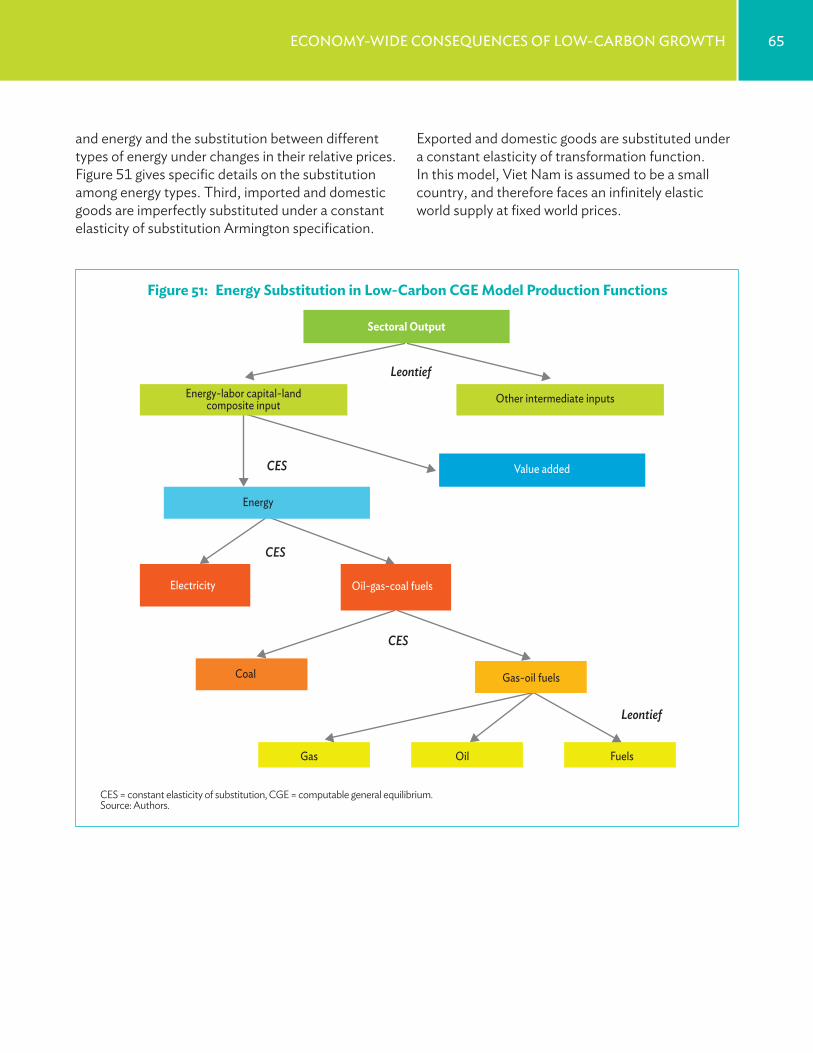
65eConomY-wide ConseQuenCes oF low-Carbon growth
Exported and domestic goods are substituted under a constant elasticity of transformation function. In this model, Viet Nam is assumed to be a small country, and therefore faces an infinitely elastic world supply at fixed world prices.
and energy and the substitution between different types of energy under changes in their relative prices. Figure 51 gives specific details on the substitution among energy types. Third, imported and domestic goods are imperfectly substituted under a constant elasticity of substitution Armington specification.
CES = constant elasticity of substitution, CGE = computable general equilibrium.Source: Authors.
Gas Oil Fuels
Sectoral Output
Energy-labor capital-landcomposite input Other intermediate inputs
Oil-gas-coal fuels Electricity
Coal Gas-oil fuels
Leontief
Leontief
Energy
Value addedCES
CES
CES
Figure 51: Energy Substitution in Low-Carbon CGE Model Production Functions
66 PathwaYs to low-Carbon develoPment For viet nam
subsequent period, while skilled labor supply responds to changes in real wages over time, and real wages of unskilled and semiskilled workers adjust across periods.
The model has been extended to be able to assess the impact of low-carbon options on poverty reduction in Viet Nam by adding a poverty module. To do that, 20 representative households in the original CGE model have been mapped via annual expenditures to the 9,393 households in the 2010 Viet Nam Household Living Standard Survey (VHLSS) General Statistics Office of Viet Nam (2010).27 This poverty module has been developed to allow the impacts of different low-carbon scenarios on poverty reduction to be measured by three poverty indexes (headcount [PO], poverty gap [P1], and poverty severity [P2]). Besides measuring poverty impact through the changes in household expenditure, the poverty module also takes into account the impact through the price change of the goods baskets used to calculate the poverty line in Viet Nam. The poverty line for Viet Nam in 2010 is D653,000 per person per month (equivalent to $2.26 per person per day, 2005 PPP dollars) (World Bank 2012).
Greenhouse gas (GHG) emissions are modeled based on quantity demand and quantity output of energy from related industry sectors and households and by the emission coefficients of each primary energy source. The quantity demand and production of energy were taken from the energy table for Viet Nam in 2011. The total GHG emission calculated by this way, more or less matched with the carbon emission in the Energy Forecasting Framework and Emissions Consensus Tool (EFFECT) model.
27 The VHLSS surveyed 9,399 households, which represent Viet Nam’s total population in 2010. However, when processing the data, 6 households were dropped for coding reasons, bringing the number of mapping households in the model to 9,393 households.
Household consumption follows a linear expenditure system. The public sector gets revenue from direct and indirect taxes, and then spends it on public consumption, investment, and on transfers to households and payments to the rest of the world. All of these payments are fixed in real terms; therefore, the budget deficit is mainly financed by borrowing from the domestic capital market. Public consumption is separated from the production of public services.
The goods and services markets are perfectly competitive, while rigidities in the factor markets reflect transitional characteristics as Viet Nam transforms from a planned to a market economy. Capital and land are fully employed and activity specific. The labor market is segmented in two: semiskilled and unskilled labor, with the latter redundant in Viet Nam up to 2030.
Savings by households and enterprises are collected into a savings pool from which investment is financed. The model adopts closure that investment is savings driven. Closures of current account and the public sector are selected based on current public policies. For the current account, it is assumed that a flexible exchange rate adjusts in order to maintain a fixed level of foreign borrowing. In other words, the external balance is held fixed in foreign currency. In the public account, public sector savings are flexible and direct tax rates are fixed. Finally, the domestic producer price index is chosen as a numéraire such that all prices in the model are relative to the weighted unit price of the initial domestic producers’ price. The model is recursive dynamic, which is based on an adaptive rather than a forward-looking expectation.26 The dynamic part of the model generates new capital stock for the
26 The model can be made dynamic in several ways. According to Ginsburgh and Keyzer (1997), there are finite and infinite horizon dynamics. The model applied in this paper belongs to one of three finite horizontal dynamic models: single-period equilibrium model, T-period competitive equilibrium model, and temporary equilibrium model.
67eConomY-wide ConseQuenCes oF low-Carbon growth
8.3.2 economic growth effects of low-carbon scenario
This analysis finds that low-carbon options will have a short-term cost through the 2020s, after which the long-term impact on economic growth is positive (Figure 52). The lower growth rates of GDP during the initial period is mainly a result of the large initial investment to improve energy efficiency of industries, especially for cement and steel, and the investment in changing the power production structure. The new investment in these sectors will withdraw capital from other sectors of the economy, at the expense of their initial growth. Over the longer term, efficiency improvements result, and GDP in the low-carbon scenario exceeds that of the reference scenario.
Within specific sectors, the low-carbon scenario initially favors the shares of agriculture and services in the economy (Figure 53). However, after 2040, industry has a higher share of GDP under the low-carbon scenario than under the reference scenario. This is due to initial investment in efficiency that leads to greater long- term productivity, especially in manufacturing.
However, the low-carbon scenario results in a lower export value compared with the reference scenario. Low-carbon options also increase private consumption constantly from 2015 as a result of reduced energy expenditure. After 2030, when the impacts on the economy become positive, the gains in private consumption will be larger between the LCS and reference scenario. In addition, low- carbon development may also create new green industries and services that are not accounted for in this model.
8.3 Simulations and Assessment Results
8.3.1 reference scenario and low-carbon scenario
To assess the low-carbon options assessed within EFFECT, the reference scenario is also made consistent between the models, in gross domestic product (GDP) growth, GDP structure, and power structure and development during 2011– 2050. These assumptions were defined on a shared basis between the models to ensure consistency.
The low-carbon scenario (LCS) has been developed based on the low-carbon options identified in the previous chapters. As a result, the LCS consists of the low-carbon interventions on seven industries (five industry sectors, transportation, and power sector) and household, which have been developed by the bottom–up models for Viet Nam. These may be divided into the following four main groups of action regarding energy consumption and production:
(i) Industrial energy efficiency: Improve the energy efficiency of five energy-intensive industries: cement, steel, oil refining, fertilizer, and paper, by investing in energy-saving technologies and production rearrangement.
(ii) Household energy efficiency: Improve the energy efficiency of households by investing in power-saving equipment.
(iii) Transportation sector: Direct the energy consumption patterns of transportation toward electricity from fuels.
(iv) Power production structure: Increase the share of gas-based electricity and renewable power while reducing the share of coal-based electricity.
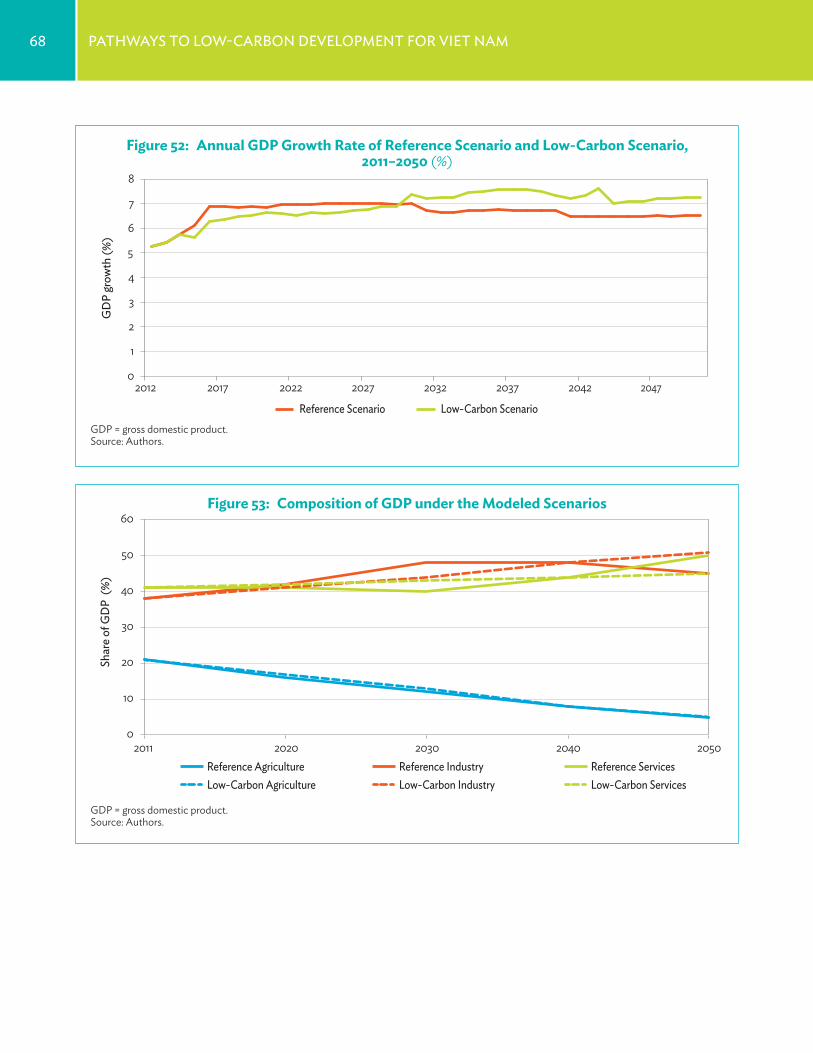
68 PathwaYs to low-Carbon develoPment For viet nam
0
10
20
30
40
50
60
2011 2020 2030 2040 2050
Shar
e of
GD
P (%
)
Reference Agriculture Reference Industry Reference Services Low-Carbon Agriculture Low-Carbon Industry Low-Carbon Services
Reference Scenario Low-Carbon Scenario
0
1
2
3
4
5
6
7
8
2012 2017 2022 2027 2032 2037 2042 2047
GD
P gr
owth
(%)
Figure 52: Annual GDP Growth Rate of Reference Scenario and Low-Carbon Scenario, 2011–2050 (%)
GDP = gross domestic product.Source: Authors.
GDP = gross domestic product.Source: Authors.
Figure 53: Composition of GDP under the Modeled Scenarios
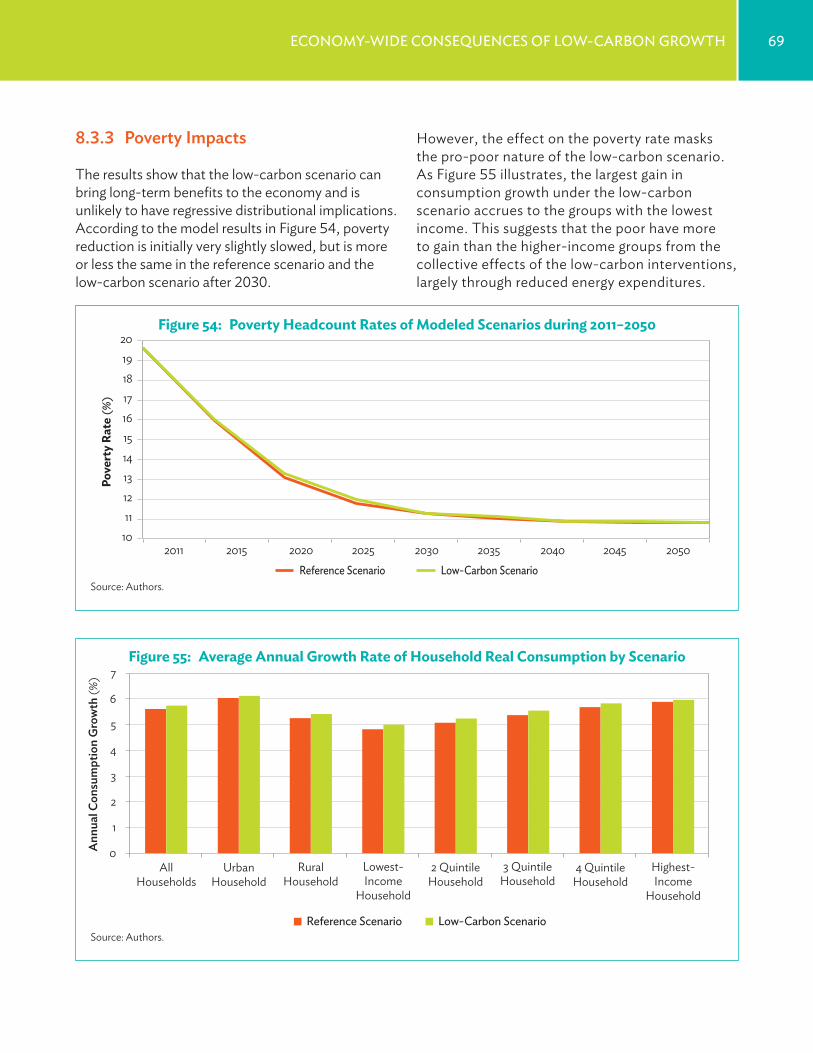
69eConomY-wide ConseQuenCes oF low-Carbon growth
Reference Scenario Low-Carbon Scenario
10 11 12 13 14 15 16 17 18 19 20
2011 2015 2020 2025 2030 2035 2040 2045 2050
Pove
rty
Rate
(%)
0
1
2
3
4
5
6
7
Ann
ual C
onsu
mpt
ion
Gro
wth
(%)
AllHouseholds
UrbanHousehold
RuralHousehold
Lowest-Income
Household
2 QuintileHousehold
3 QuintileHousehold
4 QuintileHousehold
Highest-Income
Household
Reference Scenario Low-Carbon Scenario
However, the effect on the poverty rate masks the pro-poor nature of the low-carbon scenario. As Figure 55 illustrates, the largest gain in consumption growth under the low-carbon scenario accrues to the groups with the lowest income. This suggests that the poor have more to gain than the higher-income groups from the collective effects of the low-carbon interventions, largely through reduced energy expenditures.
8.3.3 Poverty Impacts
The results show that the low-carbon scenario can bring long-term benefits to the economy and is unlikely to have regressive distributional implications. According to the model results in Figure 54, poverty reduction is initially very slightly slowed, but is more or less the same in the reference scenario and the low-carbon scenario after 2030.
Source: Authors.
Source: Authors.
Figure 55: Average Annual Growth Rate of Household Real Consumption by Scenario
Figure 54: Poverty Headcount Rates of Modeled Scenarios during 2011–2050
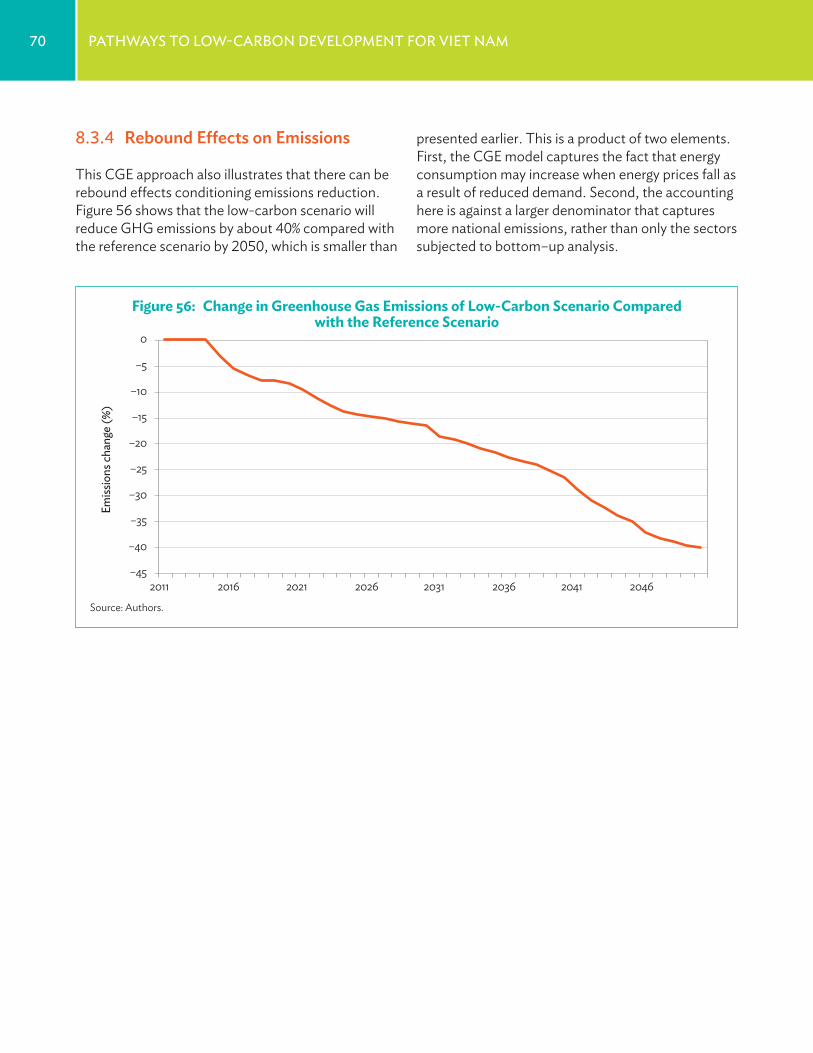
70 PathwaYs to low-Carbon develoPment For viet nam
–45
–40
–35
–30
–25
–20
–15
–10
–5
0
2011 2016 2021 2026 2031 2036 2041 2046
Emiss
ions
chan
ge (%
)
8.3.4 rebound effects on emissions
This CGE approach also illustrates that there can be rebound effects conditioning emissions reduction. Figure 56 shows that the low-carbon scenario will reduce GHG emissions by about 40% compared with the reference scenario by 2050, which is smaller than
presented earlier. This is a product of two elements. First, the CGE model captures the fact that energy consumption may increase when energy prices fall as a result of reduced demand. Second, the accounting here is against a larger denominator that captures more national emissions, rather than only the sectors subjected to bottom–up analysis.
Figure 56: Change in Greenhouse Gas Emissions of Low-Carbon Scenario Compared with the Reference Scenario
Source: Authors.
9. PolIcIes to realIZe low-carbon growth PotentIal
71
compared with a VGGS target of 20% and, in 2050, a mitigation of 53% compared with a VGGS target of 50% (Figure 57). The un-modeled sectors mentioned above may also contribute a further mitigation component. The analysis confirms that the long-term targets of the VGGS are achievable. Similarly, the modeled mitigation exceeds the unconditional goal of the NDC, and satisfies most of the relative conditional ambition of the NDC for 2030.
Although relative reduction goals align between the NDC and this study, the study shows that Viet Nam can be on a greener growth trajectory than the NDC envisions. Under the NDC, BAU emissions in 2030 are 787 million tons, or a 443% increase from 2010 levels. This study shows reference scenario energy sector emissions of 552 million tons in 2030, or a 393% increase from 2010 levels in those sectors that have the fastest growth in emissions. If grid-supplied electricity emissions are compared, the NDC reflects 404 million tons of carbon dioxide equivalent (MtCO2e) in 2030, while this study finds 325 million tons, reflecting 19% lower-grid emissions without low-carbon options in place. The lower figures in this study are a result of more incorporation of likely efficiency improvements in the reference scenario, such that emissions grow less rapidly.
The 2030 reference emissions level in this study corresponds approximately to 650 million tons if other non-energy emissions are added, which is already 17% below the NDC BAU. In levels, the low-carbon scenario in 2030 represents a 30% reduction from the NDC baseline, without counting any abatement from other sectors. This suggests that a greener growth pathway than is reflected in current goals can be achieved. Given that the low-
9.1 Viet Nam’s Mitigation Goals Can Be Met or Exceeded
The earlier chapters have demonstrated that Viet Nam can achieve 40% to 53% reduction in greenhouse gas (GHG) emissions by 2050
by using specific enhanced technologies for energy production and consumption. The financial costs of such a transition are found to be modest, while the long-term effect is faster economic growth and a larger economy. Moreover, those benefits are progressively distributed, as poorer populations have larger relative gains than those with more income. These results demonstrate that a low-carbon/green growth development pathway can be economically attractive, requiring lower investment and operating expenses than a “normal” development scenario based on a continuation of current practices.
The Viet Nam Green Growth Strategy (VGGS) issued in 2012 and the 2016 Nationally Determined Contribution (NDC) to the Paris Agreement reflect important commitments to emissions reduction. The key targets of the VGGS are to reduce GHG emissions by 1.5%–2% per year by 2030, to reduce GHG in energy activities by 20%–30% compared with business as usual (BAU). The only target set toward 2050 is to reduce GHG emissions by 1.5%–2% per year, which suggests about a 50% reduction. The NDC sets a goal of 8% reduction of all emissions by 2030, which may increase to 25% under international support.
The modeled low-carbon pathway exhibits a direct mitigation of the energy sector of 7% in 2020 compared with a VGGS target of 10%. In 2030, the modeled pathway exhibits a mitigation of 18%
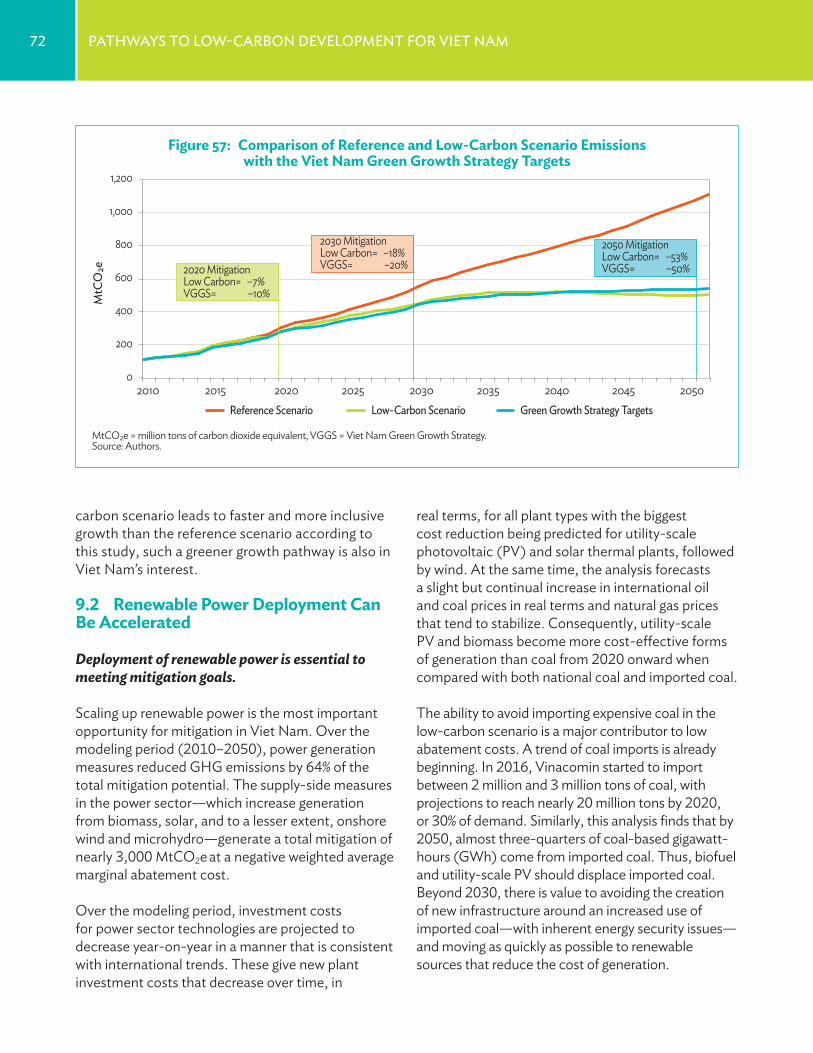
72 PathwaYs to low-Carbon develoPment For viet nam
real terms, for all plant types with the biggest cost reduction being predicted for utility-scale photovoltaic (PV) and solar thermal plants, followed by wind. At the same time, the analysis forecasts a slight but continual increase in international oil and coal prices in real terms and natural gas prices that tend to stabilize. Consequently, utility-scale PV and biomass become more cost-effective forms of generation than coal from 2020 onward when compared with both national coal and imported coal.
The ability to avoid importing expensive coal in the low-carbon scenario is a major contributor to low abatement costs. A trend of coal imports is already beginning. In 2016, Vinacomin started to import between 2 million and 3 million tons of coal, with projections to reach nearly 20 million tons by 2020, or 30% of demand. Similarly, this analysis finds that by 2050, almost three-quarters of coal-based gigawatt-hours (GWh) come from imported coal. Thus, biofuel and utility-scale PV should displace imported coal. Beyond 2030, there is value to avoiding the creation of new infrastructure around an increased use of imported coal—with inherent energy security issues—and moving as quickly as possible to renewable sources that reduce the cost of generation.
carbon scenario leads to faster and more inclusive growth than the reference scenario according to this study, such a greener growth pathway is also in Viet Nam’s interest.
9.2 Renewable Power Deployment Can Be Accelerated
Deployment of renewable power is essential to meeting mitigation goals.
Scaling up renewable power is the most important opportunity for mitigation in Viet Nam. Over the modeling period (2010–2050), power generation measures reduced GHG emissions by 64% of the total mitigation potential. The supply-side measures in the power sector—which increase generation from biomass, solar, and to a lesser extent, onshore wind and microhydro—generate a total mitigation of nearly 3,000 MtCO2e at a negative weighted average marginal abatement cost.
Over the modeling period, investment costs for power sector technologies are projected to decrease year-on-year in a manner that is consistent with international trends. These give new plant investment costs that decrease over time, in
0
200
400
600
800
1,000
1,200
2010 2015 2020 2025 2030 2035 2040 2045 2050
MtC
O2e
Reference Scenario Low-Carbon Scenario Green Growth Strategy Targets
2020 MitigationLow Carbon= –7%VGGS= –10%
2030 MitigationLow Carbon= –18%VGGS= –20%
2050 MitigationLow Carbon= –53%VGGS= –50%
MtCO2e = million tons of carbon dioxide equivalent, VGGS = Viet Nam Green Growth Strategy.Source: Authors.
Figure 57: Comparison of Reference and Low-Carbon Scenario Emissions with the Viet Nam Green Growth Strategy Targets
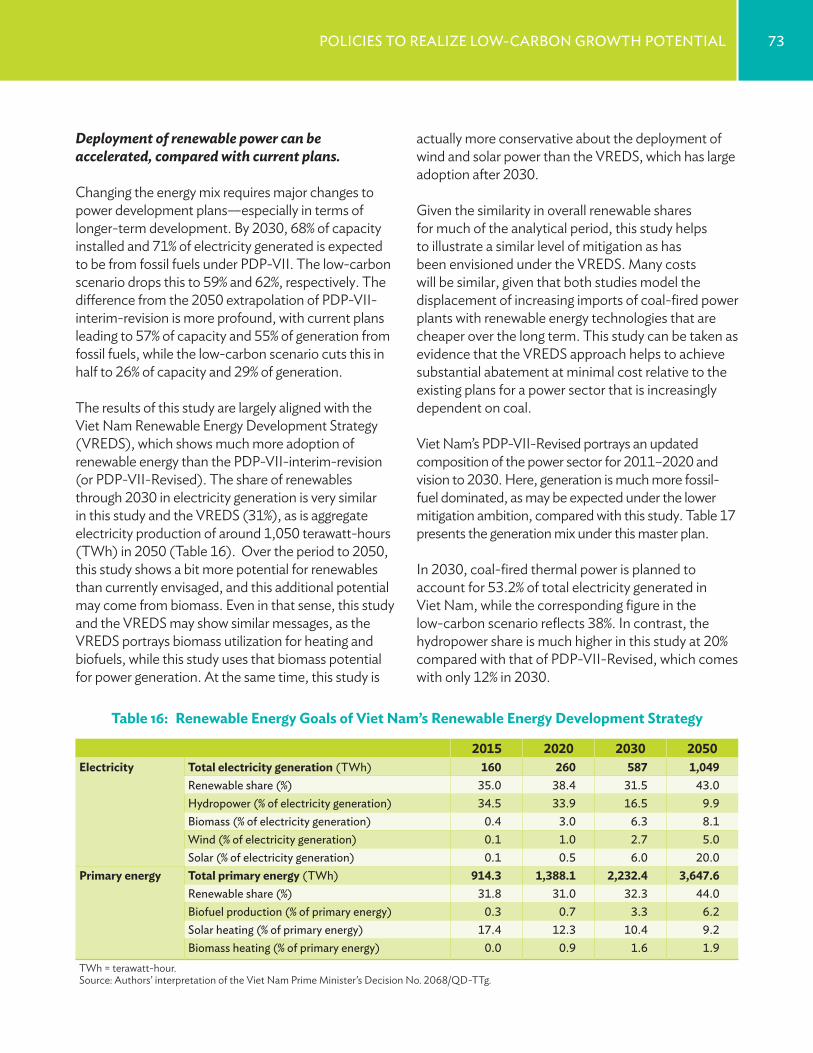
73PoliCies to realiZe low-Carbon growth Potential
actually more conservative about the deployment of wind and solar power than the VREDS, which has large adoption after 2030.
Given the similarity in overall renewable shares for much of the analytical period, this study helps to illustrate a similar level of mitigation as has been envisioned under the VREDS. Many costs will be similar, given that both studies model the displacement of increasing imports of coal-fired power plants with renewable energy technologies that are cheaper over the long term. This study can be taken as evidence that the VREDS approach helps to achieve substantial abatement at minimal cost relative to the existing plans for a power sector that is increasingly dependent on coal.
Viet Nam’s PDP-VII-Revised portrays an updated composition of the power sector for 2011–2020 and vision to 2030. Here, generation is much more fossil-fuel dominated, as may be expected under the lower mitigation ambition, compared with this study. Table 17 presents the generation mix under this master plan.
In 2030, coal-fired thermal power is planned to account for 53.2% of total electricity generated in Viet Nam, while the corresponding figure in the low-carbon scenario reflects 38%. In contrast, the hydropower share is much higher in this study at 20% compared with that of PDP-VII-Revised, which comes with only 12% in 2030.
Deployment of renewable power can be accelerated, compared with current plans.
Changing the energy mix requires major changes to power development plans—especially in terms of longer-term development. By 2030, 68% of capacity installed and 71% of electricity generated is expected to be from fossil fuels under PDP-VII. The low-carbon scenario drops this to 59% and 62%, respectively. The difference from the 2050 extrapolation of PDP-VII-interim-revision is more profound, with current plans leading to 57% of capacity and 55% of generation from fossil fuels, while the low-carbon scenario cuts this in half to 26% of capacity and 29% of generation.
The results of this study are largely aligned with the Viet Nam Renewable Energy Development Strategy (VREDS), which shows much more adoption of renewable energy than the PDP-VII-interim-revision (or PDP-VII-Revised). The share of renewables through 2030 in electricity generation is very similar in this study and the VREDS (31%), as is aggregate electricity production of around 1,050 terawatt-hours (TWh) in 2050 (Table 16). Over the period to 2050, this study shows a bit more potential for renewables than currently envisaged, and this additional potential may come from biomass. Even in that sense, this study and the VREDS may show similar messages, as the VREDS portrays biomass utilization for heating and biofuels, while this study uses that biomass potential for power generation. At the same time, this study is
Table 16: Renewable Energy Goals of Viet Nam’s Renewable Energy Development Strategy
2015 2020 2030 2050Electricity Total electricity generation (twh) 160 260 587 1,049
renewable share (%) 35.0 38.4 31.5 43.0hydropower (% of electricity generation) 34.5 33.9 16.5 9.9biomass (% of electricity generation) 0.4 3.0 6.3 8.1wind (% of electricity generation) 0.1 1.0 2.7 5.0solar (% of electricity generation) 0.1 0.5 6.0 20.0
Primary energy Total primary energy (twh) 914.3 1,388.1 2,232.4 3,647.6renewable share (%) 31.8 31.0 32.3 44.0biofuel production (% of primary energy) 0.3 0.7 3.3 6.2solar heating (% of primary energy) 17.4 12.3 10.4 9.2biomass heating (% of primary energy) 0.0 0.9 1.6 1.9
TWh = terawatt-hour. Source: Authors’ interpretation of the Viet Nam Prime Minister’s Decision No. 2068/QD-TTg.
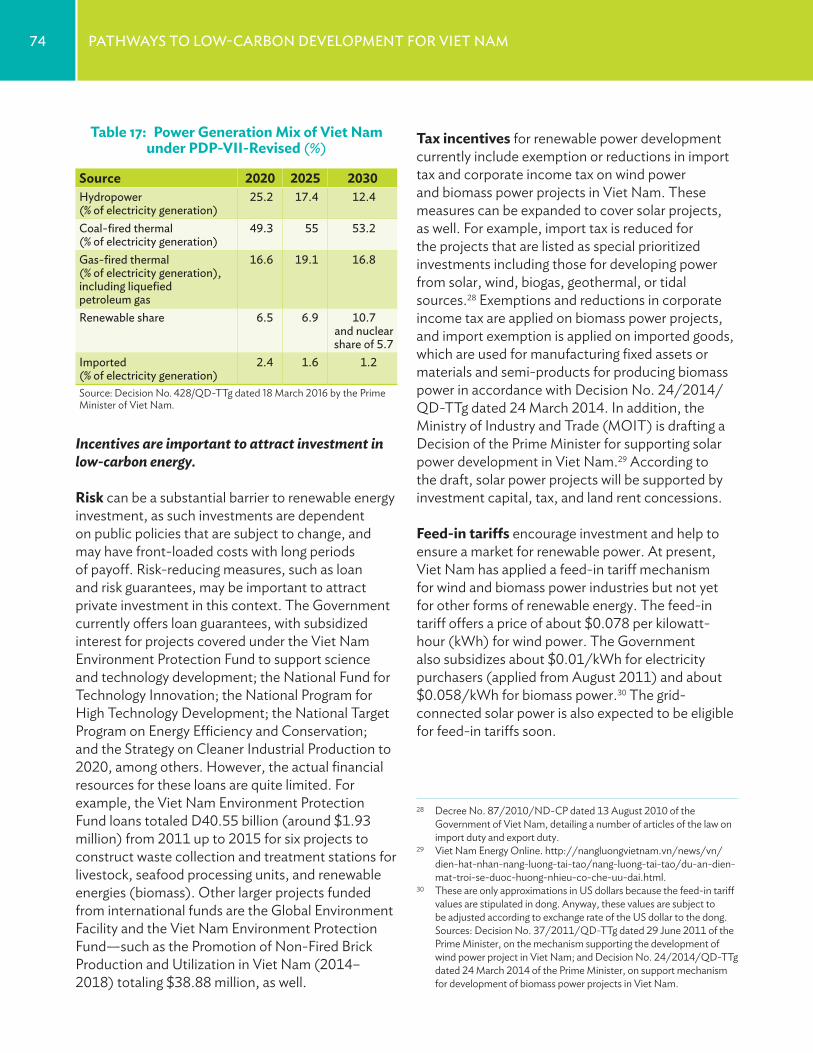
74 PathwaYs to low-Carbon develoPment For viet nam
Tax incentives for renewable power development currently include exemption or reductions in import tax and corporate income tax on wind power and biomass power projects in Viet Nam. These measures can be expanded to cover solar projects, as well. For example, import tax is reduced for the projects that are listed as special prioritized investments including those for developing power from solar, wind, biogas, geothermal, or tidal sources.28 Exemptions and reductions in corporate income tax are applied on biomass power projects, and import exemption is applied on imported goods, which are used for manufacturing fixed assets or materials and semi-products for producing biomass power in accordance with Decision No. 24/2014/QD-TTg dated 24 March 2014. In addition, the Ministry of Industry and Trade (MOIT) is drafting a Decision of the Prime Minister for supporting solar power development in Viet Nam.29 According to the draft, solar power projects will be supported by investment capital, tax, and land rent concessions.
Feed-in tariffs encourage investment and help to ensure a market for renewable power. At present, Viet Nam has applied a feed-in tariff mechanism for wind and biomass power industries but not yet for other forms of renewable energy. The feed-in tariff offers a price of about $0.078 per kilowatt-hour (kWh) for wind power. The Government also subsidizes about $0.01/kWh for electricity purchasers (applied from August 2011) and about $0.058/kWh for biomass power.30 The grid-connected solar power is also expected to be eligible for feed-in tariffs soon.
28 Decree No. 87/2010/ND-CP dated 13 August 2010 of the Government of Viet Nam, detailing a number of articles of the law on import duty and export duty.
29 Viet Nam Energy Online. http://nangluongvietnam.vn/news/vn/dien-hat-nhan-nang-luong-tai-tao/nang-luong-tai-tao/du-an-dien-mat-troi-se-duoc-huong-nhieu-co-che-uu-dai.html.
30 These are only approximations in US dollars because the feed-in tariff values are stipulated in dong. Anyway, these values are subject to be adjusted according to exchange rate of the US dollar to the dong. Sources: Decision No. 37/2011/QD-TTg dated 29 June 2011 of the Prime Minister, on the mechanism supporting the development of wind power project in Viet Nam; and Decision No. 24/2014/QD-TTg dated 24 March 2014 of the Prime Minister, on support mechanism for development of biomass power projects in Viet Nam.
Incentives are important to attract investment in low-carbon energy.
Risk can be a substantial barrier to renewable energy investment, as such investments are dependent on public policies that are subject to change, and may have front-loaded costs with long periods of payoff. Risk-reducing measures, such as loan and risk guarantees, may be important to attract private investment in this context. The Government currently offers loan guarantees, with subsidized interest for projects covered under the Viet Nam Environment Protection Fund to support science and technology development; the National Fund for Technology Innovation; the National Program for High Technology Development; the National Target Program on Energy Efficiency and Conservation; and the Strategy on Cleaner Industrial Production to 2020, among others. However, the actual financial resources for these loans are quite limited. For example, the Viet Nam Environment Protection Fund loans totaled D40.55 billion (around $1.93 million) from 2011 up to 2015 for six projects to construct waste collection and treatment stations for livestock, seafood processing units, and renewable energies (biomass). Other larger projects funded from international funds are the Global Environment Facility and the Viet Nam Environment Protection Fund—such as the Promotion of Non-Fired Brick Production and Utilization in Viet Nam (2014–2018) totaling $38.88 million, as well.
Table 17: Power Generation Mix of Viet Nam under PDP-VII-Revised (%)
Source 2020 2025 2030hydropower (% of electricity generation)
25.2 17.4 12.4
Coal-fired thermal (% of electricity generation)
49.3 55 53.2
gas-fired thermal (% of electricity generation), including liquefied petroleum gas
16.6 19.1 16.8
renewable share 6.5 6.9 10.7 and nuclear share of 5.7
imported (% of electricity generation)
2.4 1.6 1.2
Source: Decision No. 428/QD-TTg dated 18 March 2016 by the Prime Minister of Viet Nam.
75PoliCies to realiZe low-Carbon growth Potential
geographically dispersed locations needs to be established. To address this challenge—as it involves coordination with many actors, including producers, collectors, processors, and transporters—logistical innovations will be needed, along with appropriate infrastructure for preprocessing and refining. Currently, Viet Nam has a few small sugarcane biomass power plants, such as those in Tuyen Quang province. These can be expanded to include those using other residues from cash crops, waste, and urban wastewater.
9.3 Energy Efficiency is Essential to Low-Carbon Growth
Energy-efficiency targets can be achieved by carrying out targeted measures. Improving energy-efficiency is found in this study to have a lower economic cost than increasing generation, and thus is important to achieving low cost mitigation potential. Energy-efficiency targets were set in the VGGS. The results of the efficiency measures considered here suggest that the electricity elasticity of GDP can fall from 2 to 1 for modeled sectors by the early 2020s, which is consistent with VGGS targets. A large share of these gains can be achieved via a few identified efficiency improvements in households and industries.
Energy subsidy reform can encourage improved efficiency. Energy pricing reform in the reference scenario is an essential prerequisite for low-carbon/green growth development. Although Viet Nam has recently had substantial fossil fuel subsidies for the power sector (UNDP 2014), getting the prices right on energy by removing direct and indirect subsidies and fully adopting market-based prices is part of the country’s current policy framework.32 As fossil fuel subsidies encourage energy inefficiency, make investment in efficient equipment uneconomic and renewable energy uncompetitive, their removal can set the right incentives for the measures assessed here. The Government has basically removed subsidies for all non-electricity fossil fuels. More can
32 According to Decision 1855/QD-TTg dated 27 December 2007 of the Prime Minister, approving Viet Nam’s national energy development strategy up to 2020, with 2050 vision.
Net metering promotes small-scale renewable generation investment by facilitating electricity sales back into the grid. This instrument is being considered by the Government to encourage solar energy system owners (including both businesses and households). This electricity sales mechanism helps owners offset their costs and is a possible incentive for solar energy development in Viet Nam. To realize the large share of solar power reflected in the low-carbon scenario, net metering should be prioritized. This policy is stipulated in VREDS by 2030 (vision to 2050), in which the net metering mechanism is applied to end-user customers who produce renewable electricity.31
The application of more standard producer purchase agreements, especially for renewable energy contracts, should be promoted. Currently, standard producer purchase agreements are available for small hydropower plants in Viet Nam. These can be more effective if they are available for other renewable energy sources.
Renewable portfolio standards are applied in many countries to require minimum shares of renewable power generation from power-producing companies. In Viet Nam, portfolio standards currently stipulate 3% by 2020, 10% by 2030, and 20% of total power generation by 2050, according to VREDS.
Development of advanced energy technologies ultimately helps to lower the cost of a low-carbon transition. The rising use of biomass over the long term for power generation in the low-carbon scenario could be facilitated by the application of second-generation biofuels, which have only recently become commercially viable.
Piloting advanced energy technologies is essential for new technologies to become viable when they need to be adapted to Viet Nam’s conditions. To scale up energy production from biomass, as envisioned both under this study and the VREDS, collection of agricultural residues from broad and
31 By Decision No. 2068/QD-TTg dated 25 November 2015 by the Prime Minister, approving the development strategy of renewable energy of Viet Nam by 2030 with a vision to 2050.
76 PathwaYs to low-Carbon develoPment For viet nam
Department of Energy dated 30 December 2014),36 and are linked to standards of the International Electrotechnical Commission. These standards could be improved by expanding coverage to all other electronic household appliances and industrial equipment. They could also be linked to those of a larger market, so as to reduce regulatory costs and promote trade links through market integration.
Transparent labeling of information on the energy-efficiency performance of energy-demanding equipment and appliances can help reinforce demand for efficient units. Viet Nam currently requires the labeling of appliances and equipment in specific types of products—including household appliances and transportation means (under 7-seater autos) before they are provided to the market.37 Household appliances include computer monitors, printers, photocopiers, air conditioners with frequency converters, and television receivers. The list could be expanded in the future to include more appliances and equipment.
Green building codes can require energy efficiency. Buildings represent an important and growing share of energy consumption, particularly for heating and/or cooling and lighting, and in this study, cooling is identified as a major source of emissions reduction. In Viet Nam, building codes cover energy-efficiency measures related to mandatory technical standards to achieve energy efficiency in the design, new construction, or retrofit of civil buildings (office buildings, hotels, hospitals, schools, commercial buildings, service buildings, apartment buildings, among others) with a gross floor area of 2,500 square meters or more. The requirements of this code apply to the building envelope, except envelopes of non-air-conditioned storage space or warehouses; and equipment and systems in the building, including interior lighting, ventilation and air conditioning,
36 Dispatch No. 1808/TCNL-KHCN dated 30 December 2014 of the Ministry of Industry and Trade, providing guidance on road map of energy labeling and application of the minimum energy efficiency.
37 By Decision No. 03/2013/QĐ-TTg dated 14 January 2013 of the Prime Minister, amending and supplementing a number of articles of the Prime Minister’s Decision No. 51/2011/QD-TTG of 12 September 2011, promulgating the list of devices and equipment subject to energy labeling and application of the minimum energy efficiency, and the implementation road map.
be done by completely eliminating subsidies and fully adopting market prices for electricity in Viet Nam.
A range of other regulatory and incentive measures can be an incentive toward greater efficiency. Current tax incentives for investments in energy efficiency include concessions on import taxes, export taxes, corporate income taxes, and land-use tax according to investments in energy-saving products, production chains, or technologies.33 These can be complemented by measures to improve information availability on efficient practices, particularly in industry, such as quality assured energy audits, energy performance benchmarking, and public reporting on energy efficiency performance. Such reporting can also enhance the transparency and effectiveness of fiscal measures.
Minimum energy performance standards (MEPS) can set ambitious efficiency targets through the application of enhanced mandatory standards that tighten over time. These standards can be applied to household consumer items as well as to industry. In Viet Nam, MEPS were applied from 1 January 2015.34 These MEPS cover compact fluorescent lamps, fluorescent lamps (tube type), electronic ballasts in fluorescent lamps, magnetic ballasts in fluorescent lamps, refrigerators, washing machines, rice cookers, electric fans, storage water heaters, TVs, air conditioners, computer screens, printers, photocopiers for the household sector and distribution transformers, electric motors, and boilers used in industrial factories. They are based on Viet Nam’s standards (according to Decision No. 78/2013/QĐ-TTg dated 25 December 201335 and Dispatch No. 1808/TCNL-KHCN of the General
33 According to Law No. 50/2010/QH12 of 17 June 2010, on the economical and efficient use of energy.
34 Decision No. 03/2013/QĐ-TTg dated 14 January 2013 of the Prime Minister, amending and supplementing a number of articles of the Prime Minister’s Decision No. 51/2011/QD-TTG of 12 September 2011, promulgating the list of devices and equipment subject to energy labeling and application of the minimum energy efficiency, and the implementation road map.
35 Decision No. 78/2013/QD-TTg dated 25 December 2013, promulgating the list of energy consumption vehicles, equipment for disposal and ban on construction of low-efficiency power plants.
77PoliCies to realiZe low-Carbon growth Potential
(i) 200 MtCO2e from technology improvement in private vehicles toward the European Union (EU) efficiency standards;
(ii) 180 MtCO2e from increased sales of electric two-wheelers;
(iii) 96 MtCO2e from increasing the use of biofuel; and
(iv) 76 MtCO2e from passenger modal shift from two-wheelers and cars to public transit.
Vehicle efficiency and emissions standards are an accessible low-cost mitigation policy option. Since private car ownership can be expected to grow from 500,000 in 2010 to 17.8 million in 2050 and as cars can often have a long useful life, it is imperative that those that enter the market are as efficient (and clean) as possible. In developed economies (including those with a high-end-user fuel cost, such as the EU), the efficiency or CO2 emissions regulations of fleets sold by manufacturers are important to improving average actual fuel efficiency. Emissions standards can be expanded to include clean fuel to be used in urban transportation. A 5% share of buses and 20% of taxis are targeted to use liquefied petroleum gas (LPG), compressed natural gas (CNG), or solar energy by 2020.39 These targets may be escalated over the longer term.
Fleet regulations to stipulate large shares of motorcycle sales play a similar role. This is especially important in Viet Nam given the prevalence of motorcycles in the overall vehicle mix. In the process, electric motorcycles are important to improving urban air quality and reducing noise pollution. Viet Nam has no target share of electric motorcycles in Transport Strategy 2020. Electric bicycles have been introduced to Viet Nam in recent years although they have not yet been as popular as motorcycles.
39 Decision No. 318/QD-TTg dated 4 March 2014 of the Prime Minister, approving the Strategy for Development of Transportation Services through 2020, and Orientations Toward 2030.
water heating, energy management equipment, and elevators and escalators.38 Those codes can be improved to promote efficiency through coverage of additional building types.
Markets for energy service companies can be improved. Energy service companies (ESCOs) help to provide energy solutions to energy consumers, and are paid on the basis of reductions in energy costs. As a result, they can play a key role in facilitating the adoption of technologies and other energy-efficiency measures such as those assessed in this study. At present, the number of ESCOs in Viet Nam is very limited and legal and policy frameworks are lacking specific regulations for this type of business. The market for ESCOs can be improved by stipulating a clear legal framework in which a market for them could thrive. Bidding for energy solutions should also be widely applied to find the best ESCO for energy consumers. Awareness raising and information distribution on the ESCO markets and services can be enhanced, as well.
9.4 Transportation Improvements Reduce Emissions while Generating Important Co- Benefits
Transport is an important area for mitigation attention, not only because mitigation potential is substantial, with 640 MtCO2e from 2010 to 2050, but because improved transport has many co- benefits. Without mitigation actions, emissions of particulate matter (PM) and nitrogen oxide (NOx) are projected to escalate rapidly, with negative effects on respiratory ailments and mortality. Although not quantified here in terms of benefits, modal shifts reduce congestion and transport times, while lower emissions technologies generally also lead to reduced pollution and health benefits.
Of the 10 different packages of measures considered, 544 MtCO2e of mitigation came from the following four measures:
38 According to Circular No. 15/2013/TT-BXD dated 26 September 2013 by the Ministry of Construction, promulgating the National Technical Regulation on Energy Efficiency Buildings (QCVN 09:2013/BXD).

78 PathwaYs to low-Carbon develoPment For viet nam
for charging. Modal shifts toward public transport will depend on appropriate urban planning practices. Increased use of biomass and biofuels for energy will require changes to agricultural practices, so that residues are collected. The responsibility for each of these aspects is presently spread among various line ministries in Viet Nam at the national level and among different levels of Government.
The low-carbon scenario of this study requires a closely coordinated approach to maximize intersectoral synergies and avoid tensions. Viet Nam has a long history of economy-wide assessment of green growth potential, although most quantitative assessments have not gone beyond 2030, when mitigation potential can be best realized over a longer period, as many investment decisions have emissions implications for several decades or more. This study helps to pioneer longer-range planning, but it is only a starting point. To execute the low-carbon scenario, intersectoral planning needs to be continued at a greater level of detail, and be continuously updated as new information becomes available.
This study has not modeled scenarios for emissions taxation or regulation of emissions. If such were in place, many of the mitigation responses quantified here would be naturally induced. Low marginal abatement costs for large amounts of mitigation imply that even low-carbon prices may imply large levels of emission reduction. At the same time, reducing investor risks and other barriers to green investment, investing in energy-efficient public infrastructure, ensuring sufficient intersectoral coordination, and facilitating technology deployment will remain important even where economy-wide emissions policies are adopted.
Biofuel blending mandates can be expanded in Viet Nam to help reduce emissions. Viet Nam is only introducing a 5% ethanol blending mandate for gasoline and has no mandate for diesel. Expanding this to 10% or more, as is common in other countries, can help to reduce emissions. Emissions reduction can be most meaningful over the fuel life cycle if the ethanol is produced via second generation biofuels that rely on agricultural residues.
Modal shifts are important to reduce emissions from private vehicles, and are likely to have greater effects than captured in this modeling, as not only are emissions avoided directly from passengers using more efficient modes, but congestion is reduced, such that emissions fall from remaining road transport. The study portrays a future in which half of all motorized passenger-kilometers are handled by mass transit, which is a very ambitious goal. To facilitate such a shift, policies are required to actively discourage car ownership and use within cities. This is best accomplished in the context of overall urban planning for efficient public transit, as well as integrated transport development that maximizes the convenience of public facilities. Ensuring shifts to public transit fundamentally depends upon mass transit being an attractive option for commuters, which in turn requires sufficient investment in public transit infrastructure.
9.5 Cross-Sector Planning is Needed to Realize Mitigation Potential
There is a complex array of interlinkages between and among the low-carbon options assessed in this study. For example, changes to the efficiency of electricity use affect the amount of electricity to be generated, and a large share of residential electricity use is shown to be driven by heating and cooling practices that may be conditioned by building codes. Adoption of electric vehicles will also increase demand for electricity at particular times
10. conclusIons
79
energy shares for much of the analytical period to this study. However, realizing the potential of renewable energy requires policies that can better leverage private sector investment.
Energy security is an important consideration, to which energy efficiency can make important contributions. The study shows a range of possible energy-efficiency measures that could be promoted through appropriate regulations, as well as measures such as labeling support to energy service companies and energy pricing, which create incentives for efficiency.
Measures for transportation contribute about 15% of mitigation, but may be much more socially important than this share suggests due to large co-benefits, especially for health. A number of transport options can be achieved through relatively simple regulatory changes, such as fleet sales requirements and blending mandates. Others, such as modal shifts, can be best implemented in the context of sound urban planning.
There are interaction effects between these low-carbon interventions and among the sectors in which they are implemented. For example, changes to energy demand from energy efficiency and transport measures affect the optimal power generation mix. Urban planning will condition the effectiveness of energy-efficiency measures related to building and transportation. This means that low-carbon development may be most effective if low-carbon and green growth considerations are included in all planning processes across sectors and ministries.
This study finds that specific low-carbon development options can allow Viet Nam’s greenhouse gas (GHG) emissions to peak
by 2035, rather than continually rise through 2050 and beyond. This leads to a reduction in energy emissions of up to 53% by 2050. In direct financial terms, all assessed options have negative to very low abatement costs. Although, in economic terms, there is some very minor initial cost, over the longer term, Viet Nam’s economy is found to benefit from a low-carbon growth scenario. Moreover, the poorest populations are found to benefit most.
Such mitigation meets the goals of the Viet Nam Green Growth Strategy (VGGS), and exceeds those of the Nationally Determined Contribution (NDC). As a result, ambitious mitigation is fully possible at negative to low cost to a greater extent than is reflected in key Government policies.
The power sector accounts for about two-thirds of the mitigation potential assessed. Falling costs for renewable energy allow renewable generation capacity to substitute for increasing reliance on expensive imported coal at negative to low cost. Viet Nam is rich in renewable energy resources, such as wind, solar, and hydro resources, and also has substantial biomass potential that can be exploited. Given that new and modern technologies for producing renewable energies have not yet been developed in Viet Nam on a large scale, renewable power expansion has particular potential at low cost. These results generally support the Viet Nam Renewable Energy Development Strategy (VREDS) approved in 2015, which has similar renewable
references*
80
Agentschap. 2011. Viet Nam – Sustainable Energy Sector: Energy Efficiency & Renewable Energy.
Audinet, P., B. Singh, D. T. Kexel, S. Suphachalasai, P. Makumbe, and K. Mayer. 2016. Exploring a Low-Carbon Development Path for Vietnam. Washington, DC: World Bank. http://documents.worldbank.org/curated/en/2016/01/25737504/exploring-low-carbon-development-path-vietnam.
Central Institute for Economic Management (CIEM) and University of Copenhagen. 2010. The Fisheries Sector in Vietnam: A Strategic Economic Analysis. http://www.ciem.org.vn/Portals/1/CIEM/Publications/2010/FishReportUoCCIEM.pdf.
Credit Suisse. 2012. Viet Nam Steel Industry Tour. https://doc.research-and-analytics.csfb.com/docView?language=ENG&source=ulg&format=PDF&document_id=986861261&serialid=5wNBUxJ4EdCNQEAXlhvdLva5DPwAmQp8X6cPmP4tY3k%3D.
Dervis, K., J. de Melo, and S. Robinson. 1982. General Equilibrium Models for Development Policy. Washington, DC: The International Bank for Reconstruction and Development.
Ernst & Young. Viet Nam Low Carbon Options Assessment. TA Final Report. Unpublished.
European Commission. 2014. EU Energy, Transport and GHG Emissions Trends to 2050: Reference Scenario 2013. http://ec.europa.eu/transport/media/publications/doc/trends-to-2050-update-2013.pdf.
European Environment Agency (EEA). Energy Efficiency and Energy Consumption in Industry. http://www.eea.europa.eu/data-and-maps/indicators/energy-efficiency-and-energy-consumption-6/assessment.
Expert Panel on Air Quality Standards (EPAQS). 1995. Expert Panel on Air Quality Standards – Particles. London: HMSO.
____ . 2001. Expert Panel on Air Quality Standards – Airborne Particles: What is the Appropriate Measurement on Which to Base a Standard? London: HMSO.
General Statistics Office. 2010. Result of the Viet Nam Household Living Standards Survey 2010. http://www.gso.gov.vn/default_en.aspx?tabid=515&idmid=5&ItemID=12426.
General Statistics Office of Viet Nam. 2008. Vietnam – Household Living Standard Survey – VHLSS 2008. http://www.ilo.org/surveydata/index.php/catalog/77.
* ADB recognizes “China” as the People’s Republic of China, “Vietnam” as Viet Nam, and “Hanoi” as Ha Noi.
81reFerenCes
Ginsburgh, V. and M. Keyzer. 1997. The Structure of Applied General Equilibrium Models. Cambridge, MA: MIT Press.
Government of the Socialist Republic of Vietnam. n. d. Vietnam’s Socio-Economic Development Strategy for the Period of 2011–2020. http://www.economica.vn/Portals/0/MauBieu/1d3f7ee0400e42152bdcaa439bf62686.pdf.
Government of the Socialist Republic of Vietnam. 2006. The Five Year Socio-Economic Development Plan 2006–2010. Ha Noi. http://siteresources.worldbank.org/INTPRS1/Resources/Vietnam_PRSP(July-2006).pdf.
Japan International Cooperation Agency (JICA). 2009. The Comprehensive Study on the Sustainable Development of Transport System in Viet Nam (VITRANSS-2). Ha Noi.
Kirby, P. n. d. Achieving an environmentally sustainable energy future for Viet Nam. http://kiengiangbiospherereserve.com.vn/project/uploads/doc/vietnam_sustainable_energy_future.pdf.
Kjellstrom, T., R. S. Kovats, S. J. Lloyd, T. Holt, and R. S. Tol. 2009. The Direct Impact of Climate Change on Regional Labor Productivity. Environmental and Occupational Health. 64(4): 217-226.
Kreft, S., D. Eckstein, and I. Melchior. 2016. Global Climate Risk Index 2017. Bonn: Germanwatch. https://germanwatch.org/en/download/16411.pdf.
Lofgren, H., R. L. Harris, and S. Robinson. 2002. A Standard Computable General Equilibrium (CGE) Model in GAMS. Washington, DC: International Food Policy Research Institute.
London School of Economics and Political Science and Grantham Research Institute on Climate Change and the Environment. The National Climate Change Strategy and the No: 2139/QD-TTg Decision on 1 December 2011, approving the National Climate Change Strategy. http://www.lse.ac.uk/GranthamInstitute/law/the-national-climate-change-strategy-and-the-no-2139qd-ttg-decision-on-approval-of-the-national-climate-change-strategy/.
Mark Ellis & Associates. 2012. Vietnam Energy Efficiency Standards and Labelling Program: Australian Government Support Project: Market Survey. http://www.industry.gov.au/Energy/InternationalEngagement/Documents/VEESL-Program-Australian-Government-Support-Project-Market-Survey-2012.pdf.
Ministry of Industry and Trade, Socialist Republic of Viet Nam. 2009. The Study on Master Plan for Energy Conservation and Effective Use in the Socialist Republic of Viet Nam. Final Report. Tokyo: JICA. http://open_jicareport.jica.go.jp/pdf/11972692.pdf.
Ministry of Natural Resource and Environment (MONRE). 2010. Viet Nam’s Second National Communication under the United Nations Framework Convention on Climate Change. Ha Noi. http://unfccc.int/resource/docs/natc/vnmnc02.pdf.
National Statistical Office Thailand. 2011. Statistics. Thailand Household Socio-Economic Survey 2009. http://catalog.ihsn.org/index.php/catalog/1486.
82 REFERENCES
Nelson, G. C., M. W. Rosegrant, A. Palazzo, I. Gray, C. Ingersoll, R. Robertson, S. Tokgoz, T. Zhu, T. B. Sulser, C. Ringler, S. Msangi, and L. You. 2010. Food Security, Farming, and Climate Change to 2050: Scenarios, Results, Policy Options. Washington, DC: International Food Policy Research Institute.
Nguyen, D.L. 2014. A Brief Overview on Assessments of Wind Energy Resource Potential in Vietnam. Journal of Fundamentals of Renewable Energy and Applications. 4:132. doi:10.4172/2090-4541.1000132.
Ntziachristos L., D. Gkatzoflias, C. Kouridis, and Z. Samaras. 2009. COPERT: A European Road Transport Emission Inventory Model. In: Athanasiadis I.N., Rizzoli A.E., Mitkas P.A., Gómez J.M. (eds) Information Technologies in Environmental Engineering. Berlin, Heidelberg: Springer.
Polo,J., A. Bernardos, A.A. Navarro, C.M. Fernandez-Peruchena, L. Ramírez, María V. Guisado, and S. Martínez. 2015. Solar resources and power potential mapping in Vietnam using satellite-derived and GIS-based information. Energy Conversion and Management. 98: 348-358.
Prime Minister of the Socialist Republic of Viet Nam. Approval of the National Green Growth Strategy on 25 September 2012. Ha Noi. https://www.giz.de/en/downloads/VietNam-GreenGrowth-Strategy.pdf.
Raitzer, D. A., F. Bosello, M. Tavoni, C. Orecchia, G. Marangoni, and J. N. G. Samson. 2015. Southeast Asia and the Economics of Global Climate Stabilization. Manila.
Rozenberg, J. and S. Hallegatte. 2016. Modeling the Impacts of climate Change on Future Vietnamese Households: A Micro-Simulation Approach. Policy Research Working Paper 7766. Washington, DC: World Bank.
Rutten, R., M. van Dijk, W. van Rooij, and H. Hilderink. 2014. Land Use Dynamics, Climate Change, and Food Security in Vietnam: A Global-to-local Modeling Approach. World Development. 59: 29-46. https://doi.org/10.1016/j.worlddev.2014.01.020.
Thu An. 2011. Cement Industry Strives to Reduce Energy Consumption. Ministry of Industry and Trade, National Energy Efficiency Programme. 5 May. http://vneec.gov.vn/tin-tuc/activity-news/t11224/cement-industry-strives-to-reduce-energy-consumption.html.
Trinh Qung Dung. 2010. Photovoltaic technology and solar energy development in Viet Nam. Tech Monitor. November–December 2009.
To Quoc Tru (director, Viet Nam Energy Consultancy Centre). Interview with Viet Nam News, 2010.
United Nations Development Programme–Migration Policy Institute (UNDP–MPI). Background Analysis of Marginal Abatement Costs for the Green Growth Strategy. Unpublished.
UNDP, Economic Committee of National Assembly, and Vietnam Academy of Social Science. 2011. Viet Nam Socio-Economic Development Plan for 2011–2015: The Mission of Restructuring the Economy and Implementation Solutions. Ha Noi. http://www.vn.undp.org/content/dam/vietnam/docs/Publications/kien%20nghi%20HT%20HCM-Eng.pdf.
UNDP. 2014. Green Grown and Fossil Fuel Fiscal Policies in Viet Nam: Recommendations on a Road Map for Policy Reform. Ha Noi.
83reFerenCes
United Nations Industrial Development Organization (UNIDO). 2010. Global Industrial Energy Efficiency Benchmarking: An Energy Policy Tool Working Paper. http://www.unido.org/fileadmin/user_media/Services/Energy_and_Climate_Change/Energy_Efficiency/Benchmarking_%20Energy_%20Policy_Tool.pdf.
United Nations Office for Disaster Risk Reduction (UNISDR). 2015. Making Development Sustainable: The Future of Disaster Risk Management. Global Assessment Report on Disaster Risk Reduction. Geneva, Switzerland.
Viet Nam Energy Online. http://nangluongvietnam.vn/news/vn/dien-hat-nhan-nang-luong-tai-tao/nang-luong-tai-tao/du-an-dien-mat-troi-se-duoc-huong-nhieu-co-che-uu-dai.html.
Viet Nam Energy Service Joint Stock Company. 2009. National Survey on Residential Electricity Use by Appliances. Ha Noi.
Vietnam Inland Waterways Administration. http://en.viwa.gov.vn/.
VietnamNet. Renewable energy’s difficult birth. http://en.baomoi.com/Info/Renewable-energys-difficult-birth/6/65287.epi.
VietnamNet. 2010. Energy challenges: Why not wave power too?. 11 November. http://english.Viet Namnet.vn/en/science-technology/1562/energy-challenges--why- not-wave-power-too-.html.
von Hippel, D., H. Dang Son, S. Qureshi, N. Quoc Khanh, N. Duc Cuong, J. Sawdon, N. Kim Dung, and M. Addison. 2013. Viet Nam Climate Change Mitigation Technical Working Paper for Energy and Transport. Draft prepared by NIRAS A/G, RCEE-NRAS, and ICEM under ADB TA-7779 (VIE). Ha Noi.
Wassmann, R., N.X. Hien, C.T. Hoanh, and T.P. Tuong. 2004. Sea Level Rise Affecting the Vietnamese Mekong Delta: Water Elevation in the Flood Season and Implications for Rice Production. Climatic Change. 66(1–2): 89–107.
World Bank. 2010. Potential for Climate Change Mitigation Opportunities in the Industry Sector in Viet Nam. Background Paper. http://www-wds.worldbank.org/external/default/WDSContentServer/WDSP/IB/2010/11/25/000333037_20101125033353/Rendered/PDF/581050WP0P11061round0report1June029.pdf.
World Bank. 2012. Well Begun, Not Yet Done: Vietnam’s Remarkable Progress on Poverty Reduction and the Emerging Challenges: 2012 Vietnam Poverty Assessment. Hanoi. http://www-wds.worldbank.org/external/default/WDSContentServer/WDSP/IB/2013/08/20/000445729_20130820124256/Rendered/PDF/749100REVISED00al000Eng000160802013.pdf.
Yu, B., T. Zhu, C. Breisinger, and N.M. Hai. 2010. Impacts of Climate Change on Agriculture and Policy Options for Adaptation: The Case of Vietnam. IFPRI Discussion Paper 01015. Washington, DC: International Food Policy Research Institute.
Zafar, S. 2015. Biomass Energy in Viet Nam. BioEnergy Consult. http://www.bioenergyconsult.com//?s=biomass+energy+viet+nam.
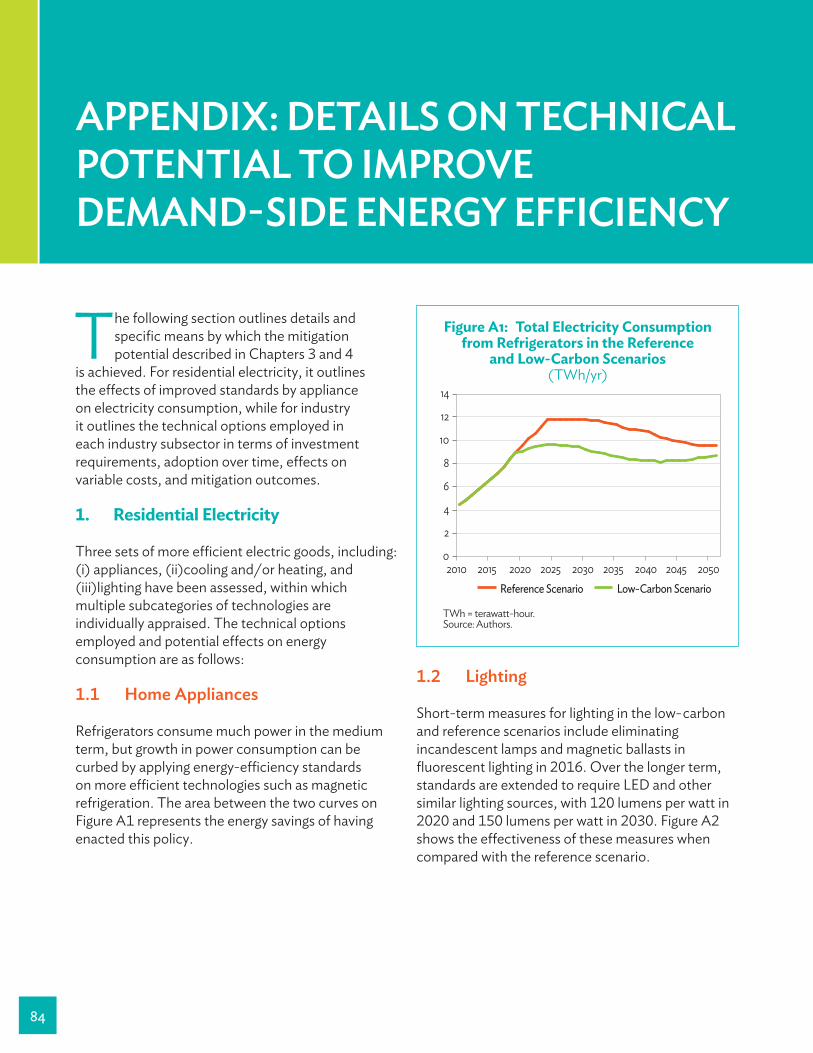
APPENDIX: DETAILS ON TECHNICAL POTENTIAL TO IMPROVE DEMAND- SIDE ENERGY EFFICIENCY
84
The following section outlines details and specific means by which the mitigation potential described in Chapters 3 and 4
is achieved. For residential electricity, it outlines the effects of improved standards by appliance on electricity consumption, while for industry it outlines the technical options employed in each industry subsector in terms of investment requirements, adoption over time, effects on variable costs, and mitigation outcomes.
1. Residential Electricity
Three sets of more efficient electric goods, including: (i) appliances, (ii)cooling and/or heating, and (iii)lighting have been assessed, within which multiple subcategories of technologies are individually appraised. The technical options employed and potential effects on energy consumption are as follows:
1.1 Home Appliances
Refrigerators consume much power in the medium term, but growth in power consumption can be curbed by applying energy-efficiency standards on more efficient technologies such as magnetic refrigeration. The area between the two curves on Figure A1 represents the energy savings of having enacted this policy.
1.2 Lighting
Short-term measures for lighting in the low- carbon and reference scenarios include eliminating incandescent lamps and magnetic ballasts in fluorescent lighting in 2016. Over the longer term, standards are extended to require LED and other similar lighting sources, with 120 lumens per watt in 2020 and 150 lumens per watt in 2030. Figure A2 shows the effectiveness of these measures when compared with the reference scenario.
TWh = terawatt-hour.Source: Authors.
Reference Scenario Low-Carbon Scenario
0
2
4
6
8
10
12
14
2010 2015 2020 2025 2030 2035 2040 2045 2050
Figure A1: Total Electricity Consumption from Refrigerators in the Reference
and Low-Carbon Scenarios (TWh/yr)
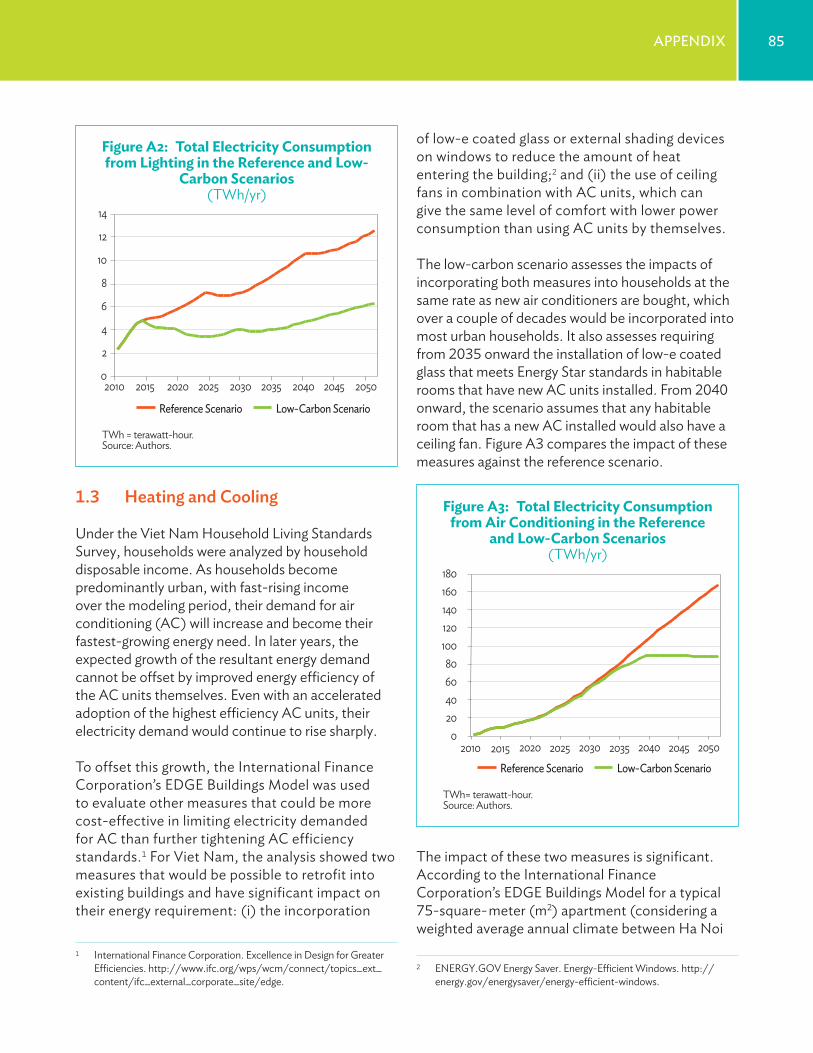
85Appendix
1.3 Heating and Cooling
Under the Viet Nam Household Living Standards Survey, households were analyzed by household disposable income. As households become predominantly urban, with fast-rising income over the modeling period, their demand for air conditioning (AC) will increase and become their fastest-growing energy need. In later years, the expected growth of the resultant energy demand cannot be offset by improved energy efficiency of the AC units themselves. Even with an accelerated adoption of the highest efficiency AC units, their electricity demand would continue to rise sharply.
To offset this growth, the International Finance Corporation’s EDGE Buildings Model was used to evaluate other measures that could be more cost-effective in limiting electricity demanded for AC than further tightening AC efficiency standards.1 For Viet Nam, the analysis showed two measures that would be possible to retrofit into existing buildings and have significant impact on their energy requirement: (i) the incorporation
1 International Finance Corporation. Excellence in Design for Greater Efficiencies. http://www.ifc.org/wps/wcm/connect/topics_ext_content/ifc_external_corporate_site/edge.
of low-e coated glass or external shading devices on windows to reduce the amount of heat entering the building;2 and (ii) the use of ceiling fans in combination with AC units, which can give the same level of comfort with lower power consumption than using AC units by themselves.
The low-carbon scenario assesses the impacts of incorporating both measures into households at the same rate as new air conditioners are bought, which over a couple of decades would be incorporated into most urban households. It also assesses requiring from 2035 onward the installation of low-e coated glass that meets Energy Star standards in habitable rooms that have new AC units installed. From 2040 onward, the scenario assumes that any habitable room that has a new AC installed would also have a ceiling fan. Figure A3 compares the impact of these measures against the reference scenario.
The impact of these two measures is significant. According to the International Finance Corporation’s EDGE Buildings Model for a typical 75-square- meter (m2) apartment (considering a weighted average annual climate between Ha Noi
2 ENERGY.GOV Energy Saver. Energy-Efficient Windows. http://energy.gov/energysaver/energy-efficient-windows.
TWh = terawatt-hour.Source: Authors.
Reference Scenario Low-Carbon Scenario
0
2
4
6
8
10
12
14
2010 2015 2020 2025 2030 2035 2040 2045 2050
Figure A2: Total Electricity Consumption from Lighting in the Reference and Low-
Carbon Scenarios (TWh/yr)
TWh= terawatt-hour.Source: Authors.
0 20 40 60 80
100 120 140 160 180
2010 2015 2020 2025 2030 2035 2040 2045 2050
Reference Scenario Low-Carbon Scenario
Figure A3: Total Electricity Consumption from Air Conditioning in the Reference
and Low-Carbon Scenarios (TWh/yr)
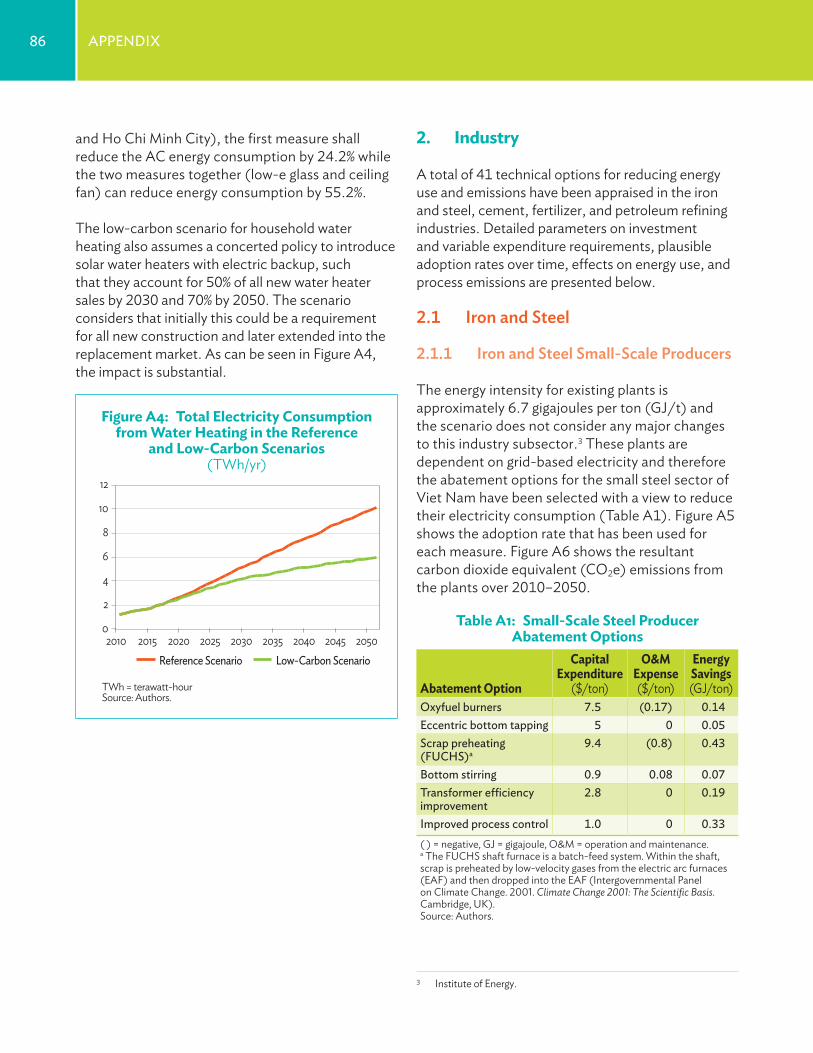
86 Appendix
and Ho Chi Minh City), the first measure shall reduce the AC energy consumption by 24.2% while the two measures together (low-e glass and ceiling fan) can reduce energy consumption by 55.2%.
The low-carbon scenario for household water heating also assumes a concerted policy to introduce solar water heaters with electric backup, such that they account for 50% of all new water heater sales by 2030 and 70% by 2050. The scenario considers that initially this could be a requirement for all new construction and later extended into the replacement market. As can be seen in Figure A4, the impact is substantial.
2. Industry
A total of 41 technical options for reducing energy use and emissions have been appraised in the iron and steel, cement, fertilizer, and petroleum refining industries. Detailed parameters on investment and variable expenditure requirements, plausible adoption rates over time, effects on energy use, and process emissions are presented below.
2.1 Iron and Steel
2.1.1 Iron and Steel Small-Scale Producers
The energy intensity for existing plants is approximately 6.7 gigajoules per ton (GJ/t) and the scenario does not consider any major changes to this industry subsector.3 These plants are dependent on grid-based electricity and therefore the abatement options for the small steel sector of Viet Nam have been selected with a view to reduce their electricity consumption (Table A1). Figure A5 shows the adoption rate that has been used for each measure. Figure A6 shows the resultant carbon dioxide equivalent (CO2e) emissions from the plants over 2010–2050.
Table A1: Small-Scale Steel Producer Abatement Options
Abatement Option
Capital Expenditure
($/ton)
O&M Expense($/ton)
Energy Savings(GJ/ton)
Oxyfuel burners 7.5 (0.17) 0.14eccentric bottom tapping 5 0 0.05Scrap preheating (FUCHS)a
9.4 (0.8) 0.43
Bottom stirring 0.9 0.08 0.07Transformer efficiency improvement
2.8 0 0.19
improved process control 1.0 0 0.33( ) = negative, GJ = gigajoule, O&M = operation and maintenance.a The FUCHS shaft furnace is a batch-feed system. Within the shaft, scrap is preheated by low-velocity gases from the electric arc furnaces (EAF) and then dropped into the EAF (Intergovernmental Panel on Climate Change. 2001. Climate Change 2001: The Scientific Basis. Cambridge, UK).Source: Authors.
3 Institute of Energy.
TWh = terawatt-hourSource: Authors.
Reference Scenario Low-Carbon Scenario
0
2
4
6
8
10
12
2010 2015 2020 2025 2030 2035 2040 2045 2050
Figure A4: Total Electricity Consumption from Water Heating in the Reference
and Low-Carbon Scenarios (TWh/yr)
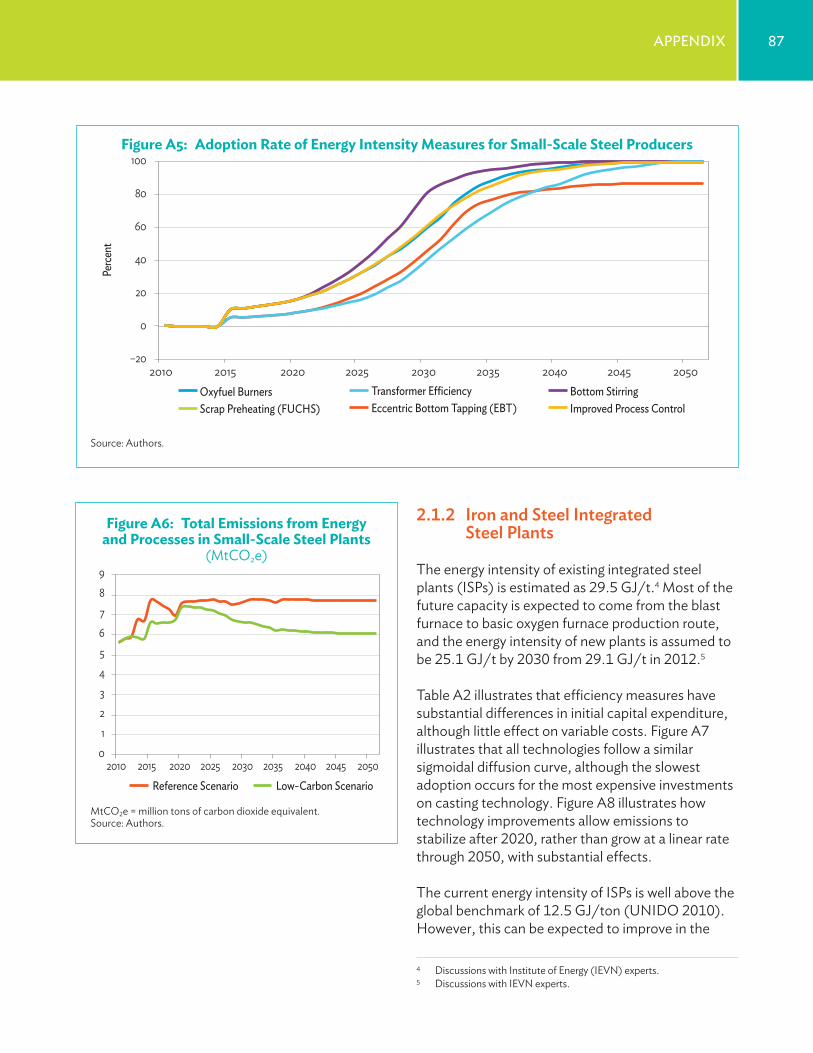
87Appendix
Reference Scenario Low-Carbon Scenario
0 1 2 3 4 5 6 7 8 9
2010 2015 2020 2025 2030 2035 2040 2045 2050
Perce
nt
–20
0
20
40
60
80
100
2010 2015 2020 2025 2030 2035 2040 2045 2050 Oxyfuel Burners
Eccentric Bottom Tapping (EBT) Scrap Preheating (FUCHS) Bottom Stirring Transformer Efficiency Improved Process Control
Figure A5: Adoption Rate of Energy Intensity Measures for Small-Scale Steel Producers
Source: Authors.
2.1.2 Iron and Steel Integrated Steel Plants
The energy intensity of existing integrated steel plants (ISPs) is estimated as 29.5 GJ/t.4 Most of the future capacity is expected to come from the blast furnace to basic oxygen furnace production route, and the energy intensity of new plants is assumed to be 25.1 GJ/t by 2030 from 29.1 GJ/t in 2012.5
Table A2 illustrates that efficiency measures have substantial differences in initial capital expenditure, although little effect on variable costs. Figure A7 illustrates that all technologies follow a similar sigmoidal diffusion curve, although the slowest adoption occurs for the most expensive investments on casting technology. Figure A8 illustrates how technology improvements allow emissions to stabilize after 2020, rather than grow at a linear rate through 2050, with substantial effects.
The current energy intensity of ISPs is well above the global benchmark of 12.5 GJ/ton (UNIDO 2010). However, this can be expected to improve in the
4 Discussions with Institute of Energy (IEVN) experts.5 Discussions with IEVN experts.
Figure A6: Total Emissions from Energy and Processes in Small-Scale Steel Plants
(MtCO2e)
MtCO2e = million tons of carbon dioxide equivalent.Source: Authors.
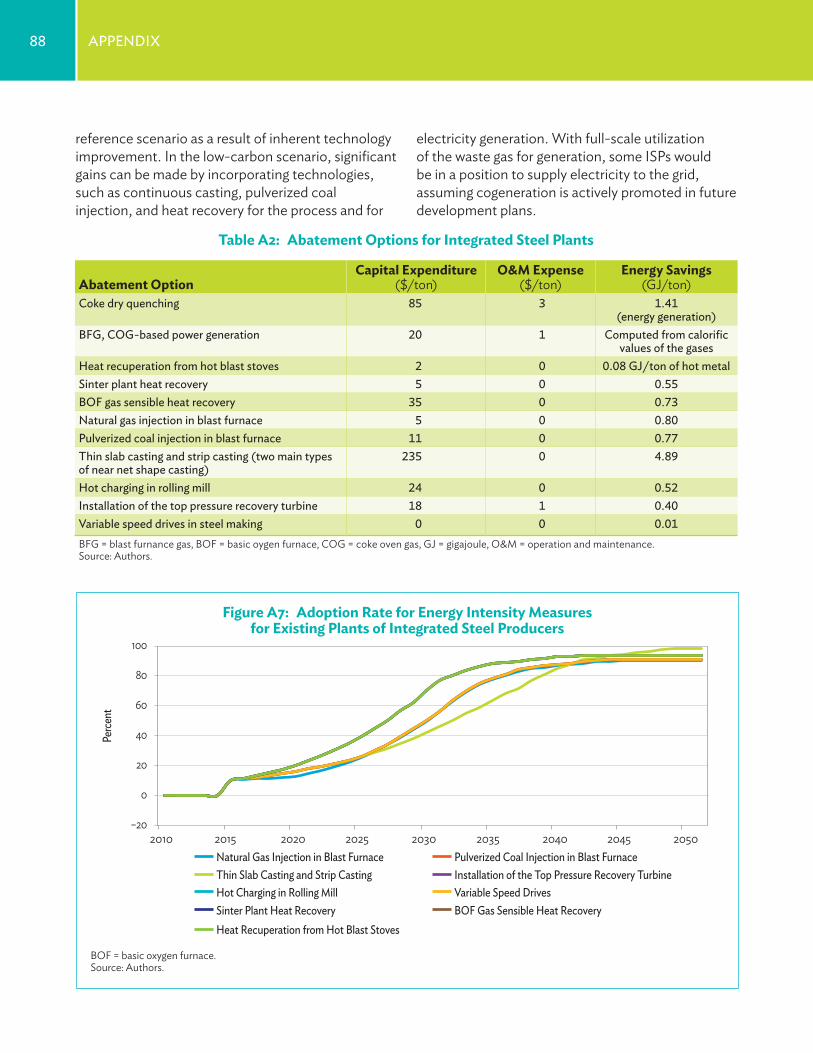
88 Appendix
Perce
nt
–20
0
20
40
60
80
100
2010 2015 2020 2025 2030 2035 2040 2045 2050 Natural Gas Injection in Blast Furnace Pulverized Coal Injection in Blast Furnace Thin Slab Casting and Strip Casting Installation of the Top Pressure Recovery Turbine Hot Charging in Rolling Mill Variable Speed Drives Sinter Plant Heat Recovery BOF Gas Sensible Heat Recovery Heat Recuperation from Hot Blast Stoves
reference scenario as a result of inherent technology improvement. In the low-carbon scenario, significant gains can be made by incorporating technologies, such as continuous casting, pulverized coal injection, and heat recovery for the process and for
Figure A7: Adoption Rate for Energy Intensity Measures for Existing Plants of Integrated Steel Producers
BOF = basic oxygen furnace.Source: Authors.
Table A2: Abatement Options for Integrated Steel Plants
Abatement OptionCapital Expenditure
($/ton)O&M Expense
($/ton)Energy Savings
(GJ/ton)Coke dry quenching 85 3 1.41
(energy generation)BFG, COG-based power generation 20 1 Computed from calorific
values of the gasesHeat recuperation from hot blast stoves 2 0 0.08 GJ/ton of hot metalSinter plant heat recovery 5 0 0.55BOF gas sensible heat recovery 35 0 0.73natural gas injection in blast furnace 5 0 0.80pulverized coal injection in blast furnace 11 0 0.77Thin slab casting and strip casting (two main types of near net shape casting)
235 0 4.89
Hot charging in rolling mill 24 0 0.52installation of the top pressure recovery turbine 18 1 0.40Variable speed drives in steel making 0 0 0.01BFG = blast furnance gas, BOF = basic oygen furnace, COG = coke oven gas, GJ = gigajoule, O&M = operation and maintenance.Source: Authors.
electricity generation. With full-scale utilization of the waste gas for generation, some ISPs would be in a position to supply electricity to the grid, assuming cogeneration is actively promoted in future development plans.
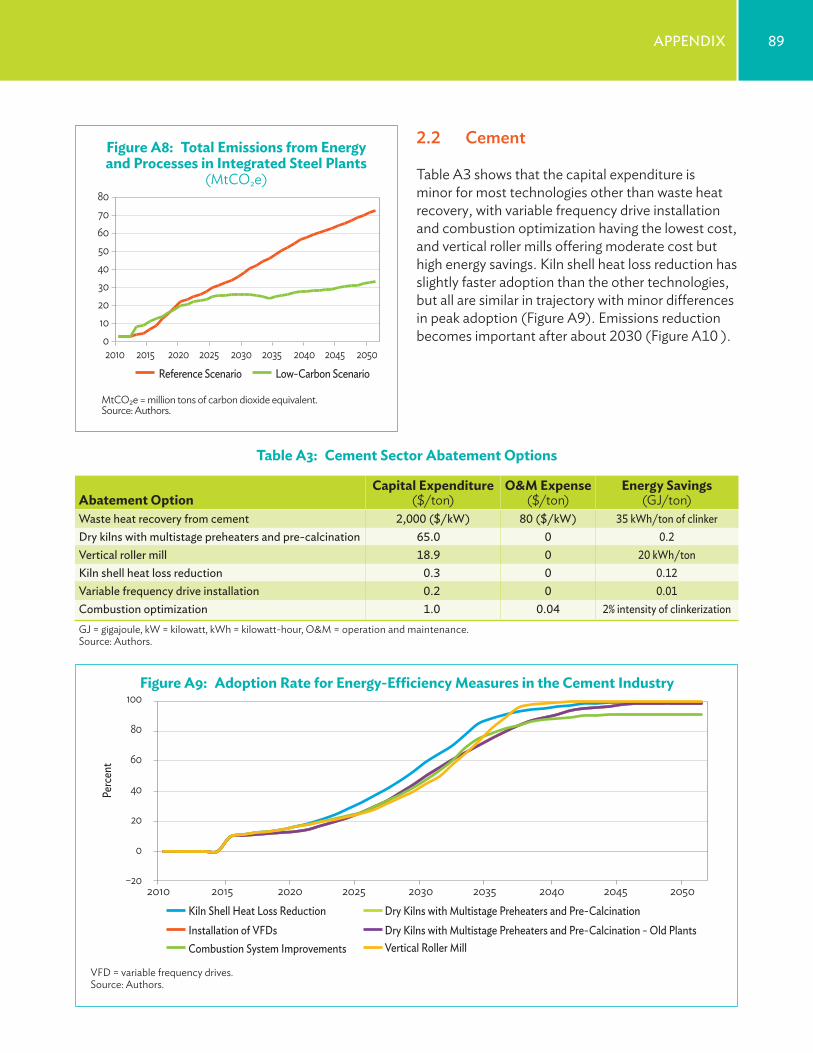
89Appendix
Perc
ent
–20
0
20
40
60
80
100
2010 2015 2020 2025 2030 2035 2040 2045 2050 Kiln Shell Heat Loss ReductionInstallation of VFDs
Dry Kilns with Multistage Preheaters and Pre-CalcinationDry Kilns with Multistage Preheaters and Pre-Calcination - Old Plants
Combustion System Improvements Vertical Roller Mill
MtCO2e = million tons of carbon dioxide equivalent.Source: Authors.
Reference Scenario Low-Carbon Scenario
0 10 20 30 40 50 60 70 80
2010 2015 2020 2025 2030 2035 2040 2045 2050
Figure A8: Total Emissions from Energy and Processes in Integrated Steel Plants
(MtCO2e)
Table A3: Cement Sector Abatement Options
Abatement OptionCapital Expenditure
($/ton)O&M Expense
($/ton)Energy Savings
(GJ/ton)Waste heat recovery from cement 2,000 ($/kW) 80 ($/kW) 35 kWh/ton of clinkerdry kilns with multistage preheaters and pre-calcination 65.0 0 0.2Vertical roller mill 18.9 0 20 kWh/tonKiln shell heat loss reduction 0.3 0 0.12Variable frequency drive installation 0.2 0 0.01Combustion optimization 1.0 0.04 2% intensity of clinkerizationGJ = gigajoule, kW = kilowatt, kWh = kilowatt-hour, O&M = operation and maintenance.Source: Authors.
2.2 Cement
Table A3 shows that the capital expenditure is minor for most technologies other than waste heat recovery, with variable frequency drive installation and combustion optimization having the lowest cost, and vertical roller mills offering moderate cost but high energy savings. Kiln shell heat loss reduction has slightly faster adoption than the other technologies, but all are similar in trajectory with minor differences in peak adoption (Figure A9). Emissions reduction becomes important after about 2030 (Figure A10 ).
Figure A9: Adoption Rate for Energy-Efficiency Measures in the Cement Industry
VFD = variable frequency drives.Source: Authors.
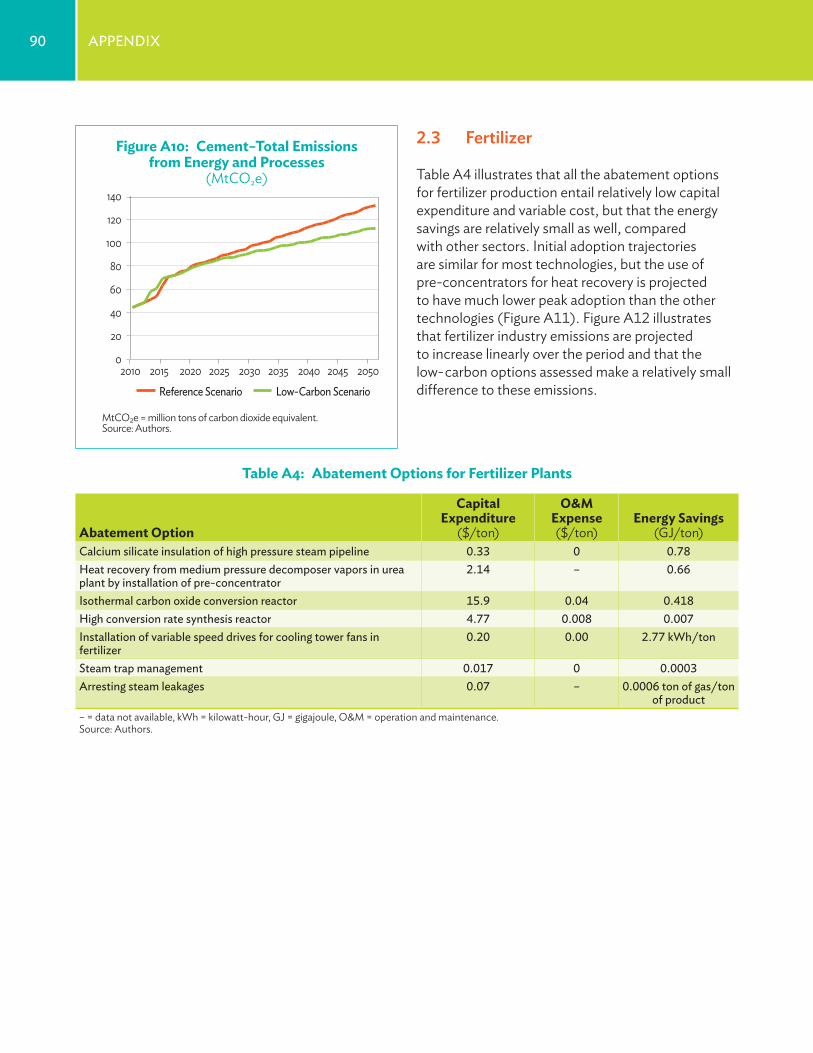
90 Appendix
2.3 Fertilizer
Table A4 illustrates that all the abatement options for fertilizer production entail relatively low capital expenditure and variable cost, but that the energy savings are relatively small as well, compared with other sectors. Initial adoption trajectories are similar for most technologies, but the use of pre-concentrators for heat recovery is projected to have much lower peak adoption than the other technologies (Figure A11). Figure A12 illustrates that fertilizer industry emissions are projected to increase linearly over the period and that the low- carbon options assessed make a relatively small difference to these emissions.
MtCO2e = million tons of carbon dioxide equivalent.Source: Authors.
Reference Scenario Low-Carbon Scenario
0
20
40
60
80
100
120
140
2010 2015 2020 2025 2030 2035 2040 2045 2050
Figure A10: Cement–Total Emissions from Energy and Processes
(MtCO2e)
Table A4: Abatement Options for Fertilizer Plants
Abatement Option
Capital Expenditure
($/ton)
O&M Expense ($/ton)
Energy Savings (GJ/ton)
Calcium silicate insulation of high pressure steam pipeline 0.33 0 0.78Heat recovery from medium pressure decomposer vapors in urea plant by installation of pre-concentrator
2.14 – 0.66
isothermal carbon oxide conversion reactor 15.9 0.04 0.418High conversion rate synthesis reactor 4.77 0.008 0.007installation of variable speed drives for cooling tower fans in fertilizer
0.20 0.00 2.77 kWh/ton
Steam trap management 0.017 0 0.0003Arresting steam leakages 0.07 – 0.0006 ton of gas/ton
of product– = data not available, kWh = kilowatt-hour, GJ = gigajoule, O&M = operation and maintenance.Source: Authors.
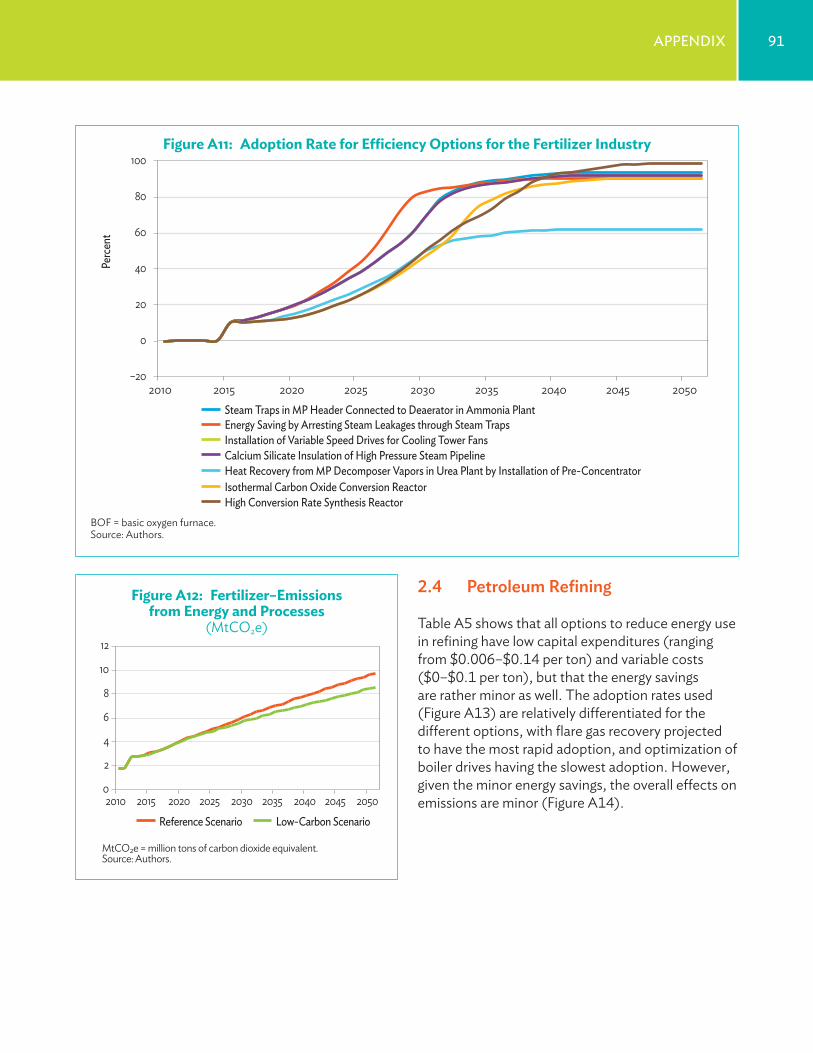
91Appendix
Perc
ent
–20
0
20
40
60
80
100
2010 2015 2020 2025 2030 2035 2040 2045 2050 Steam Traps in MP Header Connected to Deaerator in Ammonia PlantEnergy Saving by Arresting Steam Leakages through Steam TrapsInstallation of Variable Speed Drives for Cooling Tower FansCalcium Silicate Insulation of High Pressure Steam PipelineHeat Recovery from MP Decomposer Vapors in Urea Plant by Installation of Pre-ConcentratorIsothermal Carbon Oxide Conversion Reactor High Conversion Rate Synthesis Reactor
Figure A11: Adoption Rate for Efficiency Options for the Fertilizer Industry
BOF = basic oxygen furnace.Source: Authors.
MtCO2e = million tons of carbon dioxide equivalent.Source: Authors.
Reference Scenario Low-Carbon Scenario
0
2
4
6
8
10
12
2010 2015 2020 2025 2030 2035 2040 2045 2050
Figure A12: Fertilizer–Emissions from Energy and Processes
(MtCO2e)
2.4 Petroleum Refining
Table A5 shows that all options to reduce energy use in refining have low capital expenditures (ranging from $0.006–$0.14 per ton) and variable costs ($0–$0.1 per ton), but that the energy savings are rather minor as well. The adoption rates used (Figure A13) are relatively differentiated for the different options, with flare gas recovery projected to have the most rapid adoption, and optimization of boiler drives having the slowest adoption. However, given the minor energy savings, the overall effects on emissions are minor (Figure A14).
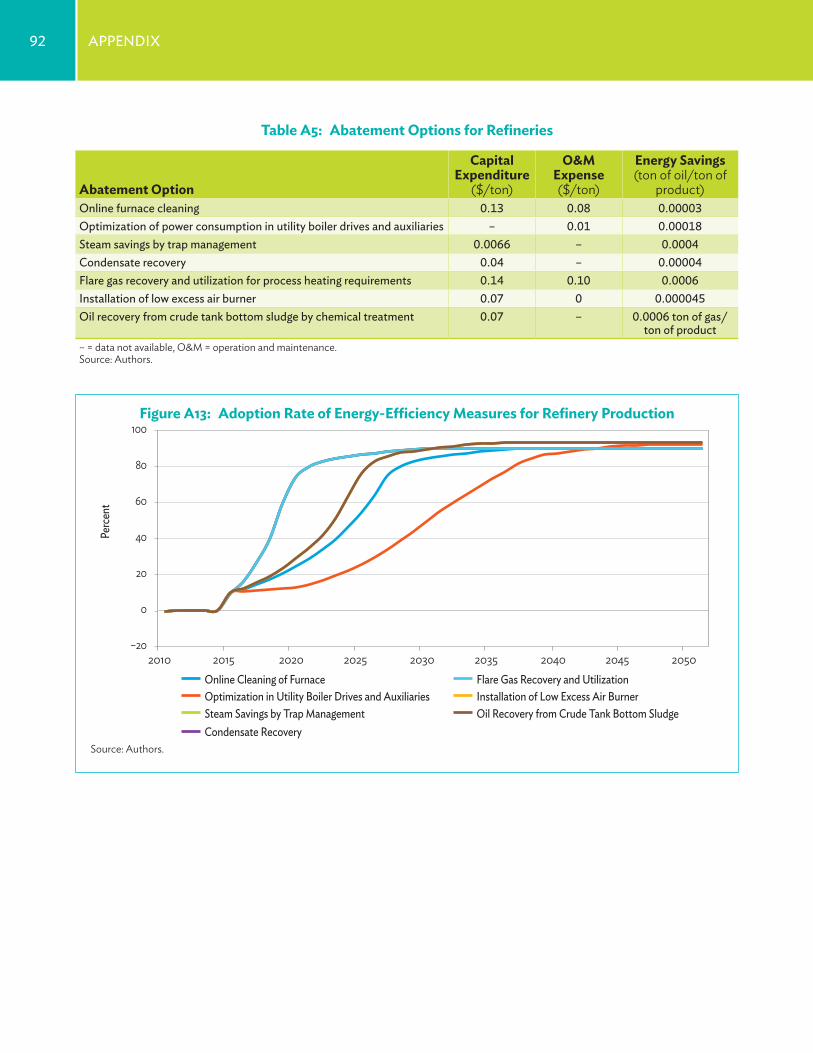
92 Appendix
Perc
ent
–20
0
20
40
60
80
100
2010 2015 2020 2025 2030 2035 2040 2045 2050 Online Cleaning of Furnace Optimization in Utility Boiler Drives and AuxiliariesSteam Savings by Trap Management Condensate Recovery
Flare Gas Recovery and Utilization Installation of Low Excess Air Burner Oil Recovery from Crude Tank Bottom Sludge
Table A5: Abatement Options for Refineries
Abatement Option
Capital Expenditure
($/ton)
O&M Expense ($/ton)
Energy Savings (ton of oil/ton of
product)Online furnace cleaning 0.13 0.08 0.00003Optimization of power consumption in utility boiler drives and auxiliaries – 0.01 0.00018Steam savings by trap management 0.0066 – 0.0004Condensate recovery 0.04 – 0.00004Flare gas recovery and utilization for process heating requirements 0.14 0.10 0.0006installation of low excess air burner 0.07 0 0.000045Oil recovery from crude tank bottom sludge by chemical treatment 0.07 – 0.0006 ton of gas/
ton of product– = data not available, O&M = operation and maintenance.Source: Authors.
Figure A13: Adoption Rate of Energy-Efficiency Measures for Refinery Production
Source: Authors.
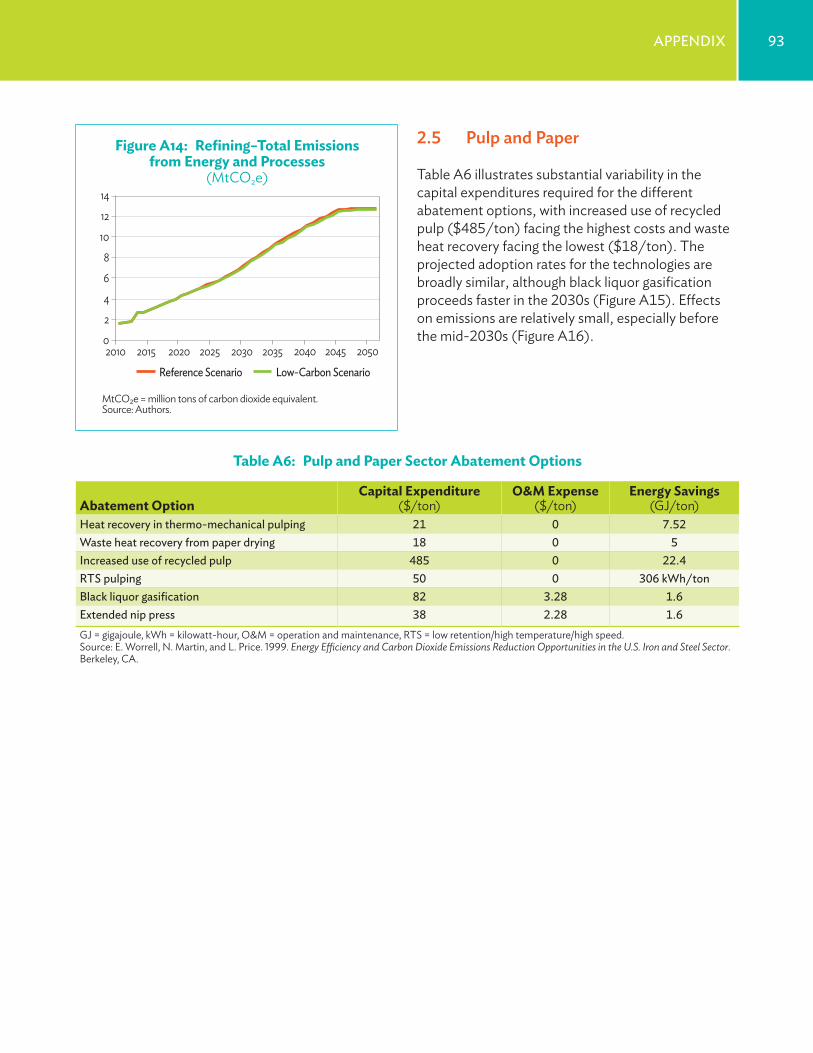
93Appendix
MtCO2e = million tons of carbon dioxide equivalent.Source: Authors.
Reference Scenario Low-Carbon Scenario
0
2
4
6
8
10
12
14
2010 2015 2020 2025 2030 2035 2040 2045 2050
Figure A14: Refining–Total Emissions from Energy and Processes
(MtCO2e)
2.5 Pulp and Paper
Table A6 illustrates substantial variability in the capital expenditures required for the different abatement options, with increased use of recycled pulp ($485/ton) facing the highest costs and waste heat recovery facing the lowest ($18/ton). The projected adoption rates for the technologies are broadly similar, although black liquor gasification proceeds faster in the 2030s (Figure A15). Effects on emissions are relatively small, especially before the mid-2030s (Figure A16).
Table A6: Pulp and Paper Sector Abatement Options
Abatement OptionCapital Expenditure
($/ton)O&M Expense
($/ton)Energy Savings
(GJ/ton)Heat recovery in thermo-mechanical pulping 21 0 7.52Waste heat recovery from paper drying 18 0 5increased use of recycled pulp 485 0 22.4RTS pulping 50 0 306 kWh/tonBlack liquor gasification 82 3.28 1.6extended nip press 38 2.28 1.6GJ = gigajoule, kWh = kilowatt-hour, O&M = operation and maintenance, RTS = low retention/high temperature/high speed.Source: E. Worrell, N. Martin, and L. Price. 1999. Energy Efficiency and Carbon Dioxide Emissions Reduction Opportunities in the U.S. Iron and Steel Sector. Berkeley, CA.
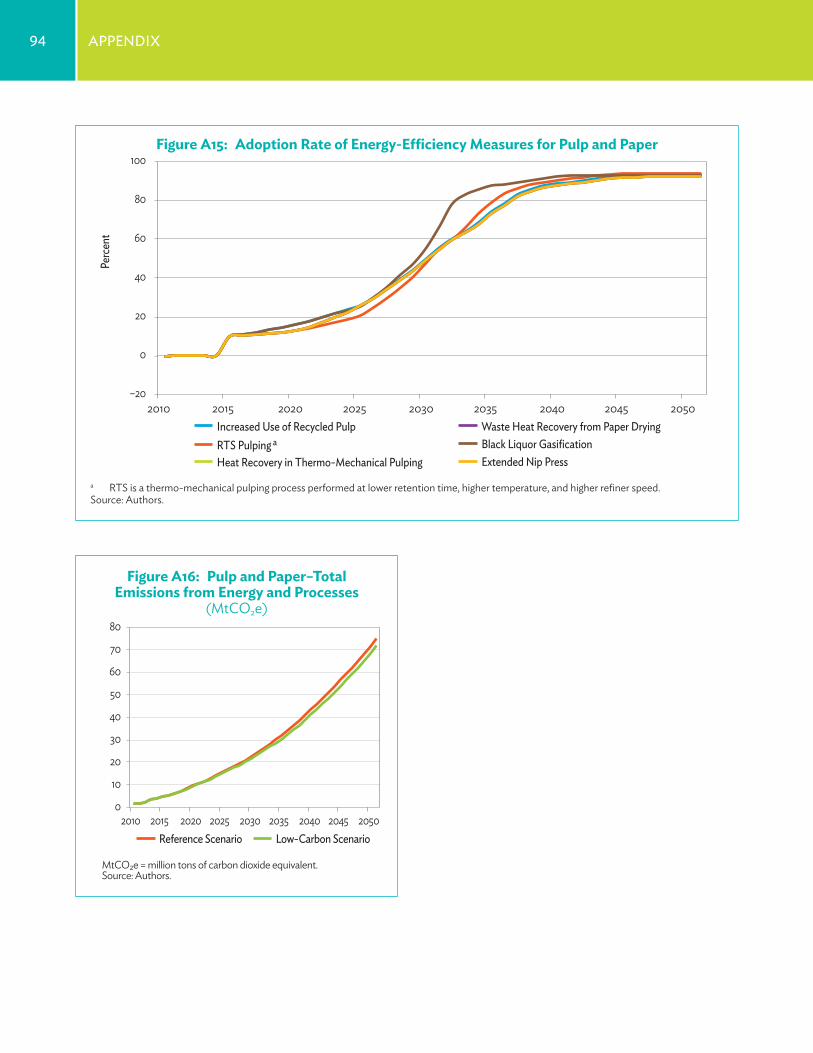
94 Appendix
MtCO2e = million tons of carbon dioxide equivalent.Source: Authors.
Reference Scenario Low-Carbon Scenario
0
10
20
30
40
50
60
70
80
2010 2015 2020 2025 2030 2035 2040 2045 2050
Perc
ent
–20
0
20
40
60
80
100
2010 2015 2020 2025 2030 2035 2040 2045 2050 Increased Use of Recycled Pulp RTS Pulping a Heat Recovery in Thermo-Mechanical Pulping
Waste Heat Recovery from Paper Drying Black Liquor Gasification Extended Nip Press
Figure A15: Adoption Rate of Energy-Efficiency Measures for Pulp and Paper
Figure A16: Pulp and Paper–Total Emissions from Energy and Processes
(MtCO2e)
a RTS is a thermo-mechanical pulping process performed at lower retention time, higher temperature, and higher refiner speed.Source: Authors.
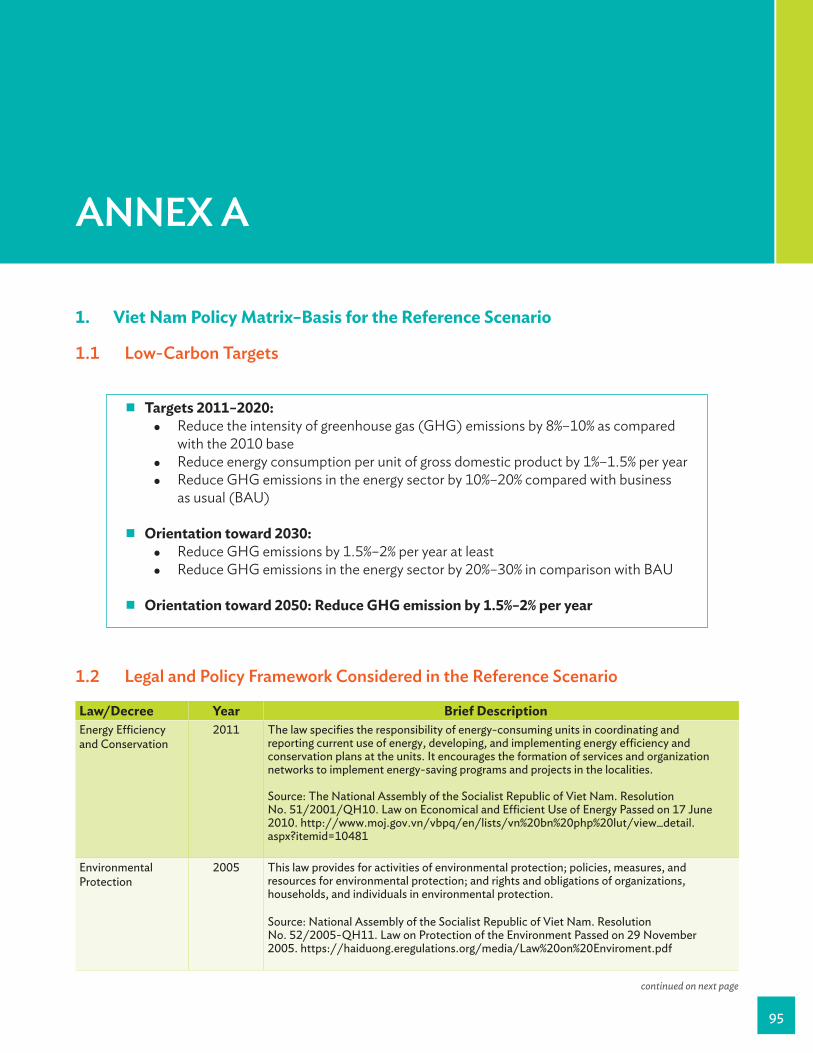
ANNEX A
95
1. Viet Nam Policy Matrix–Basis for the Reference Scenario
1.1 Low-Carbon Targets
1.2 Legal and Policy Framework Considered in the Reference Scenario
Law/Decree Year Brief Descriptionenergy efficiency and Conservation
2011 The law specifies the responsibility of energy-consuming units in coordinating and reporting current use of energy, developing, and implementing energy efficiency and conservation plans at the units. it encourages the formation of services and organization networks to implement energy-saving programs and projects in the localities.
Source: The national Assembly of the Socialist Republic of Viet nam. Resolution no. 51/2001/QH10. Law on economical and efficient Use of energy passed on 17 June 2010. http://www.moj.gov.vn/vbpq/en/lists/vn%20bn%20php%20lut/view_detail.aspx?itemid=10481
environmental protection
2005 This law provides for activities of environmental protection; policies, measures, and resources for environmental protection; and rights and obligations of organizations, households, and individuals in environmental protection.
Source: national Assembly of the Socialist Republic of Viet nam. Resolution no. 52/2005-QH11. Law on protection of the environment passed on 29 november 2005. https://haiduong.eregulations.org/media/Law%20on%20enviroment.pdf
ɂ Targets 2011–2020: • Reduce the intensity of greenhouse gas (GHG) emissions by 8%–10% as compared
with the 2010 base • Reduce energy consumption per unit of gross domestic product by 1%–1.5% per year • Reduce GHG emissions in the energy sector by 10%–20% compared with business
as usual (BAU)
ɂ Orientation toward 2030: • Reduce GHG emissions by 1.5%–2% per year at least • Reduce GHG emissions in the energy sector by 20%–30% in comparison with BAU
ɂ Orientation toward 2050: Reduce GHG emission by 1.5%–2% per year
continued on next page
96 Annex A
Law/Decree Year Brief Descriptionelectricity Law 2004 The law aims to stimulate development and diversify forms of investment in the electricity
sector, encourage economical use of electricity, protect the country’s electricity infrastructure, and develop a competitive electricity market.
Source: The national Assembly of the Socialist Republic of Viet nam. Resolution no. 28/2004/QH11. electricity Law passed on 3 december 2004. http://moj.gov.vn/vbpq/en/lists/vn%20bn%20php%20lut/view_detail.aspx?itemid=7325
Forest protection and development
2004, and amended
2012
The law provides for the management, development, and use of forests; and forest owners’ rights and obligations. This includes state rights over forests, owners’ rights, and prohibited acts. it also states that forest protection and development activities must ensure sustainable economic, social, environmental, defense, and security development; and be in line with the socioeconomic development strategy and forestry development strategy.
Source: national Assembly of the Socialist Republic of Viet nam. Resolution no. 29/2004/QH11. Law on Forest protection and development passed on 3 december 2004. http://theredddesk.org/sites/default/files/law_on_forest_protection_and_development_-_vietnam_2.pdf
petroleum Law Amended 2000
This law makes provisions for petroleum exploration and production activities carried out within the territory, the exclusive economic zone, and the continental shelf of Viet nam.
Source: national Assembly of the Socialist Republic of Vietnam. Resolution no. Law 19-2000-QH10. Amendment of and Addition to a number of Articles of the Law on petroleum passed on 9 June 2000. http://vietnamembassy-usa.org/vi/node/2077
1.3 Policy Arrangements and Instruments Underpinning the Reference ScenarioPolicy/Strategy Year Brief Descriptionnational Green Growth Strategy 2011–2020, with Vision to 2050
2012 The strategy sets out three targets, including restructuring and improving economic institutions toward greening existing industries, and encouraging industries that use energy and resources efficiently and produce high value-added products. it aims to improve research and the application of advanced technology in using natural resources, reducing greenhouse gas emissions, and effectively responding to climate change.
Source: prime Minister of the Socialist Republic of Viet nam. Approval of the national Green Growth Strategy on 25 September 2012. Ha noi. https://www.giz.de/en/downloads/Vietnam-GreenGrowth-Strategy.pdf
national Climate Change Strategy
2011 The strategy comprises 6 components with 10 strategic tasks to deal with climate change. it outlines overall objectives, priority projects to be implemented in 2011–2015, and plans for 2016–2025 as well as objectives for 2050, with a vision to 2100. it also identifies strategic tasks to cope with global climate change.
Source: London School of economics and political Science and Grantham Research institute on Climate Change and the environment. The national Climate Change Strategy and the no. 2139/Qd-TTg decision on 1 december 2011, approving the national Climate Change Strategy. http://www.lse.ac.uk/Granthaminstitute/law/the-national-climate-change-strategy-and-the-no-2139qd-ttg-decision-on-approval-of-the-national-climate-change-strategy/
continued on next page
Annex A1.2. continued
97Annex A
Policy/Strategy Year Brief Descriptionnational energy development Strategy for the period up to 2020 and Vision to 2050
2012 Overall, the strategy aims to assure national energy security, contributing to firmly maintaining security and defense and developing an independent and self-reliant economy; supply adequate high-quality energy for socioeconomic development; exploit and use domestic energy resources in a rational and efficient manner; diversify forms of investment and business in the energy domain and develop an energy market conducive to fair competition; boost the development of new and renewable energies, bio-energy, and nuclear power to meet the requirements of socioeconomic development, especially in deep-lying, remote, and border areas and offshore islands; and develop the energy sector quickly, efficiently, and sustainably in association with environmental protection.
Source: The prime Minister of the Socialist Republic of Viet nam. decision no. 1855/Qd-TTg of 27 december 2007, Approving Viet nam’s national energy development Strategy up to 2020, with 2050 Vision. http://www.asialeds.org/sites/default/files/resource/file/2007_LeG1855_pM_national%20energy%20development%20Strategy.pdf
national Strategy for environmental protection until 2010 and Vision toward 2020
2004 The strategy goals are to halt the acceleration of pollution, remedy degraded areas, and improve the environment quality and ensure sustainable development of the country; and guarantee that all people are entitled to live in the environment, landscapes, and other environmental components with the good quality of air, land, and water measuring up to standards stipulated by the State.
Source: Socialist Republic of Viet nam Government portal. decision no. 1216/QĐ-TTg of the prime Minister on 5 September 2012 to approve the national Strategy on environment protection to 2020, with Visions to 2030. http://www.chinhphu.vn/portal/page/portal/english/strategies/strategiesdetails?categoryid=30&articleid=10051159
national Strategy for development of electricity Sector, 2004–2010, and Vision toward 2020
2007 The strategy provides the main orientation for the development of electricity in 2004–2010, which includes hydro, atomic, and thermal electricity. it ensures that electricity quality is increased and prices are made competitive, focusing especially on electricity savings from transmission, distribution, and use phase; and promotes the development research of new and renewable energy to meet demand of electricity use, especially for islands and remote areas.
Source: Ministry of Justice. decision no. 176/2004/Qd-TTg of the prime Minister of the Socialist Republic of Viet nam on 5 October 2004 approving the Strategy on development of Vietnam electricity industry in the 2004–2010 period, with Orientations Towards 2020. http://moj.gov.vn/vbpq/en/lists/vn%20bn%20php%20lut/view_detail.aspx?itemid=7523
national Target program on efficient Use and Saving energy (eUSe), 2006
2006 The program aims to save 3%–5% of total national energy consumption in 2006–2010 and 5%–8% of total national energy consumption in 2011–2015. Source: London School of economics and political Science and Grantham Research institute on Climate Change and the environment. national Target program on efficient Use and Saving energy (eUSe), approved by decision no. 79/2006/QĐ-TTg of the prime Minister of the Socialist Republic of Viet nam. http://www.lse.ac.uk/Granthaminstitute/law/national-target-program-on-efficient-use-and-saving-energy-euse-approved-by-decision-792006qd-ttg/
national Forest development Strategy (nFdS) 2006–2020
2007 The nFdS 2006–2020 seeks to modernize forestry so that it plays its part in industrializing and modernizing rural agriculture, eradicating hunger, reducing poverty for people in mountainous areas, and protecting the environment. in relation to reducing emissions from deforestation and forest degradation, it is strongest on the need for clear ownership conditions for land and forest use so that they can receive the benefits from that transaction. it also discusses the enforcement of land laws, providing guidance on the responsibilities involved in this activity.
Source: prime Minister of the Socialist Republic of Viet nam. decision no. 18/2007 /QĐ-TTg TTg dated 5 February 2007, approving the Viet nam Forestry development Strategy 2006–2020. http://theredddesk.org/sites/default/files/viet_nam_forestry_development_strategy_2.pdf
Annex A1.3. continued
continued on next page
98 Annex A
Policy/Strategy Year Brief Descriptionnational Target program (nTp) in Response to Climate Change, 2008
2008 The nTp’s strategic objectives are to assess climate change impacts on sectors and regions in specific periods; develop feasible action plans to effectively respond to climate change in the short term and long term to ensure sustainable development of Viet nam; take opportunities to develop toward a low-carbon economy; and join the international community’s efforts in mitigating the effects of climate change. The nTp also sets targets on what should be achieved by 2010 and 2015, which include assessing the impact of climate change on Viet nam, identifying measures to combat climate change, and strengthening the capacity of organizations involved in responding to climate change.
Source: prime Minister of the Socialist Republic of Viet nam. decision no. 158/2008 /Qd-TTg dated 2 december 2008, approving the national Target program to respond to climate change. http://www.noccop.org.vn/data/vbpq/Airvariable_ldoc_49endecision%20158%20on%20approval%20of%20nTp.pdf
national Master plan for power development in 2011–2020, with considerations to the 2030 (power development plan-Vii) Viet nam Agenda 21
2011 The power development plan-Vii puts strong emphasis on energy security, energy efficiency, renewable energy development, and power market liberalization. it sets out high-level strategies for the national power development in four main areas: (i) development of power sources; (ii) development of the power transmission grid; (iii) interconnection of power networks with other regional countries; and (iv) electricity supply to rural, mountainous, and island areas.
Source: prime Minister of the Socialist Republic of Viet nam. decision no. 1208/Qd-TTg dated 21 July 2011, approving the national Master plan for power development for the 2011–2020 period with the Vision to 2030. http://www.nti.org/media/pdfs/Vietnampowerdevelopmentplan2030.pdf?_=1333146022
Annex A1.3. continued
99Annex A
continued on next page
1.4 Policy Matrix Underpinning the Reference Scenario
Sector Current Scenario/TargetsMedium-Term Policy Targets
(2020/2030 Scenario)Long-Term Policy Targets
(2050 Scenario)
A. Transport Revised National Strategy for Transportation until 2020, with vision to 2030. Decision of Prime Minister No. 335/QD-TTg dated 25 Feb. 2013
By 2020, the country’s transport system will meet diversified domestic demands for transportation with rapid growth, improved quality, and reasonable costs to control and reduce traffic accidents and limit environmental pollution. Overall, a national transport system will be formed, with different modes of transportation and principal transportation corridors for major and mass commodities.
By 2030, the national transport network and external traffic corridors will be improved. Transportation quality will reach international standards in smoothness, speed, safety, and rational connection among different modes of transportation, especially points for connecting long-distance passenger transit with passenger transportation in urban centers.
produce 5 billion liters per year of gasohol e10 and 500 million liters per year of biodiesel B10 by 2020 (this measure is included in the low-carbon scenario).
• By 2020, the transportation system to meet the societal needs. By 2050, complete the modernization of the domestic transportation network as well as the international transportation network.
• Accelerate the transformation to using compressed natural gas and liquefied gas in buses and taxis, with 20% of buses and taxis.
• Reduce 30% of carbon dioxide equivalent (CO2e) compared with 2005.
• Reduce air pollutant emissions (sulfur dioxide [SO2], nitrogen oxide [nOx], particulate matter [pM], and volatile organic carbon [VOC]):
i) reducing 80% of pM compared with 2005 in Ho Chi Minh City and Ha noi; and
ii) reducing 50% of SO2, nOx, and VOC compared with 2005 in Ha noi and Ho Chi Minh City.
• Apply the standard of emission from vehicles according to the following road map:
• eURO 2: 2007; eURO 3: 2009; and eURO 4: 2012.
• Reduce 20% of the noise volume from transport in urban areas to 65 dB compared with 2005.
Accelerate the transformation to using compressed natural gas and liquefied gas in buses and taxis, with 80% of buses and taxis by 2050.
100 Annex A
Sector Current Scenario/TargetsMedium-Term Policy Targets
(2020/2030 Scenario)Long-Term Policy Targets
(2050 Scenario)B. Energy/Power
B.1 PDP-VIIDecision No. 1208/QD-TTg (2011)
Gradually increase the rate of access to clean energy and electricity sources by local people in rural, mountainous, remote, and border areas as well as islands. Most of households shall have electricity in 2020 and access to modern, sustainable, and reliable energy services with reasonable electricity selling and/or energy prices in 2030.
provide adequate electricity for the domestic demand; electricity production and import will range from 194 billion to 210 billion kWh in 2015.
prioritize the development of renewable energy sources for electricity production, increasing the percentage of electricity produced from these energy sources from 3.5% of total electricity production in 2010.
Accelerate the program of electrification in rural and mountainous areas to ensure that in 2020 most of the rural households have access to electricity.
Reduce the electricity elasticity coefficient and Gdp from the current average of 2.0 to 1.5 by 2015 and 1.0 by 2020.
electricity price will be incrementally adjusted to achieve the long-term marginal cost of the electricity system by 2020, equivalent to $0.80–$0.90/kWh.
To widely implement, and increase the effectiveness of, the national target program on electricity conservation for saving 5%–8% of electricity by 2015 and 8%–10% of total electricity consumption by 2020.
electricity production and import will range from 330 billion to 362 billion kWh in 2020; and from 695 billion to 834 billion kWh in 2030.
In 2020: • Total capacity of power plants
will be about 75,000 MW, of which hydropower accounts for 23.1%, energy storage hydropower 2.4%, coal 48.0%, gas burn power 16.5% (of which LnG power accounts for 2.6%), renewable energy 5.6%, nuclear power 1.3%, and imported power for 3.1%.
• produced and imported electricity will be about 330 billion kWh in 2020 (hydropower 19.6%, coal 46.8%, natural gas thermal power 24.0% [including LnG 4.0 %]; renewable energy 4.5%, nuclear 2.1%, and imported power 3.0%).
Orientation to 2030: • The total power plant capacity
will be about 146,800 MW (hydropower 11.8%, energy storage hydropower 3.9%, coal thermal power 51.6%, gas-fired power 11.8% of which LnG is 4.1%, renewable energy 9.4%, nuclear power 6.6%, and imported power 4.9%).
• electricity output in 2030 will be 695 billion kWh; hydropower accounts for 9.3%, coal thermal 56.4%, natural gas thermal power 14.4% (including the use of LnG 3.9%), renewable energy 6.0%, nuclear power 10.1%; and imported power 3.8%.
Annex A1.4 continued
continued on next page
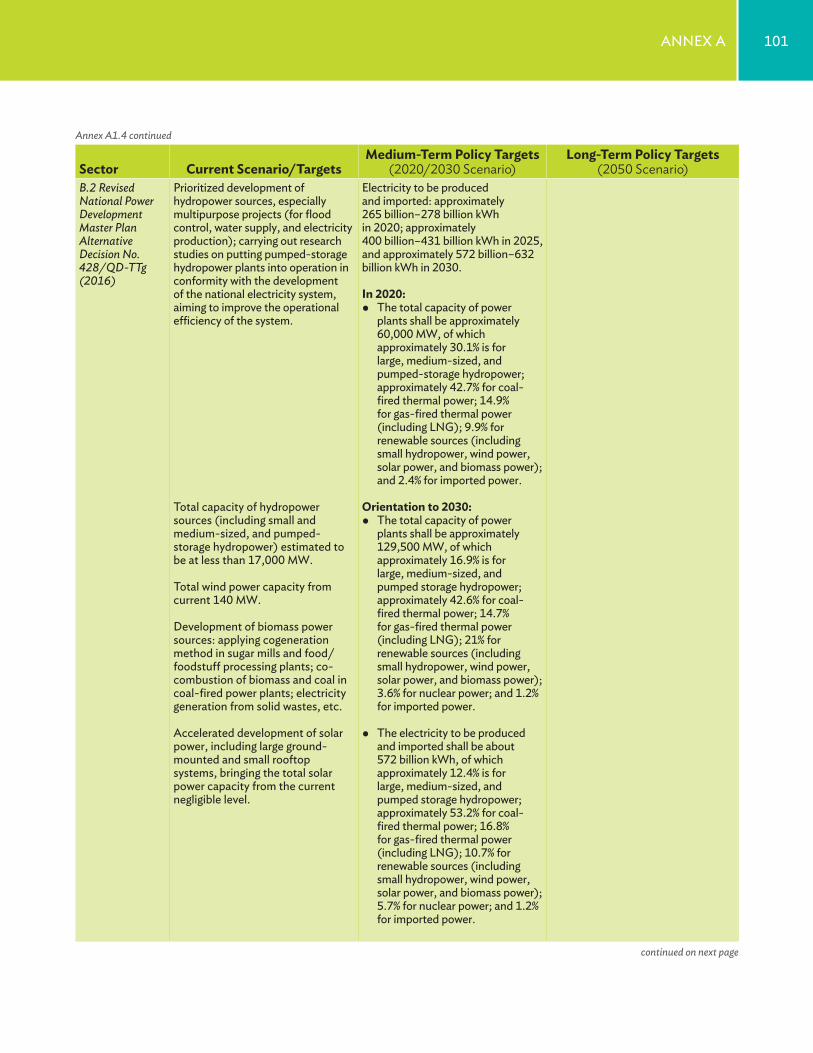
101Annex A
Sector Current Scenario/TargetsMedium-Term Policy Targets
(2020/2030 Scenario)Long-Term Policy Targets
(2050 Scenario)B.2 Revised National Power Development Master Plan Alternative Decision No. 428/QD-TTg (2016)
prioritized development of hydropower sources, especially multipurpose projects (for flood control, water supply, and electricity production); carrying out research studies on putting pumped-storage hydropower plants into operation in conformity with the development of the national electricity system, aiming to improve the operational efficiency of the system.
Total capacity of hydropower sources (including small and medium-sized, and pumped-storage hydropower) estimated to be at less than 17,000 MW.
Total wind power capacity from current 140 MW.
development of biomass power sources: applying cogeneration method in sugar mills and food/foodstuff processing plants; co-combustion of biomass and coal in coal-fired power plants; electricity generation from solid wastes, etc.
Accelerated development of solar power, including large ground-mounted and small rooftop systems, bringing the total solar power capacity from the current negligible level.
electricity to be produced and imported: approximately 265 billion–278 billion kWh in 2020; approximately 400 billion–431 billion kWh in 2025, and approximately 572 billion–632 billion kWh in 2030.
In 2020: • The total capacity of power
plants shall be approximately 60,000 MW, of which approximately 30.1% is for large, medium-sized, and pumped-storage hydropower; approximately 42.7% for coal-fired thermal power; 14.9% for gas-fired thermal power (including LnG); 9.9% for renewable sources (including small hydropower, wind power, solar power, and biomass power); and 2.4% for imported power.
Orientation to 2030: • The total capacity of power
plants shall be approximately 129,500 MW, of which approximately 16.9% is for large, medium-sized, and pumped storage hydropower; approximately 42.6% for coal-fired thermal power; 14.7% for gas-fired thermal power (including LnG); 21% for renewable sources (including small hydropower, wind power, solar power, and biomass power); 3.6% for nuclear power; and 1.2% for imported power.
• The electricity to be produced and imported shall be about 572 billion kWh, of which approximately 12.4% is for large, medium-sized, and pumped storage hydropower; approximately 53.2% for coal-fired thermal power; 16.8% for gas-fired thermal power (including LnG); 10.7% for renewable sources (including small hydropower, wind power, solar power, and biomass power); 5.7% for nuclear power; and 1.2% for imported power.
Annex A1.4 continued
continued on next page
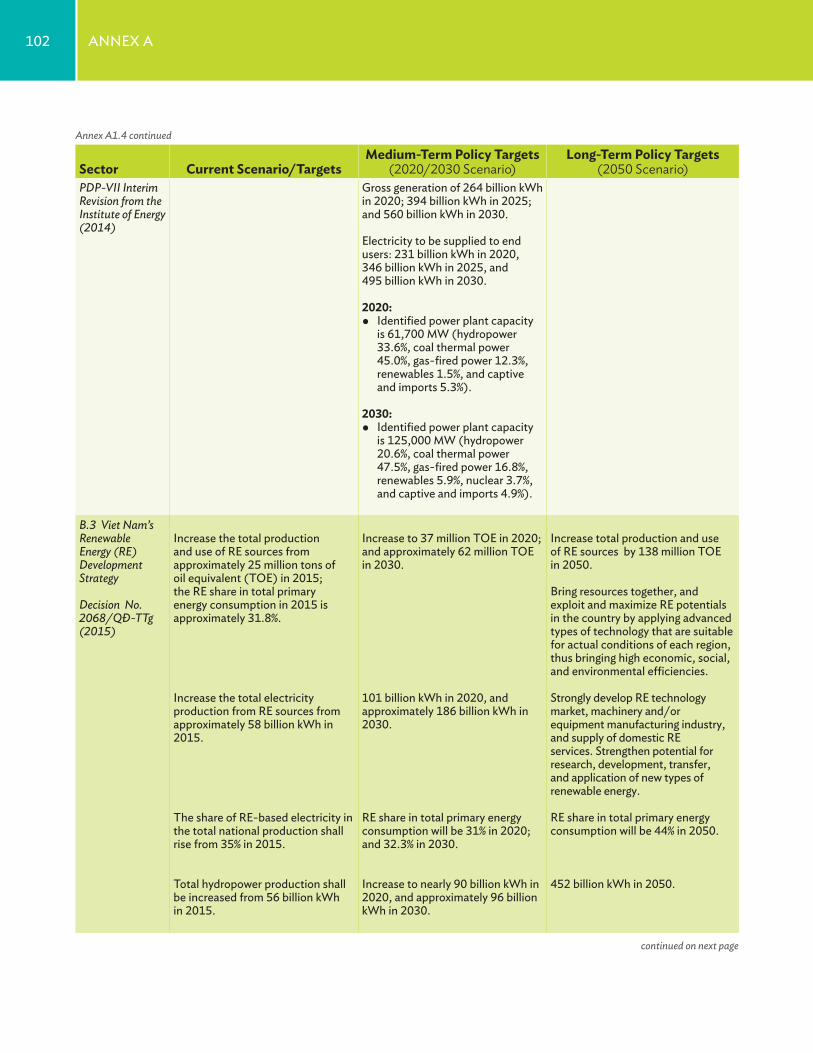
102 Annex A
Sector Current Scenario/TargetsMedium-Term Policy Targets
(2020/2030 Scenario)Long-Term Policy Targets
(2050 Scenario)PDP-VII Interim Revision from the Institute of Energy (2014)
Gross generation of 264 billion kWh in 2020; 394 billion kWh in 2025; and 560 billion kWh in 2030.
electricity to be supplied to end users: 231 billion kWh in 2020, 346 billion kWh in 2025, and 495 billion kWh in 2030.
2020: • identified power plant capacity
is 61,700 MW (hydropower 33.6%, coal thermal power 45.0%, gas-fired power 12.3%, renewables 1.5%, and captive and imports 5.3%).
2030: • identified power plant capacity
is 125,000 MW (hydropower 20.6%, coal thermal power 47.5%, gas-fired power 16.8%, renewables 5.9%, nuclear 3.7%, and captive and imports 4.9%).
B.3 Viet Nam’s Renewable Energy (RE) Development Strategy
Decision No. 2068/QĐ-TTg (2015)
increase the total production and use of Re sources from approximately 25 million tons of oil equivalent (TOe) in 2015; the Re share in total primary energy consumption in 2015 is approximately 31.8%.
increase the total electricity production from Re sources from approximately 58 billion kWh in 2015.
The share of Re-based electricity in the total national production shall rise from 35% in 2015.
Total hydropower production shall be increased from 56 billion kWh in 2015.
increase to 37 million TOe in 2020; and approximately 62 million TOe in 2030.
101 billion kWh in 2020, and approximately 186 billion kWh in 2030.
Re share in total primary energy consumption will be 31% in 2020; and 32.3% in 2030.
increase to nearly 90 billion kWh in 2020, and approximately 96 billion kWh in 2030.
increase total production and use of Re sources by 138 million TOe in 2050.
Bring resources together, and exploit and maximize Re potentials in the country by applying advanced types of technology that are suitable for actual conditions of each region, thus bringing high economic, social, and environmental efficiencies.
Strongly develop Re technology market, machinery and/or equipment manufacturing industry, and supply of domestic Re services. Strengthen potential for research, development, transfer, and application of new types of renewable energy.
Re share in total primary energy consumption will be 44% in 2050.
452 billion kWh in 2050.
Annex A1.4 continued
continued on next page
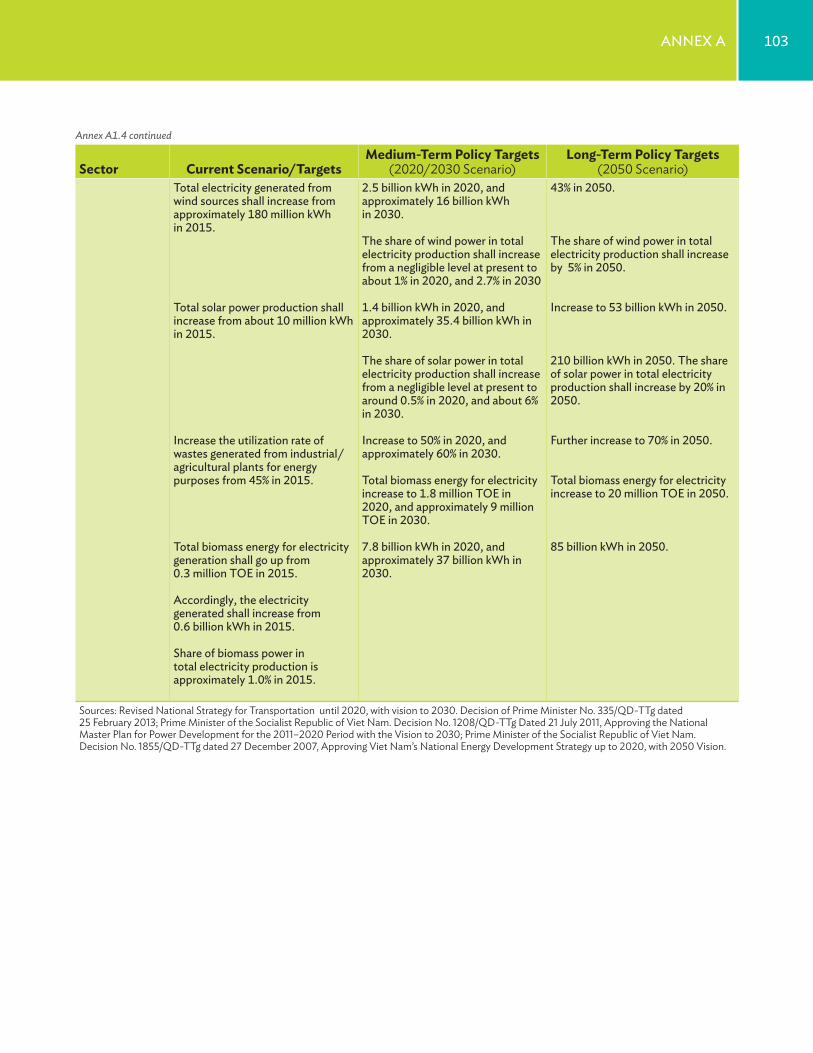
103Annex A
Sector Current Scenario/TargetsMedium-Term Policy Targets
(2020/2030 Scenario)Long-Term Policy Targets
(2050 Scenario)Total electricity generated from wind sources shall increase from approximately 180 million kWh in 2015.
Total solar power production shall increase from about 10 million kWh in 2015.
increase the utilization rate of wastes generated from industrial/agricultural plants for energy purposes from 45% in 2015.
Total biomass energy for electricity generation shall go up from 0.3 million TOe in 2015.
Accordingly, the electricity generated shall increase from 0.6 billion kWh in 2015.
Share of biomass power in total electricity production is approximately 1.0% in 2015.
2.5 billion kWh in 2020, and approximately 16 billion kWh in 2030.
The share of wind power in total electricity production shall increase from a negligible level at present to about 1% in 2020, and 2.7% in 2030
1.4 billion kWh in 2020, and approximately 35.4 billion kWh in 2030.
The share of solar power in total electricity production shall increase from a negligible level at present to around 0.5% in 2020, and about 6% in 2030.
increase to 50% in 2020, and approximately 60% in 2030.
Total biomass energy for electricity increase to 1.8 million TOe in 2020, and approximately 9 million TOe in 2030.
7.8 billion kWh in 2020, and approximately 37 billion kWh in 2030.
43% in 2050.
The share of wind power in total electricity production shall increase by 5% in 2050.
increase to 53 billion kWh in 2050.
210 billion kWh in 2050. The share of solar power in total electricity production shall increase by 20% in 2050.
Further increase to 70% in 2050.
Total biomass energy for electricity increase to 20 million TOe in 2050.
85 billion kWh in 2050.
Sources: Revised National Strategy for Transportation until 2020, with vision to 2030. Decision of Prime Minister No. 335/QD-TTg dated 25 February 2013; Prime Minister of the Socialist Republic of Viet Nam. Decision No. 1208/QD-TTg Dated 21 July 2011, Approving the National Master Plan for Power Development for the 2011–2020 Period with the Vision to 2030; Prime Minister of the Socialist Republic of Viet Nam. Decision No. 1855/QD-TTg dated 27 December 2007, Approving Viet Nam’s National Energy Development Strategy up to 2020, with 2050 Vision.
Annex A1.4 continued
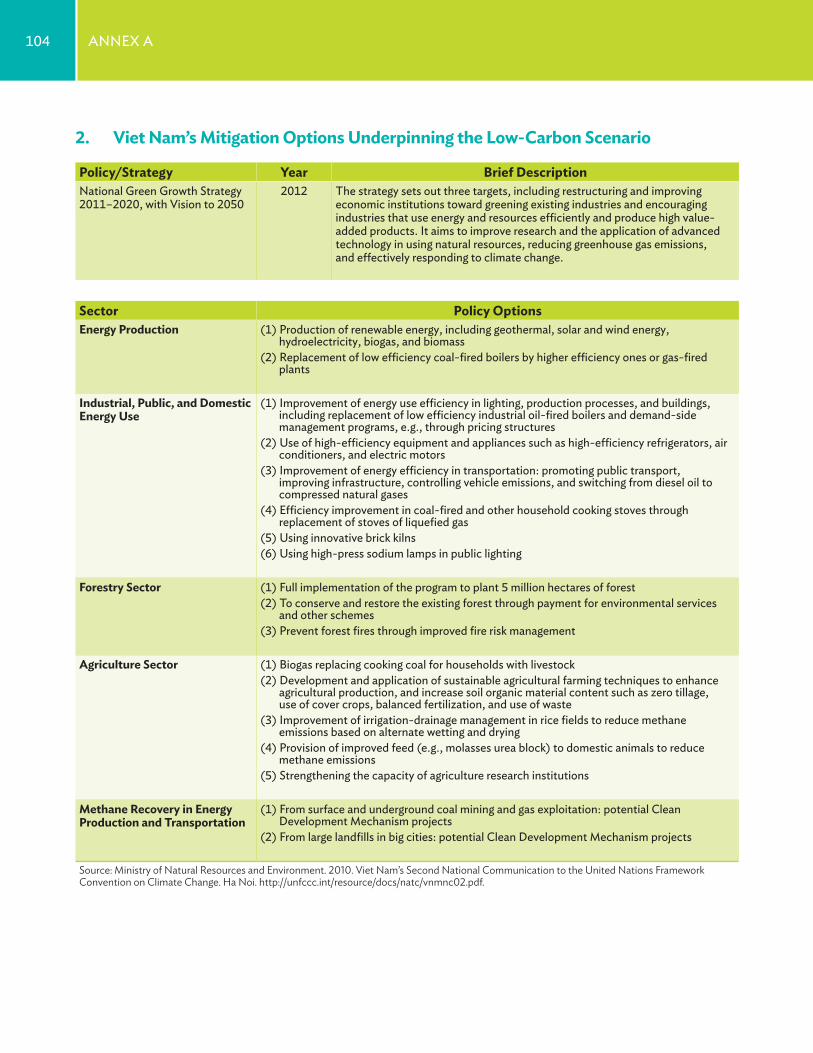
104 Annex A
2. Viet Nam’s Mitigation Options Underpinning the Low-Carbon Scenario
Policy/Strategy Year Brief Descriptionnational Green Growth Strategy 2011–2020, with Vision to 2050
2012 The strategy sets out three targets, including restructuring and improving economic institutions toward greening existing industries and encouraging industries that use energy and resources efficiently and produce high value-added products. it aims to improve research and the application of advanced technology in using natural resources, reducing greenhouse gas emissions, and effectively responding to climate change.
Sector Policy OptionsEnergy Production (1) production of renewable energy, including geothermal, solar and wind energy,
hydroelectricity, biogas, and biomass (2) Replacement of low efficiency coal-fired boilers by higher efficiency ones or gas-fired
plants
Industrial, Public, and Domestic Energy Use
(1) improvement of energy use efficiency in lighting, production processes, and buildings, including replacement of low efficiency industrial oil-fired boilers and demand-side management programs, e.g., through pricing structures
(2) Use of high-efficiency equipment and appliances such as high-efficiency refrigerators, air conditioners, and electric motors
(3) improvement of energy efficiency in transportation: promoting public transport, improving infrastructure, controlling vehicle emissions, and switching from diesel oil to compressed natural gases
(4) efficiency improvement in coal-fired and other household cooking stoves through replacement of stoves of liquefied gas
(5) Using innovative brick kilns (6) Using high-press sodium lamps in public lighting
Forestry Sector (1) Full implementation of the program to plant 5 million hectares of forest (2) To conserve and restore the existing forest through payment for environmental services
and other schemes (3) prevent forest fires through improved fire risk management
Agriculture Sector (1) Biogas replacing cooking coal for households with livestock (2) development and application of sustainable agricultural farming techniques to enhance
agricultural production, and increase soil organic material content such as zero tillage, use of cover crops, balanced fertilization, and use of waste
(3) improvement of irrigation-drainage management in rice fields to reduce methane emissions based on alternate wetting and drying
(4) provision of improved feed (e.g., molasses urea block) to domestic animals to reduce methane emissions
(5) Strengthening the capacity of agriculture research institutions
Methane Recovery in Energy Production and Transportation
(1) From surface and underground coal mining and gas exploitation: potential Clean development Mechanism projects
(2) From large landfills in big cities: potential Clean development Mechanism projects
Source: Ministry of Natural Resources and Environment. 2010. Viet Nam’s Second National Communication to the United Nations Framework Convention on Climate Change. Ha Noi. http://unfccc.int/resource/docs/natc/vnmnc02.pdf.
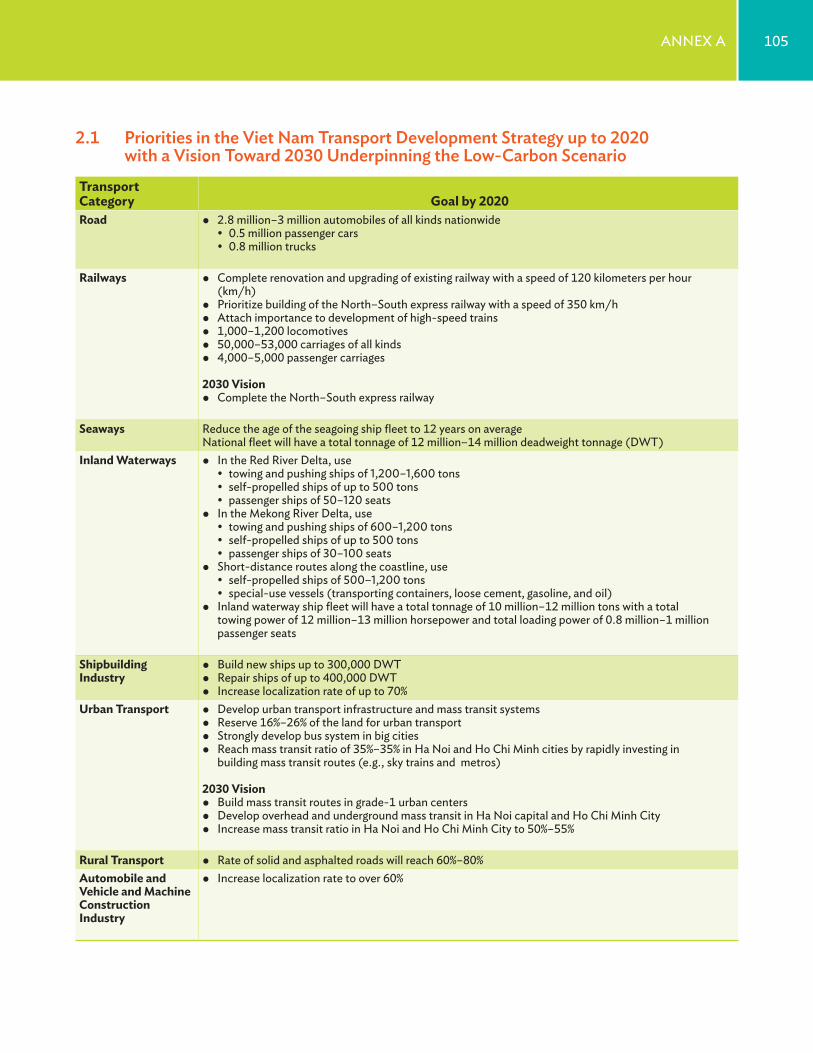
105Annex A
2.1 Priorities in the Viet Nam Transport Development Strategy up to 2020 with a Vision Toward 2030 Underpinning the Low-Carbon Scenario
Transport Category Goal by 2020Road • 2.8 million–3 million automobiles of all kinds nationwide
• 0.5 million passenger cars • 0.8 million trucks
Railways • Complete renovation and upgrading of existing railway with a speed of 120 kilometers per hour (km/h)
• prioritize building of the north–South express railway with a speed of 350 km/h • Attach importance to development of high-speed trains • 1,000–1,200 locomotives • 50,000–53,000 carriages of all kinds • 4,000–5,000 passenger carriages
2030 Vision • Complete the north–South express railway
Seaways Reduce the age of the seagoing ship fleet to 12 years on averagenational fleet will have a total tonnage of 12 million–14 million deadweight tonnage (dWT)
Inland Waterways • in the Red River delta, use • towing and pushing ships of 1,200–1,600 tons • self-propelled ships of up to 500 tons • passenger ships of 50–120 seats
• in the Mekong River delta, use • towing and pushing ships of 600–1,200 tons • self-propelled ships of up to 500 tons • passenger ships of 30–100 seats
• Short-distance routes along the coastline, use • self-propelled ships of 500–1,200 tons • special-use vessels (transporting containers, loose cement, gasoline, and oil)
• inland waterway ship fleet will have a total tonnage of 10 million–12 million tons with a total towing power of 12 million–13 million horsepower and total loading power of 0.8 million–1 million passenger seats
Shipbuilding Industry
• Build new ships up to 300,000 dWT • Repair ships of up to 400,000 dWT • increase localization rate of up to 70%
Urban Transport • develop urban transport infrastructure and mass transit systems • Reserve 16%–26% of the land for urban transport • Strongly develop bus system in big cities • Reach mass transit ratio of 35%–35% in Ha noi and Ho Chi Minh cities by rapidly investing in
building mass transit routes (e.g., sky trains and metros)
2030 Vision • Build mass transit routes in grade-1 urban centers • develop overhead and underground mass transit in Ha noi capital and Ho Chi Minh City • increase mass transit ratio in Ha noi and Ho Chi Minh City to 50%–55%
Rural Transport • Rate of solid and asphalted roads will reach 60%–80%Automobile and Vehicle and Machine Construction Industry
• increase localization rate to over 60%
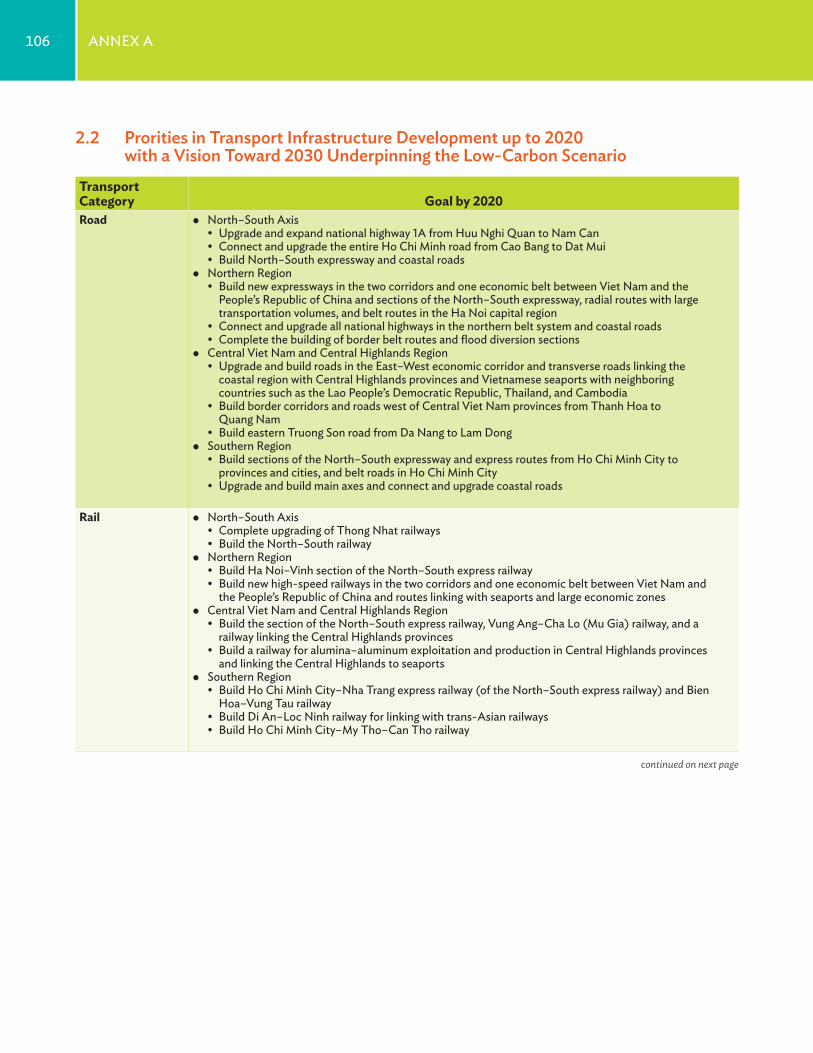
106 Annex A
2.2 Prorities in Transport Infrastructure Development up to 2020 with a Vision Toward 2030 Underpinning the Low-Carbon Scenario
Transport Category Goal by 2020Road • north–South Axis
• Upgrade and expand national highway 1A from Huu nghi Quan to nam Can • Connect and upgrade the entire Ho Chi Minh road from Cao Bang to dat Mui • Build north–South expressway and coastal roads
• northern Region • Build new expressways in the two corridors and one economic belt between Viet nam and the
people’s Republic of China and sections of the north–South expressway, radial routes with large transportation volumes, and belt routes in the Ha noi capital region
• Connect and upgrade all national highways in the northern belt system and coastal roads • Complete the building of border belt routes and flood diversion sections
• Central Viet nam and Central Highlands Region • Upgrade and build roads in the east–West economic corridor and transverse roads linking the
coastal region with Central Highlands provinces and Vietnamese seaports with neighboring countries such as the Lao people’s democratic Republic, Thailand, and Cambodia
• Build border corridors and roads west of Central Viet nam provinces from Thanh Hoa to Quang nam
• Build eastern Truong Son road from da nang to Lam dong • Southern Region
• Build sections of the north–South expressway and express routes from Ho Chi Minh City to provinces and cities, and belt roads in Ho Chi Minh City
• Upgrade and build main axes and connect and upgrade coastal roads
Rail • north–South Axis • Complete upgrading of Thong nhat railways • Build the north–South railway
• northern Region • Build Ha noi–Vinh section of the north–South express railway • Build new high-speed railways in the two corridors and one economic belt between Viet nam and
the people’s Republic of China and routes linking with seaports and large economic zones • Central Viet nam and Central Highlands Region
• Build the section of the north–South express railway, Vung Ang–Cha Lo (Mu Gia) railway, and a railway linking the Central Highlands provinces
• Build a railway for alumina–aluminum exploitation and production in Central Highlands provinces and linking the Central Highlands to seaports
• Southern Region • Build Ho Chi Minh City–nha Trang express railway (of the north–South express railway) and Bien
Hoa–Vung Tau railway • Build di An–Loc ninh railway for linking with trans-Asian railways • Build Ho Chi Minh City–My Tho–Can Tho railway
continued on next page
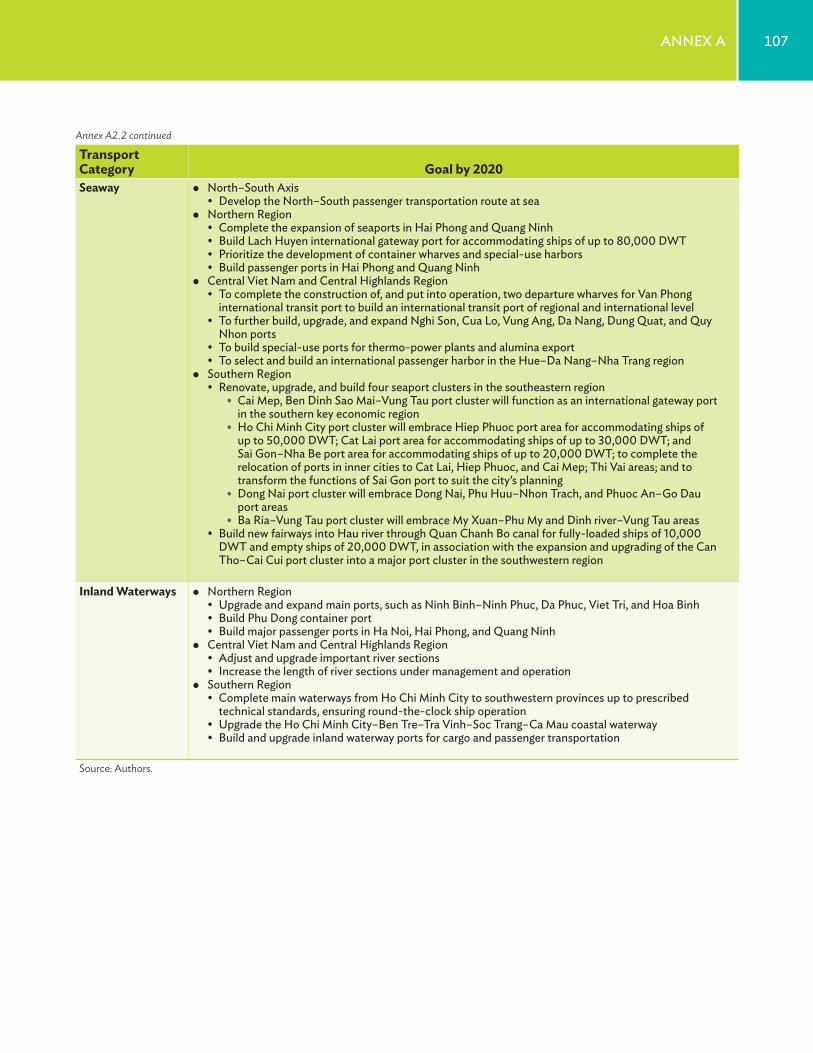
107Annex A
Transport Category Goal by 2020Seaway • north–South Axis
• develop the north–South passenger transportation route at sea • northern Region
• Complete the expansion of seaports in Hai phong and Quang ninh • Build Lach Huyen international gateway port for accommodating ships of up to 80,000 dWT • prioritize the development of container wharves and special-use harbors • Build passenger ports in Hai phong and Quang ninh
• Central Viet nam and Central Highlands Region • To complete the construction of, and put into operation, two departure wharves for Van phong
international transit port to build an international transit port of regional and international level • To further build, upgrade, and expand nghi Son, Cua Lo, Vung Ang, da nang, dung Quat, and Quy
nhon ports • To build special-use ports for thermo-power plants and alumina export • To select and build an international passenger harbor in the Hue–da nang–nha Trang region
• Southern Region • Renovate, upgrade, and build four seaport clusters in the southeastern region•Cai Mep, Ben dinh Sao Mai–Vung Tau port cluster will function as an international gateway port
in the southern key economic region•Ho Chi Minh City port cluster will embrace Hiep phuoc port area for accommodating ships of
up to 50,000 dWT; Cat Lai port area for accommodating ships of up to 30,000 dWT; and Sai Gon–nha Be port area for accommodating ships of up to 20,000 dWT; to complete the relocation of ports in inner cities to Cat Lai, Hiep phuoc, and Cai Mep; Thi Vai areas; and to transform the functions of Sai Gon port to suit the city’s planning
•dong nai port cluster will embrace dong nai, phu Huu–nhon Trach, and phuoc An–Go dau port areas
•Ba Ria–Vung Tau port cluster will embrace My xuan–phu My and dinh river–Vung Tau areas • Build new fairways into Hau river through Quan Chanh Bo canal for fully-loaded ships of 10,000
dWT and empty ships of 20,000 dWT, in association with the expansion and upgrading of the Can Tho–Cai Cui port cluster into a major port cluster in the southwestern region
Inland Waterways • northern Region • Upgrade and expand main ports, such as ninh Binh–ninh phuc, da phuc, Viet Tri, and Hoa Binh • Build phu dong container port • Build major passenger ports in Ha noi, Hai phong, and Quang ninh
• Central Viet nam and Central Highlands Region • Adjust and upgrade important river sections • increase the length of river sections under management and operation
• Southern Region • Complete main waterways from Ho Chi Minh City to southwestern provinces up to prescribed
technical standards, ensuring round-the-clock ship operation • Upgrade the Ho Chi Minh City–Ben Tre–Tra Vinh–Soc Trang–Ca Mau coastal waterway • Build and upgrade inland waterway ports for cargo and passenger transportation
Source: Authors.
Annex A2.2 continued
ANNEX B
108
1. Model Development under the ADB Regional Technical Assistance, Enabling Climate Change Responses in Asia and the Pacific
Under the Asian Development Bank regional technical assistance, Enabling Climate Change Responses in Asia and the Pacific – Strengthening Planning Capacity for Low Carbon Growth in Developing Asia, major extensions were made to the
Energy Forecasting Framework and Emissions Consensus Tool (EFFECT).
1.1 General Module
The modeling period was extended from 25 to 41 years (for example, to 2050 from a 2010 base year). A new marginal abatement cost (MAC) curve drawing utility and extended summary of the results were added. All carbon dioxide equivalent (CO2e) emissions factors and net calorific values were completely overhauled in line with the 2006 Intergovernmental Panel on Climate Change (IPCC) Guidelines for National Greenhouse Gas Inventories.
1.2 Power Module
The original EFFECT power module contained 27 grid-based generating technologies. An additional 40 generating technologies were added, covering other grid and off-grid generation to better cover and represent the technologies in use in Asia and proposed for future use. These included smaller power-generating units that are mainly used in off-grid generation and electrical storage solutions. User-selectable cost data for each of these technologies were included from low-, middle-, and high-income countries. The load–dispatch calculation was modified to improve the model’s handling of off-grid and microgrid generators together with the grid-connected units. The user was also given the choice to include local pollution emissions controls (sulfur dioxide [SO2], nitrogen oxide [NOx], particulate matter [PM]), process, and project contingencies. A new plant and equipment investment learning curve effect was added to allow the cost of different generating technologies to be changed over the modeling period.6
6 Although the analysis is normally performed at constant values, the improved model allows the impact of rising fossil fuel prices and diminishing renewable technologies—such as concentrated solar—to be evaluated.
109Annex B
1.3 Household Module
Additional appliances were added to EFFECT, and a new more detailed treatment was used to calculate energy used in lighting. A range of regression functions (Gompertz/Logistic, 3- or 4-factor, free/forced) now allows more options for linking income to appliance ownership.
1.4 Transport Module
New modules were developed to incorporate rail and waterborne transport (inland waterway and coastal shipping for both passengers and freight). A new Asian cross-country analysis was added to estimate the baseline growth in passenger-kilometers for mass transit (waterborne, rail, urban buses, and coaches) based on the relationship between passenger-kilometers per capita and gross domestic product per capita. Changes were also made to how historic fuel consumption data for on-road vehicles are used to adjust the calculated COPERT results and adjust the annual mileage per vehicle so that the calculated total automotive gasoline (petrol) fuel consumed in the base year matches an exogenous value for retail gasoline sales to on-road vehicles.
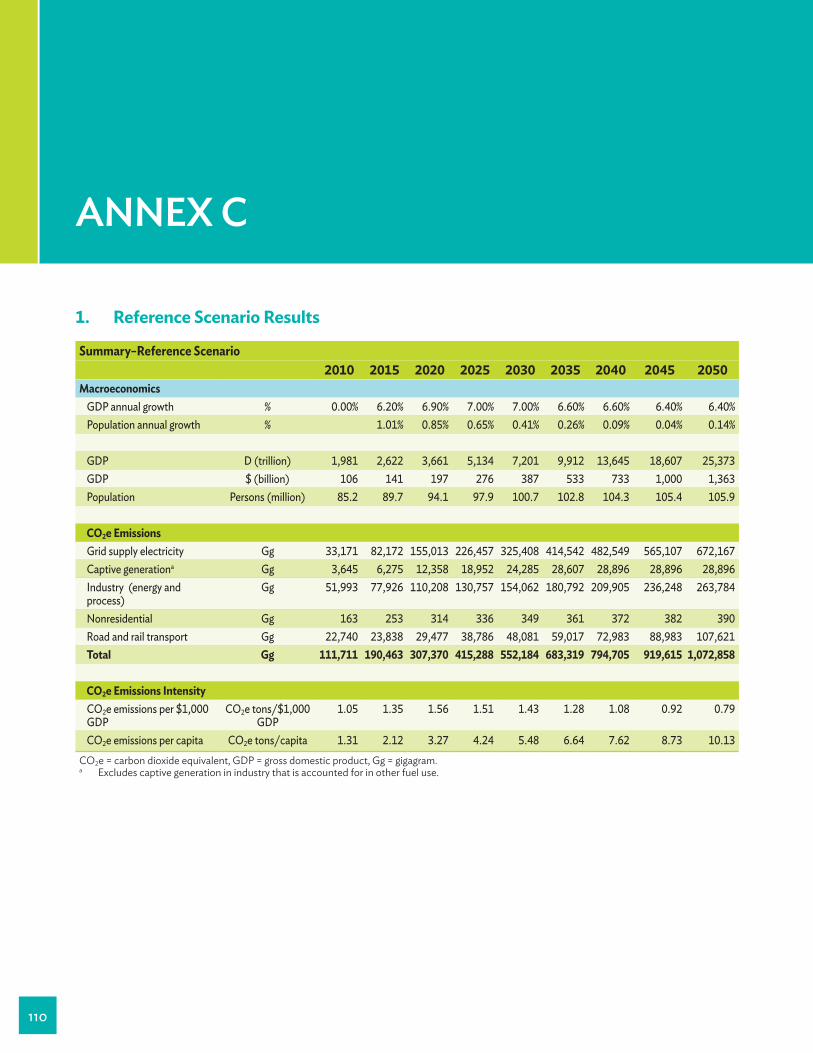
ANNEX C
110
Summary–Reference Scenario2010 2015 2020 2025 2030 2035 2040 2045 2050
MacroeconomicsGdp annual growth % 0.00% 6.20% 6.90% 7.00% 7.00% 6.60% 6.60% 6.40% 6.40%population annual growth % 1.01% 0.85% 0.65% 0.41% 0.26% 0.09% 0.04% 0.14%
Gdp d (trillion) 1,981 2,622 3,661 5,134 7,201 9,912 13,645 18,607 25,373Gdp $ (billion) 106 141 197 276 387 533 733 1,000 1,363population persons (million) 85.2 89.7 94.1 97.9 100.7 102.8 104.3 105.4 105.9
CO2e EmissionsGrid supply electricity Gg 33,171 82,172 155,013 226,457 325,408 414,542 482,549 565,107 672,167Captive generationa Gg 3,645 6,275 12,358 18,952 24,285 28,607 28,896 28,896 28,896industry (energy and process)
Gg 51,993 77,926 110,208 130,757 154,062 180,792 209,905 236,248 263,784
nonresidential Gg 163 253 314 336 349 361 372 382 390Road and rail transport Gg 22,740 23,838 29,477 38,786 48,081 59,017 72,983 88,983 107,621Total Gg 111,711 190,463 307,370 415,288 552,184 683,319 794,705 919,615 1,072,858
CO2e Emissions IntensityCO2e emissions per $1,000 Gdp
CO2e tons/$1,000 Gdp
1.05 1.35 1.56 1.51 1.43 1.28 1.08 0.92 0.79
CO2e emissions per capita CO2e tons/capita 1.31 2.12 3.27 4.24 5.48 6.64 7.62 8.73 10.13CO2e = carbon dioxide equivalent, GDP = gross domestic product, Gg = gigagram.a Excludes captive generation in industry that is accounted for in other fuel use.
1. Reference Scenario Results
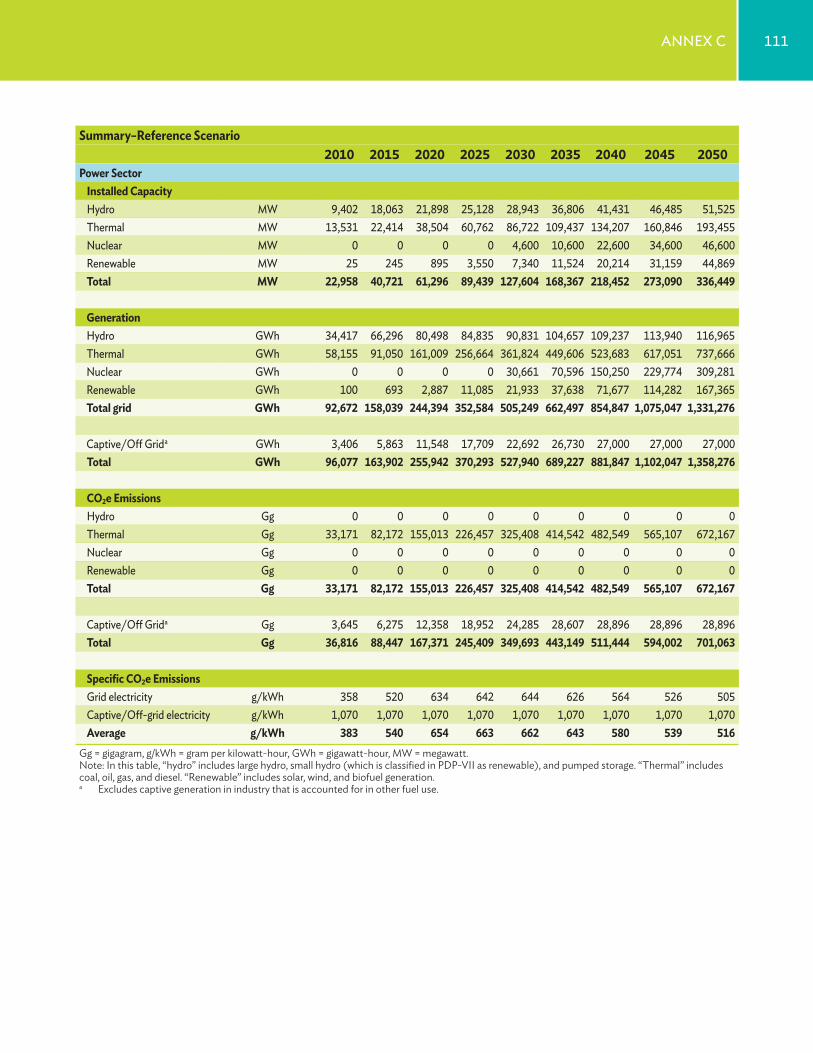
111Annex C
Summary–Reference Scenario2010 2015 2020 2025 2030 2035 2040 2045 2050
Power SectorInstalled CapacityHydro MW 9,402 18,063 21,898 25,128 28,943 36,806 41,431 46,485 51,525Thermal MW 13,531 22,414 38,504 60,762 86,722 109,437 134,207 160,846 193,455nuclear MW 0 0 0 0 4,600 10,600 22,600 34,600 46,600Renewable MW 25 245 895 3,550 7,340 11,524 20,214 31,159 44,869Total MW 22,958 40,721 61,296 89,439 127,604 168,367 218,452 273,090 336,449
GenerationHydro GWh 34,417 66,296 80,498 84,835 90,831 104,657 109,237 113,940 116,965Thermal GWh 58,155 91,050 161,009 256,664 361,824 449,606 523,683 617,051 737,666nuclear GWh 0 0 0 0 30,661 70,596 150,250 229,774 309,281Renewable GWh 100 693 2,887 11,085 21,933 37,638 71,677 114,282 167,365Total grid GWh 92,672 158,039 244,394 352,584 505,249 662,497 854,847 1,075,047 1,331,276
Captive/Off Grida GWh 3,406 5,863 11,548 17,709 22,692 26,730 27,000 27,000 27,000Total GWh 96,077 163,902 255,942 370,293 527,940 689,227 881,847 1,102,047 1,358,276
CO2e EmissionsHydro Gg 0 0 0 0 0 0 0 0 0Thermal Gg 33,171 82,172 155,013 226,457 325,408 414,542 482,549 565,107 672,167nuclear Gg 0 0 0 0 0 0 0 0 0Renewable Gg 0 0 0 0 0 0 0 0 0Total Gg 33,171 82,172 155,013 226,457 325,408 414,542 482,549 565,107 672,167
Captive/Off Grida Gg 3,645 6,275 12,358 18,952 24,285 28,607 28,896 28,896 28,896Total Gg 36,816 88,447 167,371 245,409 349,693 443,149 511,444 594,002 701,063
Specific CO2e EmissionsGrid electricity g/kWh 358 520 634 642 644 626 564 526 505Captive/Off-grid electricity g/kWh 1,070 1,070 1,070 1,070 1,070 1,070 1,070 1,070 1,070Average g/kWh 383 540 654 663 662 643 580 539 516
Gg = gigagram, g/kWh = gram per kilowatt-hour, GWh = gigawatt-hour, MW = megawatt.Note: In this table, “hydro” includes large hydro, small hydro (which is classified in PDP-VII as renewable), and pumped storage. “Thermal” includes coal, oil, gas, and diesel. “Renewable” includes solar, wind, and biofuel generation.a Excludes captive generation in industry that is accounted for in other fuel use.
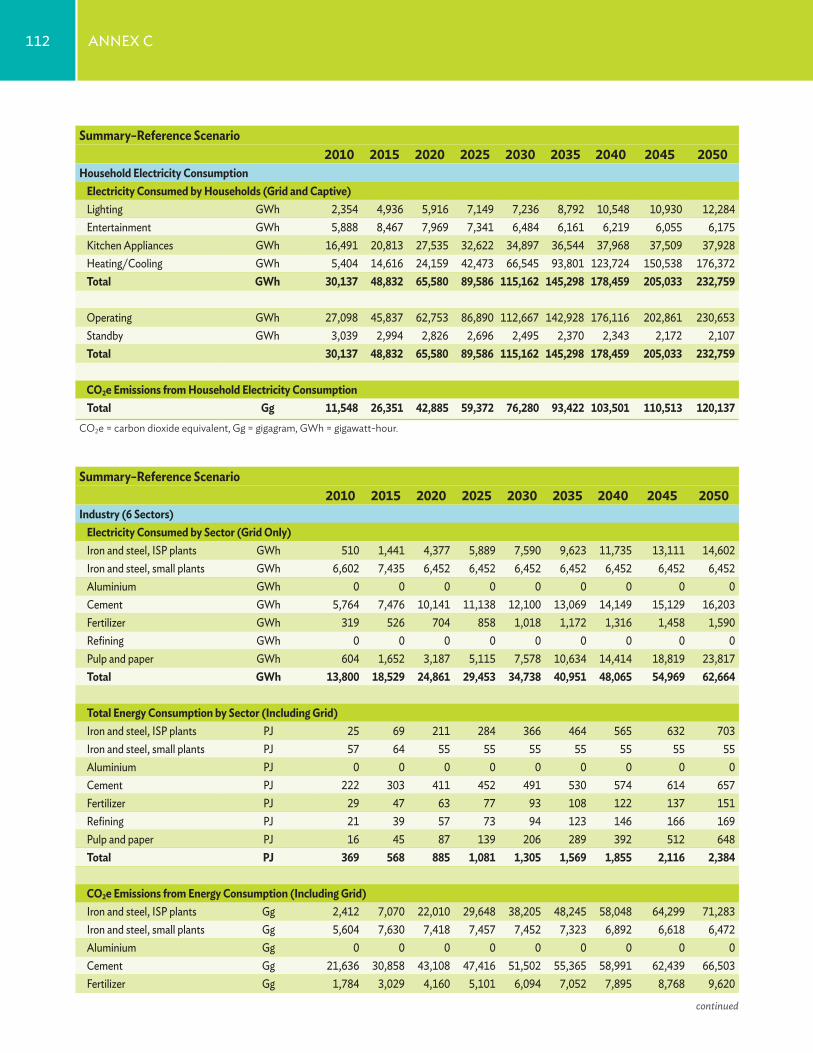
112 Annex C
Summary–Reference Scenario2010 2015 2020 2025 2030 2035 2040 2045 2050
Household Electricity ConsumptionElectricity Consumed by Households (Grid and Captive)Lighting GWh 2,354 4,936 5,916 7,149 7,236 8,792 10,548 10,930 12,284entertainment GWh 5,888 8,467 7,969 7,341 6,484 6,161 6,219 6,055 6,175Kitchen Appliances GWh 16,491 20,813 27,535 32,622 34,897 36,544 37,968 37,509 37,928Heating/Cooling GWh 5,404 14,616 24,159 42,473 66,545 93,801 123,724 150,538 176,372Total GWh 30,137 48,832 65,580 89,586 115,162 145,298 178,459 205,033 232,759
Operating GWh 27,098 45,837 62,753 86,890 112,667 142,928 176,116 202,861 230,653Standby GWh 3,039 2,994 2,826 2,696 2,495 2,370 2,343 2,172 2,107Total 30,137 48,832 65,580 89,586 115,162 145,298 178,459 205,033 232,759
CO2e Emissions from Household Electricity ConsumptionTotal Gg 11,548 26,351 42,885 59,372 76,280 93,422 103,501 110,513 120,137
CO2e = carbon dioxide equivalent, Gg = gigagram, GWh = gigawatt-hour.
Summary–Reference Scenario2010 2015 2020 2025 2030 2035 2040 2045 2050
Industry (6 Sectors)Electricity Consumed by Sector (Grid Only)iron and steel, iSp plants GWh 510 1,441 4,377 5,889 7,590 9,623 11,735 13,111 14,602iron and steel, small plants GWh 6,602 7,435 6,452 6,452 6,452 6,452 6,452 6,452 6,452Aluminium GWh 0 0 0 0 0 0 0 0 0Cement GWh 5,764 7,476 10,141 11,138 12,100 13,069 14,149 15,129 16,203Fertilizer GWh 319 526 704 858 1,018 1,172 1,316 1,458 1,590Refining GWh 0 0 0 0 0 0 0 0 0pulp and paper GWh 604 1,652 3,187 5,115 7,578 10,634 14,414 18,819 23,817Total GWh 13,800 18,529 24,861 29,453 34,738 40,951 48,065 54,969 62,664
Total Energy Consumption by Sector (Including Grid)iron and steel, iSp plants pJ 25 69 211 284 366 464 565 632 703iron and steel, small plants pJ 57 64 55 55 55 55 55 55 55Aluminium pJ 0 0 0 0 0 0 0 0 0Cement pJ 222 303 411 452 491 530 574 614 657Fertilizer pJ 29 47 63 77 93 108 122 137 151Refining pJ 21 39 57 73 94 123 146 166 169pulp and paper pJ 16 45 87 139 206 289 392 512 648Total PJ 369 568 885 1,081 1,305 1,569 1,855 2,116 2,384
CO2e Emissions from Energy Consumption (Including Grid)iron and steel, iSp plants Gg 2,412 7,070 22,010 29,648 38,205 48,245 58,048 64,299 71,283iron and steel, small plants Gg 5,604 7,630 7,418 7,457 7,452 7,323 6,892 6,618 6,472Aluminium Gg 0 0 0 0 0 0 0 0 0Cement Gg 21,636 30,858 43,108 47,416 51,502 55,365 58,991 62,439 66,503Fertilizer Gg 1,784 3,029 4,160 5,101 6,094 7,052 7,895 8,768 9,620
continued
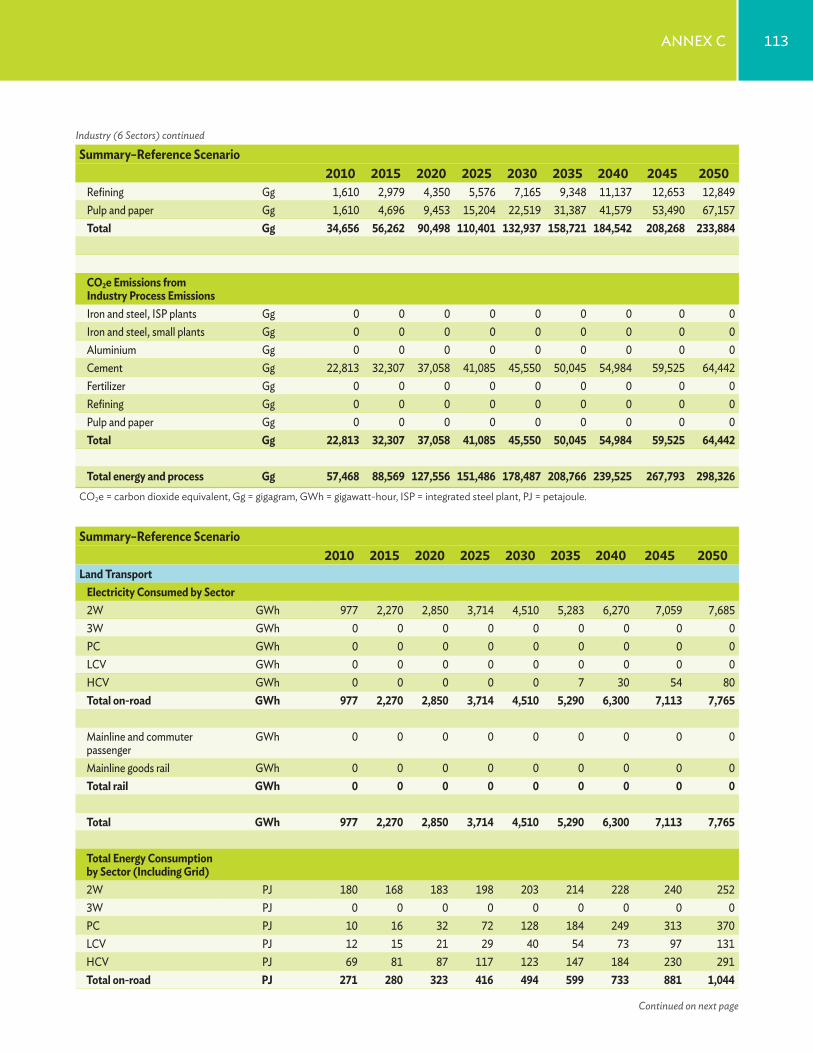
113Annex C
Summary–Reference Scenario2010 2015 2020 2025 2030 2035 2040 2045 2050
Refining Gg 1,610 2,979 4,350 5,576 7,165 9,348 11,137 12,653 12,849pulp and paper Gg 1,610 4,696 9,453 15,204 22,519 31,387 41,579 53,490 67,157Total Gg 34,656 56,262 90,498 110,401 132,937 158,721 184,542 208,268 233,884
CO2e Emissions from Industry Process Emissionsiron and steel, iSp plants Gg 0 0 0 0 0 0 0 0 0iron and steel, small plants Gg 0 0 0 0 0 0 0 0 0Aluminium Gg 0 0 0 0 0 0 0 0 0Cement Gg 22,813 32,307 37,058 41,085 45,550 50,045 54,984 59,525 64,442Fertilizer Gg 0 0 0 0 0 0 0 0 0Refining Gg 0 0 0 0 0 0 0 0 0pulp and paper Gg 0 0 0 0 0 0 0 0 0Total Gg 22,813 32,307 37,058 41,085 45,550 50,045 54,984 59,525 64,442
Total energy and process Gg 57,468 88,569 127,556 151,486 178,487 208,766 239,525 267,793 298,326CO2e = carbon dioxide equivalent, Gg = gigagram, GWh = gigawatt-hour, ISP = integrated steel plant, PJ = petajoule.
Industry (6 Sectors) continued
Continued on next page
Summary–Reference Scenario2010 2015 2020 2025 2030 2035 2040 2045 2050
Land TransportElectricity Consumed by Sector2W GWh 977 2,270 2,850 3,714 4,510 5,283 6,270 7,059 7,6853W GWh 0 0 0 0 0 0 0 0 0pC GWh 0 0 0 0 0 0 0 0 0LCV GWh 0 0 0 0 0 0 0 0 0HCV GWh 0 0 0 0 0 7 30 54 80Total on-road GWh 977 2,270 2,850 3,714 4,510 5,290 6,300 7,113 7,765
Mainline and commuter passenger
GWh 0 0 0 0 0 0 0 0 0
Mainline goods rail GWh 0 0 0 0 0 0 0 0 0Total rail GWh 0 0 0 0 0 0 0 0 0
Total GWh 977 2,270 2,850 3,714 4,510 5,290 6,300 7,113 7,765
Total Energy Consumption by Sector (Including Grid)2W pJ 180 168 183 198 203 214 228 240 2523W pJ 0 0 0 0 0 0 0 0 0pC pJ 10 16 32 72 128 184 249 313 370LCV pJ 12 15 21 29 40 54 73 97 131HCV pJ 69 81 87 117 123 147 184 230 291Total on-road PJ 271 280 323 416 494 599 733 881 1,044
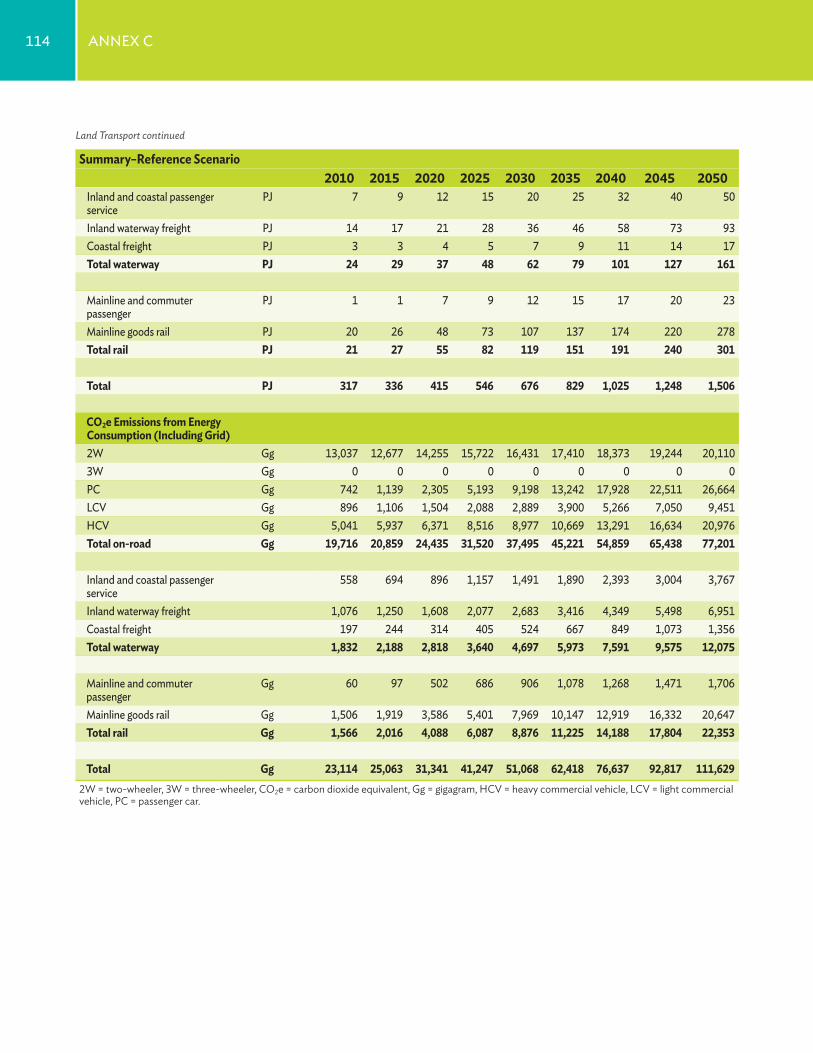
114 Annex C
Summary–Reference Scenario2010 2015 2020 2025 2030 2035 2040 2045 2050
inland and coastal passenger service
pJ 7 9 12 15 20 25 32 40 50
inland waterway freight pJ 14 17 21 28 36 46 58 73 93Coastal freight pJ 3 3 4 5 7 9 11 14 17Total waterway PJ 24 29 37 48 62 79 101 127 161
Mainline and commuter passenger
pJ 1 1 7 9 12 15 17 20 23
Mainline goods rail pJ 20 26 48 73 107 137 174 220 278Total rail PJ 21 27 55 82 119 151 191 240 301
Total PJ 317 336 415 546 676 829 1,025 1,248 1,506
CO2e Emissions from Energy Consumption (Including Grid)2W Gg 13,037 12,677 14,255 15,722 16,431 17,410 18,373 19,244 20,1103W Gg 0 0 0 0 0 0 0 0 0pC Gg 742 1,139 2,305 5,193 9,198 13,242 17,928 22,511 26,664LCV Gg 896 1,106 1,504 2,088 2,889 3,900 5,266 7,050 9,451HCV Gg 5,041 5,937 6,371 8,516 8,977 10,669 13,291 16,634 20,976Total on-road Gg 19,716 20,859 24,435 31,520 37,495 45,221 54,859 65,438 77,201
inland and coastal passenger service
558 694 896 1,157 1,491 1,890 2,393 3,004 3,767
inland waterway freight 1,076 1,250 1,608 2,077 2,683 3,416 4,349 5,498 6,951Coastal freight 197 244 314 405 524 667 849 1,073 1,356Total waterway 1,832 2,188 2,818 3,640 4,697 5,973 7,591 9,575 12,075
Mainline and commuter passenger
Gg 60 97 502 686 906 1,078 1,268 1,471 1,706
Mainline goods rail Gg 1,506 1,919 3,586 5,401 7,969 10,147 12,919 16,332 20,647Total rail Gg 1,566 2,016 4,088 6,087 8,876 11,225 14,188 17,804 22,353
Total Gg 23,114 25,063 31,341 41,247 51,068 62,418 76,637 92,817 111,6292W = two-wheeler, 3W = three-wheeler, CO2e = carbon dioxide equivalent, Gg = gigagram, HCV = heavy commercial vehicle, LCV = light commercial vehicle, PC = passenger car.
Land Transport continued
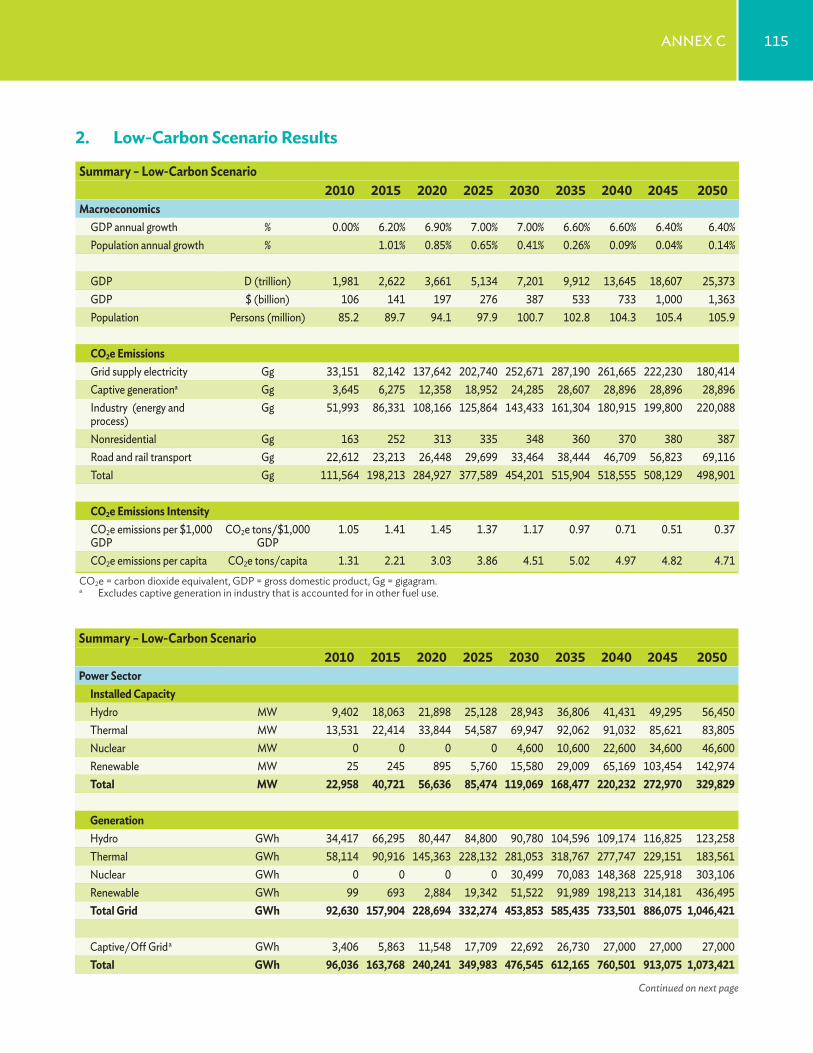
115Annex C
2. Low-Carbon Scenario Results
Summary – Low-Carbon Scenario2010 2015 2020 2025 2030 2035 2040 2045 2050
MacroeconomicsGdp annual growth % 0.00% 6.20% 6.90% 7.00% 7.00% 6.60% 6.60% 6.40% 6.40%population annual growth % 1.01% 0.85% 0.65% 0.41% 0.26% 0.09% 0.04% 0.14%
Gdp d (trillion) 1,981 2,622 3,661 5,134 7,201 9,912 13,645 18,607 25,373Gdp $ (billion) 106 141 197 276 387 533 733 1,000 1,363population persons (million) 85.2 89.7 94.1 97.9 100.7 102.8 104.3 105.4 105.9
CO2e EmissionsGrid supply electricity Gg 33,151 82,142 137,642 202,740 252,671 287,190 261,665 222,230 180,414Captive generationa Gg 3,645 6,275 12,358 18,952 24,285 28,607 28,896 28,896 28,896industry (energy and process)
Gg 51,993 86,331 108,166 125,864 143,433 161,304 180,915 199,800 220,088
nonresidential Gg 163 252 313 335 348 360 370 380 387Road and rail transport Gg 22,612 23,213 26,448 29,699 33,464 38,444 46,709 56,823 69,116Total Gg 111,564 198,213 284,927 377,589 454,201 515,904 518,555 508,129 498,901
CO2e Emissions IntensityCO2e emissions per $1,000 Gdp
CO2e tons/$1,000 Gdp
1.05 1.41 1.45 1.37 1.17 0.97 0.71 0.51 0.37
CO2e emissions per capita CO2e tons/capita 1.31 2.21 3.03 3.86 4.51 5.02 4.97 4.82 4.71CO2e = carbon dioxide equivalent, GDP = gross domestic product, Gg = gigagram.a Excludes captive generation in industry that is accounted for in other fuel use.
Summary – Low-Carbon Scenario2010 2015 2020 2025 2030 2035 2040 2045 2050
Power SectorInstalled CapacityHydro MW 9,402 18,063 21,898 25,128 28,943 36,806 41,431 49,295 56,450Thermal MW 13,531 22,414 33,844 54,587 69,947 92,062 91,032 85,621 83,805nuclear MW 0 0 0 0 4,600 10,600 22,600 34,600 46,600Renewable MW 25 245 895 5,760 15,580 29,009 65,169 103,454 142,974Total MW 22,958 40,721 56,636 85,474 119,069 168,477 220,232 272,970 329,829
GenerationHydro GWh 34,417 66,295 80,447 84,800 90,780 104,596 109,174 116,825 123,258Thermal GWh 58,114 90,916 145,363 228,132 281,053 318,767 277,747 229,151 183,561nuclear GWh 0 0 0 0 30,499 70,083 148,368 225,918 303,106Renewable GWh 99 693 2,884 19,342 51,522 91,989 198,213 314,181 436,495Total Grid GWh 92,630 157,904 228,694 332,274 453,853 585,435 733,501 886,075 1,046,421
Captive/Off Grid a GWh 3,406 5,863 11,548 17,709 22,692 26,730 27,000 27,000 27,000Total GWh 96,036 163,768 240,241 349,983 476,545 612,165 760,501 913,075 1,073,421
Continued on next page
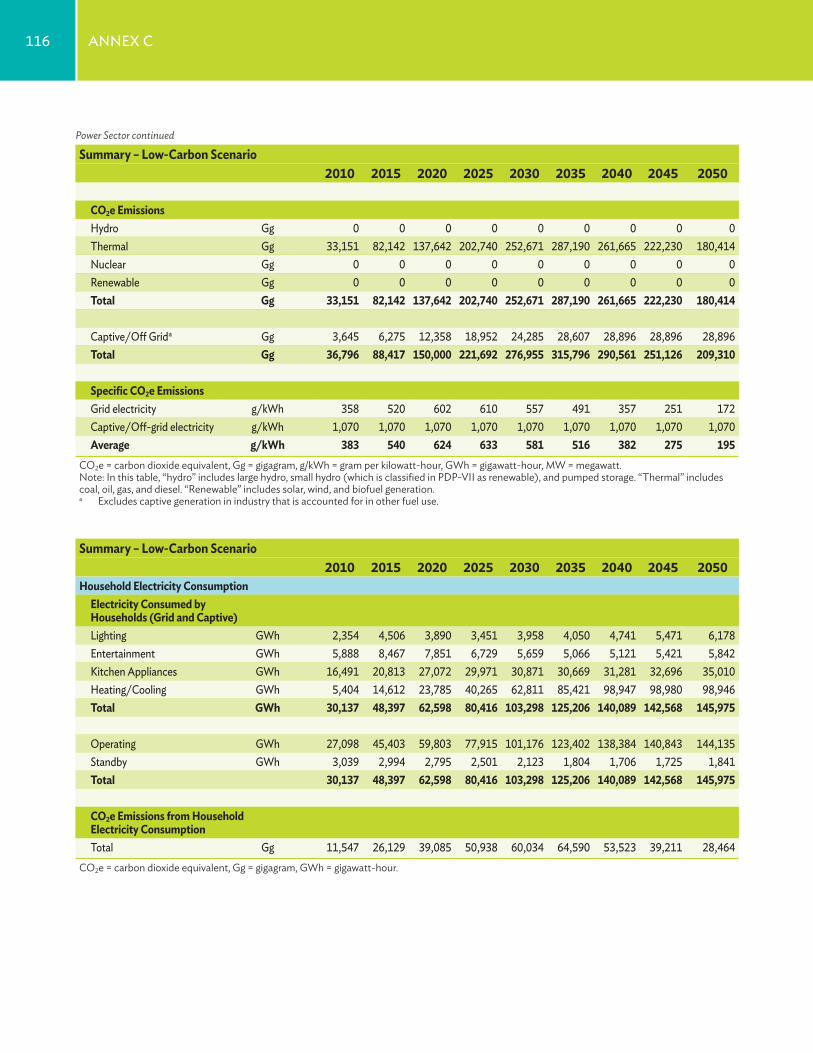
116 Annex C
Summary – Low-Carbon Scenario2010 2015 2020 2025 2030 2035 2040 2045 2050
CO2e EmissionsHydro Gg 0 0 0 0 0 0 0 0 0Thermal Gg 33,151 82,142 137,642 202,740 252,671 287,190 261,665 222,230 180,414nuclear Gg 0 0 0 0 0 0 0 0 0Renewable Gg 0 0 0 0 0 0 0 0 0Total Gg 33,151 82,142 137,642 202,740 252,671 287,190 261,665 222,230 180,414
Captive/Off Grid a Gg 3,645 6,275 12,358 18,952 24,285 28,607 28,896 28,896 28,896Total Gg 36,796 88,417 150,000 221,692 276,955 315,796 290,561 251,126 209,310
Specific CO2e EmissionsGrid electricity g/kWh 358 520 602 610 557 491 357 251 172Captive/Off-grid electricity g/kWh 1,070 1,070 1,070 1,070 1,070 1,070 1,070 1,070 1,070Average g/kWh 383 540 624 633 581 516 382 275 195
CO2e = carbon dioxide equivalent, Gg = gigagram, g/kWh = gram per kilowatt-hour, GWh = gigawatt-hour, MW = megawatt.Note: In this table, “hydro” includes large hydro, small hydro (which is classified in PDP-VII as renewable), and pumped storage. “Thermal” includes coal, oil, gas, and diesel. “Renewable” includes solar, wind, and biofuel generation.a Excludes captive generation in industry that is accounted for in other fuel use.
Power Sector continued
Summary – Low-Carbon Scenario2010 2015 2020 2025 2030 2035 2040 2045 2050
Household Electricity ConsumptionElectricity Consumed by Households (Grid and Captive)Lighting GWh 2,354 4,506 3,890 3,451 3,958 4,050 4,741 5,471 6,178entertainment GWh 5,888 8,467 7,851 6,729 5,659 5,066 5,121 5,421 5,842Kitchen Appliances GWh 16,491 20,813 27,072 29,971 30,871 30,669 31,281 32,696 35,010Heating/Cooling GWh 5,404 14,612 23,785 40,265 62,811 85,421 98,947 98,980 98,946Total GWh 30,137 48,397 62,598 80,416 103,298 125,206 140,089 142,568 145,975
Operating GWh 27,098 45,403 59,803 77,915 101,176 123,402 138,384 140,843 144,135Standby GWh 3,039 2,994 2,795 2,501 2,123 1,804 1,706 1,725 1,841Total 30,137 48,397 62,598 80,416 103,298 125,206 140,089 142,568 145,975
CO2e Emissions from Household Electricity ConsumptionTotal Gg 11,547 26,129 39,085 50,938 60,034 64,590 53,523 39,211 28,464
CO2e = carbon dioxide equivalent, Gg = gigagram, GWh = gigawatt-hour.
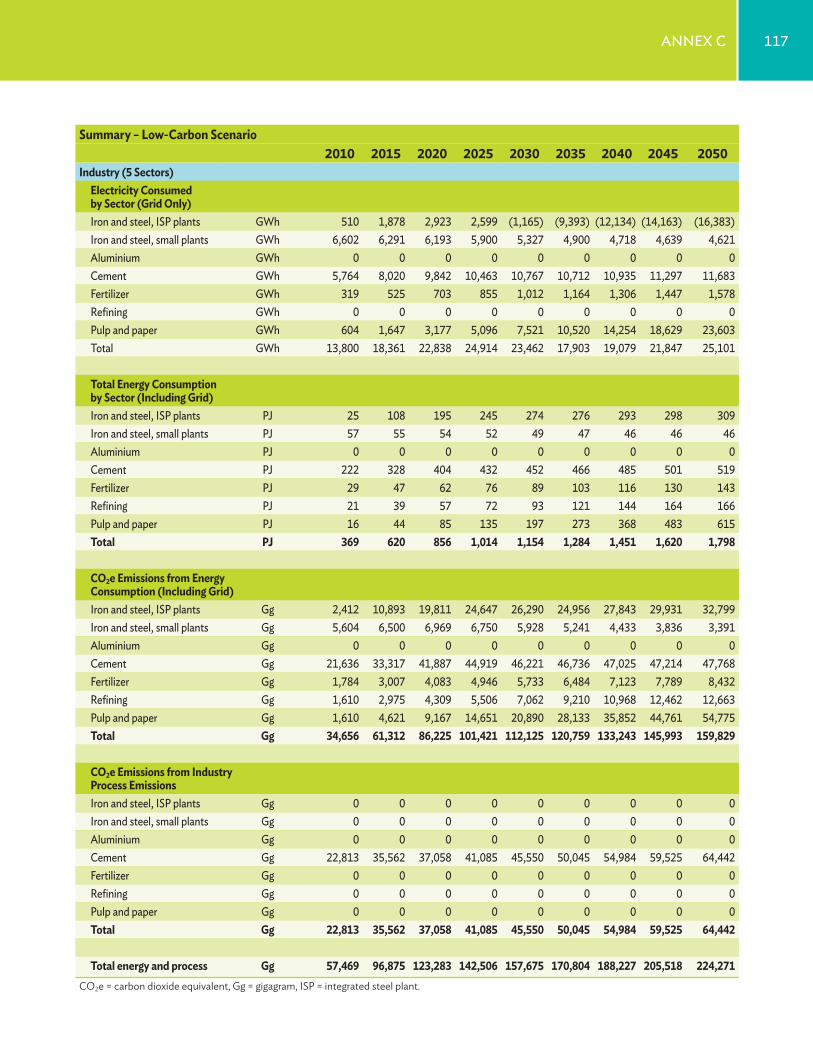
117Annex C
Summary – Low-Carbon Scenario2010 2015 2020 2025 2030 2035 2040 2045 2050
Industry (5 Sectors)Electricity Consumed by Sector (Grid Only)iron and steel, iSp plants GWh 510 1,878 2,923 2,599 (1,165) (9,393) (12,134) (14,163) (16,383)iron and steel, small plants GWh 6,602 6,291 6,193 5,900 5,327 4,900 4,718 4,639 4,621Aluminium GWh 0 0 0 0 0 0 0 0 0Cement GWh 5,764 8,020 9,842 10,463 10,767 10,712 10,935 11,297 11,683Fertilizer GWh 319 525 703 855 1,012 1,164 1,306 1,447 1,578Refining GWh 0 0 0 0 0 0 0 0 0pulp and paper GWh 604 1,647 3,177 5,096 7,521 10,520 14,254 18,629 23,603Total GWh 13,800 18,361 22,838 24,914 23,462 17,903 19,079 21,847 25,101
Total Energy Consumption by Sector (Including Grid)iron and steel, iSp plants pJ 25 108 195 245 274 276 293 298 309iron and steel, small plants pJ 57 55 54 52 49 47 46 46 46Aluminium pJ 0 0 0 0 0 0 0 0 0Cement pJ 222 328 404 432 452 466 485 501 519Fertilizer pJ 29 47 62 76 89 103 116 130 143Refining pJ 21 39 57 72 93 121 144 164 166pulp and paper pJ 16 44 85 135 197 273 368 483 615Total PJ 369 620 856 1,014 1,154 1,284 1,451 1,620 1,798
CO2e Emissions from Energy Consumption (Including Grid)iron and steel, iSp plants Gg 2,412 10,893 19,811 24,647 26,290 24,956 27,843 29,931 32,799iron and steel, small plants Gg 5,604 6,500 6,969 6,750 5,928 5,241 4,433 3,836 3,391Aluminium Gg 0 0 0 0 0 0 0 0 0Cement Gg 21,636 33,317 41,887 44,919 46,221 46,736 47,025 47,214 47,768Fertilizer Gg 1,784 3,007 4,083 4,946 5,733 6,484 7,123 7,789 8,432Refining Gg 1,610 2,975 4,309 5,506 7,062 9,210 10,968 12,462 12,663pulp and paper Gg 1,610 4,621 9,167 14,651 20,890 28,133 35,852 44,761 54,775Total Gg 34,656 61,312 86,225 101,421 112,125 120,759 133,243 145,993 159,829
CO2e Emissions from Industry Process Emissionsiron and steel, iSp plants Gg 0 0 0 0 0 0 0 0 0iron and steel, small plants Gg 0 0 0 0 0 0 0 0 0Aluminium Gg 0 0 0 0 0 0 0 0 0Cement Gg 22,813 35,562 37,058 41,085 45,550 50,045 54,984 59,525 64,442Fertilizer Gg 0 0 0 0 0 0 0 0 0Refining Gg 0 0 0 0 0 0 0 0 0pulp and paper Gg 0 0 0 0 0 0 0 0 0Total Gg 22,813 35,562 37,058 41,085 45,550 50,045 54,984 59,525 64,442
Total energy and process Gg 57,469 96,875 123,283 142,506 157,675 170,804 188,227 205,518 224,271CO2e = carbon dioxide equivalent, Gg = gigagram, ISP = integrated steel plant.
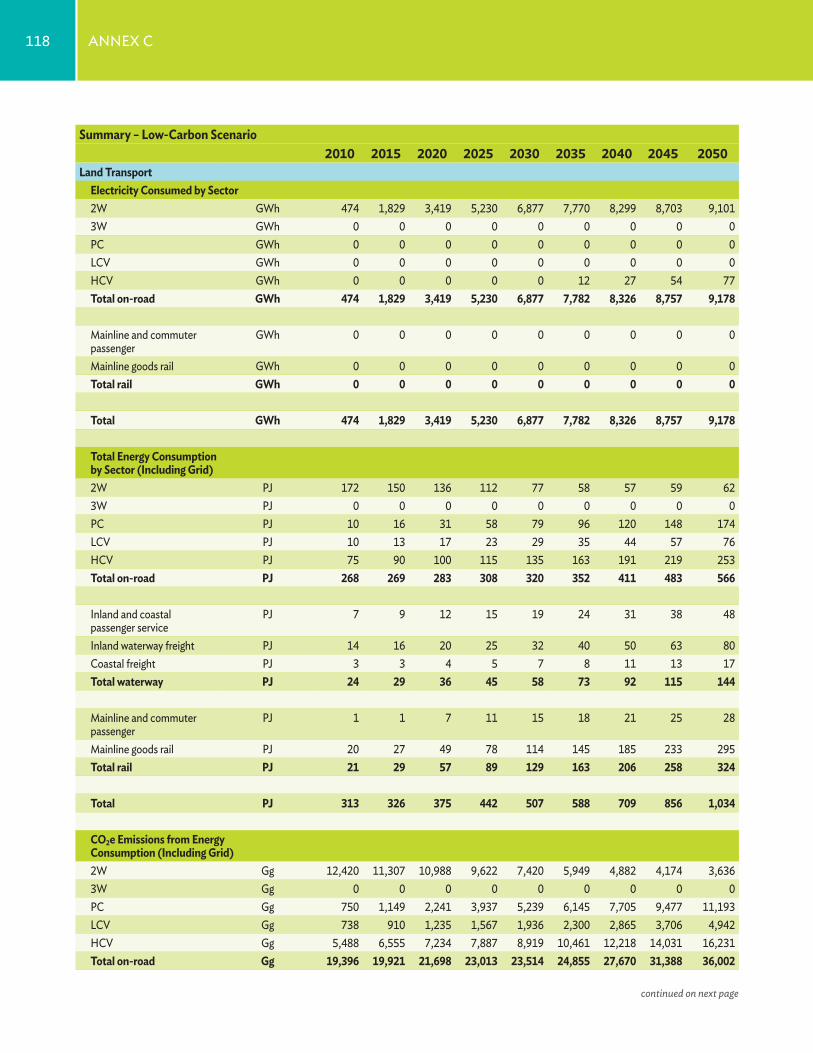
118 Annex C
Summary – Low-Carbon Scenario2010 2015 2020 2025 2030 2035 2040 2045 2050
Land TransportElectricity Consumed by Sector2W GWh 474 1,829 3,419 5,230 6,877 7,770 8,299 8,703 9,1013W GWh 0 0 0 0 0 0 0 0 0pC GWh 0 0 0 0 0 0 0 0 0LCV GWh 0 0 0 0 0 0 0 0 0HCV GWh 0 0 0 0 0 12 27 54 77Total on-road GWh 474 1,829 3,419 5,230 6,877 7,782 8,326 8,757 9,178
Mainline and commuter passenger
GWh 0 0 0 0 0 0 0 0 0
Mainline goods rail GWh 0 0 0 0 0 0 0 0 0Total rail GWh 0 0 0 0 0 0 0 0 0
Total GWh 474 1,829 3,419 5,230 6,877 7,782 8,326 8,757 9,178
Total Energy Consumption by Sector (Including Grid)2W pJ 172 150 136 112 77 58 57 59 623W pJ 0 0 0 0 0 0 0 0 0pC pJ 10 16 31 58 79 96 120 148 174LCV pJ 10 13 17 23 29 35 44 57 76HCV pJ 75 90 100 115 135 163 191 219 253Total on-road PJ 268 269 283 308 320 352 411 483 566
inland and coastal passenger service
pJ 7 9 12 15 19 24 31 38 48
inland waterway freight pJ 14 16 20 25 32 40 50 63 80Coastal freight pJ 3 3 4 5 7 8 11 13 17Total waterway PJ 24 29 36 45 58 73 92 115 144
Mainline and commuter passenger
pJ 1 1 7 11 15 18 21 25 28
Mainline goods rail pJ 20 27 49 78 114 145 185 233 295Total rail PJ 21 29 57 89 129 163 206 258 324
Total PJ 313 326 375 442 507 588 709 856 1,034
CO2e Emissions from Energy Consumption (Including Grid)2W Gg 12,420 11,307 10,988 9,622 7,420 5,949 4,882 4,174 3,6363W Gg 0 0 0 0 0 0 0 0 0pC Gg 750 1,149 2,241 3,937 5,239 6,145 7,705 9,477 11,193LCV Gg 738 910 1,235 1,567 1,936 2,300 2,865 3,706 4,942HCV Gg 5,488 6,555 7,234 7,887 8,919 10,461 12,218 14,031 16,231Total on-road Gg 19,396 19,921 21,698 23,013 23,514 24,855 27,670 31,388 36,002
continued on next page
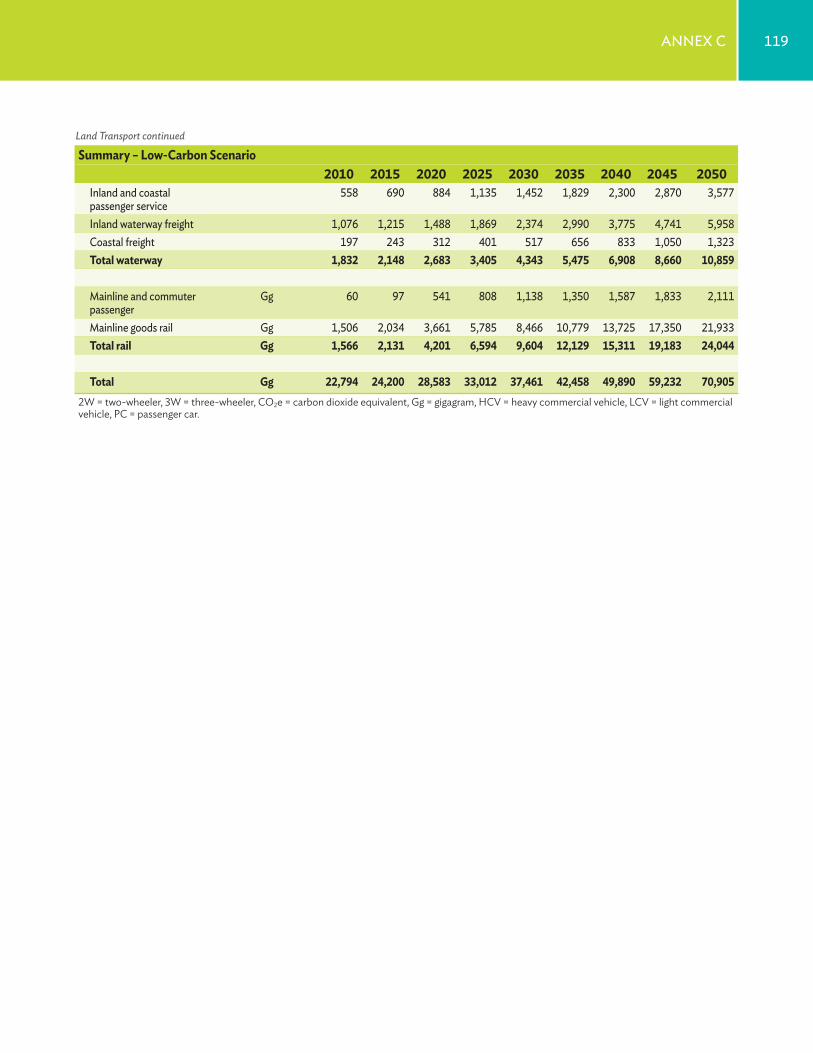
119Annex C
Summary – Low-Carbon Scenario2010 2015 2020 2025 2030 2035 2040 2045 2050
inland and coastal passenger service
558 690 884 1,135 1,452 1,829 2,300 2,870 3,577
inland waterway freight 1,076 1,215 1,488 1,869 2,374 2,990 3,775 4,741 5,958Coastal freight 197 243 312 401 517 656 833 1,050 1,323Total waterway 1,832 2,148 2,683 3,405 4,343 5,475 6,908 8,660 10,859
Mainline and commuter passenger
Gg 60 97 541 808 1,138 1,350 1,587 1,833 2,111
Mainline goods rail Gg 1,506 2,034 3,661 5,785 8,466 10,779 13,725 17,350 21,933Total rail Gg 1,566 2,131 4,201 6,594 9,604 12,129 15,311 19,183 24,044
Total Gg 22,794 24,200 28,583 33,012 37,461 42,458 49,890 59,232 70,9052W = two-wheeler, 3W = three-wheeler, CO2e = carbon dioxide equivalent, Gg = gigagram, HCV = heavy commercial vehicle, LCV = light commercial vehicle, PC = passenger car.
Land Transport continued
Pathways to Low-Carbon Development for Viet Nam
Viet Nam has had rapid economic growth in recent years, but this growth has been energy dependent, even as the energy system has become more carbon intensive. This study uses a bottom-up model to evaluate 63 measures to reduce greenhouse gas emissions from household electricity, industry, power generation, and transport. It finds potential for emissions reduction by 53% in 2050, and that much of this reduction can occur at low or negative financial costs. Moreover, these measures are found to ultimately lead to faster and more inclusive economy-wide growth. Policy measures are identified to help realize the modeled potential.
About the Asian Development Bank
ADB’s vision is an Asia and Pacific region free of poverty. Its mission is to help its developing member countries reduce poverty and improve the quality of life of their people. Despite the region’s many successes, it remains home to a large share of the world’s poor. ADB is committed to reducing poverty through inclusive economic growth, environmentally sustainable growth, and regional integration.
Based in Manila, ADB is owned by 67 members, including 48 from the region. Its main instruments for helping its developing member countries are policy dialogue, loans, equity investments, guarantees, grants, and technical assistance.
ASIAN DEVELOPMENT BANk6 ADB Avenue, Mandaluyong City1550 Metro Manila, Philippineswww.adb.org