Embed Size (px)
Citation preview
ELSEVIER Pattern Recognition Letters 16 (1995) 801-808
Pattern Recognition Letters
Pattern classification with genetic algorithms
S. Bandyopadhyay, C.A. Murthy, S.K. Pal * Machine Intelligence Unit, Indian Statistical Institute, 203 B.T. Road, Calcutta 700 035, India
Received 17 January 1995; revised 16 March 1995
Abstract
A method is proposed for finding decision boundaries, approximated by piecewise linear segments, for the classification of patterns in R 2, using an elitist model of a genetic algorithm. It involves the generation and placement of a set of lines (represented by strings) in the feature space that yields minimum misclassification. The effectiveness of the algorithm is demonstrated, for different parameter values, on both artificial data and speech data having non-linear class boundaries. Its comparison with the k-NN classifier is also made.
Keywords: Elitist model; Genetic operators; Line fitting; Pattern recognition
I. Introduction
Genetic Algorithms (GAs) (Goldberg, 1989) are randomized search and optimization techniques guided by the principles of evolution and natural genetics. They are efficient, adaptive and robust search processes, producing near-optimal solutions and have a large amount of implicit parallelism. GAs have applications in fields as diverse as VLSI design, pattern recognition, image processing, neural net- works, etc. (Proceedings, 1991).
In this paper, an attempt is made to study the application of GAs for pattern classification in two- dimensional data space. Classification is a problem of generating decision boundaries that can success- fully distinguish the various classes in the feature
* Corresponding author. Email: [email protected]
space. In real-life problems, the boundaries between the different classes are usually non-linear. In the present investigation, the characteristics of GAs have been exploited in searching for a number of lines which can approximate the non-linear boundaries which provide minimum misclassification.
The feature space is generally unbounded and continuous in nature. However, if bounding informa- tion can be derived from the training patterns and the space is discretized to sufficiently small intervals in each dimension, then the classification problem can be handled within the framework of Genetic Algo- rithms. A distinguishing feature of this approach is that the boundaries (approximated by piecewise lin- ear segments) are generated explicitly for making decisions. Note that in the conventional methods or in multilayered perceptron-based approaches to pat- tern classification, the generation of boundaries is a consequence of the respective decision making pro- cesses.
0167-8655/95/$09.50 © 1995 Elsevier Science B.V. All rights reserved SSDI 0 1 6 7 - 8 6 5 5 ( 9 5 ) 0 0 0 5 2 - 6

802 S. Bandyopadhyay et al. /Pattern Recognition Letters 16 (1995) 801-808
2. Description of the methodology
We consider a fixed number of lines (say H ) to denote a decision boundary in a two-dimensional feature space F1-F 2. The value of H varies from problem to problem, depending on the number as well as the nature of the classes. These H lines need to be encoded as a single string. Note that each line provides two halfspaces - a positive halfspace and a negative halfspace, thereby yielding two regions. For H lines, the maximum number of such regions is 2 H. The methodology to find a near-optimal classifier is described below.
2.1. Search space for lines
Let us assume that there are tr training patterns available. Then in the first step the maximum and minimum values of each of the two features, F~ and /72, are computed. Let these be Max 1, Min~, Max 2, Min 2 for the features F 1 and FE, respectively. Then the rectangle enclosing the sample points is given by the vertices (Min 1, MinE), (Min 1, MaXE), (Max1, MinE), (Max1, MaxE). Fig. 1 shows an ex- ample. The rectangle represents the search space for the possible lines which may be considered as candi- dates for the formation of the decision boundary.
2.2. Line generation
In this section we describe how to generate a finite number of parallel lines in a finite number of directions, so that even the two closest points of the data set, which may belong to two different classes, can be separated by a line in at least one direction. For this purpose, a distance dist is computed as follows:
Let ~¢ represent the training data set. Then we define
dist = min{ dist( x, y) l x ~ ¢ , y ~ ~ , x ~ y}
F2
Max~l . . . . T •
Min~l . . . . e ~ _ _ _ _ ~ 0 Mini Ma:rl
Fig. 1. Training patterns and the enclosing rectangle.
where dist(x, y) denotes the Euclidean distance be- tween points x and y. Consequently, the separation between two consecutive parallel lines, in any direc- tion, is taken to be dist/2. Thus, the maximum number of parallel lines, max_lines, which may have to be considered for searching in any particular direction within the search space, is computed as
1 max_ lines = | dist * 2]
where [x] gives the smallest integer greater than or equal to x and diag is the length of the diagonal of the rectangle enclosing the training points.
One way of representing a line is by the equation
x 1 cos a + x 2 sin o l=d . (1)
Here a is the angle between the Fl-axis and the unit normal to the line; d is the perpendicular distance of the normal from the origin. The way of specifying the two variables a and d is mentioned below,
• Angle (direction) specification. The entire feature space will be spanned if the angle a is allowed to vary in the range from 0 to ~ radians. The angle space is discretized to sufficiently small intervals as
0, ~ r , 28"rr . . . . . n * 8,rr.
The number of discrete angles considered is then equal to n + 1, and ~ = 1/n. An angle a can thus be specified by a number angle in the range [0, n] such that a = angle * 8 or.
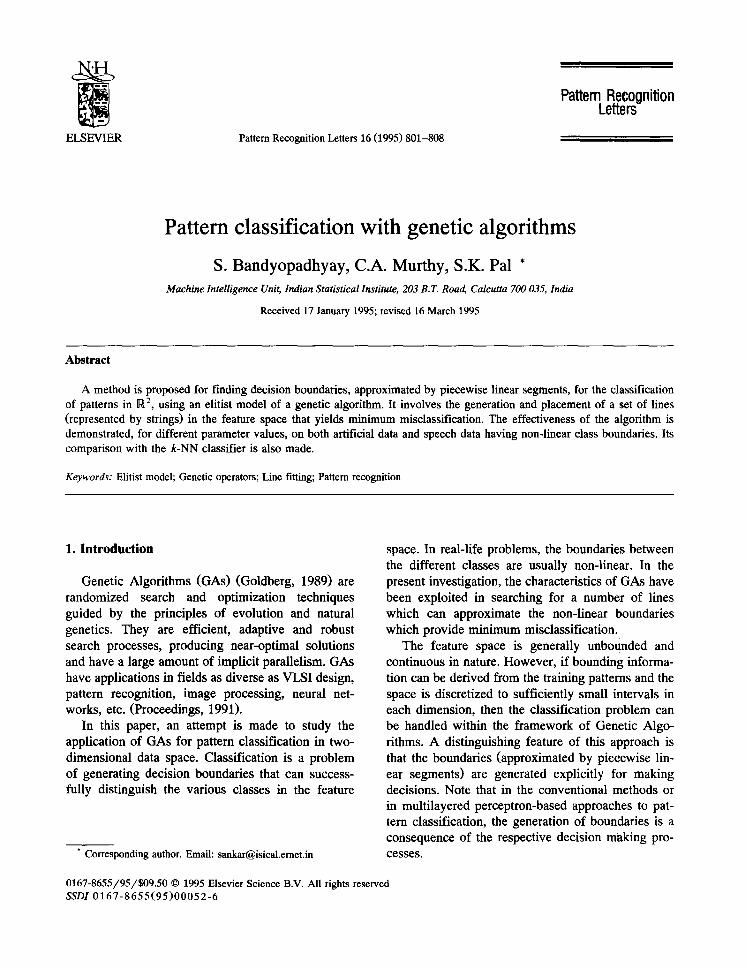
• Perpendicular distance specification. Once the angle a is fixed, the orientation of the line becomes fixed. For a given orientation, the perpendicular distances of the two lines passing through the base points ((Mini, Min E) and (Max1, MinE)) of the en- closing rectangle, from the origin, are computed from Eq. (1). (The perpendicular distance, d, as- sumes a negative value if it lies in the negative halfspace of the FE-axis.) Among these, the one with the minimum value, dmi n, is selected as the base line. This is demonstrated in Fig. 2 where the line through point 2 is the base line. The search space for lines with this orientation is restricted at one end by the base line. In other words, all lines with d < dmi n, are automatically discarded from the search space. At the other end is a parallel line at a perpendicular
S. Bandyopadhyay et al. / Pattern Recognition Letters 16 (1995) 801-808 803
2.4. Region identification and fitness computation
Fig. 2. Fixing the base line.
distance o f (dmi n Jr max_lines × (d i s t /2 ) ) from the origin.
Therefore any line at a distance offset from the base line can be specified by a number p in the range [0, max_lines] such that offset = p * dis t /2 . The perpendicular distance d of that line from the origin is therefore
d = dmi n q- offset.
A line In is now specified by the two integer variables angle and p.
2.3. String representation and population initializa- tion
Each string is composed of a fixed number, H, of lines. Each line is encoded in terms of an angle variable and a perpendicular distance variable (both assume integer values). If the angle variable is repre- sented by b_ ang number of bits and the perpendicu- lar distance by b_perp bits, then the length of each string, str_ len equals
str_ len = ( b_ ang + b_perp) * H.
The GA generally works with a fixed population size of Pop. Initially, each binary string, of length str_len, is generated by randomly selecting two variables angle and p from the intervals [0, n] and [0, m a x lines] respectively, for each of the H lines in a string.
The computation of the fitness is done for each string in the population. The fitness of a string is characterized by the number of points it misclassi- ties. A string with the lowest misclassification is therefore considered to be the fittest among the population of strings. Note that every string str i, i = 1, 2 . . . . . Pop, represents H lines denoted by ln~, j = l , 2 . . . . . n .
For each ln~, the parameters 1~ j, I~ j and d 0 are retrieved. For each training pattern point (Xl k, x~), k = 1, 2 . . . . . tr, the sign with respect to the line ln~, i.e., the sign of the expression
COS a i j X k ~ l - s i n Ot ij x k 2 - d ij (2)
is found. The sign is digitized as 1 (0) if the point lies on the positive (negative) side of the line ln~. The process is repeated for each of the lines, at the end of which we have a string signki, subsequently to be referred to as the sign string. This string, of length H, corresponds to the classification yielded by the string str i of the population, for the kth training pattern. The class information of the kth training point is stored along with the sign string sign~ for str i in a linked list. This procedure is repeated for all the tr pattern points.
It is to be noted that although sign~ can take on at most 2 H possible values (since H lines will yield a maximum of 2 n possible classifications), all of them
• 6z
~ " - ' ~ LINE z
• 31 ~ • 4~.
\
~ LLNE 1
• t l • 2 2 +\~LI.NF_~
q Fig. 3. An example with H = 3 and tr = 8.
804 S. Bandyopadhyay et al. / Pattern Recognition Letters 16 (1995) 801-808
0 0 0 .IClass 21 1 J 8 2 5
00 l , ~ ,IClass 21 2 I
0 1 0 , ~
011 * I C I ~ 11 1 I
100 - N U L L
101 , N U L L
I t 0 , N U L L
111 , I . . ~ ,tClass 21 1 I ¥
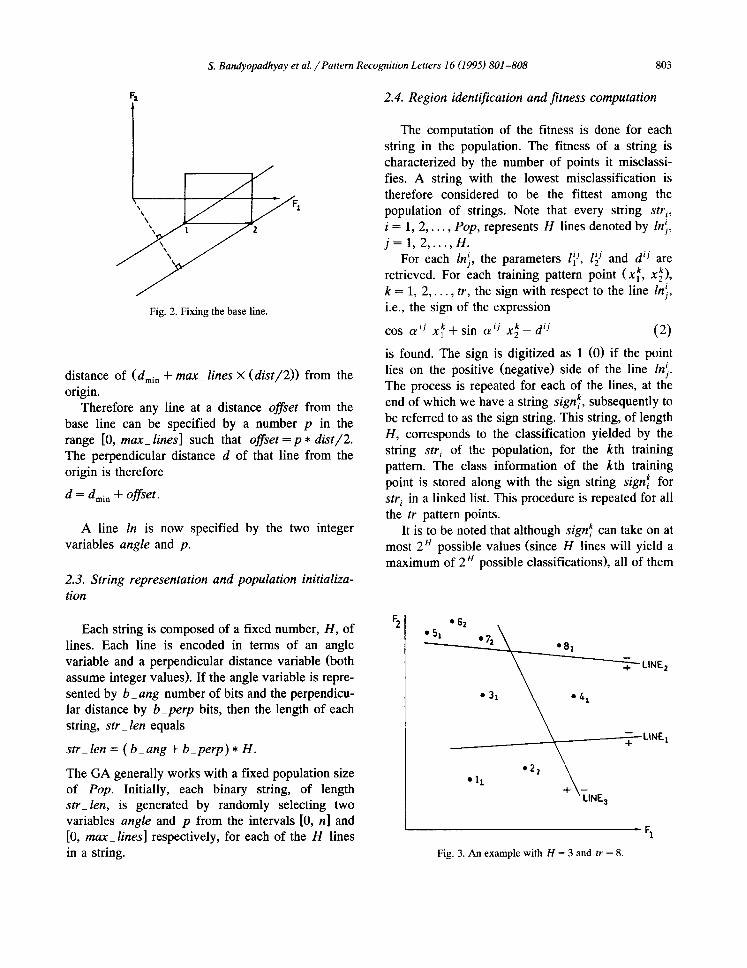
Fig. 4. Link list for the given example.
may not occur in practice. These sign strings, in fact, represent different regions of the search space. With each such sign string, a linked list is maintained. Each element of the list is an ordered pair indicating a class and its cardinality. The cardinality of a class denotes the number of training samples of that class which have been identified to fall into the region represented by the sign string.
The maximum class cardinality in the list for each sign string is found next. Then the region corre- sponding to that sign string is considered to provide the demarcation for the class possessing the maxi- mum cardinality. All the points belonging to other classes which have been included in the same list, i.e. which lie in the same region, are considered to
3 0 0
111111111111111111111111111111 11111111111111111111111111111111
1111111111111111111111111111111111 111111111111111111111111111111111111
11111111111 1111111111 11111111111 1111111111 11111111 11111111 1111111 2 22222222 1111111 1111111 22 22222222 111111 111111 2222 22222222 11111 11111 222222 22222222 11111 11111 22222222 22222222 11111 iiiii 222222 22222222 iiiii 11111 2222 22222222 11111 iiiiii 22 22222222 11111 1111111 111111 1111111 111111 11111111 iiiiiii 11111111111111111111111111111111111111
111111.111111111111111111111111111111 1111111111111111111111111111111111 11111111111111111111111111111111
I I 800 2750
X
Fig. 5. Artificial data.
be misclassified. The number of misclassifications corresponding to all possible sign strings are summed up to give the resulting misclassification for the entire classifier string. It may so happen that the maximum cardinalities for two (or more) different sign strings may correspond to the same class. In that case, all these strings (correspondingly, union of all the different regions) are considered to provide the
900
8 O 0
• ~ - 700
60C
~ 500
~00
3oo
20C , 600 9(~0
Q I
a ( l
4 ¢ 1
a. 4 q
0 o
0
| 1200 2100
Second formant frequency in Hertz
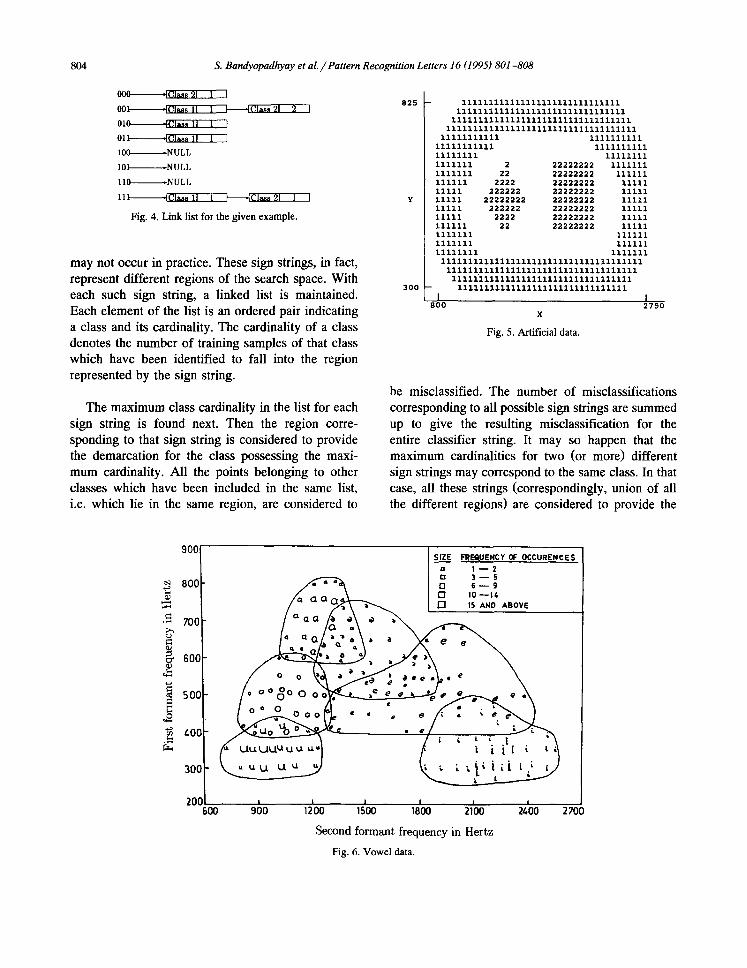
Fig. 6. Vowel data.
a,,-,~L--_.~ I C] Io~14 AeOVE
I I I 1500 1800 2~00 2700
S. Bandyopadhyay et al. // Pattern Recognition Letters 16 (1995) 801-808 805
825 - \ 111111111111111111~111a3.i&111i \ iiI11111111111111~'1111111111~1~ \ I11111111111111111~111111111111111 ~ ~ & ~ 1~11111111111111111~i111111111111111 /
11~1111111 ' 111111111~ ~1111~11111 , 111111.,~11
111111.1L_ _ _ _ 1.1~I.~ %1 1 .' __ 111111~ 2 / 22222222 11/1111 1111111\ 22 [ ~222~222 ~11111 Iiiiii\ 22~2 / 2222222~ / IIIii iiiii ~22222 / 22222222 / iiiii
Y iiiii 2~2222~2 / 222~2222 / iiiii 11111 2~2222 ) ' 222222Z2/ 11111 11111 z~22 / 2212222~ 11111 111111 ~ / 1 2 2 2 2 ~ } _ _._zla..zl - - 1 1 1 1 1 1 1 _ _ _ ~ - - - ~11111 --i~I~i'I~ -- -- \ I / 111111 11111111 \ \ / / 1111111 111111111111111~1111111~11111111111111 111111111111111~11111~11111111111111
111111111111121~11~11i1111111~111 300 11111111111~111~t11111111111,,_
I I 800 i / ~ 2750
/X \
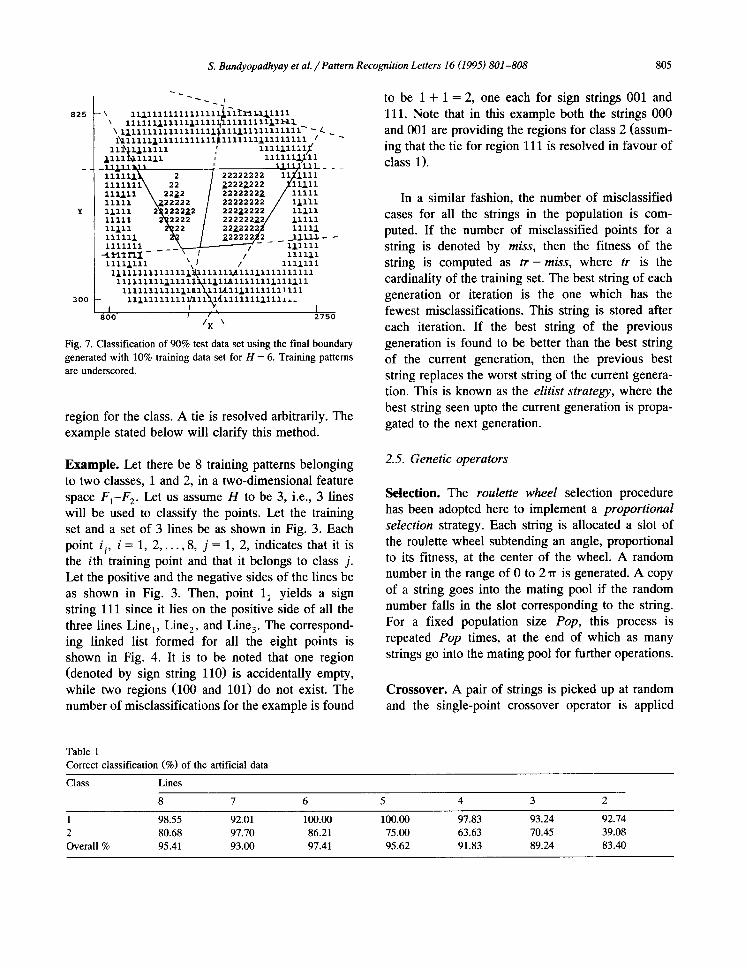
Fig. 7. Classification of 90% test data set using the final boundary generated with 10% training data set for H = 6. Training paRerns are underscored.
region for the class. A tie is resolved arbitrarily. The example stated below will clarify this method.
Example. Let there be 8 training patterns belonging to two classes, 1 and 2, in a two-dimensional feature space F1-F 2. Let us assume H to be 3, i.e., 3 lines will be used to classify the points. Let the training set and a set of 3 lines be as shown in Fig. 3. Each point i j, i = 1, 2 . . . . . 8, j = 1, 2, indicates that it is the ith training point and that it belongs to class j. Let the positive and the negative sides of the lines be as shown in Fig. 3. Then, point 11 yields a sign string 111 since it lies on the positive side of all the three lines Line 1, Line a, and Line 3. The correspond- ing linked list formed for all the eight points is shown in Fig. 4. It is to be noted that one region (denoted by sign string 110) is accidentally empty, while two regions (100 and 101) do not exist. The number of misclassifications for the example is found
to be 1 + 1 = 2, one each for sign strings 001 and 1 1 1 . Note that in this example both the strings 000 and 001 are providing the regions for class 2 (assum- ing that the tie for region 111 is resolved in favour of class 1).
In a similar fashion, the number of misclassified cases for all the strings in the population is com- puted. If the number of misclassified points for a string is denoted by miss, then the fitness of the string is computed as t r - miss, where tr is the cardinality of the training set. The best string of each generation or iteration is the one which has the fewest misclassifications. This string is stored after each iteration. If the best string of the previous generation is found to be better than the best string of the current generation, then the previous best string replaces the worst string of the current genera- tion. This is known as the elitist strategy, where the best string seen upto the current generation is propa- gated to the next generation.
2.5. Genetic operators
Selection. The roulette wheel selection procedure has been adopted here to implement a proportional selection strategy. Each string is allocated a slot of the roulette wheel subtending an angle, proportional to its fitness, at the center of the wheel. A random number in the range of 0 to 2 ~r is generated, A copy of a string goes into the mating pool if the random number falls in the slot corresponding to the string. For a fixed population size Pop, this process is repeated Pop times, at the end of which as many strings go into the mating pool for further operations.
Crossover. A pair of strings is picked up at random and the single-point crossover operator is applied
Table 1 Correct classification (%) of the artificial data
Class Lines
8 7 6 5 4 3 2
1 98.55 92.01 100.00 100.00 97.83 93.24 92.74 2 80.68 97.70 86.21 75.00 63.63 70.45 39.08 Overall % 95.41 93.00 97.41 95.62 91.83 89.24 83.40
806 S. Bandyopadhyay et al. /Pattern Recognition Letters 16 (1995) 801-808
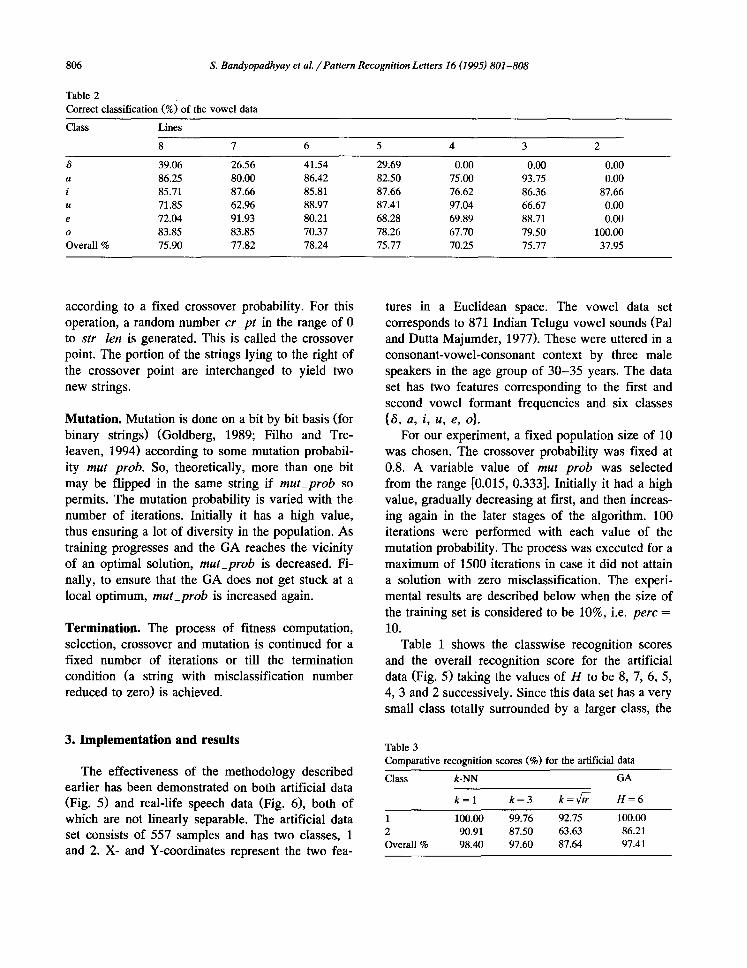
Table 2 Correct classification (%) of the vowel data
Class Lines
8 7 6 5 4 3 2
8 39.06 26.56 41.54 29.69 0.00 0.00 0.00 a 86.25 80.00 86.42 82.50 75.00 93.75 0.00 i 85.71 87.66 85.81 87.66 76.62 86.36 87.66 u 71.85 62.96 88.97 87.41 97.04 66.67 0.00 e 72.04 91.93 80.21 68.28 69.89 88.71 0.00 o 83.85 83.85 70.37 78.26 67.70 79.50 100.00 Overall % 75.90 77.82 78.24 75.77 70.25 75.77 37.95
according to a fixed crossover probability. For this operation, a random number cr_pt in the range of 0 to str_ len is generated. This is called the crossover point. The portion of the strings lying to the right of the crossover point are interchanged to yield two new strings.
Mutat ion. Mutation is done on a bit by bit basis (for binary strings) (Goldberg, 1989; Filho and Tre- leaven, 1994) according to some mutation probabil- ity mut_prob. So, theoretically, more than one bit may be flipped in the same string if mut_prob so permits. The mutation probability is varied with the number of iterations. Initially it has a high value, thus ensuring a lot of diversity in the population. As training progresses and the GA reaches the vicinity of an optimal solution, mut_prob is decreased. Fi- nally, to ensure that the GA does not get stuck at a local optimum, mut_prob is increased again.
Termination. The process of fitness computation, selection, crossover and mutation is continued for a fixed number of iterations or till the termination condition (a string with misclassification number reduced to zero) is achieved.
3. Implementation and results
The effectiveness of the methodology described earlier has been demonstrated on both artificial data (Fig. 5) and real-life speech data (Fig. 6), both of which are not linearly separable. The artificial data set consists of 557 samples and has two classes, 1 and 2. X- and Y-coordinates represent the two fea-
tures in a Euclidean space. The vowel data set corresponds to 871 Indian Telugu vowel sounds (Pal and Dutta Majumder, 1977). These were uttered in a consonant-vowel-consonant context by three male speakers in the age group of 30 -35 years. The data set has two features corresponding to the first and second vowel formant frequencies and six classes {8, a , i , u , e , o } .
For our experiment, a fixed population size of 10 was chosen. The crossover probability was fixed at 0.8. A variable value of mut_prob was selected from the range [0.015, 0.333]. Initially it had a high value, gradually decreasing at first, and then increas- ing again in the later stages of the algorithm. 100 iterations were performed with each value of the mutation probability. The process was executed for a maximum of 1500 iterations in case it did not attain a solution with zero misclassification. The experi- mental results are described below when the size of the training set is considered to be 10%, i.e. perc = 10.
Table 1 shows the classwise recognition scores and the overall recognition score for the artificial data (Fig. 5) taking the values of H to be 8, 7, 6, 5, 4, 3 and 2 successively. Since this data set has a very small class totally surrounded by a larger class, the
Table 3 Comparative recognition scores (%) for the artificial data
Class k-NN GA
k = l k=3 k=vrff H = 6
1 100.00 99.76 92.75 100.00 2 90.91 87.50 63.63 86.21 Overall % 98.40 97.60 87.64 97.41
S. Bandyopadhyay et al. / Pattern Recognition Letters 16 (1995) 801-808 807
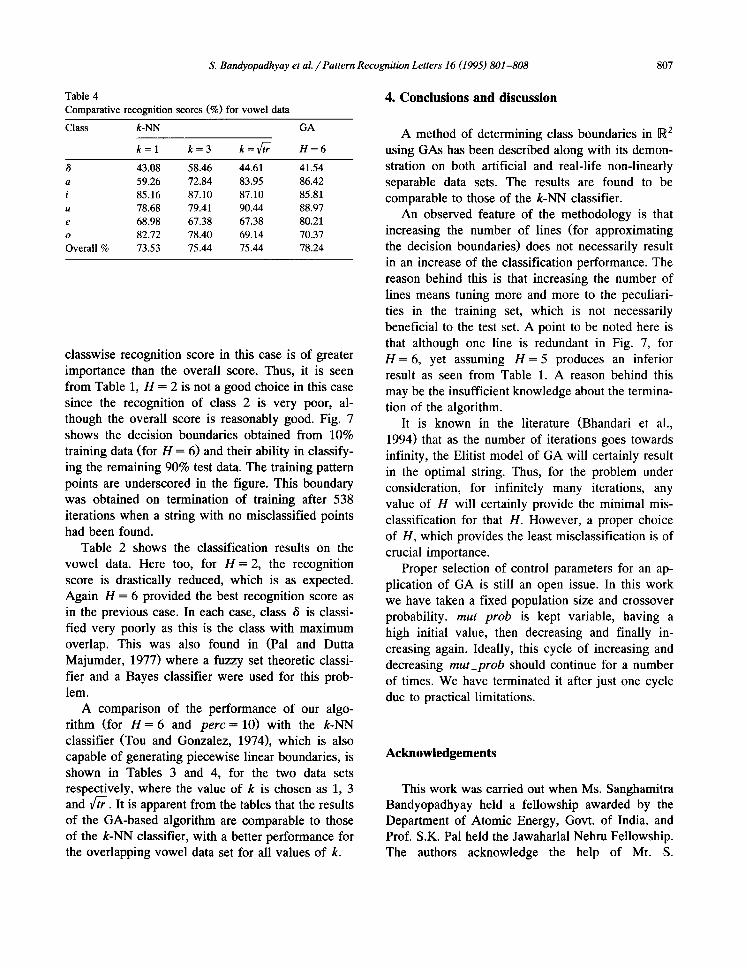
Table 4 Comparative recognition scores (%)for vowel data
Class k-NN GA
k= l k= 3 k=x/~ H = 6
43.08 58.46 44.61 41.54 a 59.26 72.84 83.95 86.42 i 85.16 87.10 87.10 85.81 u 78.68 79.41 90.44 88.97 e 68.98 67.38 67.38 80.21 o 82.72 78.40 69.14 70.37 Overall % 73.53 75.44 75.44 78.24
classwise recognition score in this case is of greater importance than the overall score. Thus, it is seen from Table 1, H = 2 is not a good choice in this case since the recognition of class 2 is very poor, al- though the overall score is reasonably good. Fig. 7 shows the decision boundaries obtained from 10% training data (for H = 6) and their ability in classify- ing the remaining 90% test data. The training pattern points are underscored in the figure. This boundary was obtained on termination of training after 538 iterations when a string with no misclassified points had been found.
Table 2 shows the classification results on the vowel data. Here too, for H = 2, the recognition score is drastically reduced, which is as expected. Again H = 6 provided the best recognition score as in the previous case. In each case, class ~ is classi- fied very poorly as this is the class with maximum overlap. This was also found in (Pal and Dutta Majumder, 1977) where a fuzzy set theoretic classi- fier and a Bayes classifier were used for this prob- lem.
A comparison of the performance of our algo- rithm (for H = 6 and perc = 10) with the k-NN classifier (Tou and Gonzalez, 1974), which is also capable of generating piecewise linear boundaries, is shown in Tables 3 and 4, for the two data sets respectively, where the value of k is chosen as 1, 3 and v~-. It is apparent from the tables that the results of the GA-based algorithm are comparable to those of the k-NN classifier, with a better performance for the overlapping vowel data set for all values of k.
4. Conclusions and discussion
A method of determining class boundaries in •2 using GAs has been described along with its demon- stration on both artificial and real-life non-linearly separable data sets. The results are found to be comparable to those of the k-NN classifier.
An observed feature of the methodology is that increasing the number of lines (for approximating the decision boundaries) does not necessarily result in an increase of the classification performance. The reason behind this is that increasing the number of lines means tuning more and more to the peculiari- ties in the training set, which is not necessarily beneficial to the test set. A point to be noted here is that although one line is redundant in Fig. 7, for H = 6, yet assuming H = 5 produces an inferior result as seen from Table 1. A reason behind this may be the insufficient knowledge about the termina- tion of the algorithm.
It is known in the literature (Bhandari et al., 1994) that as the number of iterations goes towards infinity, the Elitist model of GA will certainly result in the optimal string. Thus, for the problem under consideration, for infinitely many iterations, any value of H will certainly provide the minimal mis- classification for that H. However, a proper choice of H, which provides the least misclassification is of crucial importance.
Proper selection of control parameters for an ap- plication of GA is still an open issue. In this work we have taken a fixed population size and crossover probability, mut_prob is kept variable, having a high initial value, then decreasing and finally in- creasing again. Ideally, this cycle of increasing and decreasing mut_prob should continue for a number of times. We have terminated it after just one cycle due to practical limitations.
Acknowledgements
This work was carried out when Ms. Sanghamitra Bandyopadhyay held a fellowship awarded by the Department of Atomic Energy, Govt. of India, and Prof. S.K. Pal held the Jawaharlal Nehru Fellowship. The authors acknowledge the help of Mr. S.
808 S. Bandyopadhyay et al. ~Pattern Recognition Letters 16 (1995) 801--808
Chakraborty in drawing the figures. They also ac- knowledge the reviewer for the valuable comments on an earlier version of the article.
References
Bhandaxi, D., C.A. Murthy and S.K. Pal (1994). Genetic algo- rithm with elitist model and its convergence, lnternat. J. Pattern Recognition and Artificial Intelligence (communi- cated).
Filho, J.L. R and P.C. Treleaven (1994). Genetic algorithm pro- gramming environments. 1EEE Comput., June, 28-43.
Goldberg, D.E. (1989). Genetic Algorithms: Search, Optimization and Machine Learning. Addison-Wesley, New York.
Pal, S.K. and D. Dutta Majumder (1977). Fuzzy sets and decision making approaches in vowel and speaker recognition. IEEE Trans. Syst. Man Cybernet. 7, 625-629.
Proceedings (1991). Proceedings of the Fourth International Con- ference on Genetic Algorithms. University of California, San Diego, CA.
Tou, J.T. and R.C. Gonzalez (1974). Pattern Recognition Princi- ples. Addison-Wesley, Reading, MA.