Embed Size (px)
Citation preview
AMERICAN JOURNAL OF PHYSICAL ANTHROPOLOGY 80~49-58 (1989)
Pattern Matching of Age-at-Death Distributions in Paleodemographic Analysis
GEORGE R. MILNER, DOROTHY A. HUMPF, AND HENRY C. HARPENDING Department o f Anthropology, The Pennsylvania Statv [Jnrtmsit.>, Unrorrsrty Park, Peiznsyluanra 16UM
KEY WORDS Paleodemography, !Kung, Yanomamo, Oneota
ABSTRACT Model age-at-death distributions are generated from fertility and mortality rates derived from two present-day, traditional human societies with widely differing cultural systems: the !Kung hunters-and-gatherers and Yanomamo horticulturalists. Visual examination of these models demonstrates that fertility has more of an effect than mortality on the overall configuration of the age-at-death distributions of stable populations. Comparisons with a late prehistoric Oneota skeletal sample from the American Midwest illustrate how reference age-at-death schedules can be used 1) to identify whether a given skeletal sample approximates an age-at-death distribution expected of an extant human population and 2) to provide a basis for developing further test- able hypotheses about the demographic and cultural characteristics of past populations.
During the past two decades the usefulness of skeletal series for inferences about the demographic characteristics of past popula- tions has been actively debated (Acsadi and Nemeskeri, 1970; Angel, 1969; Bocquet-Appel and Masset, 1982; Buikstra and Konigsberg, 1985; Johansson and Horowitz, 1986; Van Gerven and Armelagos, 1983). Considerable attention has been directed toward the devel- opment and refinement of techniques used to age and sex human skeletons, as well as toward the evaluation of analytical methods, especially life tables (Acsadi and Nemeskeri, 1970; Buikstra and Konigsberg, 1985; Moore et al., 1975; Sattenspiel and Harpending, 1983; Weiss, 1973).
It is widely recognized that paleodemog- raphers face several particularly intractable problems. One of these problems is the effect of population growth on the age composition of skeletal samples, even when it can be assumed that the remains were drawn from a stable population where vital rates remained fixed over time (Johansson and Horowitz, 1986; Moore et al., 1975). To facilitate the computation of life table statistics, past popu- lations are usually assumed to be stationary, i.e., have a growth rate of zero, because reli- able, independently derived archaeological
information on the rate of growth is rarely available. Other difficulties include biases introduced to selected life table statistics by an underrepresentation of skeletons in se- lected age categories, especially infancy (Moore et al., 1975), and the confounding effect of fertility rates on life table values derived solely from the number and distribution of deaths (Johansson and Horowitz, 1986; Sat- tenspiel and Harpending, 1983).
One approach to analyzing paleodemo- graphic data involves fitting increasingly sophisticated models to extant information (e.g., Gage and Dyke, 1986). A point estimate of a set of parameters is obtained that is then compared with estimates from other popula- tions. While such a procedure is valuable, we have reservations about the statistical va- lidity of complex models applied to scanty data, such as those typifying anthropolog- ically studied populations, both past and present.
The opposite approach to paleodemo- graphic study is adopted here. The simplest pos- sible models are generated for our data, and then we attempt to falsify the hypothesis that
Received June 4, 1987; revision accepted September 23, 1988
@ 1989 ALAN R. LISS, INC.
50 G.R. MILNER ET AL
the simple models account, to the limits of resolution possible, for the characteristics of the observed sample.
We suggest that demographic statistics derived from adequately documented, tradi- tional societies represent an efficient initial means of assessing the age structure of a skeletal series. The use of age-at-death sched- ules from extant human societies represents one way in which selected demographic char- acteristics of a past population can be ap- proximated from the age composition of a skeletal sample. We also suggest that model age-at-death schedules serve as the basis of generating testable inferences about seem- ingly interrelated demographic and cultural processes, a central concern of anthropologi- cal research. Our focus on age-at-death data, rather than life table statistics, parallels a recent trend in paleodemography toward an emphasis on untransformed skeletal age dis- tributions as a basis for inferences about the demographic characteristics of prehistoric populations (Buikstra et al., 1986; Johans- son and Horowitz, 1986).
The Coale and Demeny (1966) West series of model life tables are used here as a base- line human demographic pattern, along with birth and death rates from two well-studied, technologically primitive societies: the !Kung of the African Kalahari desert and the Yanomamo of tropical South America. If skeletal series can be shown to be compatible with simple reference models such as those presented here, it is not necessary to resort to more complex analytical techniques of un- known statistial robustness. In other words, we are advocating Howell’s (1976) uniformi- tarian hypothesis. Our approach is based on simple visual matching of age-at-death dis- tributions. Maximum likelihood estimation procedures for life table models will be dis- cussed in a subsequent paper.
This analytical technique is illustrated by comparing a late prehistoric skeletal series from the American Midwest with the kinds of age-at-death distributions that would be left by populations with vital rates approximat- ing those of !Kung hunters-and-gatherers (Howell, 1979) and Yanomamo horticultural- ists (Nee1 and Weiss, 1975). The best availa- ble estimates of !Kung and Yanomamo fertil- ity and mortality are used to generate stable populations featuring the four possible com- binations of these rates. These representative age-at-death distributions are then compared with the age composition of the prehistoric sample.
The proposed evaluation of prehistoric samples involves two steps. First, a compari- son with reference populations indicates whether a skeletal sample can be considered to have been drawn without significant bias from a stable population. Second, unbiased samples can be compared with contrasting age-at-death schedules from known popula- tions. A satisfactory fit, if obtained, repre- sents a basis for generating further hypothe- ses regarding the demographic and, perhaps, the cultural characteristics of the archaeologi- cal sample.
THE REFERENCE POPULATIONS
The !Kung and Yanomamo are the two most prominent ethnographically known candidates that emerged from the search in the 1960s for models of the population struc- ture of technologically primitive human soci- eties. Although current recognition of the diversity of demographic rates in these cul- tures makes this search for population arche- types appear somewhat futile in retrospect, the !Kung and Yanomamo, who are polar opposites in so many demographic and cultu- ral respects, provide a useful starting point for analyses of the variation in the popula- tion structure of traditional societies, includ- ing those of the past.
The !Kung hunters-and-gatherers live in the northwestern Kalahari desert of southern Central Africa. They have been exhaustively described in the general anthropological liter- ature (Lee, 1979; Marshall, 1976), as well as in demographic studies (Howell, 1979; Harpend- ing and Wandsnider, 1982; Wilmsen, 1982; and others). They have a moderately low fer- tility, with a gross reproduction rate of about two, which corresponds to a completed fam- ily size of slightly more than four, and a life expectancy at birth of about 30 years. The result of this combination of mortality and fertility is an effectively stationary popula- tion. In the 1960s and early 1970s, the anthropological literature suggested that the !Kung did not work very hard, had plenty of food, and maintained a kind of long-term balance with their environment. In short, they maintained zero or low population growth while pursuing a life of relative leisure and harmony. This interpretation, however, has been criticized recently on a number of grounds (Harpending and Wandsnider, 1982; Hawkes and O’Connell, 1983). Regardless of whether ecological wisdom or scarce food is responsible for the moderate fertility and mortality among the !Kung, the rates given
PALEODEMOGWHIC AGE-AT-DEATH DISTRIBUTIONS 51
above seem securely established and inter- nally consistent (Howell, 1979).
The Yanomamo are fierce expansionist swidden horticulturalists with fertility rates considerably higher than those of the !Kung (Chagnon, 1972,1983; Nee1 and Weiss, 1975). The mortality rates of these two peoples, however, may be roughly comparable. In this study, an estimated gross reproduction rate of 3.25 was used for the Yanomamo. An expectation of life at birth of 20 years was employed, since this level of mortality yields a stationary population with the level of fer- tility featured in this model. While the actual expectation of life among the current Yano- mamo is considerably higher than this fig- ure, we refer to this level of mortality as Yanomamo mortality.
The four possible combinations of !Kung and Yanomamo fertility and mortality rates were used to generate different age-at-death distributions following formulae provided by Coale and Demeny (1966, pp. 20ff.) for their model West series. The Coale and Demeny estimates are not the only source of model life tables, but the West series is widely applica- ble, and it has been employed in recent cri- tiques of paleodemographic methods (e.g., Johansson and Horowitz, 1986; Sattenspiel and Harpending, 1983). For anthropological populations with small sample sizes, minor differences among models will not have de- tectable consequences, particularly when the resulting age-at-death schedules are compared visually. The four reference populations have the following characteristics:
!Kung fertility and mortality: GRR = 2 and
Yanomamo fertility and !Kung mortality:
Yanomamo fertility and mortality: GRR =
!Kung fertility and Yanomamo mortality:
eo = 33
GRR = 3.25 and eo = 33
3.25 and eo = 20
GRR = 2 and e, = 20
THE ARCHAEOLOGICAL POPULATION
The prehistoric skeletal series was exca- vated by Illinois State Museum archaeolo- gists as part of a recent highway project sup- ported by the Illinois Department of Trans- portation. The series was derived from a completely excavated cemetery, a mound designated Norris Farms #36, that was lo- cated in the central Illinois River valley of western Illinois. The cemetery included mor-
tuary features from several different cultural periods, with the principal component being 264 Oneota skeletons dating to ca. A.D. 1300. These skeletons were generally well preserved and reasonably complete.
Forty-three skeletons, 16% of the total, exhibited bone damage indicative of violent death (Milner and Smith, n.d.). This perimor- tem damage has been attributed to arrow wounds, blows from weapons such as Celts, scalping, decapitation, dismemberment, and gnawing by scavenging carnivores. These forms of damage were distinctly different from antemortem lesions that can affect the human skeleton as well as the fractures, warping, surface erosion, and rodent gnaw- ing that often alters the appearance of ar- chaeological bone long after interment. Forty- one of these 43 individuals were adults (>15 years); 18 were males, 18 were females, and 5 were not assigned a sex on the basis of pelvic or cranial morphology.
The skeletons of juveniles were aged on the basis of dental development (Moorrees et al., 1963a,b; Thoma and Goldman, 1960; Ube- laker, 1978:112, 113) and epiphyseal closure (Mackay, n.d.; Ubelaker, 1978:53). The age of one incomplete young child’s skeleton was estimated by the length of the long bones (Ubelaker, 1978:48, 49). Adult skeletons were aged whenever possible on the basis of pubic symphyseal morphology (Gilbert and Mc- Kern, 1973; McKern and Stewart, 1957; Meindl et al., 1985; Todd, 1920). Additional information on the age of skeletons was derived from the degree of endocranial suture closure (Todd and Lyon, 1924) and iliac auricular surface morphology (Lovejoy et al., 1985). The ages assigned to adult skeletons were consistent with subjective assessments of age based on the extent of dental attrition, arthritic bony involvement, and osteoporosis.
The aged skeletons were initially distrib- uted among the twelve age intervals com- monly employed by paleodemographers when constructing life tables: 0-1 years, 1-5 years, nine 5-year-long intervals from 5-10 to 45-50 years, and 50+ years. When an age range assigned to a skeleton spanned two or more intervals, the individual was apportioned evenly among the appropriate age categories. Although most skeletons were assigned rather narrow age ranges, six incomplete skeletons could only be identified as belonging to adults. These six individuals were appor- tioned differentially among the seven inter- vals from 20-25 to 5 0 f years according to the
52 G.R. MILNER ET AL
age-at-death distribution of the remainder of the skeletal sample.
Two separate age-at-death schedules were then developed for the Oneota skeletal series. One represented the actual mortality expe- rience of the population as reflected by the composition of the skeletal sample. The other schedule approximates the distribution of deaths that might have characterized this population had the 43 killed individuals died natural deaths. Each of the 43 individuals was apportioned among the age intervals that started with the interval that included the individual’s assigned age-at-death and ended with the 5 0 f category. The likelihood of death occurring in each relevant age inter- val was calculated on the basis of the mortal- ity experience of the remaining 221 individu- als in the sample. The Oneota age-at-death distributions were generated both prior to, and independently from, the development of the analytical technique presented here.
For purposes of this study, the twelve age intervals were combined into the six more inclusive categories shown in Figures 1-3. This was done for both the original and mod- ified Oneota age-at-death schedules.
RESULTS
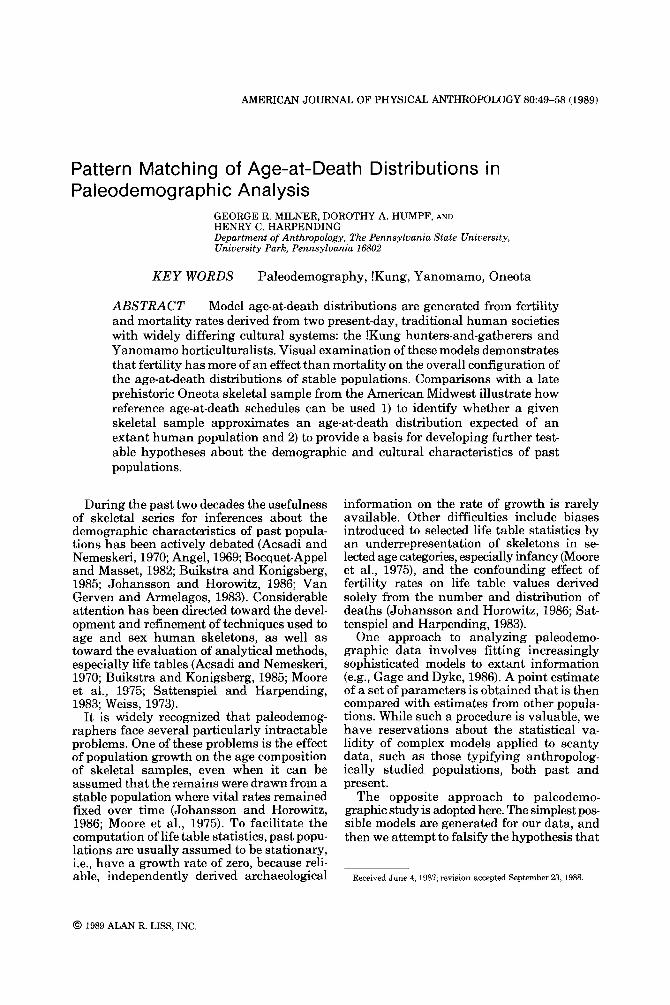
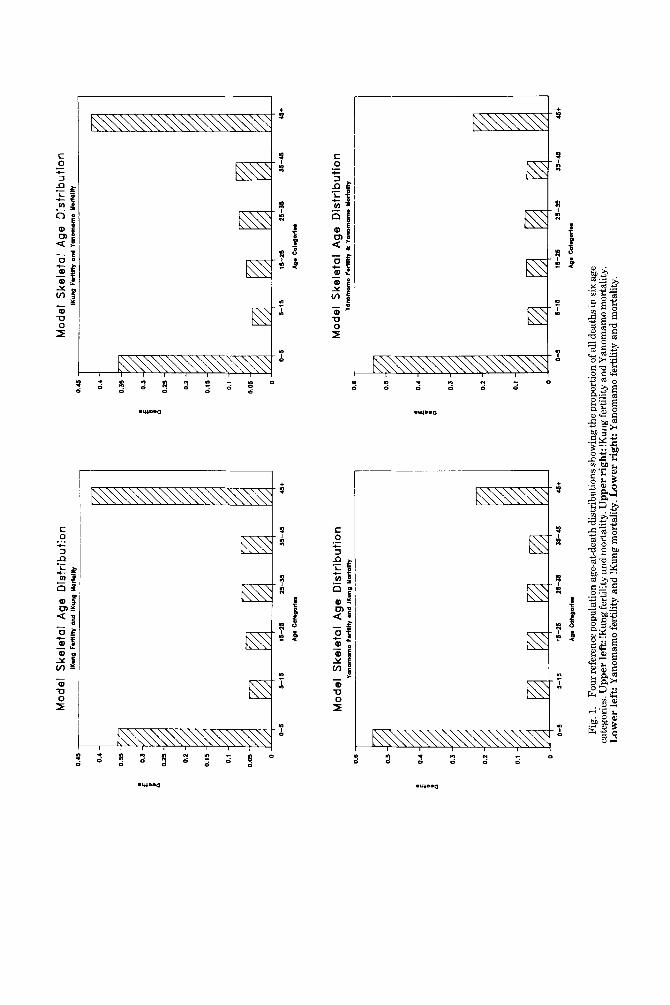
The four reference age-at-death distribu- tions are shown in Figure 1. Variation in fer- tility results in discernible differences in age- at-death schedules, whereas variation in mortality levels has a negligible effect on the overall shape of these distributions. This is the basis of our statement that inferences about mortality rates are inherently weak when based on age-at-death information alone. These findings are in accord with pre- vious work suggesting that skeletal age in archaeological samples is informative about fertility but not necessarily mortality (Sat- tenspiel and Harpending, 1983).
The matched !Kung and Yanomamo vital rates yield intrinsic rates of growth (r) of zero; i.e., these are stationary populations. !Kung fertility with Yanomamo mortality and Yano- mamo fertility with !Kung mortality yield growth rates of -0.017 and 0.018, respec- tively. Note that the growth rate cannot be determined from the age-at-death distribu- tions alone.
The four histograms in Figure 1 also show that perhaps the best statistic to distinguish low from high fertility populations using solely age-at-death information is the ratio of skeletons under five years of age to those over
45 years. High-fertility populations have a high ratio, while low-fertility populations have a much lower ratio, with the greater number of skeletons expected to be those belonging to people who lived longer than 45 years.
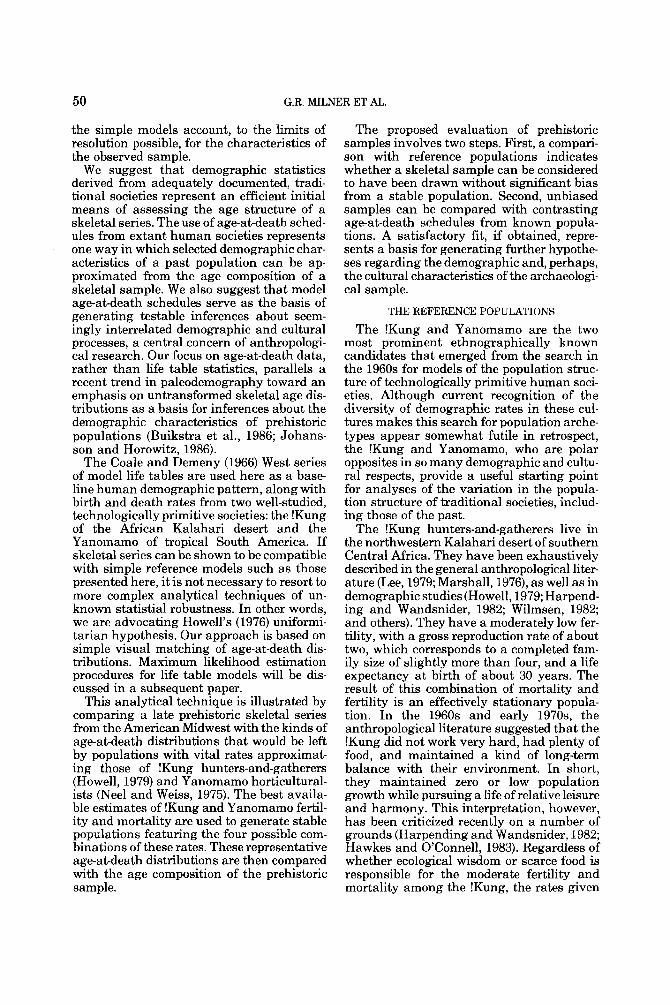
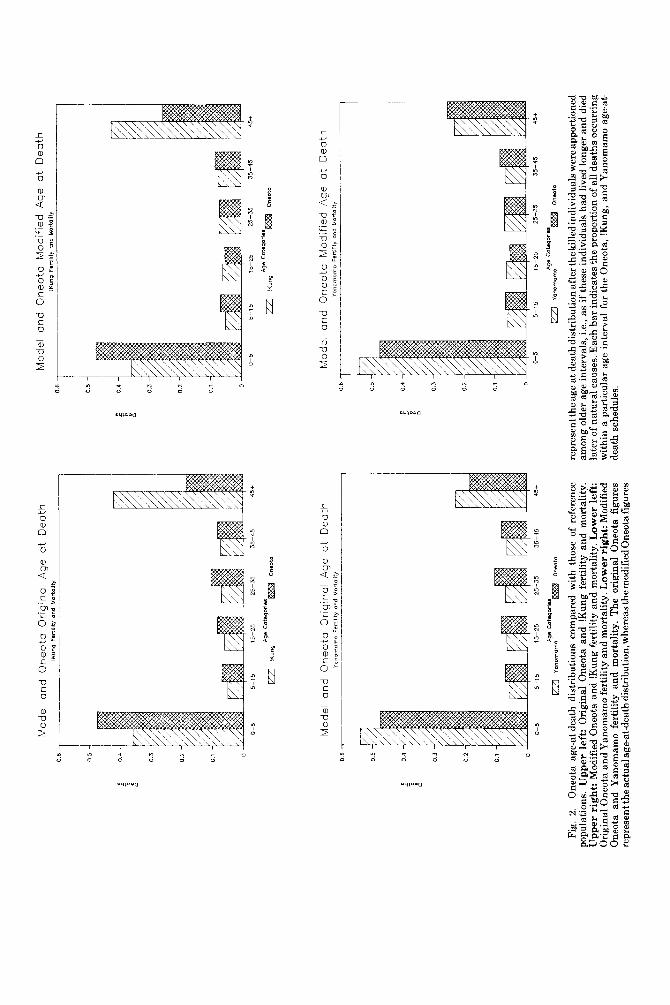
The histograms in Figure 2 contrast the reference age-at-death schedules featuring !Kung and Y anomamo fertility and mortality with both the original and modified Oneota distributions. The Oneota sample closely ap- proximates the Yanomamo pattern, with the modified age-at-death distribution represent- ing an especially good fit. These results sug- gest that the Oneota were a high-fertility population, as opposed to a low-fertility group like the !Kung. A comparison of the two Oneota age distributions illustrates the extent to which a significant risk of premature, conflict-related death experienced by all adults can affect the observable age-at-death pattern generated from skeletal remains.
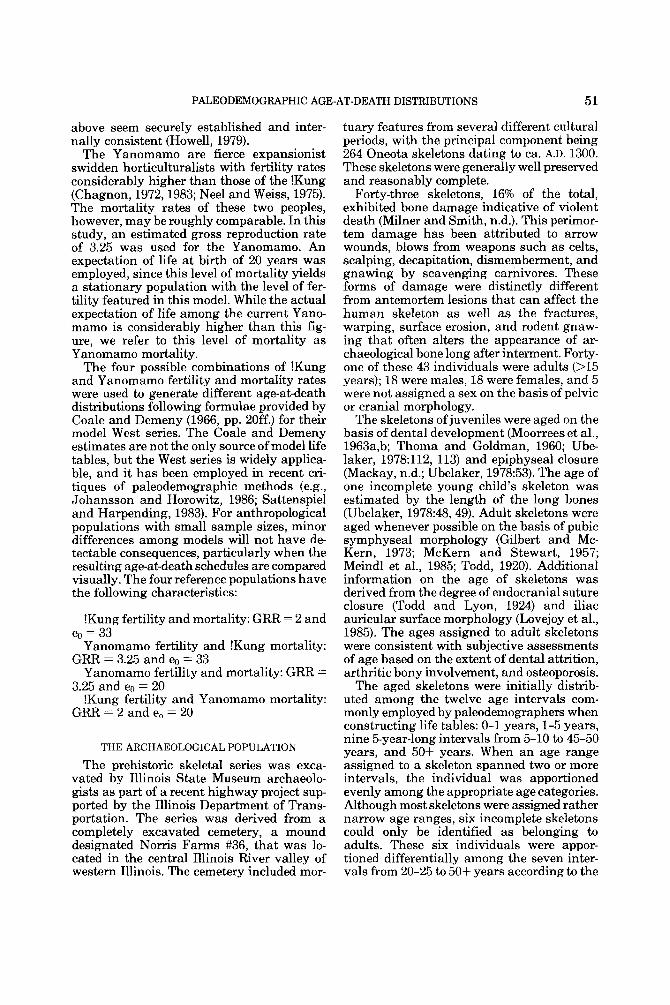
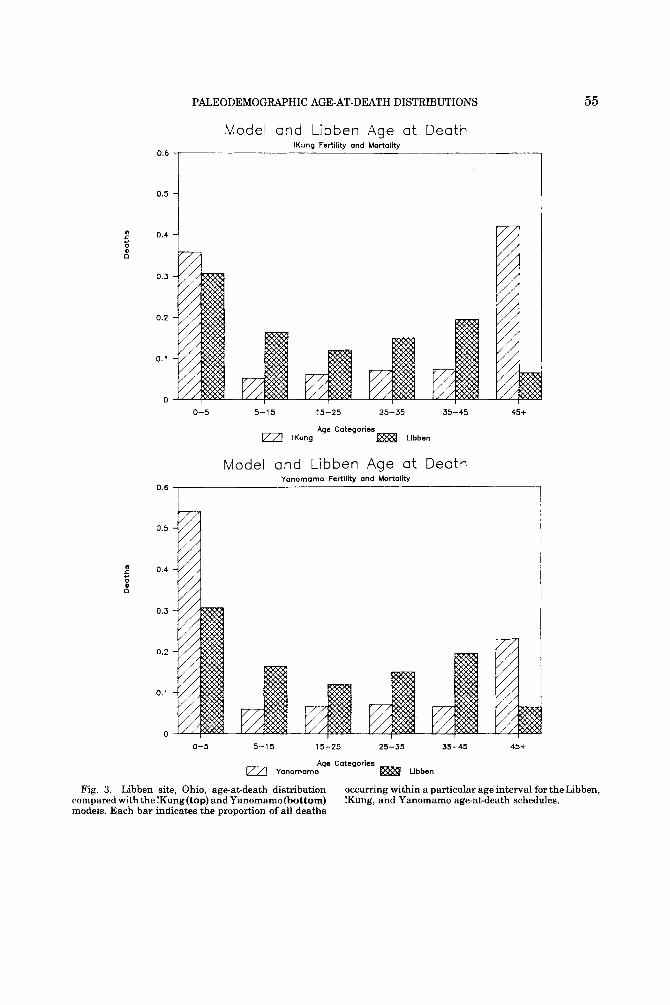
The final set of histograms (Fig. 3) con- trasts the !Kung and Yanomamo reference age-at-death distributions with that obtained from a large, carefully aged, and often cited skeletal series, the Libben collection also from the American Midwest (Lovejoy et al., 1977). An overenumeration of young and middle adult deaths and an underenumera- tion of 45+ years deaths are readily apparent. Our results parallel those of Howell (1982), who noted that the Libben population pyra- mid as reconstructed from the Lovejoy et al. (1977) life table was improbable by the stan- dards of historically known populations. There are, of course, any number of demo- graphic, cultural, archaeological, analytical, and sampling reasons why a particular age- at-death distribution generated from a skele- tal collection might not be a n unbiased reflec- tion of the deaths that actually occurred in a prehistoric population. This underscores the importance of first assessing the fit between archaeological and reference distributions before extrapolating from skeletons to past population mortality experience.
Lovejoy et al. (1977) suggested that a com- paratively low level of disease stress among children and considerable violence among adult males accounted for the peculiar Libben age distribution. The Oneota data, however, show high childhood mortality rates consistent with the Coale and Demeny (1966) models and evidence of appreciable violence (i.e., one-third of all adult deaths) without the disproportionate representation of adult
Mod
el S
kele
tal
Age
Dis
trib
utio
n IK
ung
Fom
lW a
nd IK
ung
Mo
ttd
w
I-~- 1
Mod
el S
kele
tal
Age
Dis
trib
uti
on
llu
np
FM
IW a
nd
Yan
om
mm
Mw
talW
0.
45
0.4
0.35
0.3
0.25
0.2
0.15
0.1
0.05
0
0-5
5-15
15
-25
25-3
5 55
-45
45+
Ao.
M.g
od
u
Mod
el S
kele
tal
Age
Dis
trib
utio
n Y
ano
rnam
o F
Un
lw m
d lK
mg
MM
ldW
0-5
5-15
15
-25
25-3
5 35
-45
45+
AW
cd
qo
du
Mod
el S
kele
tal
Age
Dis
trib
uti
on
o
.~ ,
Yana
mom
o F.m
W
L Y
onom
orno
Mor
iaIW
0.5
Q.4
0.3
0.2
0.1 0
-
0-5
5-15
15
-25
25-3
5 35
-43
4.
CdW
OdU
Fig.
1.
Four
refe
renc
e pop
ulat
ion
age-
at-d
eath
dist
ribu
tions
show
ing
the
prop
ortio
n of
all
deat
hs in
six a
ge
cate
gori
es. U
pper
left
: !K
ung f
ertil
ity a
nd m
orta
lity.
Upp
er ri
ght:
!Kun
g fer
tility
and
Yan
omam
o m
orta
lity.
L
ower
left
: Yan
omam
o fe
rtili
ty a
nd !K
ung
mor
talit
y. L
ower
rig
ht: Y
anom
amo
fert
ility
and
mor
talit
y.
Mo
de
l a
nd
On
eo
ta O
rig
ina
l A
ge
at
De
ath
1K
unq
Fert
ility
an
d M
ort
alit
y
05 -1
I
0.4
0-5
5-1
5
15
-25
2
5-3
5
35-4
5 4
51
Age
ca
teg
om
s
[zzi
'Ku
ng
o
nao
to
Mo
de
l a
nd
On
eo
to O
rig
ina
l A
ge
at
De
ath
Y
on
orn
orn
o F
ertil
ity
on
d M
orto
lity
-1
06 7-p-
j 04
0-5
5
-15
15
-25
25
-35
35
-45
45
f
Age
Cat
egor
ies
Ya"
om
am.3
o
nso
ta
Fig.
2.
One
ota
age-
at-d
eath
dis
trib
utio
ns c
ompa
red
with
tho
se o
f re
fere
nce
popu
latio
ns.
Upp
er l
eft:
Ori
gina
l O
neot
a an
d !K
ung
fert
ility
and
mor
tali
ty.
Upp
er r
ight
: M
odif
ied
One
ota
and
!Kun
g fe
rtili
ty a
nd m
orta
lity.
Low
er left:
Ori
gina
l One
ota
and
Yan
omam
o fe
rtili
ty a
nd m
orta
lity
. Low
er r
ight
: M
odif
ied
One
ota
and
Yan
omam
o fe
rtili
ty a
nd m
orta
lity
. T
he o
rigi
nal
One
ota
figu
res
repr
esen
t the
actu
al a
ge-a
t-de
ath d
istr
ibut
ion,
whe
reas
the m
odif
ied O
neot
a fig
ures
Mo
de
l a
nd
On
eo
to M
od
ifie
d A
ge
at
De
ath
!K
ung
Fert
ility
an
d M
orta
lity
06
I
05 4
fn 0.
4
A 0.3
0.2
0.1
0 0-5
5-1
5
35
-45
45
+ 15
-25
25-3
5
Age
co
teg
ori
er
a 'Ku
ng
on
eota
Mo
de
l a
nd
On
eo
to M
od
ifie
d A
ge
a
t D
ea
th
__
Y
on
om
om
o F
ertil
ity
on
d N
ori
oiit
y O
Kr
--
0.5 -E
l
0-5
5-
15
15-2
5 2
5-3
5
35-4
5 4
5+
repr
esen
t the
age-
at-d
eath
dist
ribu
tion
afte
r the
kille
d in
divi
dual
s wer
e app
ortio
ned
amon
g ol
der
age
inte
rval
s, i.
e., a
s if
thes
e in
divi
dual
s had
live
d lo
nger
and
die
d la
ter o
f na
tura
l cau
ses.
Eac
h ba
r in
dica
tes t
he p
ropo
rtio
n of
all
deat
hs o
ccur
ring
w
ithin
a p
artic
ular
age
inte
rval
for
the
One
ota,
!K
ung,
and
Yan
omam
o ag
e-at
- de
ath
sche
dule
s.
PALEODEMOGRAPHIC AGE-AT-DEATH DISTRIBUTIONS
Model and Libben Age a t Death 1Kung Fertility and Mortality
0.4
0.3
0.2
0.1
0 0-5 5-1 5 15-25 25-35 35-45 45+
Age Categories IKung = Libben
Model and Libben Age a t Death Yonomama Fertility and Mortality
o.6 I 0.5
0.4
0.3
0.2
0.1
0 0-5 5-15 15-25 25-35 35-45 45+
Age Categories rZa Yanomamo = Ubben
55
Fig. 3. Libben site, Ohio, age-at-death distribution compared with the !Kung (top) and Yanomamo (bottom) models. Each bar indicates the proportion of all deaths
occumng within a particular age interval for the Libben, !Kung, and Yanomamo age-at-death schedules.
56 G.R. MILNER ET AL.
skeletons found at the Libben site. We con- clude that the Libben pattern probably repre- sents, at least in part, a sampling phe- nom enon.
DISCUSSION
The reference age-atdeath schedules pre- sented here accommodate several difficulties encountered when analyzing skeletal series. The intervals are also compatible with those usually featured in previously published paleodemographic studies.
Ten-year age intervals describe the mortal- ity experience of early to middle adulthood, and the reference schedules terminate in a 45+- years category. The use of these rela- tively broad categories acknowledges the problems associated with aging adult skele- tons, especially those of elderly individuals. Although we call attention to the signifi- cance of the ratio of skeletons aged less than 5 years to those over 45 years, we hasten to add that this ratio cannot be applied indis- criminately to skeletal series, and its utility is limited by a variety of nonbiological factors. The underenumeration of the young, espe- cially infants, is a common feature of skeletal collections and results from the nature of prehistoric mortuary practices, the poor pres- ervation of small bones, and excavation biases (see Buikstra et al., 1986; aspects of this issue were recognized over two hundred years ago by Jefferson, 1972:99).
Although the well-studied !Kung and Yan- omamo are often regarded as representatives of hunting-and-gathering and horticultural ways of life, respectively, we hesitate to iden- tify the age-at-death distributions presented here as archetypal mortality schedules of societies practicing distinctly different sub- sistence strategies. The seasonal rounds, diets, settlement configurations, group sizes and compositions, and social structures of ethnographically known societies subsumed within each of these two subsistence strategy categories differ considerably. All available evidence suggests that as more is learned about the adaptive stances of prehistoric cul- tures, each of these broadly conceived catego- ries will be found to encompass an even more heterogeneous group of societies. For exam- ple, there are hunters-and-gatherers, such as the coastal Asmat of New Guinea (Van Ars- dale, 1978a,b), who seem to follow the Yano- mamo model demographically and culturally, most particularly in terms of their fierce nature, sedentary lifestyle, and focus on rea-
sonably productive and spatially fixed re- sources. There are also horticultural peoples, such as the Gainj of New Guinea (Wood et al., 1985), with demographic rates similar to those of the !Kung.
Nevertheless, the close correspondence between the Yanomamo and Oneota age-at- death distribution is consistent with what we would expect given current archaeological interpretations of the latter culture. While there were a number of regional and tem- poral Oneota cultural variants in the late prehistoric upper Midwest, these people were village horticulturalists with settlement sys- tems and subsistence strategies varying somewhat in response to local natural and, presumably, social settings (Brose, 1978; Brown, 1982; Stoltman, 1983). In addition, their settlements were frequently palisaded, probably for defensive purposes. In the cen- tral Illinois River valley, there are several known Oneota habitation sites, and they represent an expansion of this cultural tradi- tion into the region (Harn, 198092-83; Smith, 1951).
The demographic and cultural parallels between the archaeological sample and eth- nographic model are underscored by the reconstructed central Illinois River valley Oneota pattern of warfare, which in several respects resembles conflict documented among the present-day Yanomamo. For the latter group, one-third of adult male deaths have been attributed to internecine raiding that varies in intensity over time and among villages (Chagnon, 1972). In the Oneota pop- ulation, both males and females were killed in equal numbers (Milner and Smith, n.d.). They frequently received their wounds on the sides or back of the body, and many were somewhat incapacitated at the time of death by existing skeletal conditions that would have interfered with their ability to fight or flee. Most of these individuals were not interred for some time after death, with enough time elapsing for scavengers to feed on exposed bodies, damaging bones and dis- articulating skeletons. Burial, when it oc- curred, took place in graves containing at most a few individuals that were distributed throughout the village cemetery. Taken to- gether, the trauma, postmortem bone destruc- tion, and burial treatment are consistent with that expected of a population subjected to continual raiding where victims were am- bushed at some distance from the protection of their settlement, killed, and only later recovered for burial.
PALEODEMOGRAPHIC AGE-AT-DEATH DISTRIBUTIONS 57
CONCLUSIONS
We conclude that the age distribution of a prehistoric skeletal sample yields less infor- mation about mortality experience than it does about fertility. A means of generating age-at-death schedules from the vital rates of known, modern populations is presented as an initial step in the process of exploring the demographic and, perhaps, the cultural char- acteristics of prehistoric populations. The close correspondence between the reference and archaeological age-at-death distributions indicates that the Oneota skeletal series is likely to have been derived from an unbiased sampling of a stable population. Finally, the archaeological population probably was char- acterized by fertility rates approximating those of the Yanomamo. The low-fertility !Kung type of demographic pattern is clearly excluded by our data. The correspondence between the archaeological sample and the Yanomamo age-at-death distribution coupled with skeletal evidence for a significant risk of violent death raises the strong possibility that a model of warlike horticulturalists best characterizes the Oneota of western Illinois. This model can probably be applied to other late prehistoric, upper midcontinental popu- lations as well.
ACKNOWLEDGMENTS
The Norris Farms #36 excavations were conducted by Illinois State Museum archae- ologists, and the work was supported by the Illinois Department of Transportation. The study of the skeletal series was facilitated by the generous loan of the collection by the Illi- nois State Museum. The results of ongoing studies focusing on these remains and ac- companying materials demonstrate the re- search significance of contract-related archae- ological investigations. The assistance of Virginia G. Smith in the analysis of the skeletal remains is gratefully appreciated, as are the comments of LuAnn Wandsnider on a draft of this paper.
LITERATURE CITED
Acsadi G, and Nemeskeri J (1970) History of Human Life Span and Mortality. Budapest: Akademiai Kiado.
Angel J L (1969) The bases of paleodemography. Am. J . Phys. Anthropol. 30:427-438.
Bocquet-Appel JP, and Masset C (1982) Farewell to paleodemography. J . Hum. Evol. 11~321-333.
Brose DS (1978) Lateprehistoryofthe Illinoisarea. In BG Trigger (ed.): Handbook of North American Indians: Northeast, Val. 15. Washington: Smithsonian Institu- tion, pp. 569-582.
Brown JA (1982) What kind of economy did the Oneota have? In GE Gibbon (ed.): Oneota Studies. Minneapolis: University of Minnesota, pp. 107-112.
Buikstra JE, and Konigsberg LW (1985) Paleodemog- raphy: Critiques and controversies. Am. Anthropol. 87~316-333.
Buikstra JE , Konigsberg LW, and Bullington J (1986) Fer- tility and the development of agriculture in the prehis- toric Midwest. Am. Antiq. 51~528-546.
Chagnon NA (1972) Tribal social organization and genetic microdifferentiation. GA Harrison and AJ Boyce (eds.): The Structure of Human Populations. Oxford: Claren- don Press, pp. 252-282.
Chagnon NA (1983) Yanomamo: The Fierce People, 3rd ed. New York: Holt, Rinehart and Winston.
Coale AJ, and Demeny P (1966) Regional Model Life Tables and Stable Populations. Princeton: Princeton Univer- sity Press.
Gage T, and Dyke B (1986). Parameterizing abridgedmor- tality tables: The Siler three-component hazard model. Hum. Biol. 58~275-291.
Gilbert BM, and McKern TW (1973) A method for aging the female 0s pubis. Am. J. Phys. Anthropol. 38:31-38.
Harn AD (1980) The prehistory of Dickson Mounds: The Dickson Excavation, 2nd ed. Reports of Investigations 35. Springfield Illinois State Museum.
Harpending HC, and Wandsnider L (1982) Population structures of Ghanzi and Ngamiland !Kung.In M Craw- ford (ed.): Current Developments in Anthropological Genetics 11. New York: Plenum Press, pp. 29-50.
Hawkes K, and O'Connell J (1983) Affluent hunters? Some comments in light of the Alyawara case. Am. Anthropol. 83~622-626.
Howell N (1976) Toward a uniformitarian theory of human paleodemography. J . Hum. Evol. 525-40.
Howell N (1979) Demography of the Dobe !Kung. New York: Academic Press.
Howell N (1982) Village composition implied by a paleo- demographic life table: The Libben site. Am. J . Phys. Anthropol. 59263-269.
Jefferson T (1972) Notes on the state of Virginia. W Peden (ed.): New York: W.W. Norton (1787 London: Stockdale).
Johansson SR, and Horowitz S (1986) Estimating mortal- ity in skeletal populations: Influence of the growth rate on the interpretation of levels and trends during the transition to agriculture. Am. J . Phys. Anthropol. 71:233-250.
Lee RE (1979) The !Kung San: Men, Women, and Work in a Foraging Society. Cambridge: Cambridge University Press.
Lovejoy CO, Meindl RS, Mensforth RP, and Barton TJ (1985) Chronological metamorphosis of the auricular surface of the ilium: A new method for the determina- tion of adult skeletal age at death. Am. J. Phys. Anthropol. 68~15-28.
Lovejoy CO, Meindel RS, Pryzbeck TR, Barton TS, Heiple KC, and Kotting D (1977) Paleodemography of the Libben site, Ottawa County, Ohio. Science 198:291-293.
MacKay RH (n.d.) Skeletal Maturation, Chart. Rochester: Eastman Kodak Co.
Marshall L (1976) The !Kung of Nyae Nyae. Cambridge: Harvard University Press.
McKem TW, and Stewart TD (1957) Skeletal Age Changes in Young American Males. Technical Report EP-45. Natick: Quartermaster Research and Development Command.
Meindl RS, Lovejoy CO, Mensforth RP, and Walker RA (1985) A revised method of age determination using the 0s pubis, with a review and tests of accuracy of other
58 G.R. MILNER ET AL.
current methods of pubic symphyseal aging. Am. J . Phys. Anthropol. 68:29-45.
Milner GR, and Smith VG (n.d.) Oneota human skeletal remains. Unpublished manuscript.
Moore JA, Swedlund AC, and Armelagos GJ (1975) The use of life tables in paleodemography. In AC Swedlund (ed.): Population Studies in Archaeology and Biological Anthropology. Memoir 30. Society for American Archae- ology, pp. 57-70.
Moorrees CFA, Fanning EA, and Hunt EE (1963a) Age variation of formation stages for ten permanent teeth. J . Dent. Res. 42:1490-1502.
Moorrees CFA, Fanning EA, and Hunt EE (1963b) For- mation and resorption of three deciduous teeth in chil- dren. Am. J . Phys. Anthropol. 21:205-213.
Nee1 JV, and Weiss KM (1975) The genetic structure of a tribal population, the Yanomama Indians: XII. Bio- demographic studies. Am. J . Phys. Anthropol. 4225-52.
Sattenspiel L and Harpending HC (1983) Stable popula- tions and skeletal age. Am. Antiq. 48:489-498.
Smith HG (1951) The Crable Site, Fulton County, Illinois. Anthropological Papers 7. Ann Arbor: Museum of Anthropology, University of Michigan.
Stoltman J B (1983) Ancient peoples of the upper Missis- sippi River valley. In J Wozniak (ed.): HistoricLifestyles in the Upper Mississippi River valley. New York: Uni- versity Press of America, pp. 197-255.
Thoma K, and Goldman H (1960) Oral Pathology. St. Louis: CV Mosby.
Todd TW (1920) Age changes in the pubic bone: I. The male white pubis. Am. J . Phys. Anthropol. 3:285-334.
Todd TW, and Lyon DW (1924) Endocranial suture clo- sure; its progress and age relationship: I. Adult males of white stock. Am. J . Phys. Anthropol. 7:326-384.
Ubelaker DH (1978) Human Skeletal Remains: Excava- tion, Analysis, and Interpretation. Chicago: Aldine.
Van Arsdale PW (1978a) Activity patterns of Asmat hunter-gatherers: A time budget analysis. Mankind 1 I :453-460.
Van Arsdale PW (1978b) Population dynamics among Asmat hunter-gatherers of New Guinea: Data, methods, comparisons. Hum. Ecol. 6:435-467.
Van Gerven DP, and Armelagos GJ (1983) “Farewell to paleopathology?” rumors of its death have been greatly exaggerated. J . Hum. Evol. 12353-360.
Wilmsen EN (1982) Studies of diet, nutrition, and fertility among a group of Kalahari Bushmen in Botswana. SOC. Sci. Inform. 21:95-125.
Weiss KM (1973) Demographic models for anthropology. Memoir 27. Society for American Archaeology.
Wood JW, Lai D, Johnson PL, Campbell KL, and Maslar IA (1985) Lactation and birth spacing in highland New Guinea. J . Biosoc. Sci. [Suppl.] 9:159-173.
![[PPT]Analysis of Algorithms - Utah State Universitydigital.cs.usu.edu/~allanv/cs5050/Goodrich/Chap9.ppt · Web viewPattern Matching Pattern Matching * Pattern Matching * Our algorithm](https://img.pdfslide.net/doc/110x75/5abed1fe7f8b9a5d718d8042/pptanalysis-of-algorithms-utah-state-allanvcs5050goodrichchap9pptweb-viewpattern.jpg)