Embed Size (px)
Citation preview
1154
Conclusions
Our investigations confirm the findings of Morganand his colleagues 6 that no special advantage isobtained by dividing cortical thickness by externaldiameter. They do, however, show that estimates ofthe cross-sectional area of the cortex made from X-raysare directly related to chemical measurements of ashcontent. Moreover, this calculation is based on thesame simple measurements of the hand X-ray that areused to estimate cortical thickness.We are indebted to Mr. R. J. C. Stewart and Miss H. M.
Sheppard, of the London School of Hygiene and TropicalMedicine, for histological examinations and chemical analysis.
Requests for reprints should be addressed to A. N. E.-S.,St. Pancras Hospital, 4 St. Pancras Way, London N,W,1.
REFERENCES
1. Garn, S. M. Am. J. clin. Nutr. 1962, 10, 59.2. Barnett, E., Nordin, B. E. C. Clin. Radiol. 1960, 11, 166.3. Pridie, R. B. Br. J. Radiol. 1967, 40, 251.4. Pridie, R. B., Higgins, P. McR., Yates, J. M. Clin. Radiol. 1968,
19, 148.5. Morgan, D. B., Spiers, F. W., Pulvertaft, C. N., Fourman, P. ibid.
1967, 18, 101.
PATTERN OF DEVELOPMENT AND
LOSS OF BONE WITH AGE
A. N. EXTON-SMITH P. H. MILLARD*
University College Hospital, LondonP. R. PAYNE ERICA F. WHEELER
Department of Human Nutrition,London School of Hygiene and Tropical Medicine
* Present address: St. George’s Hospital, Tooting, London S.W.17.
Summary Calculation of cortical area of bonebased on measurements made on a
hand radiograph is a reliable method of determiningthe amount of bone in the shaft of a metacarpal, andthe technique is sensitive enough to disclose signifi-cant changes occurring during a period of about 6years. Construction of the percentile-ranking curvesfor the ratio cortical area/total surface area of boneenables an individual’s skeletal status to be assessedin relation to others of the same age and sex. Only bytaking age into account in the adoption of standards ofnormality is it possible to assess the effect of otherfactors which may influence bone loss or development.Clinically the method has important applications inevaluating the effects of gastrectomy or of therapeuticagents for the treatment of osteoporosis. Longitudinalstudies in elderly women show continued loss ofbone in extreme old age, as revealed by a fall parallelto the percentile-ranking curves. Similar studiesare required in very old men in order to confirm theview that better skeletal development is probablyonly one of the characteristics to be found in thosewho survive to extreme old age.
Introduction
AGEING is accompanied by a loss of bone from theskeleton. Albright and Reifenstein 1 recognised a
clinical syndrome of osteoporosis and maintained thatalthough " a moderate degree of osteoporosis of thespine is almost physiological after the menopause ",
it is necessary to distinguish between a loss of bonewhich is physiological for the subject’s age, and aclinical syndrome of osteoporosis in which the indi-vidual has lost a pathologically excessive amount ofbone.More recently, Newton-John and Morgan have
given support to the alternative concept that theclinical syndrome of osteoporosis can result solelyfrom the loss of bone with age. These authors andGarn and his colleagues 3.4 have suggested that thebest natural protection against the sequelae of boneloss is a large skeletal mass at maturity. Newton-John and Morgan 2 have formulated a model of boneloss with age based on the analysis of data in 30
publications describing the amount in relation to
age and sex. For the most part this has been deter-mined by measurement of the cortical thickness ofthe second metacarpal in hand radiographs or bythe use of the metacarpal index proposed by Barnettand Nordin.5 Calculation of cortical area has beenshown to give a better indication of bone quantitythan either of these parameters. We have now inves-tigated the changes in amount of bone with age usingthis calculation.
SubjectsMeasurements were made on the hand radio-
graphs of the following subjects:i. Patients attending the casualty department with possiblehand injuries.ii. Elderly people living at home who participated in amedical and nutrition survey in the London Borough ofCamden.
iii. Participants in similar surveys of old people sponsoredby the Department of Health in Angus, Cambridge,Glasgow, and Sunderland.The total numbers in groups (i)-(iii) were 481
males and 483 females, aged between 5 and 90 years.Patients with evidence of hemiplegia or rheumatoidarthritis or other hand deformity were excluded.iv. 18 younger patients with osteoporosis who were beingtreated by Prof. C. E. Dent in the metabolic unit of
University College Hospital.v. 16 elderly women who participated in the KingEdward’s Hospital Fund Nutrition Survey were followedup 61/ years later as a longitudinal study.
MethodsMeasurementsThe length (L) of the second metacarpal was measured
with a millimetre rule, and the external diameter (D)
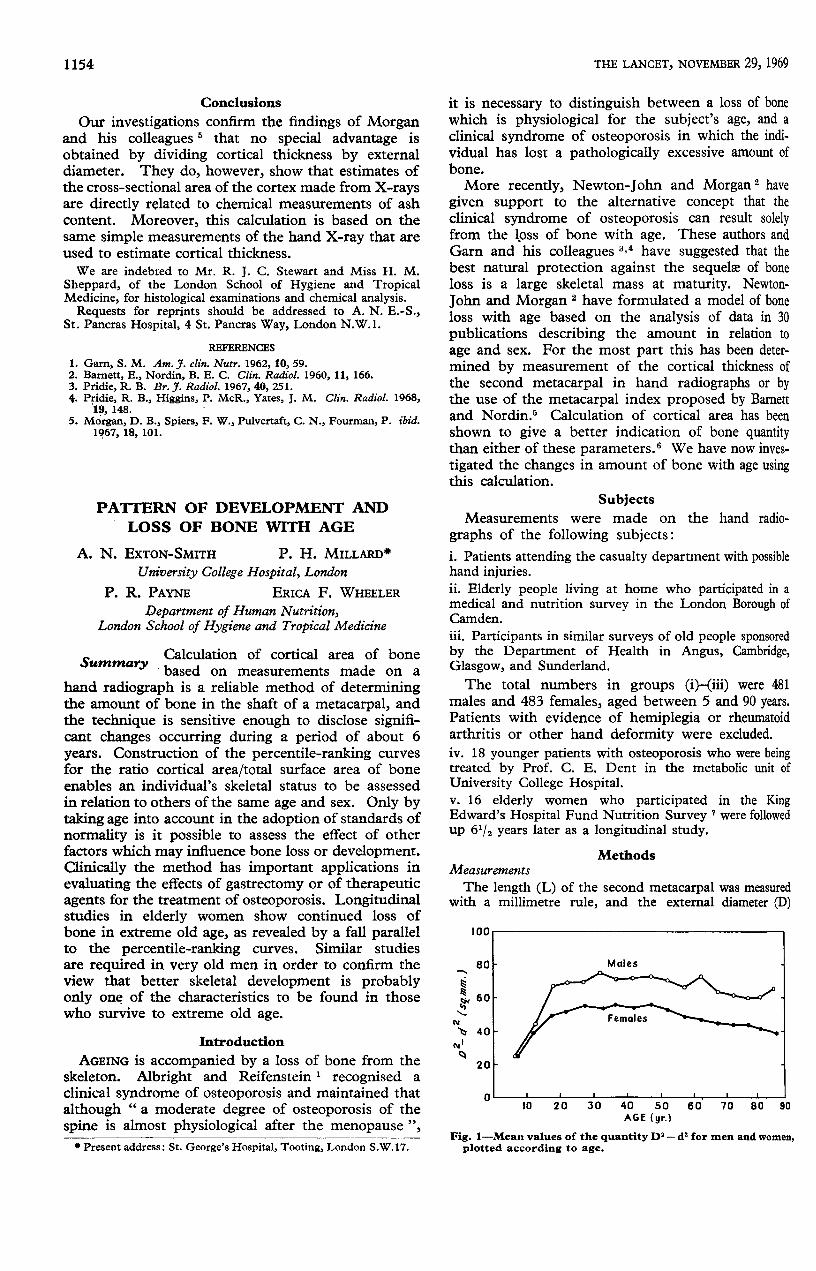
Fig. 1-Mean values of the quantity D’ — d for men and women,plotted according to age.
1155
and internal diameter (d) of the cortex at the midpoint ofthe shaft were measured with a Vernier micrometer.
CalculationsIn the absence of information about the quality of the
bone material, the cross-sectional area of the cortex (repre-sented by D—d) is the best measure of the amount ofbone and of its fitness to withstand stresses. For this
reason, changes in this measurement during growth andageing are of considerable interest (fig. 1).To make valid comparisons between the bones of
different individuals, variations in skeletal size must betaken into account. To correct for this, we have takenthe product of length and external shaft diameter (D x L)as a measure of the size of the bone. In fact, this quantityis well correlated with cortical area. (For age groups30-60, r=0-86, n=249).Thus the dimensionless ratio cortical area/surface area,
(D2-d2)’—_—’, has been calculated. Fig. 2 shows that this cor-rection minimises the effect of differences in skeletal sizebetween men and women.
Results
Fig. 1 shows the mean cortical area for men andfor women in groups I to III, grouped in 5-year periodsbetween the ages of 55 and 90 years. There is a rapidincrease in area during the period of growth, buteven after the increase in height has ceased at 17-18years there is continued development of bone foranother 12 years or so. Between the ages of 50 and
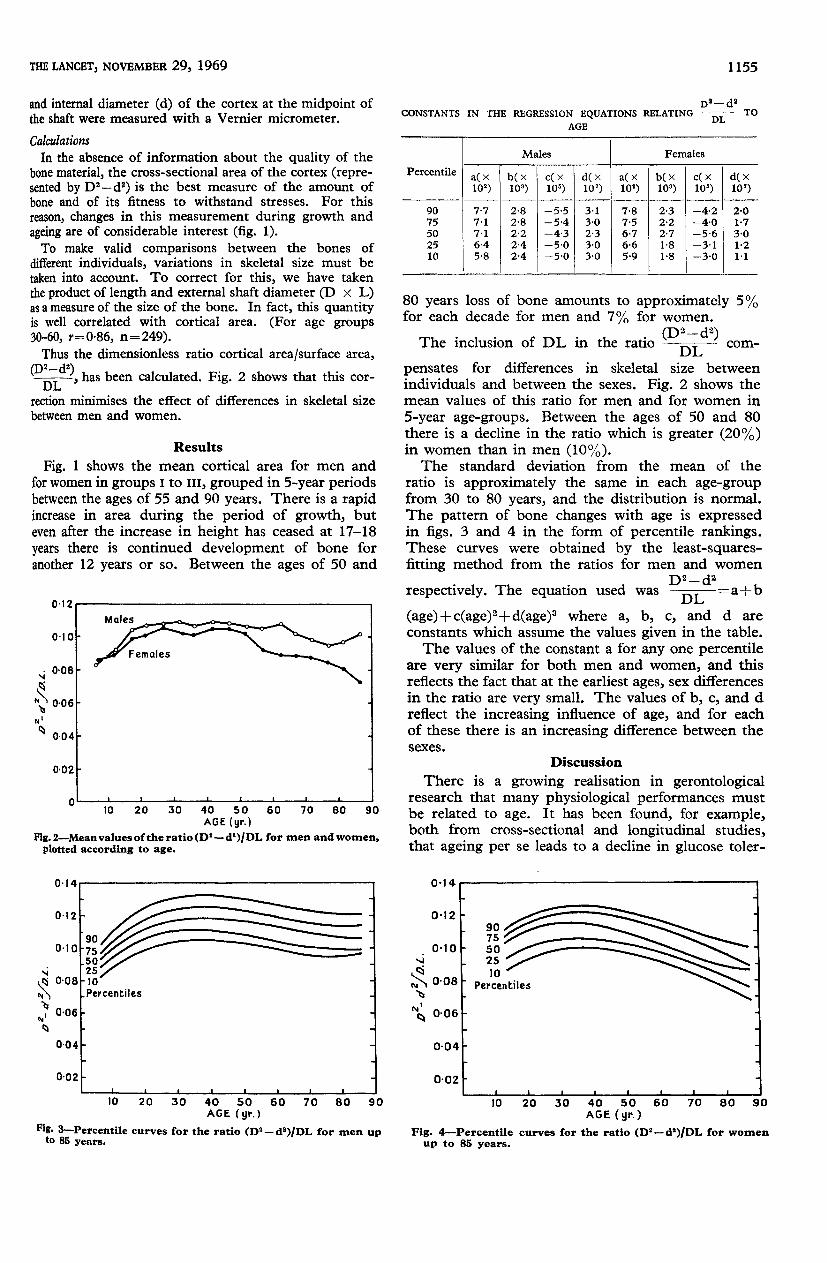
Fig. 2-Meanvalues of the ratio (D"-d")/DL for men and women,plotted according to age.
CONSTANTS IN THE REGRESSION EQUATIONS RELATING TO
AGE
80 years loss of bone amounts to approximately 5%for each decade for men and 7% for women.
The inclusion of DL in the ratio com-
pensates for differences in skeletal size betweenindividuals and between the sexes. Fig. 2 shows themean values of this ratio for men and for women in5-year age-groups. Between the ages of 50 and 80there is a decline in the ratio which is greater (20%)in women than in men (10%).The standard deviation from the mean of the
ratio is approximately the same in each age-groupfrom 30 to 80 years, and the distribution is normal.The pattern of bone changes with age is expressedin figs. 3 and 4 in the form of percentile rankings.These curves were obtained by the least-squares-fitting method from the ratios for men and women
respectively. The equation used was =a+b
(age)+c(age)2+d(age)3 where a, b, c, and d are
constants which assume the values given in the table.The values of the constant a for any one percentile
are very similar for both men and women, and thisreflects the fact that at the earliest ages, sex differencesin the ratio are very small. The values of b, c, and dreflect the increasing influence of age, and for eachof these there is an increasing difference between thesexes.
Discussion
There is a growing realisation in gerontologicalresearch that many physiological performances mustbe related to age. It has been found, for example,both from cross-sectional and longitudinal studies,that ageing per se leads to a decline in glucose toler-
r"’.""’’’’ % to- -I
Fig. 3-Percentile curves for the ratio (D"—d’)/DL for men upto 85 years.
Fig. 4-Percentile curves for the ratio (D2-d2)/DL for womenup to 85 years.
1156
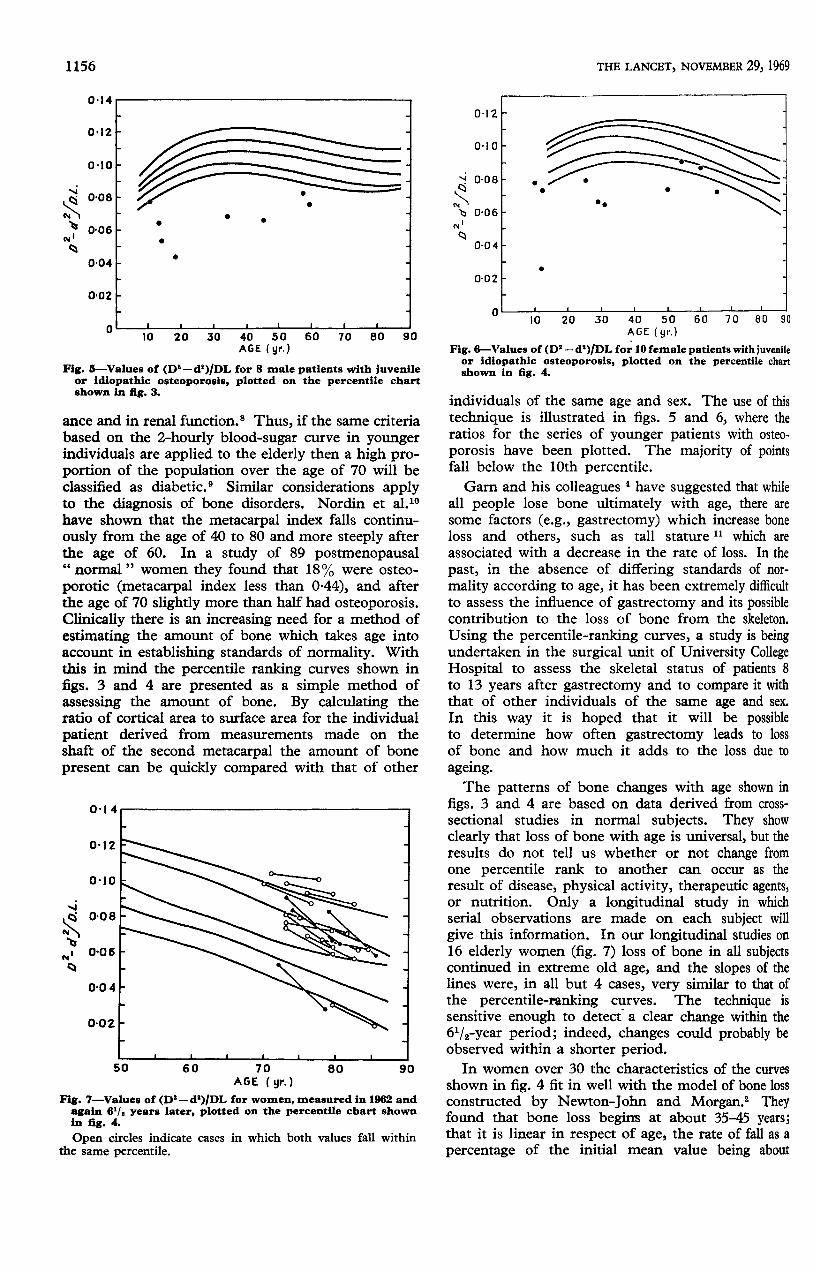
Fig. 5—Values of (D2—d2)/DL for 8 male patients with juvenileor idiopathic osteoporosis, plotted on the percentile chartshown in fig. 3.
ance and in renal function.8 Thus, if the same criteriabased on the 2-hourly blood-sugar curve in youngerindividuals are applied to the elderly then a high pro-portion of the population over the age of 70 will beclassified as diabetic. 9 Similar considerations applyto the diagnosis of bone disorders. Nordin et al.10have shown that the metacarpal index falls continu-ously from the age of 40 to 80 and more steeply afterthe age of 60. In a study of 89 postmenopausal" normal " women they found that 18% were osteo-porotic (metacarpal index less than 0-44), and afterthe age of 70 slightly more than half had osteoporosis.Clinically there is an increasing need for a method ofestimating the amount of bone which takes age intoaccount in establishing standards of normality. Withthis in mind the percentile ranking curves shown infigs. 3 and 4 are presented as a simple method ofassessing the amount of bone. By calculating theratio of cortical area to surface area for the individualpatient derived from measurements made on theshaft of the second metacarpal the amount of bonepresent can be quickly compared with that of other
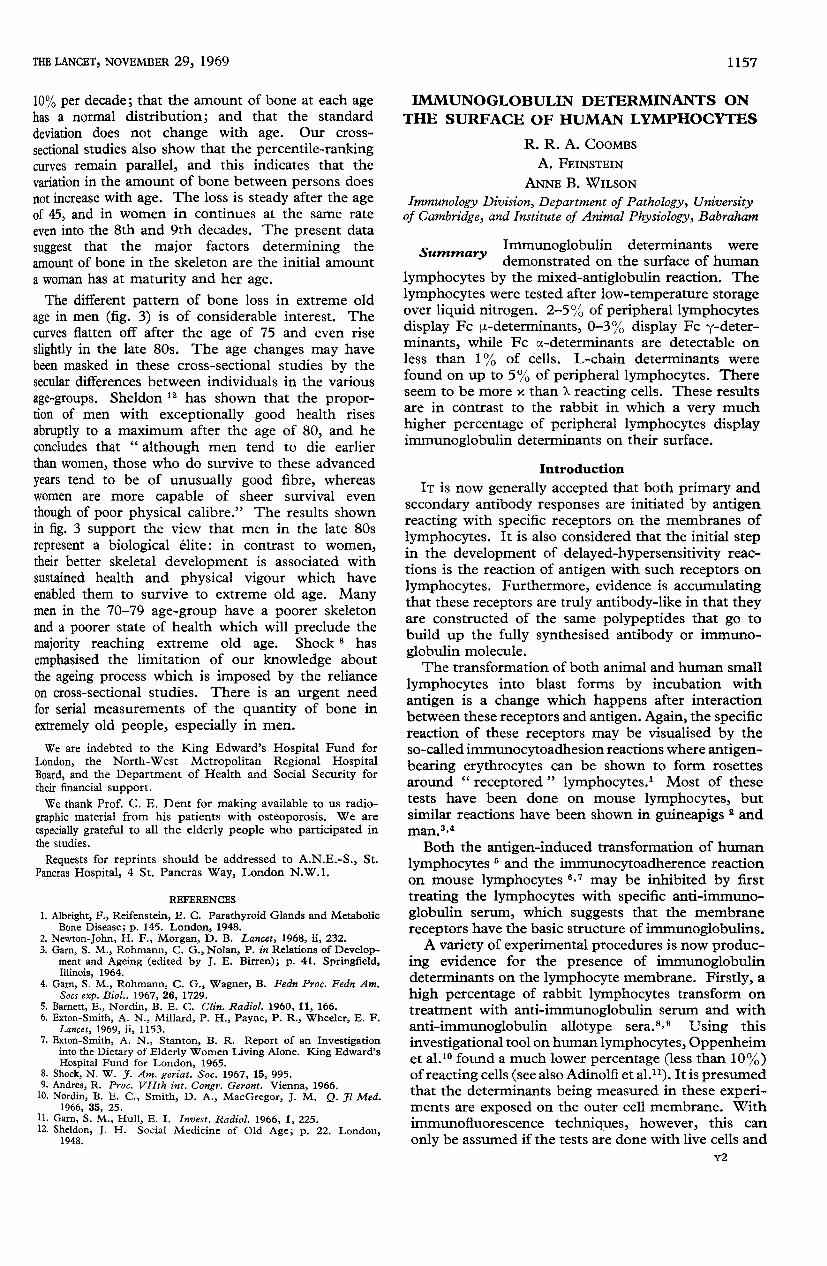
Fig. 7-Values of (D2—d2)/DL for women, measured in 1962 andagain 6’/, years later, plotted on the percentile chart shownin fig. 4.
Open circles indicate cases in which both values fall withinthe same percentile.
Fig. 6-Values of (D2— d’)/DL for 10 female patients with juvenileor idiopathic osteoporosis, plotted on the percentile chartshown in fig. 4.
individuals of the same age and sex. The use of thistechnique is illustrated in figs. 5 and 6, where theratios for the series of younger patients with osteo-porosis have been plotted. The majority of pointsfall below the 10th percentile.Garn and his colleagues 4 have suggested that while
all people lose bone ultimately with age, there aresome factors (e.g., gastrectomy) which increase boneloss and others, such as tall stature 11 which are
associated with a decrease in the rate of loss. In the
past, in the absence of differing standards of nor-mality according to age, it has been extremely difficultto assess the influence of gastrectomy and its possiblecontribution to the loss of bone from the skeleton.
Using the percentile-ranking curves, a study is beingundertaken in the surgical unit of University CollegeHospital to assess the skeletal status of patients 8to 13 years after gastrectomy and to compare it withthat of other individuals of the same age and sex.
In this way it is hoped that it will be possibleto determine how often gastrectomy leads to lossof bone and how much it adds to the loss due to
ageing.The patterns of bone changes with age shown in
figs. 3 and 4 are based on data derived from cross-sectional studies in normal subjects. They showclearly that loss of bone with age is universal, but theresults do not tell us whether or not change fromone percentile rank to another can occur as theresult of disease, physical activity, therapeutic agents,or nutrition. Only a longitudinal study in whichserial observations are made on each subject willgive this information. In our longitudinal studies on16 elderly women (fig. 7) loss of bone in all subjectscontinued in extreme old age, and the slopes of thelines were, in all but 4 cases, very similar to that ofthe percentile-ranking curves. The technique issensitive enough to detect a clear change within the61/2-year period; indeed, changes could probably beobserved within a shorter period.
In women over 30 the characteristics of the curvesshown in fig. 4 fit in well with the model of bone lossconstructed by Newton-John and Morgan. 2 Theyfound that bone loss begins at about 35-45 years;that it is linear in respect of age, the rate of fall as a
percentage of the initial mean value being about
1157
10% per decade; that the amount of bone at each agehas a normal distribution; and that the standarddeviation does not change with age. Our cross-
sectional studies also show that the percentile-rankingcurves remain parallel, and this indicates that thevariation in the amount of bone between persons doesnot increase with age. The loss is steady after the ageof 45, and in women in continues at the same rateeven into the 8th and 9th decades. The present data
suggest that the major factors determining theamount of bone in the skeleton are the initial amounta woman has at maturity and her age.The different pattern of bone loss in extreme old
age in men (fig. 3) is of considerable interest. Thecurves flatten off after the age of 75 and even riseslightly in the late 80s. The age changes may havebeen masked in these cross-sectional studies by thesecular differences between individuals in the various
age-groups. Sheldon 12 has shown that the propor-tion of men with exceptionally good health rises
abruptly to a maximum after the age of 80, and heconcludes that " although men tend to die earlierthan women, those who do survive to these advanced
years tend to be of unusually good fibre, whereaswomen are more capable of sheer survival even
though of poor physical calibre." The results shownin fig. 3 support the view that men in the late 80srepresent a biological elite : in contrast to women,their better skeletal development is associated withsustained health and physical vigour which haveenabled them to survive to extreme old age. Manymen in the 70-79 age-group have a poorer skeletonand a poorer state of health which will preclude themajority reaching extreme old age. Shock 8 has
emphasised the limitation of our knowledge aboutthe ageing process which is imposed by the relianceon cross-sectional studies. There is an urgent needfor serial measurements of the quantity of bone inextremely old people, especially in men.We are indebted to the King Edward’s Hospital Fund for
London, the North-West Metropolitan Regional HospitalBoard, and the Department of Health and Social Security fortheir financial support.We thank Prof. C. E. Dent for making available to us radio-
graphic material from his patients with osteoporosis. We are
especially grateful to all the elderly people who participated inthe studies.
Requests for reprints should be addressed to A.N.E.-S., St.Pancras Hospital, 4 St. Pancras Way, London N,W.1.
REFERENCES
1. Albright, F., Reifenstein, E. C. Parathyroid Glands and MetabolicBone Disease; p. 145. London, 1948.
2. Newton-John, H. F., Morgan, D. B. Lancet, 1968, ii, 232.3. Garn, S. M., Rohmann, C. G., Nolan, P. in Relations of Develop-
ment and Ageing (edited by J. E. Birren); p. 41. Springfield,Illinois, 1964.
4. Garn, S. M., Rohmann, C. G., Wagner, B. Fedn Proc. Fedn Am.Socs exp. Biol.. 1967, 26, 1729.
5. Barnett, E., Nordin, B. E. C. Clin. Radiol. 1960, 11, 166.6. Exton-Smith, A. N., Millard, P. H., Payne, P. R., Wheeler, E. F.
Lancet, 1969, ii, 1153.7. Exton-Smith, A. N., Stanton, B. R. Report of an Investigation
into the Dietary of Elderly Women Living Alone. King Edward’sHospital Fund for London, 1965.
8. Shock, N. W. J. Am. geriat. Soc. 1967, 15, 995.9. Andres, R. Proc. VIIth int. Congr. Geront. Vienna, 1966.10. Nordin, B. E. C., Smith, D. A., MacGregor, J. M. Q. Jl Med.
1966, 35, 25.11. Garn, S. M., Hull, E. I. Invest. Radiol. 1966, 1, 225.12. Sheldon, J. H. Social Medicine of Old Age; p. 22. London,
1948.
IMMUNOGLOBULIN DETERMINANTS ONTHE SURFACE OF HUMAN LYMPHOCYTES
R. R. A. COOMBS
A. FEINSTEIN
ANNE B. WILSON
Immunology Division, Department of Pathology, Universityof Cambridge, and Institute of Animal Physiology, Babraham
Summary Immunoglobulin determinants were
demonstrated on the surface of human
lymphocytes by the mixed-antiglobulin reaction. Thelymphocytes were tested after low-temperature storageover liquid nitrogen. 2-5% of peripheral lymphocytesdisplay Fc µ-determinants, 0-3% display Fc &ggr;-deter-minants, while Fc &agr;-determinants are detectable onless than 1% of cells. L-chain determinants werefound on up to 5% of peripheral lymphocytes. Thereseem to be more x than &lgr; reacting cells. These resultsare in contrast to the rabbit in which a very much
higher percentage of peripheral lymphocytes displayimmunoglobulin determinants on their surface.
Introduction
IT is now generally accepted that both primary andsecondary antibody responses are initiated by antigenreacting with specific receptors on the membranes oflymphocytes. It is also considered that the initial stepin the development of delayed-hypersensitivity reac-tions is the reaction of antigen with such receptors onlymphocytes. Furthermore, evidence is accumulatingthat these receptors are truly antibody-like in that theyare constructed of the same polypeptides that go tobuild up the fully synthesised antibody or immuno-globulin molecule.The transformation of both animal and human small
lymphocytes into blast forms by incubation with
antigen is a change which happens after interactionbetween these receptors and antigen. Again, the specificreaction of these receptors may be visualised by theso-called immunocytoadhesion reactions where antigen-bearing erythrocytes can be shown to form rosettesaround " receptored " lymphocytes.1 Most of thesetests have been done on mouse lymphocytes, butsimilar reactions have been shown in guineapigs andman.3,4Both the antigen-induced transformation of human
lymphocytes 5 and the immunocytoadherence reactionon mouse lymphocytes 6,7 may be inhibited by firsttreating the lymphocytes with specific anti-immuno-globulin serum, which suggests that the membranereceptors have the basic structure of immunoglobulins.A variety of experimental procedures is now produc-
ing evidence for the presence of immunoglobulindeterminants on the lymphocyte membrane. Firstly, ahigh percentage of rabbit lymphocytes transform ontreatment with anti-immunoglobulin serum and withanti-immunoglobulin allotype sera.B,9 Using this
investigational tool on human lymphocytes, Oppenheimet al.10 found a much lower percentage (less than 10%)of reacting cells (see also Adinolfi et al.11). It is presumedthat the determinants being measured in these experi-ments are exposed on the outer cell membrane. Withimmunofluorescence techniques, however, this can
only be assumed if the tests are done with live cells and