Embed Size (px)
Citation preview
Patterns and Nonlinear Functions
Section 4-3
Goals
Goal • To identify and represent
patterns that describe nonlinear functions.
Vocabulary • Nonlinear Function
Definition
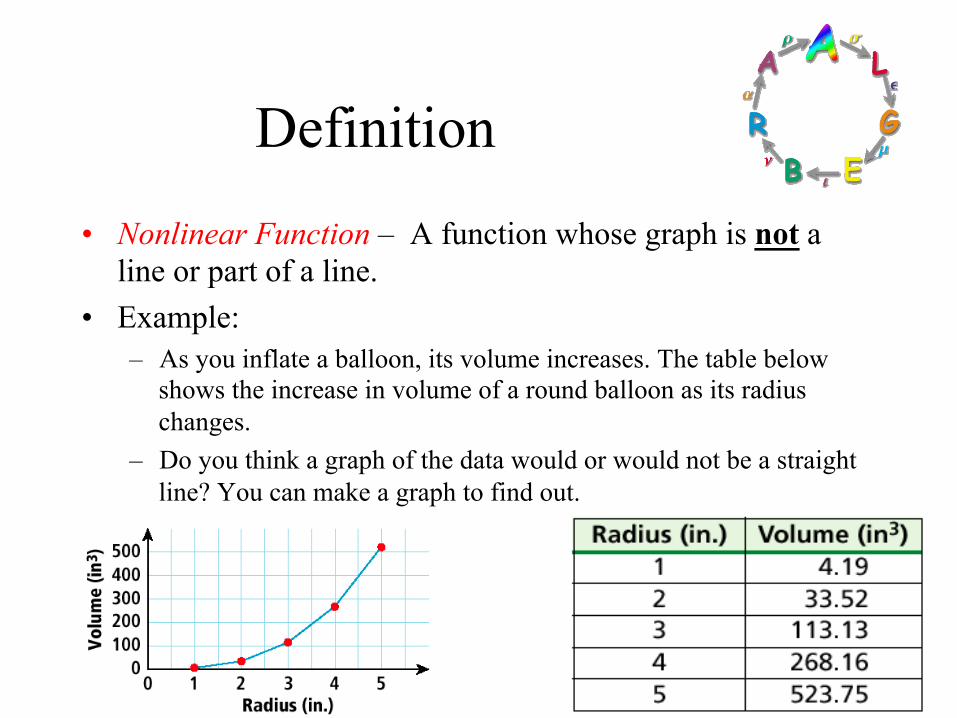
• Nonlinear Function – A function whose graph is not a line or part of a line.
• Example: – As you inflate a balloon, its volume increases. The table below
shows the increase in volume of a round balloon as its radius changes.
– Do you think a graph of the data would or would not be a straight line? You can make a graph to find out.
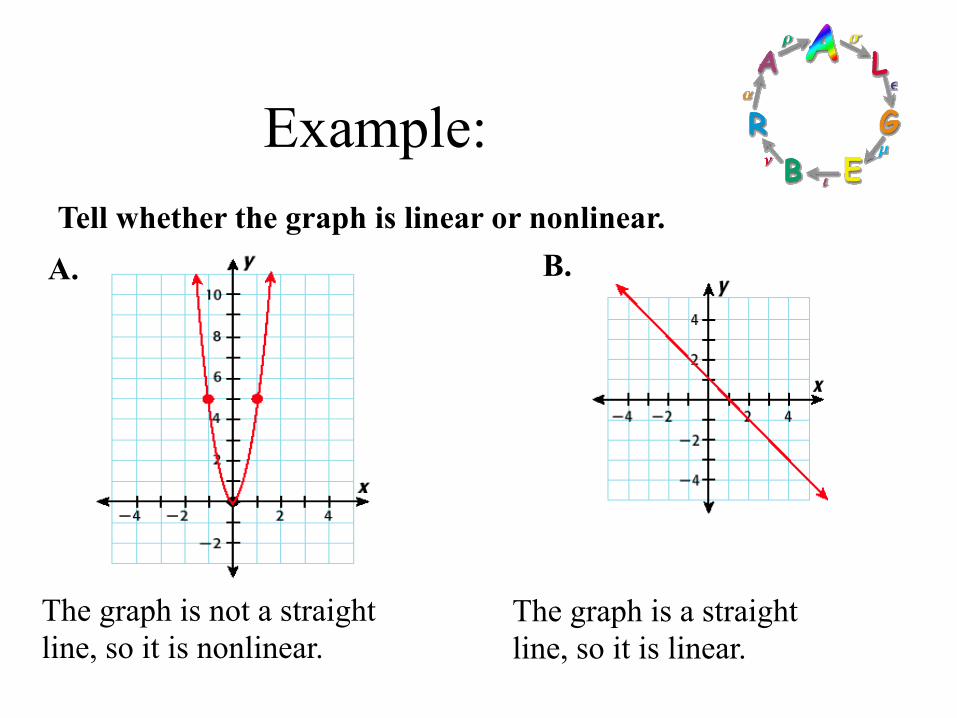
Tell whether the graph is linear or nonlinear.
The graph is not a straight line, so it is nonlinear.
The graph is a straight line, so it is linear.
A. B.
Example:
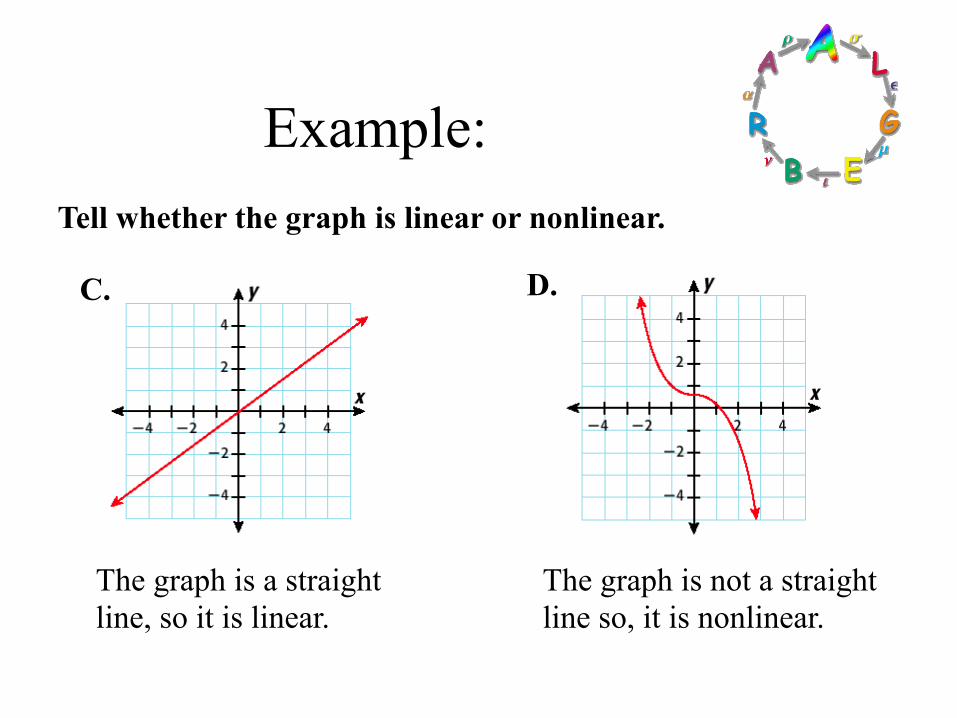
Tell whether the graph is linear or nonlinear.
The graph is a straight line, so it is linear.
The graph is not a straight line so, it is nonlinear.
C. D.
Example:
y
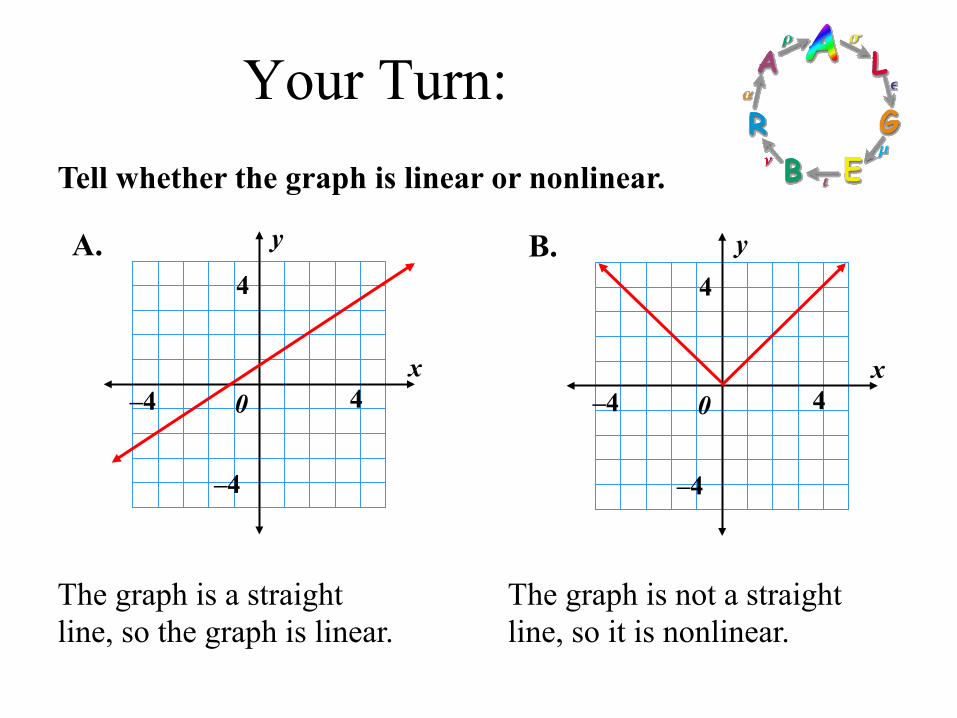
Tell whether the graph is linear or nonlinear.
A. B.
The graph is a straight line, so the graph is linear.
The graph is not a straight line, so it is nonlinear.
x –4
–4
4
4
0 x
–4
–4
4
4
0
y
Your Turn:
y
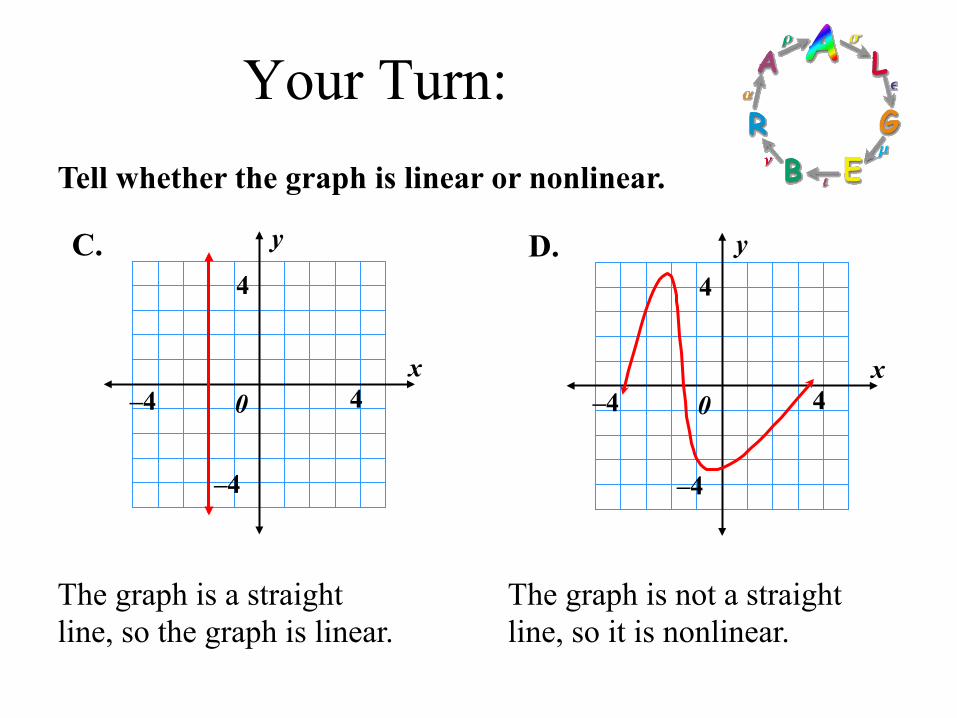
Tell whether the graph is linear or nonlinear.
C. D.
The graph is a straight line, so the graph is linear.
The graph is not a straight line, so it is nonlinear.
x –4
–4
4
4
0 x
–4
–4
4
4
0
y
Your Turn:
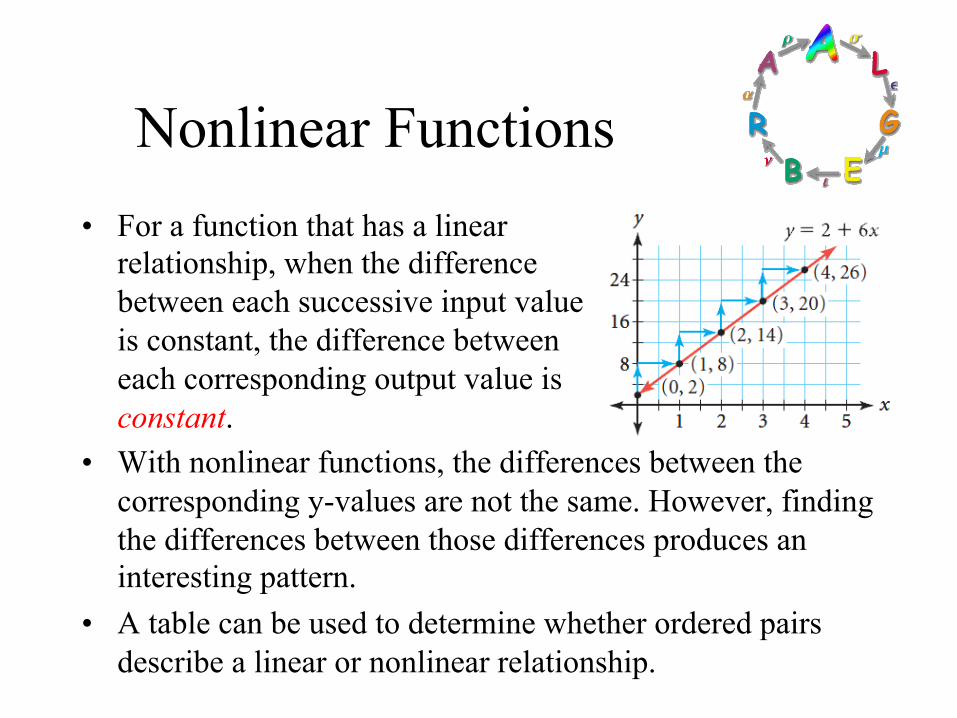
Nonlinear Functions • For a function that has a linear
relationship, when the difference between each successive input value is constant, the difference between each corresponding output value is constant.
• With nonlinear functions, the differences between the corresponding y-values are not the same. However, finding the differences between those differences produces an interesting pattern.
• A table can be used to determine whether ordered pairs describe a linear or nonlinear relationship.
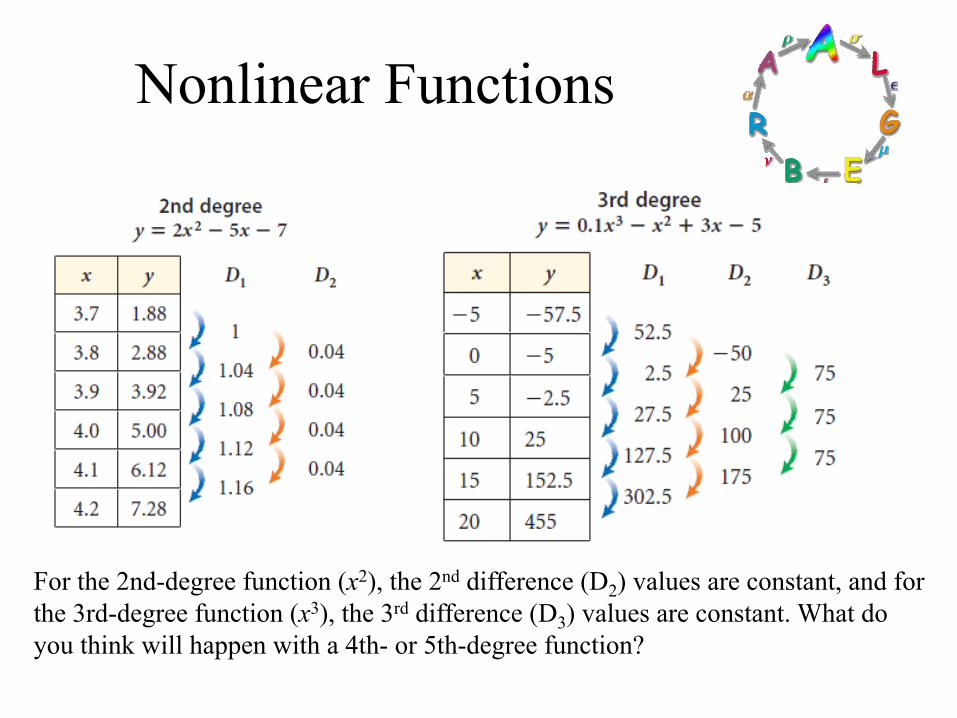
For the 2nd-degree function (x2), the 2nd difference (D2) values are constant, and for the 3rd-degree function (x3), the 3rd difference (D3) values are constant. What do you think will happen with a 4th- or 5th-degree function?
Nonlinear Functions
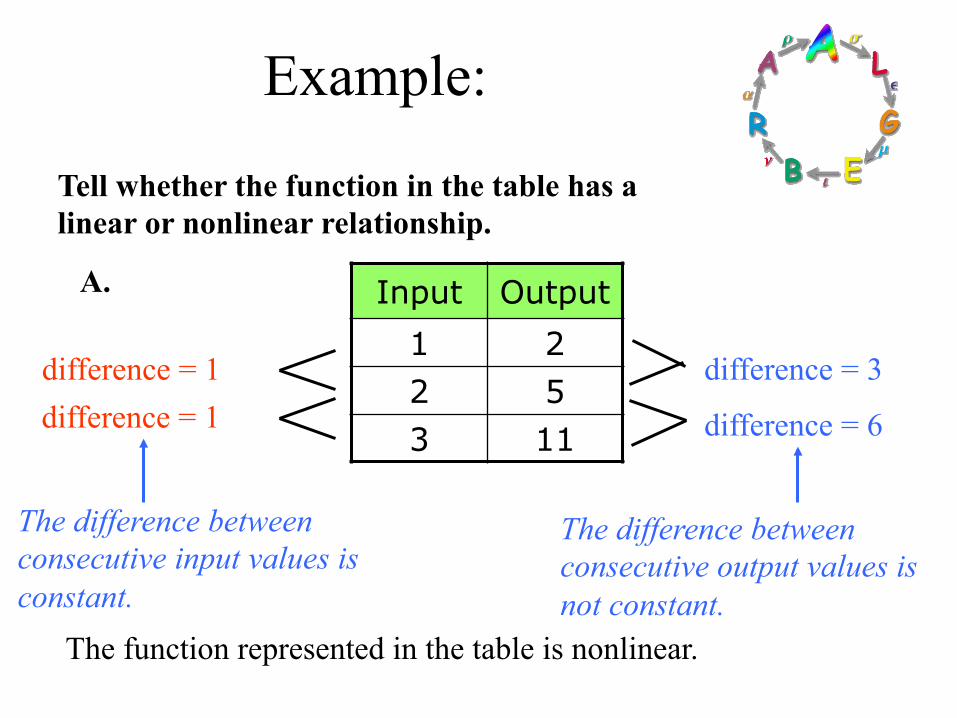
Tell whether the function in the table has a linear or nonlinear relationship.
A.
difference = 3
difference = 6
difference = 1 difference = 1
The difference between consecutive output values is not constant.
The difference between consecutive input values is constant.
The function represented in the table is nonlinear.
Input Output 1 2 2 5 3 11
Example:
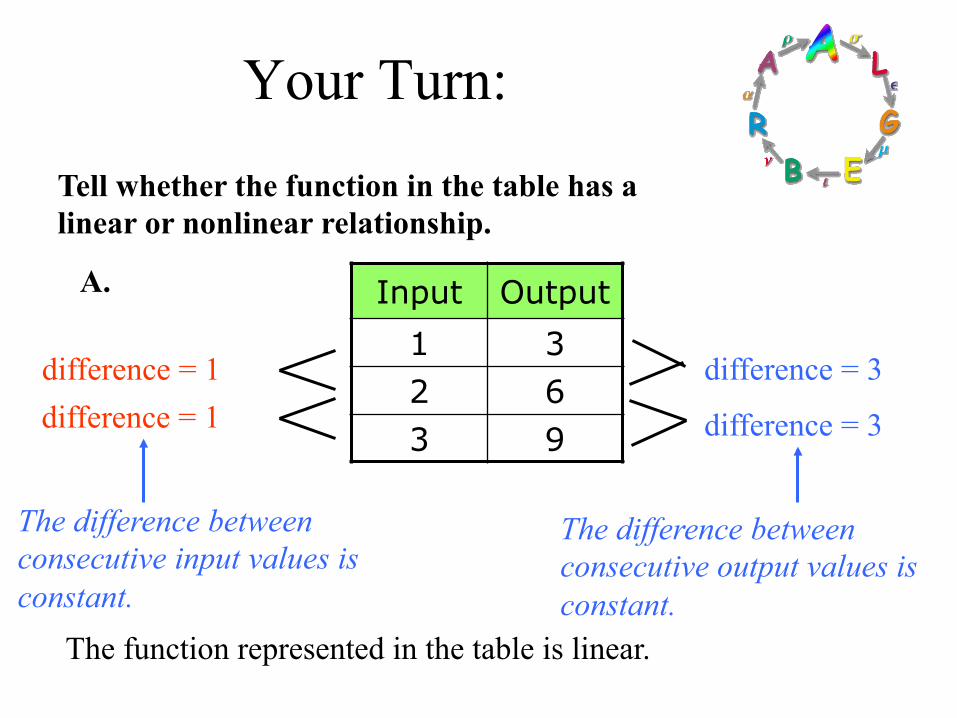
Tell whether the function in the table has a linear or nonlinear relationship.
A.
difference = 3
difference = 3
difference = 1 difference = 1
The difference between consecutive output values is constant.
The difference between consecutive input values is constant.
The function represented in the table is linear.
Input Output 1 3 2 6 3 9
Your Turn:
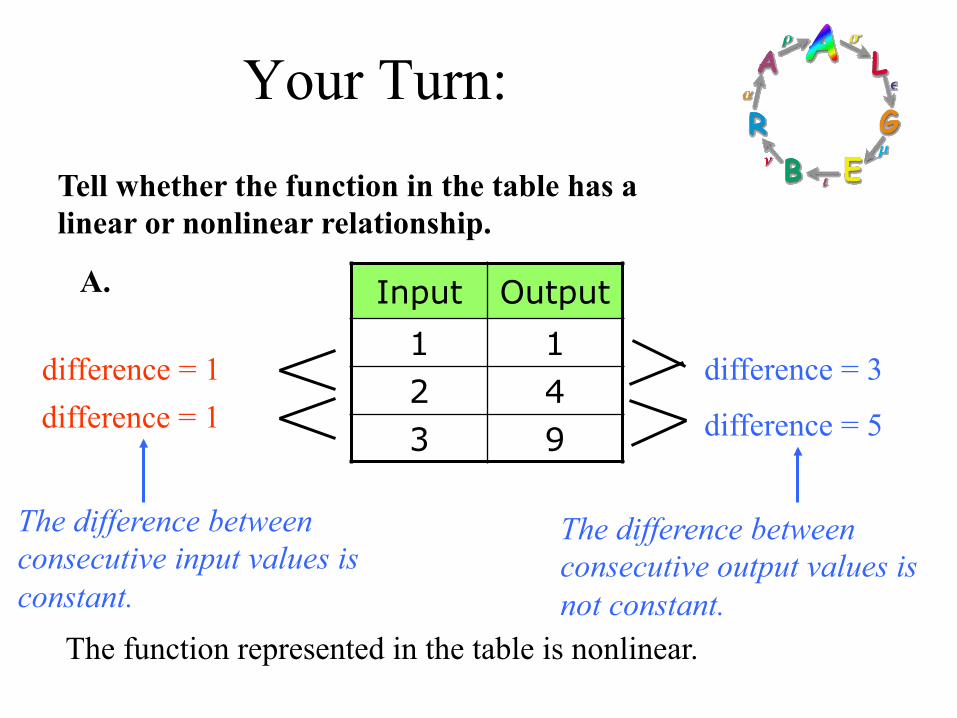
Tell whether the function in the table has a linear or nonlinear relationship.
A.
difference = 3
difference = 5
difference = 1 difference = 1
The difference between consecutive output values is not constant.
The difference between consecutive input values is constant.
The function represented in the table is nonlinear.
Input Output 1 1 2 4 3 9
Your Turn:
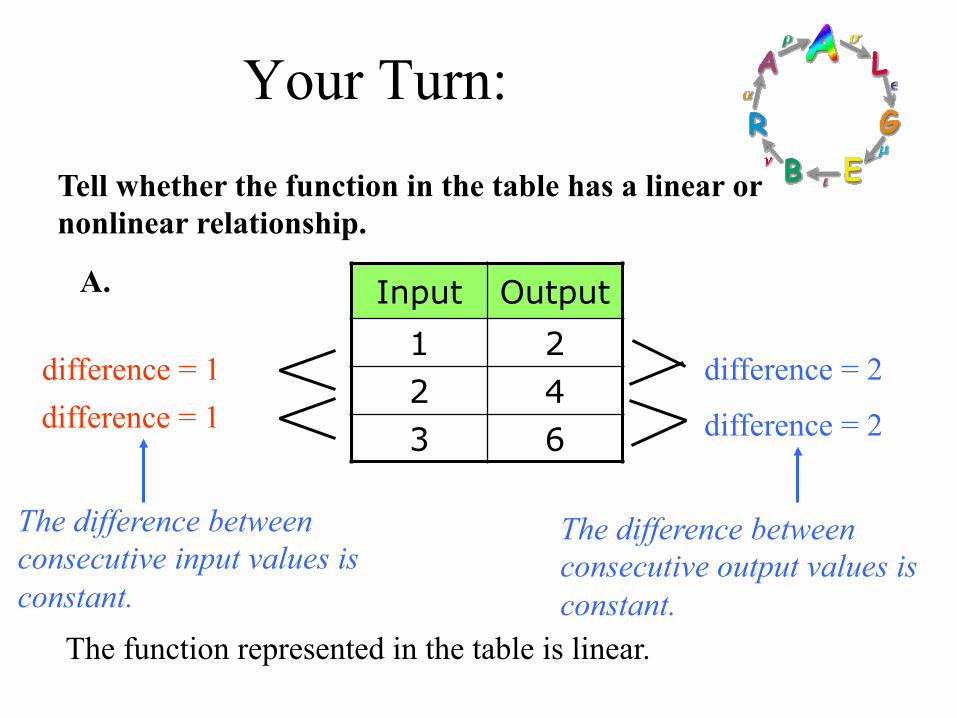
Tell whether the function in the table has a linear or nonlinear relationship.
A.
difference = 2
difference = 2
difference = 1 difference = 1
The difference between consecutive output values is constant.
The difference between consecutive input values is constant.
The function represented in the table is linear.
Input Output 1 2 2 4 3 6
Your Turn:
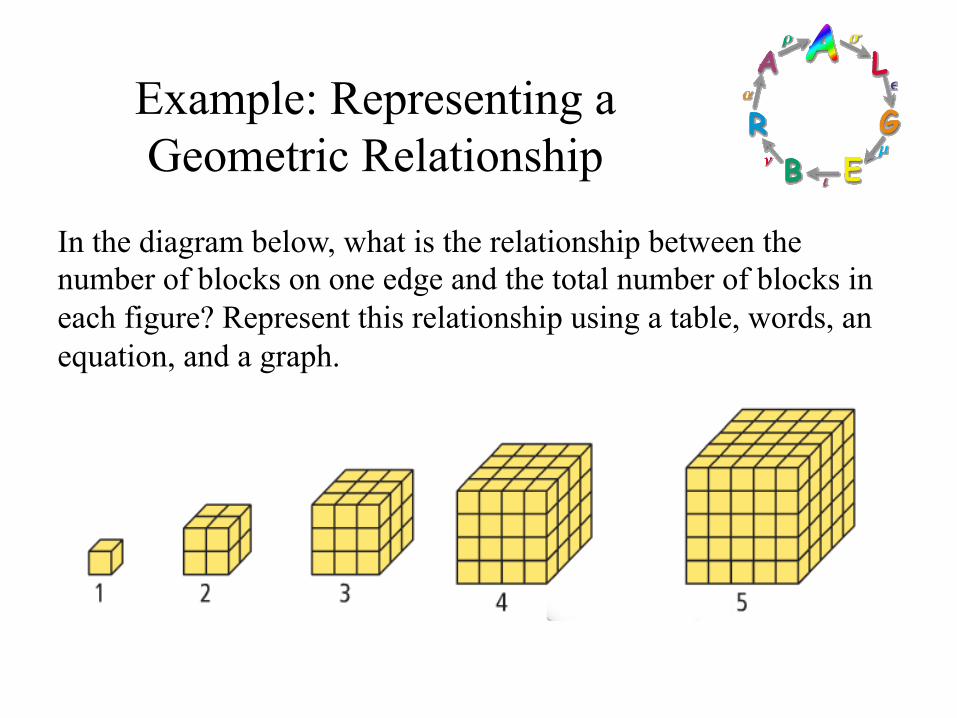
Example: Representing a Geometric Relationship
In the diagram below, what is the relationship between the number of blocks on one edge and the total number of blocks in each figure? Represent this relationship using a table, words, an equation, and a graph.
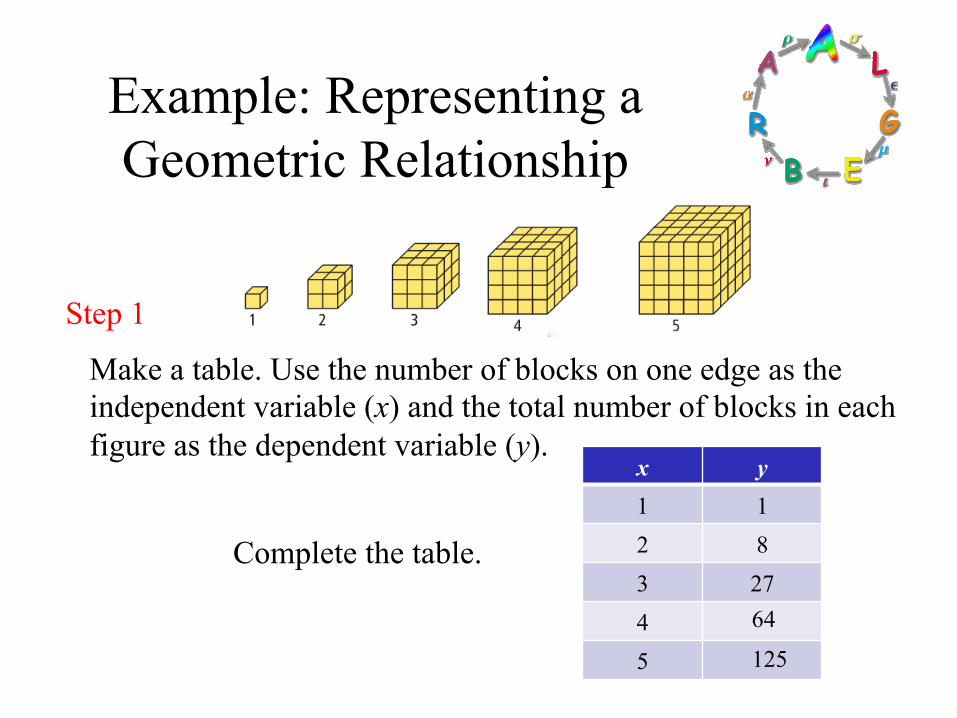
Example: Representing a Geometric Relationship
Step 1
Make a table. Use the number of blocks on one edge as the independent variable (x) and the total number of blocks in each figure as the dependent variable (y).
x y 1 1 2 8 3 27 4 5
Complete the table.
64
125
Example: Representing a Geometric Relationship
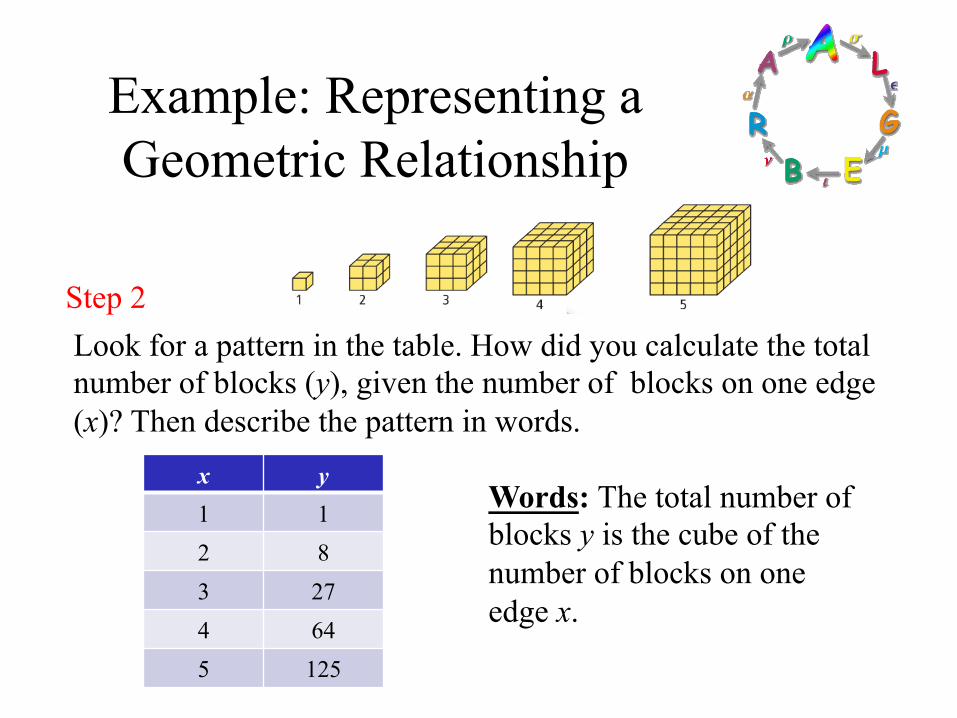
Step 2 Look for a pattern in the table. How did you calculate the total number of blocks (y), given the number of blocks on one edge (x)? Then describe the pattern in words.
Words: The total number of blocks y is the cube of the number of blocks on one edge x.
x y 1 1 2 8 3 27 4 64 5 125
Example: Representing a Geometric Relationship
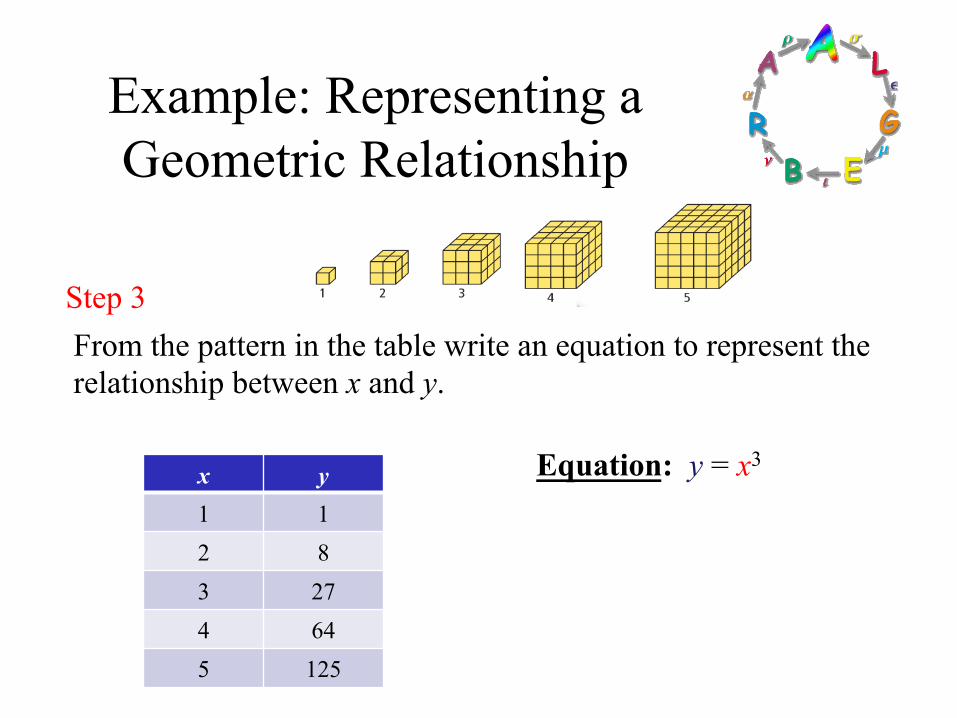
Step 3 From the pattern in the table write an equation to represent the relationship between x and y.
Equation: y = x3 x y 1 1 2 8 3 27 4 64 5 125
Example: Representing a Geometric Relationship
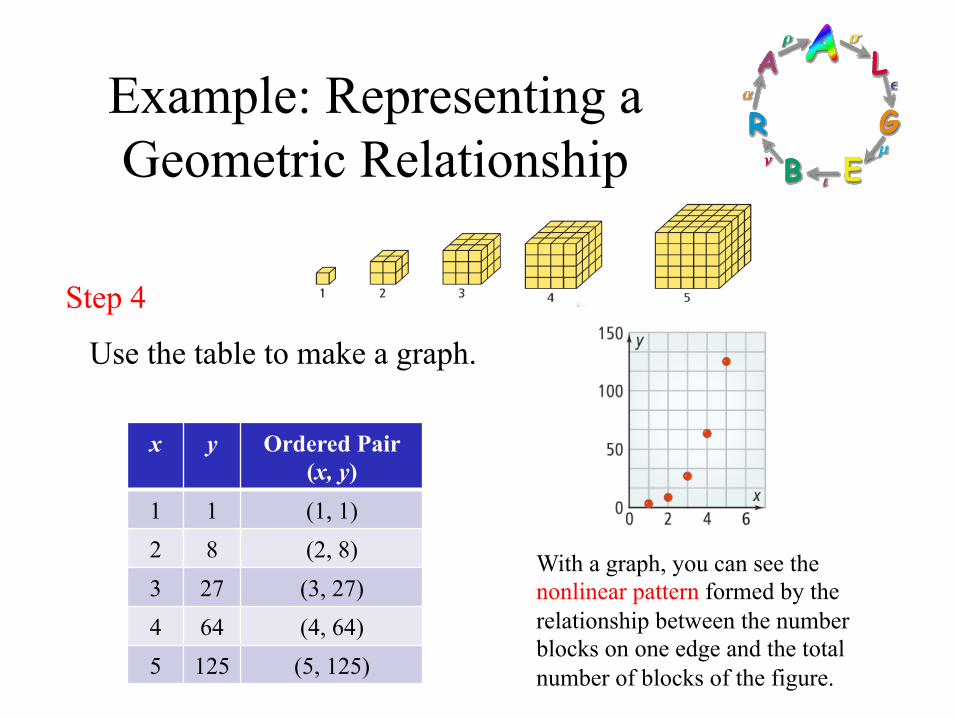
Step 4
Use the table to make a graph.
x y Ordered Pair (x, y)
1 1 (1, 1) 2 8 (2, 8) 3 27 (3, 27) 4 64 (4, 64) 5 125 (5, 125)
With a graph, you can see the nonlinear pattern formed by the relationship between the number blocks on one edge and the total number of blocks of the figure.
Your Turn:
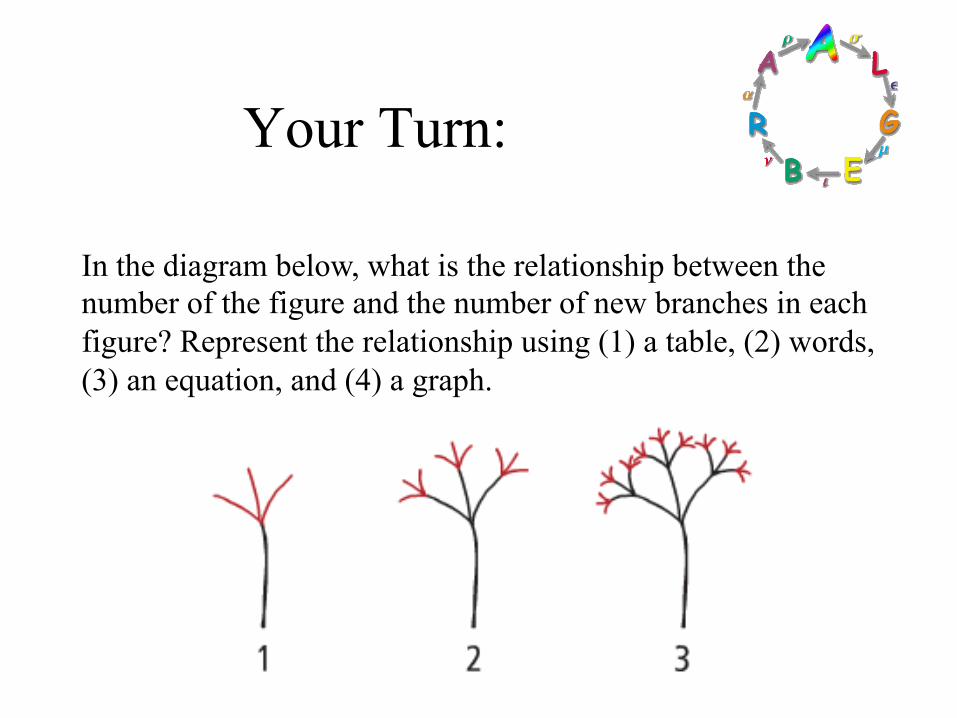
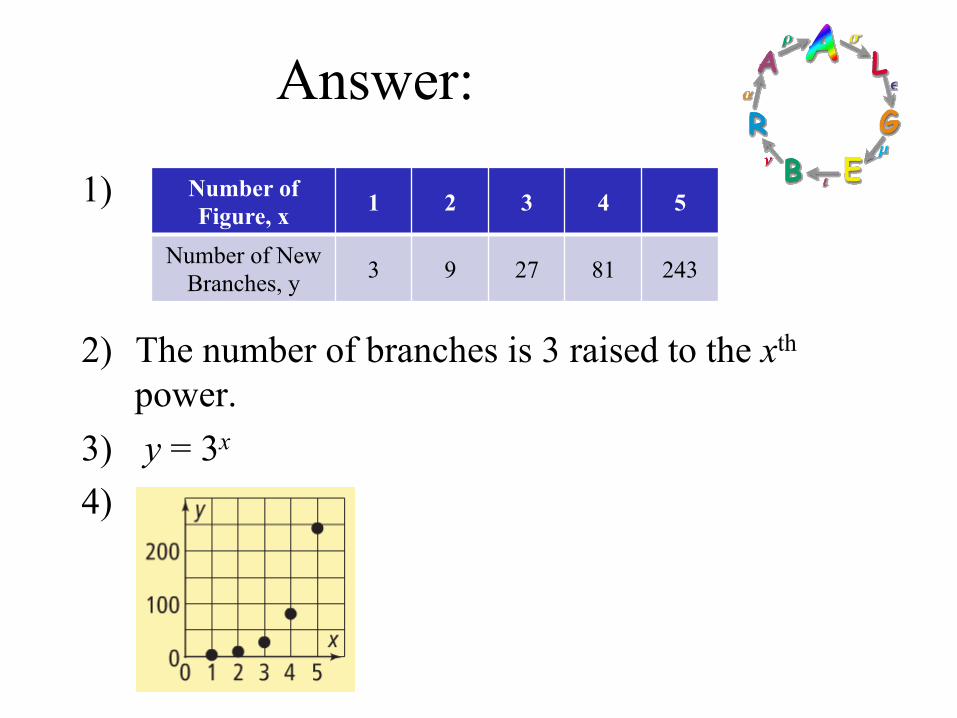
In the diagram below, what is the relationship between the number of the figure and the number of new branches in each figure? Represent the relationship using (1) a table, (2) words, (3) an equation, and (4) a graph.
Answer:
1)
2) The number of branches is 3 raised to the xth power.
3) y = 3x
4)
Number of Figure, x 1 2 3 4 5
Number of New Branches, y 3 9 27 81 243
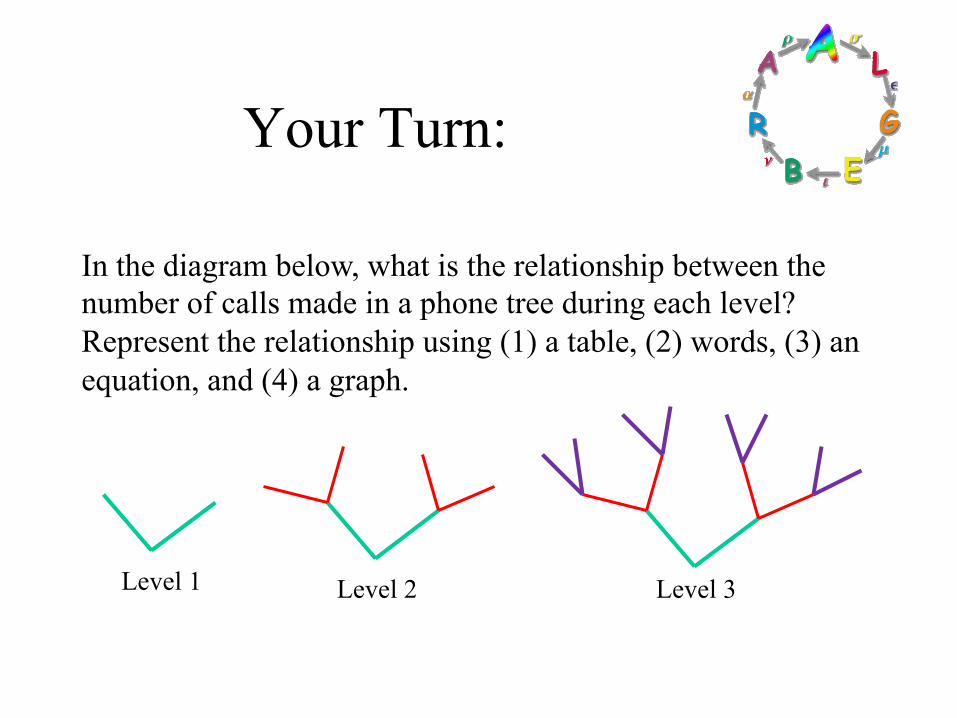
Your Turn:
In the diagram below, what is the relationship between the number of calls made in a phone tree during each level? Represent the relationship using (1) a table, (2) words, (3) an equation, and (4) a graph.
Level 1 Level 2 Level 3
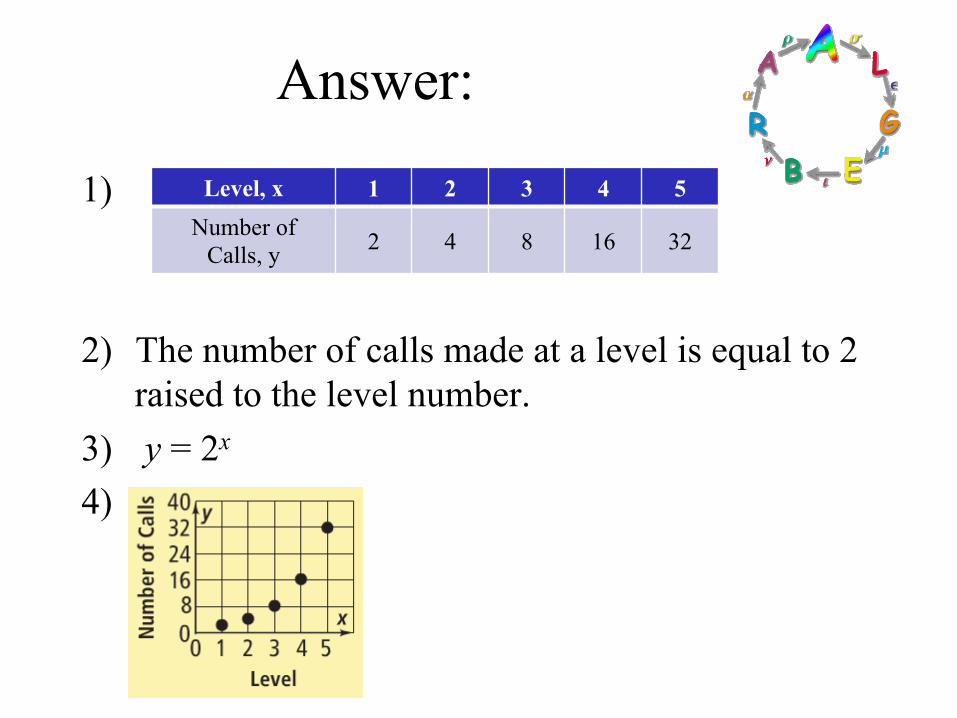
Answer:
1)
2) The number of calls made at a level is equal to 2 raised to the level number.
3) y = 2x
4)
Level, x 1 2 3 4 5 Number of
Calls, y 2 4 8 16 32
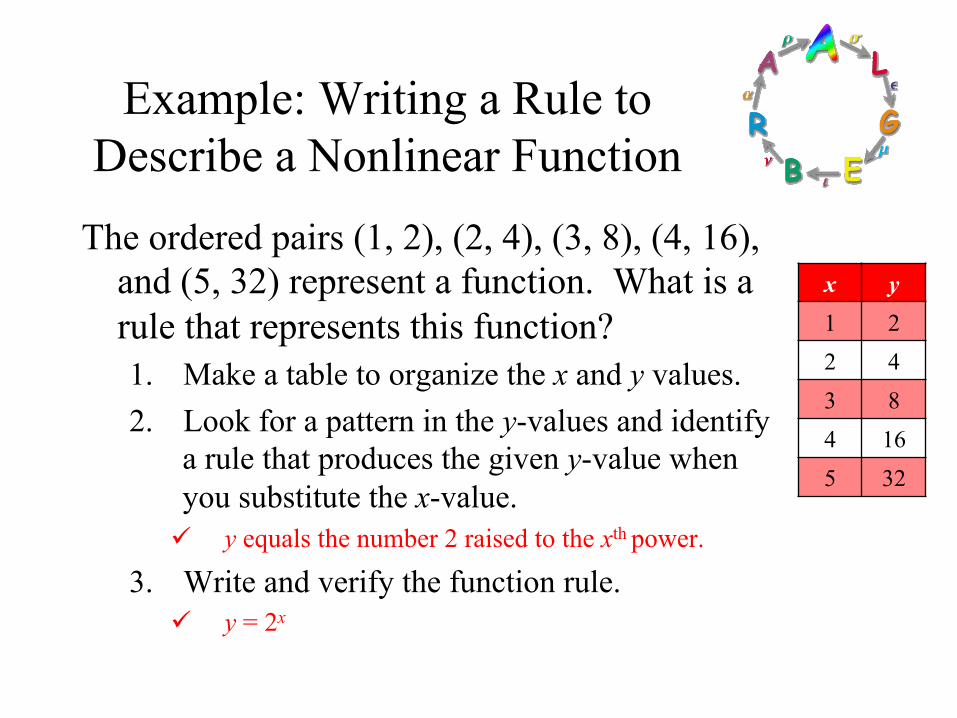
Example: Writing a Rule to Describe a Nonlinear Function
The ordered pairs (1, 2), (2, 4), (3, 8), (4, 16), and (5, 32) represent a function. What is a rule that represents this function? 1. Make a table to organize the x and y values. 2. Look for a pattern in the y-values and identify
a rule that produces the given y-value when you substitute the x-value. ü y equals the number 2 raised to the xth power.
3. Write and verify the function rule. ü y = 2x
x y 1 2 2 4 3 8 4 16 5 32
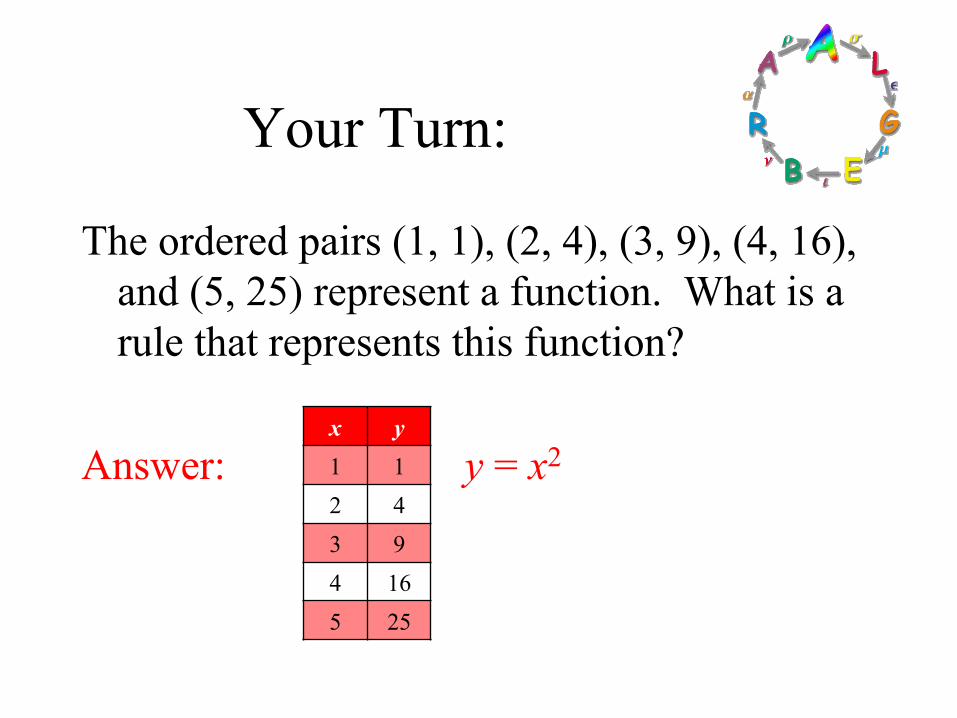
Your Turn:
The ordered pairs (1, 1), (2, 4), (3, 9), (4, 16), and (5, 25) represent a function. What is a rule that represents this function?
Answer: y = x2
x y 1 1 2 4 3 9 4 16 5 25
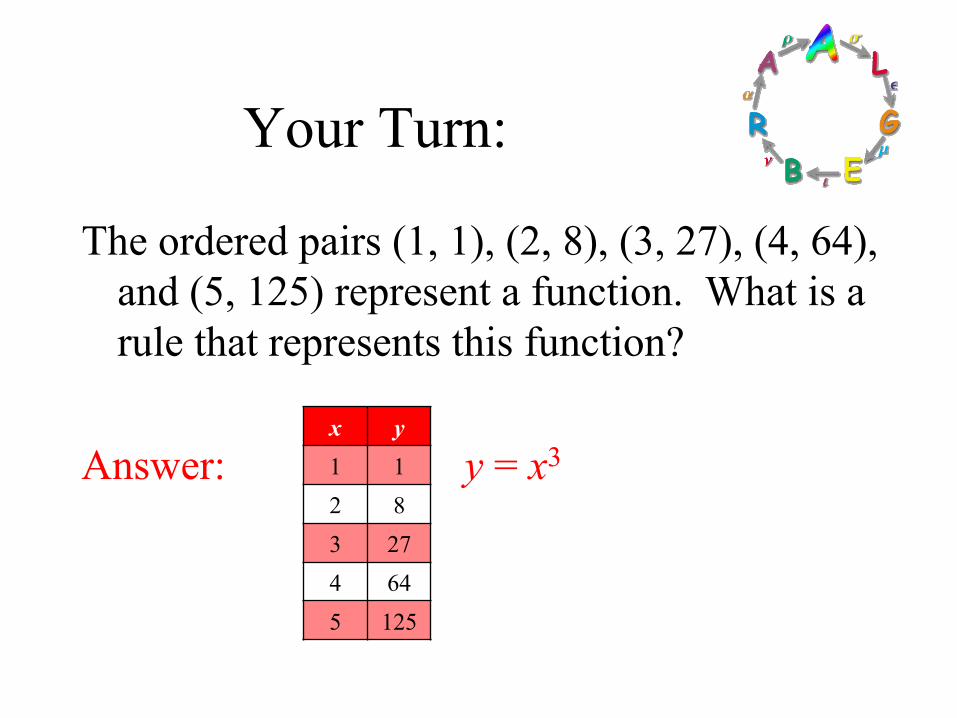
Your Turn:
The ordered pairs (1, 1), (2, 8), (3, 27), (4, 64), and (5, 125) represent a function. What is a rule that represents this function?
Answer: y = x3
x y 1 1 2 8 3 27 4 64 5 125
Joke Time
• Which one came first the egg or the chicken? • I don't care I just want my breakfast served.
• What do you call a handsome intelligent sensitive man? • A rumor.
• What does a clock do when it's hungry? • Goes back 4 seconds!!!