Embed Size (px)
Citation preview
119
CRiTeRiOn 4—
Chapter 9. Patterns of Soil Calcium and Aluminum Across the Conterminous United StatescHarles H. Perry1
MicHael c. aMacHer
1 Corresponding author: Charles H. Perry, Research Soil Scientist, U.S. Department of Agriculture Forest Service, Northern Research Station, St. Paul, MN 55108.
Why Are Calcium and Aluminum important?
The health and growth of forests depends upon soil nutrients. Calcium (Ca) is a cation—positive ion—used by plants to
build cell walls (Marschner 1986). It is also involved in root and leaf development and the activation of plant enzymes (Potash and Phosphate Institute 1995). Soils that develop in areas with low rainfall tend to have greater Ca supplies than soils that form in humid regions of the country, and within any one soil profile, more Ca typically is found in lower parts of the soil profile than at the surface (Pritchett and Fisher 1987). Acidic deposition leads to soil Ca depletion (Lawrence and others 1999). Soil Ca depletion is the most important means by which acid deposition affects forest health (Fenn and others 2006).
Low concentrations of aluminum (Al) (<1 mg/l) can stimulate plant growth and may act as a fungicide, but Al is a cation generally considered to have negative effects on plants. The toxic effects of Al include the inhibition of root growth and reduced uptake of several key cations (phosphorus, magnesium, and Ca) (Marschner 1986). Al is closely linked with soil acidity. When soil pH is >5.0, Al tends to
precipitate as a solid called gibbsite, Al(OH)3. This reaction can be reversed to release Al at lower pH (<5.0) (McBride 1994):
Al3+ + 3 H2O Al(OH)3 + 3 H+
At these lower pH ranges, it is not the soil pH that is toxic to plants but the increased amount of free and exchangeable Al (Marschner 1986, McBride 1994).
Exchangeable cations are bound in the soil because of their positive charge. The amount and types of cations held in the soil are indicative of a soil’s fertility (Pritchett and Fisher 1987). The molar ratio of Ca:Al is particularly useful as an indicator of forest ecosystem stress since low values represent an increased likelihood of Al saturation (Cronan and Grigal 1995).
Methods
Soil samples for chemical analysis are collected as part of the soil quality indicator of the Forest Inventory and Analysis (FIA) Program of the Forest Service, U.S. Department of Agriculture. Between 2001 and 2005, samples were collected in most of the continental United States (fig. 9.1; sampling has not begun in Mississippi, New Mexico, and Oklahoma). The sample size will increase as work in these
SECTIO
N 1 C
hapte
r 9Cri
terion
4 For
est He
alth M
onito
ring
120 Ca: AI molar ratio (minimum value)
> 1.51.1 – 1.50.6 – 1.00.3 – 0.50.0 – 0.2
Projection: Albers Equal-Area Conic. Source: U.S. Department of Agriculture Forest Service, Forest Inventory and Analysis program, 2001–2005 data. Additional FIA data and mapping tools are available online at http://fiatools.fs.fed.us. EMAP hexagons are provided by the U.S. Forest Service, and State boundaries are provided by the USDA National Agricultural Statistics Service. Cartography: C.H. Perry, October 2008.
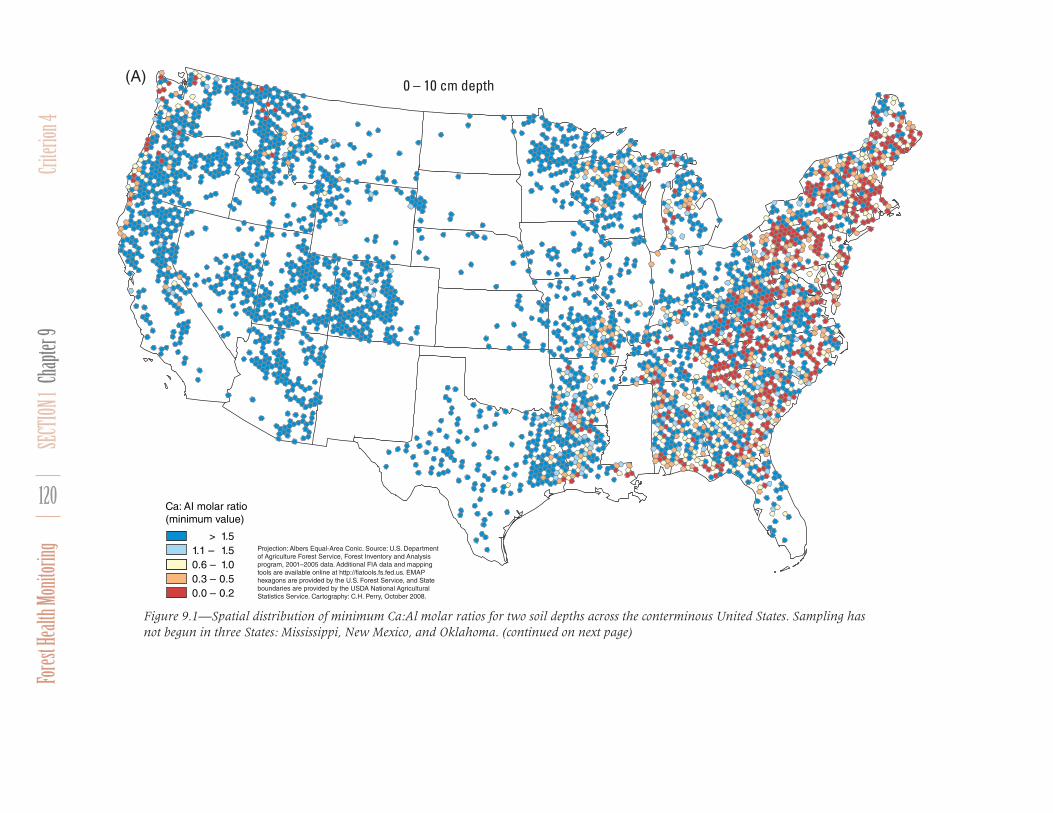
0 – 10 cm depth
Figure 9.1—Spatial distribution of minimum Ca:Al molar ratios for two soil depths across the conterminous United States. Sampling has not begun in three States: Mississippi, New Mexico, and Oklahoma. (continued on next page)
(A)
121Ca: AI molar ratio (minimum value)
> 1.51.1 – 1.50.6 – 1.00.3 – 0.50.0 – 0.2
Projection: Albers Equal-Area Conic. Source: U.S. Department of Agriculture Forest Service, Forest Inventory and Analysis program, 2001–2005 data. Additional FIA data and mapping tools are available online at http://fiatools.fs.fed.us. EMAP hexagons are provided by the U.S. Forest Service, and State boundaries are provided by the USDA National Agricultural Statistics Service. Cartography: C.H. Perry, October 2008.
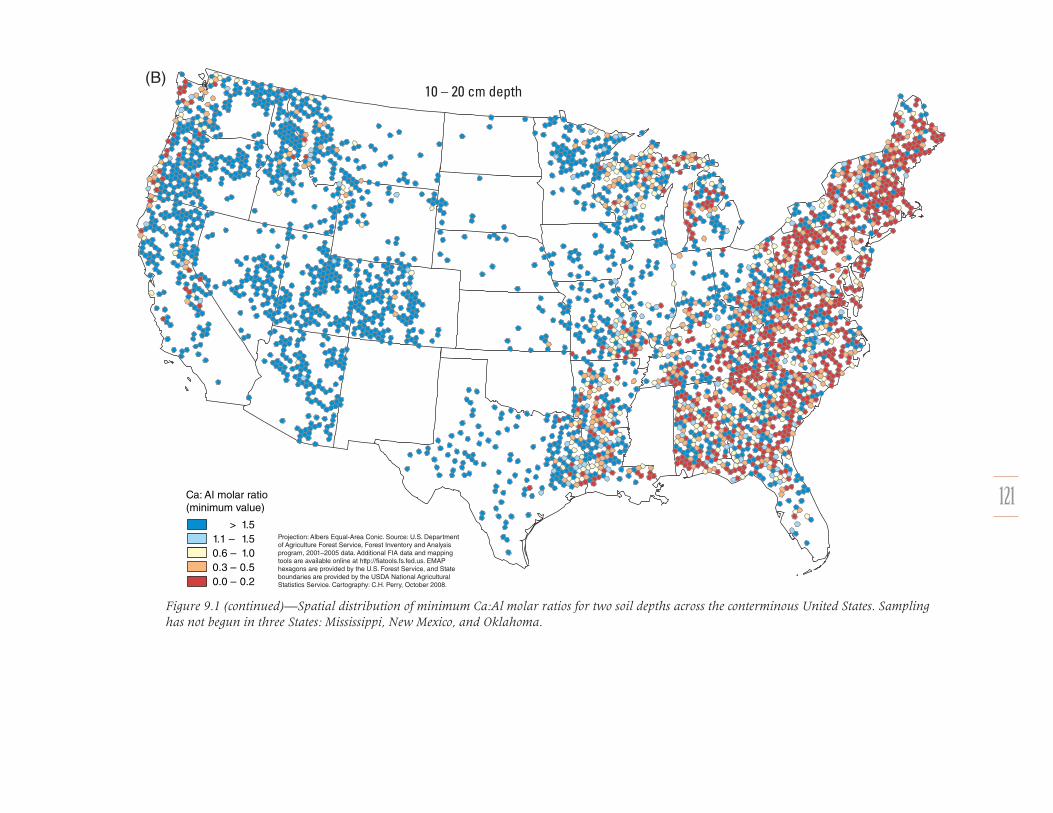
10 – 20 cm depth
Figure 9.1 (continued)—Spatial distribution of minimum Ca:Al molar ratios for two soil depths across the conterminous United States. Sampling has not begun in three States: Mississippi, New Mexico, and Oklahoma.
(B)
SECTIO
N 1 C
hapte
r 9Cri
terion
4 For
est He
alth M
onito
ring
122
States is completed and additional States are inventoried. The changing sample size and refinement of the database management and estimation algorithms together suggest that the results presented here should be considered preliminary.
One mineral soil sample is collected on each FIA phase 3 plot according to well-documented protocols2 3 and sent to regional laboratories for chemical analysis4. Additional details on field measurements, laboratory processing, and estimation procedures are available (O’Neill and others 2005).
Exchangeable Ca and Al values were obtained from the soils database. The exchangeable cation information was converted to a molar ratio of Ca:Al using the atomic weights of the two elements. Cronan and Grigal (1995) defined thresholds for Ca:Al ratios in soil solution, but our measurements are taken in the mineral
fraction. We have yet to establish firm thresholds for these data. Information on forest-type group was added to each plot record by linking the soils database with the condition-level information available from FIA (Alerich and others 2007). Two different soil layers were evaluated: 0 to 10 cm and 10 to 20 cm. For mapping purposes, soil chemical properties were assigned to hexagons developed by the Environmental Monitoring and Assessment Program of the U.S. Environmental Protection Agency (Spence and White 1992, White and others 1992). Each hexagon has an area of approximately 648 km2, and their center points are roughly 27 km apart. Approximately 75 percent of the hexagons contained one measurement, 23 percent had two, and 2 percent had three or four observations. When multiple observations occurred in a hexagon, the results were summarized by finding the mean, minimum, and maximum values. Numeric data were imported into R for statistical analysis and
2 U.S. Department of Agriculture Forest Service. 2007. Phase 3 field guide: soil measurements and sampling [Online]. Version 4.0. www.fia.fs.fed.us/library/field-guides-methods-proc/. [Date accessed: November 1, 2008].
3 U.S. Department of Agriculture Forest Service. 2007. Forest inventory and analysis national core field guide [Online]. Field data collection procedures for phase 2 plots. Version 4.0. Vol. 1. www.fia.fs.fed.us/library/field-guides-methods-proc/. [Date accessed: November 1, 2008].
4 Amacher, M.C.; O’Neill, K.P.; Dresbach, R.; Palmer, C. 2003. Forest inventory and analysis manual of soil analysis methods. 62 p. Unpublished report. On file with: U.S. Department of Agriculture Forest Service, Rocky Mountain Research Station, Forestry Sciences Laboratory, 860 North 12th East, Logan, UT 84321.

123
plotting (R Development Core Team 2008). Results for soil pH were aggregated into classes developed by Amacher and others (2007).
What Do the Data Show?
Figure 9.1 depicts the spatial distribution of Ca:Al molar ratios in the two sampled soil layers. There are several interacting factors that create this pattern. First, southeastern soils are more highly weathered than northern and western soils. Average annual precipitation is higher, and more water moves through the soil profile. This increases the opportunity for mobile cations, such as Ca, to be transported out of the soil. Second, western soils are often rich in Ca due to the presence of carbonates in the soil profile. Carbonate minerals such as calcite and dolomite can accumulate in the subsoils of arid region soils. In areas with less rainfall, chemical weathering tends to be slower because of less leaching. Thus, carbonate minerals will persist in soil profiles subjected to less chemical weathering and buffer soil pH to near neutral
to alkaline pH levels. Finally, soils in the mid-Western and Northeastern United States were subjected to significant acid deposition (National Atmospheric Deposition Program 2008). Acid deposition preferentially leaches Ca out of the soil profile while increasing Al concentrations (Bailey and others 2005).
A close examination of the distribution of the large number of plots with very low Ca:Al (<0.2) in the Eastern United States reveals at least two spatial features. Clusters of low Ca:Al areas in the top 10 cm of soil are found in the southern Blue Ridge Mountains, the Allegheny National Forest in northern Pennsylvania, and in portions of New England. High-elevation sites are receiving greater amounts of acid deposition (Southern Appalachian Man and the Biosphere 1996), and there are likely to be other influences related to the spatial distribution of certain soil types or forest types. These patterns suggest that an analysis combining the soil Ca:Al data with other predictors such as elevation and geology is worth pursuing.
SECTIO
N 1 C
hapte
r 9Cri
terion
4 For
est He
alth M
onito
ring
124
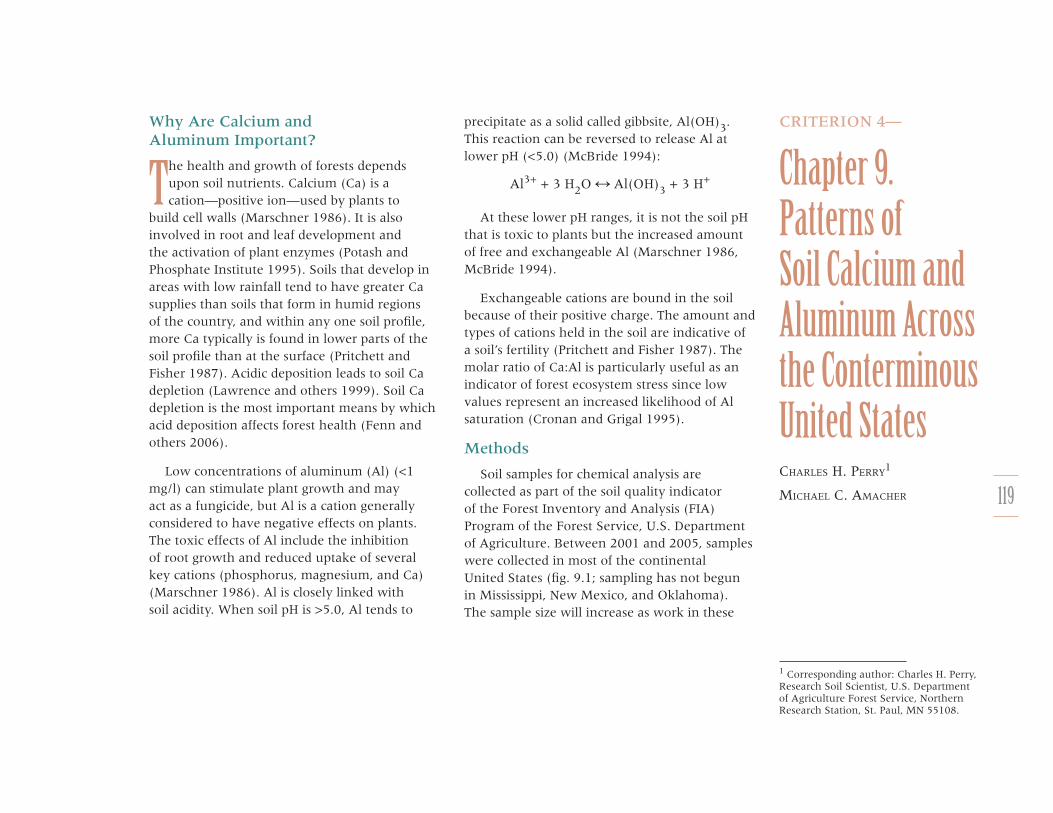
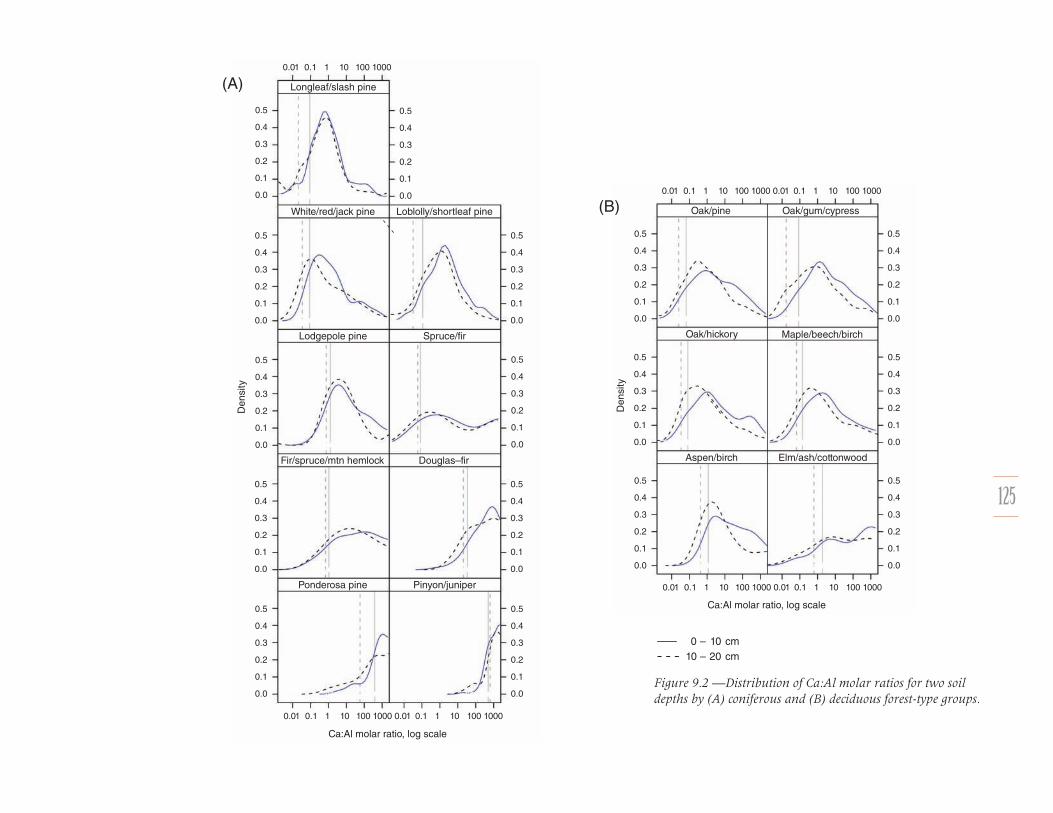
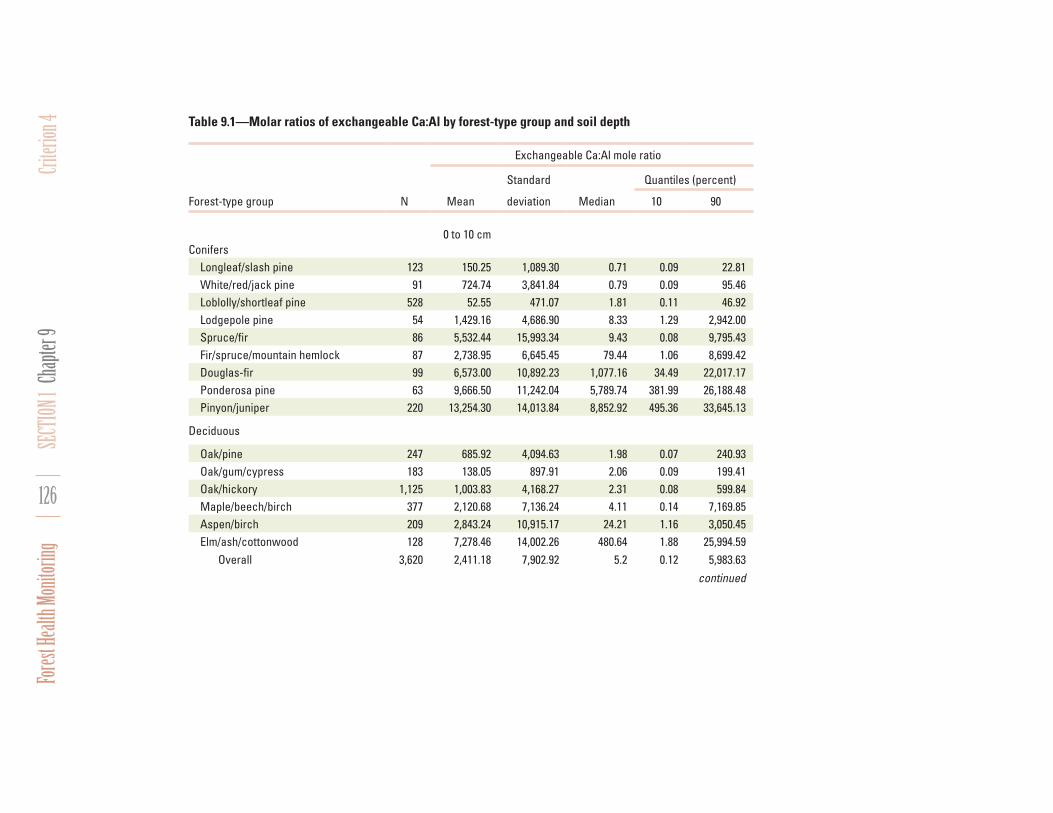
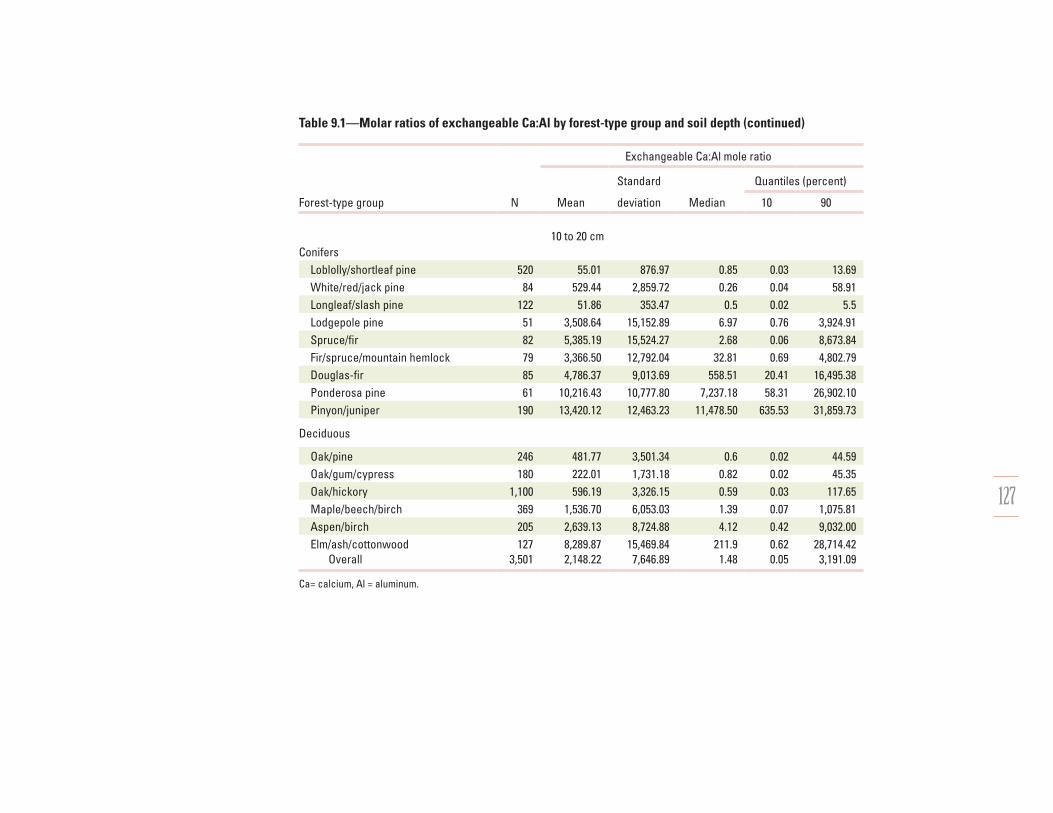
Figures 9.2A and 9.2B depict the frequency distribution (density) of Ca:Al molar ratios in the two sampled soil layers for each conifer and deciduous forest-type group, respectively. The vertical lines are the 10 percent quantile values of Ca:Al for each soil depth; 90 percent of the sample population of Ca:Al values exists to the right of each vertical line for each soil depth. Median, 10 and 90 percent quantiles of Ca:Al for each soil layer, and forest-type group are summarized in table 9.1. For consistency, the forest-type groups are arranged by increasing Ca:Al in the 0- to 10-cm layer.
Perry and Amacher (2009) introduced the soil quality indicator dataset, which documented the interaction of Ca and Al with soil pH. There are strong regional interactions with generally higher pH for given Al concentrations in the West. Western soils, being more basic with naturally higher pH, are less likely to exhibit problems; recall the gibbsite reaction.
Forest-ype groups commonly associated with the Western United States (e.g., lodgepole pine, Douglas-fir, ponderosa pine, pinyon-juniper, western aspen/birch, and western elm/ash/cottonwoods) are found on soils with higher Ca:Al ratios. This is to be expected given the amount of carbonates in western soils. Significant atmospheric deposition tends to occur in association with urban and agricultural areas, but some even originate in Asia (Fenn and others 2003b). The effects of nitrogen deposition in the West are a complicated mix of positive and negative outcomes that eventually alter the biotic community (Fenn and others 2003a). Studies of several of the major western tree species demonstrated reduced root growth with increased soil Al or soil acidification [see Pan and others (1991) for Douglas-fir, western larch, and Engelmann spruce; Keltjens (1990) for Douglas-fir; and Grulke and others (1998) for ponderosa pine].
125
0.5
0.4
0.3
0.2
0.1
0.0
0.5
0.4
0.3
0.2
0.1
0.0
0.5
0.4
0.3
0.2
0.1
0.0
0.01 0.1 1 10 100 1000 0.01 0.1 1 10 100 1000
0.5
0.4
0.3
0.2
0.1
0.0
0.5
0.4
0.3
0.2
0.1
0.0
0.5
0.4
0.3
0.2
0.1
0.0
Ca:Al molar ratio, log scale
Longleaf/slash pine
White/red/jack pine Loblolly/shortleaf pine
Lodgepole pine
0.01 0.1 1 10 100 1000
Den
sity
Spruce/fir
0.5
0.4
0.3
0.2
0.1
0.0
0.5
0.4
0.3
0.2
0.1
0.0
0.5
0.4
0.3
0.2
0.1
0.0
0.5
0.4
0.3
0.2
0.1
0.0
Fir/spruce/mtn hemlock Douglas–fir
Ponderosa pine Pinyon/juniper
0.5
0.4
0.3
0.2
0.1
0.0
0.5
0.4
0.3
0.2
0.1
0.0
0.5
0.4
0.3
0.2
0.1
0.0
0.01 0.1 1 10 100 1000 0.01 0.1 1 10 100 1000
0.5
0.4
0.3
0.2
0.1
0.0
0.5
0.4
0.3
0.2
0.1
0.0
0.5
0.4
0.3
0.2
0.1
0.0
Ca:Al molar ratio, log scale
Oak/pine Oak/gum/cypress
Oak/hickory Maple/beech/birch
Aspen/birch
0.01 0.1 1 10 100 1000 0.01 0.1 1 10 100 1000
Den
sity
Elm/ash/cottonwood
0 – 10 cm10 – 20 cm
Figure 9.2 —Distribution of Ca:Al molar ratios for two soil depths by (A) coniferous and (B) deciduous forest-type groups.
(A)
(B)
SECTIO
N 1 C
hapte
r 9Cri
terion
4 For
est He
alth M
onito
ring
126
Table 9.1—Molar ratios of exchangeable Ca:Al by forest-type group and soil depth (continued)
Exchangeable Ca:Al mole ratio
Standard Quantiles (percent)
Forest-type group N Mean deviation Median 10 90
0 to 10 cmConifers
Longleaf/slash pine 123 150.25 1,089.30 0.71 0.09 22.81White/red/jack pine 91 724.74 3,841.84 0.79 0.09 95.46Loblolly/shortleaf pine 528 52.55 471.07 1.81 0.11 46.92Lodgepole pine 54 1,429.16 4,686.90 8.33 1.29 2,942.00Spruce/fir 86 5,532.44 15,993.34 9.43 0.08 9,795.43Fir/spruce/mountain hemlock 87 2,738.95 6,645.45 79.44 1.06 8,699.42Douglas-fir 99 6,573.00 10,892.23 1,077.16 34.49 22,017.17Ponderosa pine 63 9,666.50 11,242.04 5,789.74 381.99 26,188.48Pinyon/juniper 220 13,254.30 14,013.84 8,852.92 495.36 33,645.13
Deciduous
Oak/pine 247 685.92 4,094.63 1.98 0.07 240.93Oak/gum/cypress 183 138.05 897.91 2.06 0.09 199.41Oak/hickory 1,125 1,003.83 4,168.27 2.31 0.08 599.84Maple/beech/birch 377 2,120.68 7,136.24 4.11 0.14 7,169.85Aspen/birch 209 2,843.24 10,915.17 24.21 1.16 3,050.45Elm/ash/cottonwood 128 7,278.46 14,002.26 480.64 1.88 25,994.59
Overall 3,620 2,411.18 7,902.92 5.2 0.12 5,983.63continued
127
Table 9.1—Molar ratios of exchangeable Ca:Al by forest-type group and soil depth (continued)
Exchangeable Ca:Al mole ratio
Standard Quantiles (percent)
Forest-type group N Mean deviation Median 10 90
10 to 20 cmConifers
Loblolly/shortleaf pine 520 55.01 876.97 0.85 0.03 13.69White/red/jack pine 84 529.44 2,859.72 0.26 0.04 58.91Longleaf/slash pine 122 51.86 353.47 0.5 0.02 5.5Lodgepole pine 51 3,508.64 15,152.89 6.97 0.76 3,924.91Spruce/fir 82 5,385.19 15,524.27 2.68 0.06 8,673.84Fir/spruce/mountain hemlock 79 3,366.50 12,792.04 32.81 0.69 4,802.79Douglas-fir 85 4,786.37 9,013.69 558.51 20.41 16,495.38Ponderosa pine 61 10,216.43 10,777.80 7,237.18 58.31 26,902.10Pinyon/juniper 190 13,420.12 12,463.23 11,478.50 635.53 31,859.73
Deciduous
Oak/pine 246 481.77 3,501.34 0.6 0.02 44.59Oak/gum/cypress 180 222.01 1,731.18 0.82 0.02 45.35Oak/hickory 1,100 596.19 3,326.15 0.59 0.03 117.65Maple/beech/birch 369 1,536.70 6,053.03 1.39 0.07 1,075.81Aspen/birch 205 2,639.13 8,724.88 4.12 0.42 9,032.00Elm/ash/cottonwood 127 8,289.87 15,469.84 211.9 0.62 28,714.42
Overall 3,501 2,148.22 7,646.89 1.48 0.05 3,191.09
Ca= calcium, Al = aluminum.
SECTIO
N 1 C
hapte
r 9Cri
terion
4 For
est He
alth M
onito
ring
128
Among the eastern coniferous forest-type groups, the right-skewed distribution and low 10 percent quantiles of Ca:Al ratios suggest that the longleaf/slash pine, white/red/jack pine, and loblolly/shortleaf groups are the most tolerant of Ca depletion and high exchangeable Al (table 9.1 and figure 9.2A). Messenger and others (1978) found white, red, and jack pine to be tolerant of high levels of Al; these species accumulate large quantities of Al in their leaf tissues. Loblolly and slash pine tolerate acute exposures to Al (Nowak and Friend 2006). Our data suggest that spruce/fir forest-type groups are also fairly tolerant of low Ca:Al, but high-elevation red spruce declines are linked to an imbalance between soil Al and Ca that reduces Ca supply to the trees (Schortle and Smith 1988). Our spruce/fir data are primarily (more than 70 percent) collected in northern white-cedar and balsam fir stands. Only 14 percent of our spruce/fir observations were made in red spruce stands. A greenhouse study found balsam fir roots were more tolerant of Al than red spruce (Schier 1985). The median Ca:Al associated with the most acid tolerant of these forest groups is <1, indicating that exchangeable Al can be greater than exchangeable Ca in soils supporting these forest-type groups. A 10-percent quantile of Ca:Al <0.1
(severe Ca depletion and high exchangeable Al) is only found associated with the most acid-tolerant conifer groups. Among the deciduous forest-type groups, the mixed oak forests, e.g., oak/hickory, are more tolerant of low Ca:Al than the maple/beech/birch group (table 9.1 and figure 9.2B). Sugar maple currently stands alone as a hardwood species with documented adverse effects linked to cation depletion (Fenn and others 2006).
Table 9.1 and figures 9.2A and 9.2B only show the frequency distribution of Ca:Al for each forest-type group. They provide no information about the health of the forests associated with these Ca:Al values. Still, the data do show what kinds of Ca:Al conditions are associated with different forest types. Given the statistical approach to sampling and the number of observations, we infer from the forest type and soil property distributions that certain forest groups either will not tolerate or cannot compete in conditions of soil Ca depletion and associated high exchangeable Al. Continued Ca depletion in hardwood-dominated forests of the southeastern Piedmont will yield Ca stocks below those required for merchantable timber production in approximately 80 years (Huntington and others

129
2000). Species dominance in northern hardwood forests shifts in response to a Ca gradient. Higher Ca soils were occupied by sugar maple, red maple, and white ash, while Ca-poor soils were dominated by beech, red oak, and eastern hemlock (van Breemen and others 1997). Thus, continued stress may cause some tree species to disappear and be replaced by other more acid-tolerant species. Since certain conifer groups tend to be more tolerant of low Ca:Al than most deciduous species, we can expect conifer replacement of some deciduous forests with increasing forest acidification. The range of red maple may also expand given the apparent benefits of acid deposition to its regeneration (Bigelow and Canham 2002). These effects of soil chemistry may interact with anticipated climate changes in ways that complicate models of species migration.
Literature CitedAlerich, C.L.; Klevgard, L.; Liff, C. [and others]. 2007.
The forest inventory and analysis database: database description and users guide [Online]. Version 3.0. http://www.fia.fs.fed.us/library/database-documentation/. [Date accessed November 1, 2008].
Amacher, M.C.; O’Neill, K.P.; Perry, C.H. 2007. Soil vital signs: a new soil quality index (SQI) for assessing forest soil health. Research Paper RMRS-RP-65WWW. Fort Collins, CO: U.S. Department of Agriculture, Forest Service, Rocky Mountain Research Station. 12 p.
Bailey, S.W.; Horsley, S.B.; Long, R.P. 2005. Thirty years of change in forest soils of the Allegheny Plateau, Pennsylvania. Soil Science Society of America Journal. 69(3): 681–690.
Bigelow, S.W.; Canham, C.D. 2002. Community organization of tree species along soil gradients in the North-Eastern USA forest. Journal of Ecology. 90: 188–200. 10.1046/j.0022-0477.2001.00655.x.
Cronan, C.S.; Grigal, D.F. 1995. Use of calcium/aluminum ratios as indicators of stress in forest ecosystems. Journal of Environmental Quality. 24(2): 209–226.
Fenn, M.E.; Baron, J.S.; Allen, E.B. [and others]. 2003a. Ecological effects of nitrogen deposition in the Western United States. BioScience. 53(4): 404–420.
Fenn, M.E.; Haeuber, R.; Tonnesen, G.S. [and others]. 2003b. Nitrogen emissions, deposition, and monitoring in the Western United States. BioScience. 53(4): 391–403.
Fenn, M.E.; Huntington, T.G.; McLaughlin, S.B. [and others]. 2006. Status of soil acidification in North America. Journal of Forest Science. 52: 3–13.
Grulke, N.E.; Andersen, C.P.; Fenn, M.E.; Miller, P.R. 1998. Ozone exposure and nitrogen deposition lowers root biomass of ponderosa pine in the San Bernardino Mountains, California. Environmental Pollution. 103: 63–73.
Huntington, T.G.; Hooper, R.P.; Johnson, C.E. [and others]. 2000. Calcium depletion in a Southeastern United States forest ecosystem. Soil Science Society of America Journal. 64: 1845–1858.
Keltjens, W.G. 1990. Effects of aluminum on growth and nutrient status of Douglas-fir seedlings grown in culture solution. Tree Physiology. 6: 166–175.
SECTIO
N 1 C
hapte
r 9Cri
terion
4 For
est He
alth M
onito
ring
130
Lawrence, G.B.; David, M.B.; Lovett, G.M. [and others]. 1999. Soil calcium status and the response of stream chemistry to changing acidic deposition rates. Ecological Applications. 9(3): 1059–1072.
Marschner, H. 1986. Mineral nutrition of higher plants. London: Academic Press. 674 p.
McBride, M.B. 1994. Environmental chemistry of soils. New York: Oxford University Press. 406 p.
Messenger, A.S.; Kline, J.R.; Wilderotter, D. 1978. Aluminum biocycling as a factor in soil change. Plant and Soil. 49: 703–709.
National Atmospheric Deposition Program. 2008. Isopleth maps [Online]. Urbana-Champaign, IL. http://nadp.sws.uicu.edu/NTN/maps.aspx. [Date accessed: November 1, 2008].
Nowak, J.; Friend, A.L. 2006. Loblolly pine and slash pine responses to acute aluminum and acid exposures. Tree Physiology. 26: 1207–1215.
O’Neill, K.P.; Amacher, M.C.; Perry, C.H. 2005. Soils as an indicator of forest health: a guide to the collection, analysis, and interpretation of soil indicator data in the forest inventory and analysis program. Gen. Tech. Rep NC-258. St. Paul, MN: U.S. Department of Agriculture Forest Service, North Central Research Station. 53 p.
Pan, W.L.; Black, R.A.; Harsh, J.B. [and others]. 1991. Morphology, root conductivity, and mineral accumulation of Northwest U.S. tree species in response to acid deposition in artificial soil. In: Wright, R.J.; Baligar, V.C.; Murrmann, R.P., eds. Developments in plant and soil sciences. Kluwer Academic: 989–997.
Perry, C.H.; Amacher, M.C. 2009. Forest soils. In: Smith, W.B.; Miles, P.D.; Perry, C.H.; Pugh, S.A., tech. coords. Forest resources of the United States, 2007. Gen. Tech. Rep. WO–78. Washington, DC: U.S. Department of Agriculture Forest Service: 42–44.
Potash and Phosphate Institute. 1995. Soil fertility manual. Atlanta: Potash and Phosphate Institute. 116 p.
Pritchett, W.L.; Fisher, R.F. 1987. Properties and management of forest soils. 2d ed. New York: John Wiley. 494 p.
R Development Core Team. 2008. R: a language and environment for statistical computing. Vienna, Austria: R Foundation for Statistical Computing.
Schier, G.A. 1985. Response of red spruce and balsam fir seedlings to aluminum toxicity in nutrient solutions. Canadian Journal of Forest Research. 15(1): 29–33. 10.1139/x85-007.
Schortle, W.C.; Smith, K.T. 1988. Aluminum-induced calcium deficiency syndrome in declining red spruce. Science. 240(4855): 1017–1018. 10.1126/science.240.4855.1017.
Southern Appalachian Man and the Biosphere. 1996. The southern Appalachian assessment atmospheric technical report. Report 3 of 5. Atlanta: U.S. Department of Agriculture Forest Service, Southern Region. 83 p.
Spence, M.; White, D. 1992. EMAP sampling grid technical report. Corvallis, OR: U.S. EPA Environmental Research Laboratory, ManTech Environmental Technology, Inc. 64 p.
van Breemen, N.; Finzi, A.C.; Canham, C.D. 1997. Canopy tree-soil interactions within temperate forests: effects of soil elemental composition and texture on species distributions. Canadian Journal of Forest Research. 27(7): 1110–1116. 10.1139/cjfr-27-7-1110.
White, D.; Kimerling, A.J.; Overton, W.S. 1992. Cartographic and geometric components of a global sampling design for environmental monitoring. Cartography and Geographic Information Systems. 19(1): 5–21.