Embed Size (px)
Citation preview

Undergraduate programmes
Syllabus
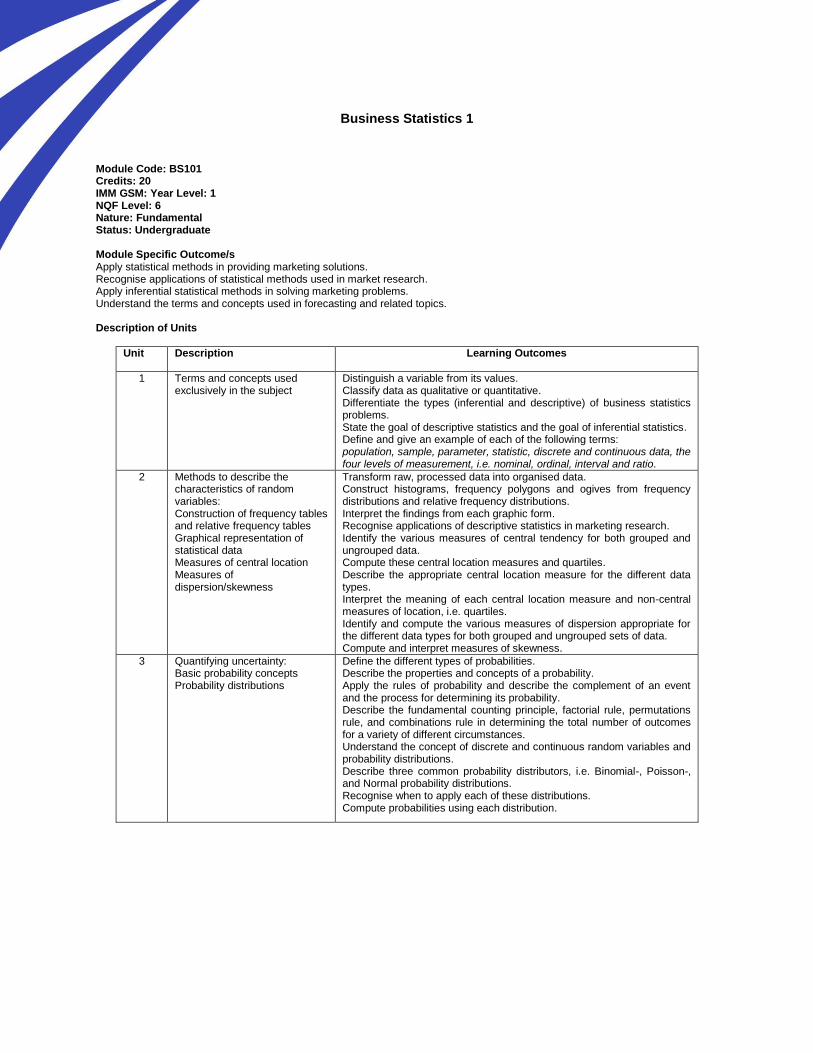
Business Statistics 1
Module Code: BS101 Credits: 20 IMM GSM: Year Level: 1 NQF Level: 6 Nature: Fundamental Status: Undergraduate Module Specific Outcome/s Apply statistical methods in providing marketing solutions. Recognise applications of statistical methods used in market research. Apply inferential statistical methods in solving marketing problems. Understand the terms and concepts used in forecasting and related topics. Description of Units
Unit Description Learning Outcomes
1 Terms and concepts used exclusively in the subject
Distinguish a variable from its values. Classify data as qualitative or quantitative. Differentiate the types (inferential and descriptive) of business statistics problems. State the goal of descriptive statistics and the goal of inferential statistics. Define and give an example of each of the following terms: population, sample, parameter, statistic, discrete and continuous data, the four levels of measurement, i.e. nominal, ordinal, interval and ratio.
2 Methods to describe the characteristics of random variables: Construction of frequency tables and relative frequency tables Graphical representation of statistical data Measures of central location Measures of dispersion/skewness
Transform raw, processed data into organised data. Construct histograms, frequency polygons and ogives from frequency distributions and relative frequency distributions. Interpret the findings from each graphic form. Recognise applications of descriptive statistics in marketing research. Identify the various measures of central tendency for both grouped and ungrouped data. Compute these central location measures and quartiles. Describe the appropriate central location measure for the different data types. Interpret the meaning of each central location measure and non-central measures of location, i.e. quartiles. Identify and compute the various measures of dispersion appropriate for the different data types for both grouped and ungrouped sets of data. Compute and interpret measures of skewness.
3 Quantifying uncertainty: Basic probability concepts Probability distributions
Define the different types of probabilities. Describe the properties and concepts of a probability. Apply the rules of probability and describe the complement of an event and the process for determining its probability. Describe the fundamental counting principle, factorial rule, permutations rule, and combinations rule in determining the total number of outcomes for a variety of different circumstances. Understand the concept of discrete and continuous random variables and probability distributions. Describe three common probability distributors, i.e. Binomial-, Poisson-, and Normal probability distributions. Recognise when to apply each of these distributions. Compute probabilities using each distribution.
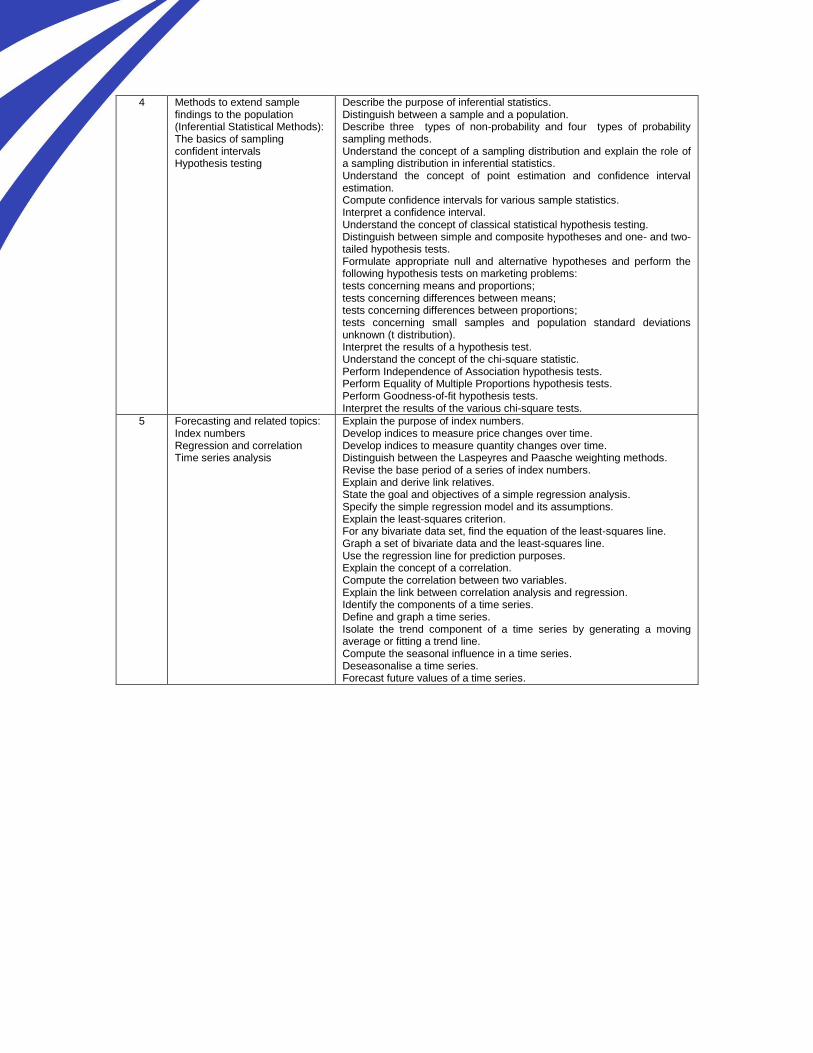
4 Methods to extend sample findings to the population (Inferential Statistical Methods): The basics of sampling confident intervals Hypothesis testing
Describe the purpose of inferential statistics. Distinguish between a sample and a population. Describe three types of non-probability and four types of probability sampling methods. Understand the concept of a sampling distribution and explain the role of a sampling distribution in inferential statistics. Understand the concept of point estimation and confidence interval estimation. Compute confidence intervals for various sample statistics. Interpret a confidence interval. Understand the concept of classical statistical hypothesis testing. Distinguish between simple and composite hypotheses and one- and two-tailed hypothesis tests. Formulate appropriate null and alternative hypotheses and perform the following hypothesis tests on marketing problems: tests concerning means and proportions; tests concerning differences between means; tests concerning differences between proportions; tests concerning small samples and population standard deviations unknown (t distribution). Interpret the results of a hypothesis test. Understand the concept of the chi-square statistic. Perform Independence of Association hypothesis tests. Perform Equality of Multiple Proportions hypothesis tests. Perform Goodness-of-fit hypothesis tests. Interpret the results of the various chi-square tests.
5 Forecasting and related topics: Index numbers Regression and correlation Time series analysis
Explain the purpose of index numbers. Develop indices to measure price changes over time. Develop indices to measure quantity changes over time. Distinguish between the Laspeyres and Paasche weighting methods. Revise the base period of a series of index numbers. Explain and derive link relatives. State the goal and objectives of a simple regression analysis. Specify the simple regression model and its assumptions. Explain the least-squares criterion. For any bivariate data set, find the equation of the least-squares line. Graph a set of bivariate data and the least-squares line. Use the regression line for prediction purposes. Explain the concept of a correlation. Compute the correlation between two variables. Explain the link between correlation analysis and regression. Identify the components of a time series. Define and graph a time series. Isolate the trend component of a time series by generating a moving average or fitting a trend line. Compute the seasonal influence in a time series. Deseasonalise a time series. Forecast future values of a time series.