Embed Size (px)
Citation preview
ATSB TRANSPORT SAFETY INVESTIGATION REPORTAviation Research and Analysis Report – B2004/0321
Final
Human factors analysis of Australian aviation accidents and
comparison with the United States

ATSB TRANSPORT SAFETY INVESTIGATION REPORT Aviation Research and Analysis Report
B2004/0321 Final
Human factors analysis of Australian aviation accidents and comparison with the United
States
Released in accordance with section 25 of the Transport Safety Investigation Act 2003
Published by: Australian Transport Safety Bureau Postal address: PO Box 967, Civic Square ACT 2608 Office location: 15 Mort Street, Canberra City, Australian Capital Territory Telephone: 1800 621 372; from overseas + 61 2 6274 6130 Accident and incident notification: 1800 011 034 (24 hours) Facsimile: 02 6274 6474; from overseas + 61 2 6274 6474 E-mail: [email protected] Internet: www.atsb.gov.au
© Commonwealth of Australia 2007.
This work is copyright. In the interests of enhancing the value of the information contained in this publication you may copy, download, display, print, reproduce and distribute this material in unaltered form (retaining this notice). However, copyright in the material obtained from non-Commonwealth agencies, private individuals or organisations, belongs to those agencies, individuals or organisations. Where you want to use their material you will need to contact them directly.
Subject to the provisions of the Copyright Act 1968, you must not make any other use of the material in this publication unless you have the permission of the Australian Transport Safety Bureau.
Please direct requests for further information or authorisation to: Commonwealth Copyright Administration, Copyright Law Branch Attorney-General’s Department, Robert Garran Offices, National Circuit, Barton ACT 2600 www.ag.gov.au/cca
ISBN and formal report title: see ‘Document retrieval information’ on page v.
– ii –
CONTENTS
THE AUSTRALIAN TRANSPORT SAFETY BUREAU ................................. vi
EXECUTIVE SUMMARY .................................................................................. vii
ABBREVIATIONS................................................................................................ ix
1 INTRODUCTION .......................................................................................... 1 1.1 Background........................................................................................... 1 1.2 Description of HFACS ......................................................................... 2
1.2.1 Errors .................................................................................. 3 1.2.2 Violations............................................................................ 3
1.3 Validation of HFACS ........................................................................... 4 1.4 Objectives of the current study ............................................................. 5
2 METHODOLOGY ......................................................................................... 7 2.1 Data sources.......................................................................................... 7 2.2 Classification of flying operations........................................................ 7 2.3 Coding methodology ............................................................................ 8 2.4 Coding technique.................................................................................. 9 2.5 Quality assurance process................................................................... 10 2.6 Statistical analyses .............................................................................. 10
3 ANALYSIS OF THE DATA ........................................................................ 11 3.1 Comparison of Australian and US accidents and flying activities ..... 11
3.1.1 Accidents by type of flying operation............................... 11 3.1.2 Flying hours by type of flying operation .......................... 11 3.1.3 Accident occurrence and phase of flight........................... 13
3.2 HFACS ............................................................................................... 16 3.2.1 Accidents with at least one aircrew unsafe act ................. 16 3.2.2 Trends in aircrew unsafe acts............................................ 18 3.2.3 Unsafe acts by type of flying operation ............................ 19 3.2.4 Fatal and non-fatal accidents and aircrew unsafe acts ...... 22 3.2.5 Precipitating error ............................................................. 24
4 DISCUSSION ................................................................................................ 25 4.1 What does the application of HFACS tell us about Australian
aviation? ............................................................................................. 25 4.2 How do Australia and the US compare?............................................. 26
– iii –
4.3 What is the utility of HFACS?............................................................ 28
5 CONCLUSIONS ........................................................................................... 31
6 APPENDIXES............................................................................................... 33 Appendix A Description of the Human Factors Analysis and
Classification System (HFACS) ......................................................... 33 Unsafe acts of operators ..................................................................... 33 Preconditions for unsafe acts.............................................................. 34 Unsafe supervision ............................................................................. 36 Organisational Influences ................................................................... 37 References .......................................................................................... 38
Appendix B Occurrence codes and phase of flight codes ..................... 39 Appendix C Result details..................................................................... 42
7 REFERENCES.............................................................................................. 47
– iv –
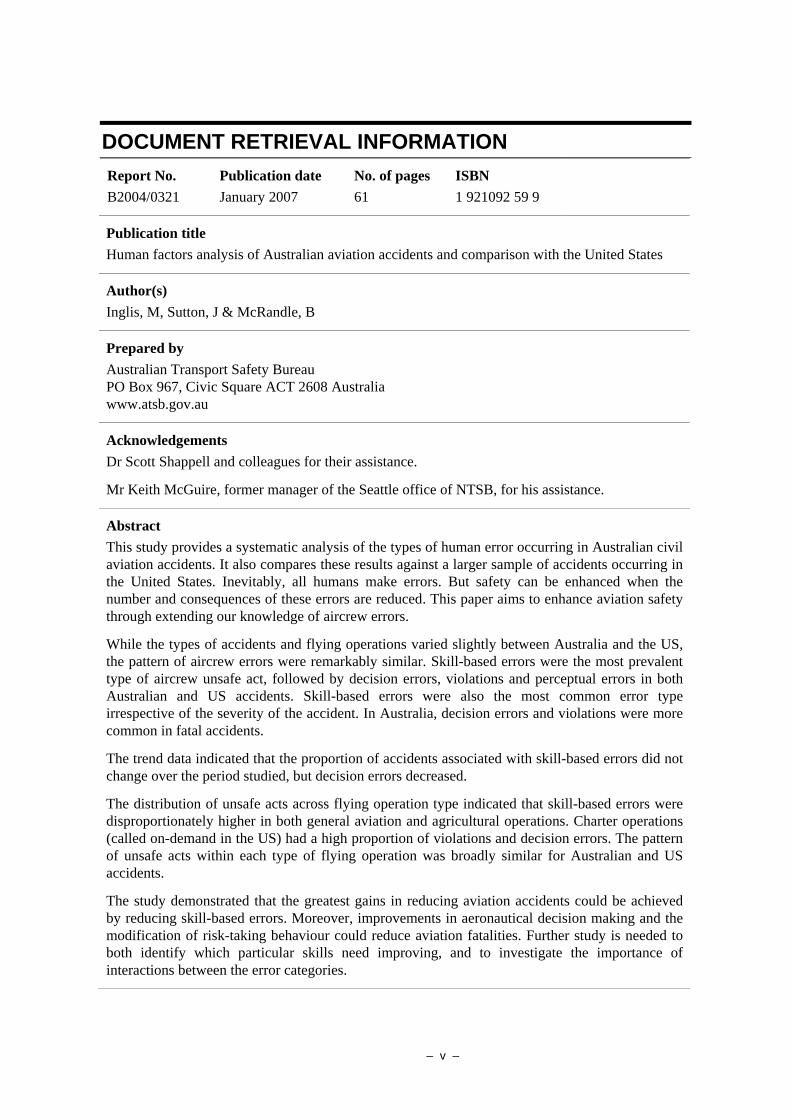
DOCUMENT RETRIEVAL INFORMATION Report No. B2004/0321
Publication date January 2007
No. of pages 61
ISBN 1 921092 59 9
Publication title Human factors analysis of Australian aviation accidents and comparison with the United States
Author(s) Inglis, M, Sutton, J & McRandle, B
Prepared by Australian Transport Safety Bureau PO Box 967, Civic Square ACT 2608 Australia www.atsb.gov.au
Acknowledgements Dr Scott Shappell and colleagues for their assistance.
Mr Keith McGuire, former manager of the Seattle office of NTSB, for his assistance.
Abstract This study provides a systematic analysis of the types of human error occurring in Australian civil aviation accidents. It also compares these results against a larger sample of accidents occurring in the United States. Inevitably, all humans make errors. But safety can be enhanced when the number and consequences of these errors are reduced. This paper aims to enhance aviation safety through extending our knowledge of aircrew errors.
While the types of accidents and flying operations varied slightly between Australia and the US, the pattern of aircrew errors were remarkably similar. Skill-based errors were the most prevalent type of aircrew unsafe act, followed by decision errors, violations and perceptual errors in both Australian and US accidents. Skill-based errors were also the most common error type irrespective of the severity of the accident. In Australia, decision errors and violations were more common in fatal accidents.
The trend data indicated that the proportion of accidents associated with skill-based errors did not change over the period studied, but decision errors decreased.
The distribution of unsafe acts across flying operation type indicated that skill-based errors were disproportionately higher in both general aviation and agricultural operations. Charter operations (called on-demand in the US) had a high proportion of violations and decision errors. The pattern of unsafe acts within each type of flying operation was broadly similar for Australian and US accidents.
The study demonstrated that the greatest gains in reducing aviation accidents could be achieved by reducing skill-based errors. Moreover, improvements in aeronautical decision making and the modification of risk-taking behaviour could reduce aviation fatalities. Further study is needed to both identify which particular skills need improving, and to investigate the importance of interactions between the error categories.
– v –
THE AUSTRALIAN TRANSPORT SAFETY BUREAU
The Australian Transport Safety Bureau (ATSB) is an operationally independent multi-modal Bureau within the Australian Government Department of Transport and Regional Services. ATSB investigations are independent of regulatory, operator or other external bodies.
The ATSB is responsible for investigating accidents and other transport safety matters involving civil aviation, marine and rail operations in Australia that fall within Commonwealth jurisdiction, as well as participating in overseas investigations involving Australian registered aircraft and ships. A primary concern is the safety of commercial transport, with particular regard to fare-paying passenger operations. Accordingly, the ATSB also conducts investigations and studies of the transport system to identify underlying factors and trends that have the potential to adversely affect safety.
The ATSB performs its functions in accordance with the provisions of the Transport Safety Investigation Act 2003 and, where applicable, relevant international agreements. The object of a safety investigation is to determine the circumstances to prevent other similar events. The results of these determinations form the basis for safety action, including recommendations where necessary. As with equivalent overseas organisations, the ATSB has no power to implement its recommendations.
It is not the object of an investigation to determine blame or liability. However, it should be recognised that an investigation report must include factual material of sufficient weight to support the analysis and findings. That material will at times contain information reflecting on the performance of individuals and organisations, and how their actions may have contributed to the outcomes of the matter under investigation. At all times the ATSB endeavours to balance the use of material that could imply adverse comment with the need to properly explain what happened, and why, in a fair and unbiased manner.
Central to the ATSB’s investigation of transport safety matters is the early identification of safety issues in the transport environment. While the Bureau issues recommendations to regulatory authorities, industry, or other agencies in order to address safety issues, its preference is for organisations to make safety enhancements during the course of an investigation. The Bureau is pleased to report positive safety action in its final reports rather than make formal recommendations. Recommendations may be issued in conjunction with ATSB reports or independently. A safety issue may lead to a number of similar recommendations, each issued to a different agency.
The ATSB does not have the resources to carry out a full cost-benefit analysis of each safety recommendation. The cost of a recommendation must be balanced against its benefits to safety, and transport safety involves the whole community. Such analysis is a matter for the body to which the recommendation is addressed (for example, the relevant regulatory authority in aviation, marine or rail in consultation with the industry).
– vi –
EXECUTIVE SUMMARY
All humans make errors as an inevitable consequence of being human (Adams, 2006; Helmreich & Merritt, 1998). The role of human error in aviation accidents is well established with previous studies reporting that between 70% and 80% of aviation accidents result from some type of human error (Lourens, 1989; O'Hare et al., 1994). The greatest potential for reducing aviation accidents lies in understanding the human contribution to accidents (Wiegmann & Shappell, 2001). When the number and consequences of errors are reduced, safety is enhanced (Adams, 2006; Helmreich & Merritt, 1998).
This study used the Human Factors Analysis and Classification System (HFACS) to analyse the unsafe acts of aircrew in Australian civil aviation accidents and to compare them with the unsafe acts of aircrew in accidents in the United States of America (US).
The Human Factors Analysis and Classification System is a taxonomy that describes the human factors that contribute to an accident or incident. It is based on a sequential or chain-of-events theory of accident causation. The classification system has four levels, each of which influences the next level. These four levels are called: 1) organisational influences, 2) unsafe supervision, 3) preconditions for unsafe acts, and 4) unsafe acts of operators (Wiegmann & Shappell, 2003). While HFACS has limitations, it has the advantage of being a mature tool with a vast US-based database and accompanying analysis.
This study is based on 10 years of Australian and US accident data. The US accidents had been coded by the NTSB using their taxonomy, with HFACS applied subsequently by the Federal Aviation Administration (FAA). For the purpose of this study, the Australian accidents were reclassified using the US National Transportation Safety Board (NTSB) aviation accident taxonomy and HFACS to enable direct comparison with the US data.
The Australian results showed that the most prevalent unsafe acts were skill-based errors, followed by decision errors, violations and perceptual errors, respectively:
• The distribution of unsafe acts across flying operation type indicated that charter operations (called on-demand in the US) had a relatively high proportion of violations, decision errors and perceptual errors. Skill-based errors were disproportionately high in both general aviation and agricultural operations. Very few aircrew-related violations were identified in aerial agriculture accidents.
• The trend data indicated that the proportion of accidents with a skill-based error did not decrease over time, but the proportion of accidents associated with decision errors decreased. It is unclear what lies behind these findings.
• The pattern of aircrew errors varied with the severity of the accident. Violations, decision errors and perceptual errors were more likely to be identified as factors for fatal accidents.
The comparison with the US accidents demonstrated a remarkably similar pattern, and both countries had a similar proportion of accidents where at least one unsafe act could be identified (around 70%). General aviation operations were responsible for the vast majority of accidents and the majority of errors and violations. The rank order of unsafe act categories was the same in both sets of accidents. Skill-based
– vii –
errors were the most common type of aircrew error, followed by decision errors, violations and perceptual errors, respectively.
While the pattern was very similar, the Australian and US results differed with a higher percentage of skill-based errors in Australian accidents and a significantly lower number of Australian accidents associated with violations. There was also a difference in the frequency of decision errors and perceptual errors between fatal and non-fatal accidents in Australia, which was not observed in the results for US accidents. The study found that around 11% of Australian accidents resulted in a fatality, but 21% of US accidents resulted in a fatality. The reasons for this difference were not able to be explained by HFACS.
The results of this study have provided a broad overview of the types of unsafe acts made by aircrew in different operational categories. In summary, it seems likely that a reduction in skill-based errors will result in fewer aviation accidents, but a reduction in fatal accidents will be dependent upon reducing violations and improving aeronautical decision making.
Subsequent studies should seek to identify, more precisely, the most important types of skill-based errors, decision errors, perceptual errors and violations associated with accidents. Future research could helpfully probe the interaction between error types, and between errors and violations, as a means to better understand the factors important for fatal accidents.
– viii –
ABBREVIATIONS ATSB Australian Transport Safety Bureau
CASA Civil Aviation Safety Authority
CFIT Controlled flight into terrain
CFR Code of Federal Regulation (US)
FAA Federal Aviation Administration (US)
HFACS Human Factors Analysis and Classification System
IMC Instrument meteorological conditions
NTSB National Transportation Safety Board (US)
VFR Visual flight rules
– ix –

– x –
1 INTRODUCTION
1.1 Background All humans make errors as an inevitable consequence of being human (Adams, 2006; Helmreich & Merritt, 1998). The role of human error in aviation accidents is well established with previous studies reporting that between 70% and 80% of aviation accidents result from some type of human error (Lourens, 1989; O'Hare et al., 1994). The greatest potential for reducing aviation accidents lies in understanding the human contribution to accidents (Wiegmann & Shappell, 2001). When the number and consequences of errors are reduced, safety is enhanced (Adams, 2006; Helmreich & Merritt, 1998).
There is potential to learn more about the categories or nature of human factors occurring in Australian accidents. The Australian Transport Safety Bureau (ATSB) maintains a large database of aviation accidents that includes information on the actions of the crew and others involved in the accident sequence, the aircraft, the location and environmental factors and a description of the accident sequence. While individual investigations have explored the human factors relevant to each particular accident, these have not previously been analysed for the purpose of identifying all the human factors involved in a large sample of accidents.
Analysis of the contributing human factors will tell us a vital part of the story. It will provide information on the types of human errors made in accidents and identify trends. The significance of the results will be increased by comparison with other accident data. Comparison against another country’s accident data will assist in the interpretation of Australian results or, in other words, provide a frame of reference. It will help clarify our strengths and weaknesses in this important area of aviation safety.
The benefit to aviation safety of increasing our knowledge of the type of human factors contributing to accidents and comparing it against international data includes the ability to:
• identify safety problems
• design evidence-based interventions that work towards reducing accidents and error frequencies
• learn from solutions developed by other countries, and
• provide an opportunity for other countries to learn from Australian initiatives.
The Human Factors Analysis and Classification System (HFACS; described below) enables us to both systematically analyse the human factors intrinsic to aviation accidents and compare the Australian results against the much larger accident set from the United States of America (US). The use of HFACS will also allow future comparison against other countries that are also using this taxonomy. The use of a common classification system removes the previously experienced problems in comparing aviation data collected with different coding schemes (O'Hare, 2000).
Although similar in many ways, the US aviation industry is considerably larger than the Australian industry and accordingly has about 10 times the number of reported accidents. There are considerably more resources and information available in the US to design and fund aviation safety programs. The rationale behind comparing Australian and US data is to discover whether there are similar trends in involvement of human
– 1 –
factors in aviation accidents. If this is the case, it may be reasonable to assume that solutions to common problems developed in one country will be transferable to the other.
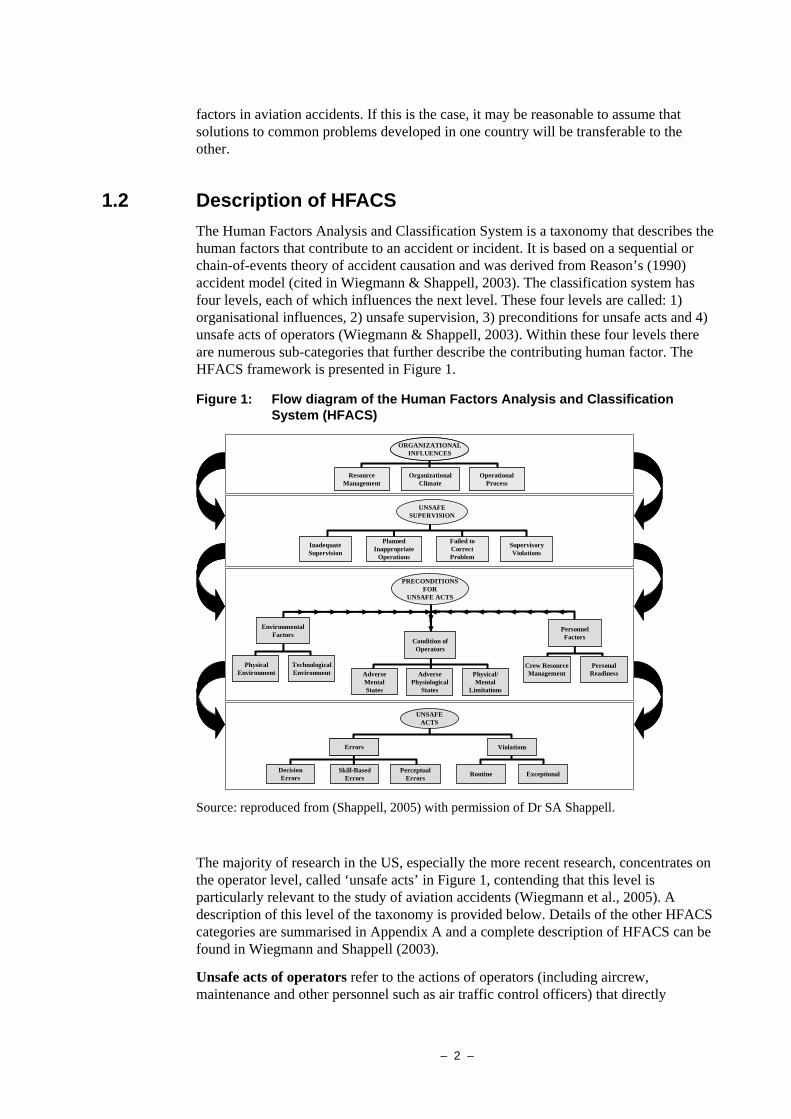
1.2 Description of HFACS The Human Factors Analysis and Classification System is a taxonomy that describes the human factors that contribute to an accident or incident. It is based on a sequential or chain-of-events theory of accident causation and was derived from Reason’s (1990) accident model (cited in Wiegmann & Shappell, 2003). The classification system has four levels, each of which influences the next level. These four levels are called: 1) organisational influences, 2) unsafe supervision, 3) preconditions for unsafe acts and 4) unsafe acts of operators (Wiegmann & Shappell, 2003). Within these four levels there are numerous sub-categories that further describe the contributing human factor. The HFACS framework is presented in Figure 1.
Figure 1: Flow diagram of the Human Factors Analysis and Classification System (HFACS)
Errors
UNSAFEACTS
Errors
PerceptualErrors
Skill-BasedErrors
DecisionErrors ExceptionalRoutine
Violations
InadequateSupervision
PlannedInappropriate
Operations
Failed toCorrectProblem
SupervisoryViolations
UNSAFESUPERVISION
ResourceManagement
OrganizationalClimate
OperationalProcess
ORGANIZATIONALINFLUENCES
PRECONDITIONSFOR
UNSAFE ACTS
Condition of Operators
Physical/Mental
Limitations
Adverse Mental States
Technological Environment
Physical Environment
PersonalReadiness
Crew Resource Management
Personnel Factors
Adverse Physiological
States
Environmental Factors
Source: reproduced from (Shappell, 2005) with permission of Dr SA Shappell.
The majority of research in the US, especially the more recent research, concentrates on the operator level, called ‘unsafe acts’ in Figure 1, contending that this level is particularly relevant to the study of aviation accidents (Wiegmann et al., 2005). A description of this level of the taxonomy is provided below. Details of the other HFACS categories are summarised in Appendix A and a complete description of HFACS can be found in Wiegmann and Shappell (2003).
Unsafe acts of operators refer to the actions of operators (including aircrew, maintenance and other personnel such as air traffic control officers) that directly
– 2 –
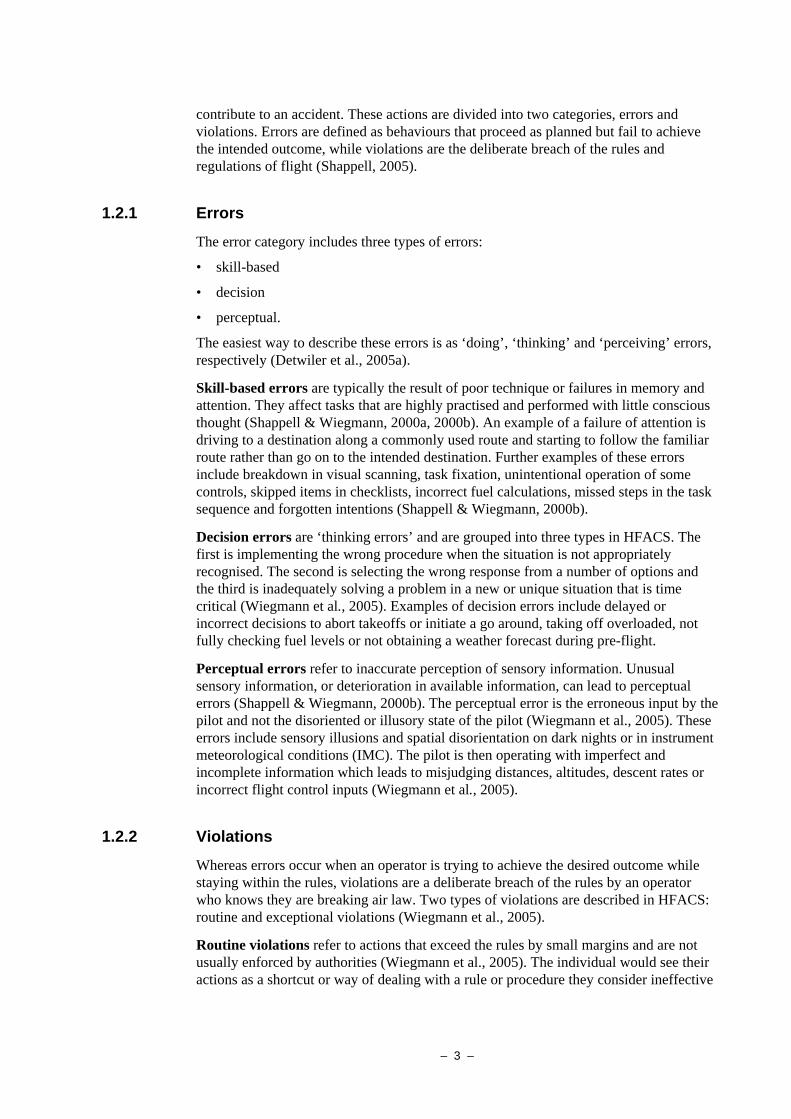
contribute to an accident. These actions are divided into two categories, errors and violations. Errors are defined as behaviours that proceed as planned but fail to achieve the intended outcome, while violations are the deliberate breach of the rules and regulations of flight (Shappell, 2005).
1.2.1 Errors
The error category includes three types of errors:
• skill-based
• decision
• perceptual.
The easiest way to describe these errors is as ‘doing’, ‘thinking’ and ‘perceiving’ errors, respectively (Detwiler et al., 2005a).
Skill-based errors are typically the result of poor technique or failures in memory and attention. They affect tasks that are highly practised and performed with little conscious thought (Shappell & Wiegmann, 2000a, 2000b). An example of a failure of attention is driving to a destination along a commonly used route and starting to follow the familiar route rather than go on to the intended destination. Further examples of these errors include breakdown in visual scanning, task fixation, unintentional operation of some controls, skipped items in checklists, incorrect fuel calculations, missed steps in the task sequence and forgotten intentions (Shappell & Wiegmann, 2000b).
Decision errors are ‘thinking errors’ and are grouped into three types in HFACS. The first is implementing the wrong procedure when the situation is not appropriately recognised. The second is selecting the wrong response from a number of options and the third is inadequately solving a problem in a new or unique situation that is time critical (Wiegmann et al., 2005). Examples of decision errors include delayed or incorrect decisions to abort takeoffs or initiate a go around, taking off overloaded, not fully checking fuel levels or not obtaining a weather forecast during pre-flight.
Perceptual errors refer to inaccurate perception of sensory information. Unusual sensory information, or deterioration in available information, can lead to perceptual errors (Shappell & Wiegmann, 2000b). The perceptual error is the erroneous input by the pilot and not the disoriented or illusory state of the pilot (Wiegmann et al., 2005). These errors include sensory illusions and spatial disorientation on dark nights or in instrument meteorological conditions (IMC). The pilot is then operating with imperfect and incomplete information which leads to misjudging distances, altitudes, descent rates or incorrect flight control inputs (Wiegmann et al., 2005).
1.2.2 Violations
Whereas errors occur when an operator is trying to achieve the desired outcome while staying within the rules, violations are a deliberate breach of the rules by an operator who knows they are breaking air law. Two types of violations are described in HFACS: routine and exceptional violations (Wiegmann et al., 2005).
Routine violations refer to actions that exceed the rules by small margins and are not usually enforced by authorities (Wiegmann et al., 2005). The individual would see their actions as a shortcut or way of dealing with a rule or procedure they consider ineffective
– 3 –
or unnecessary. For example, pilots who regularly fly without carrying their licence or medical certificate.
Exceptional violations, by contrast, are not characteristic of the individual, nor condoned by management or regulators (Wiegmann et al., 2005). An example of an extreme violation is a normally conscientious pilot flying under the Sydney Harbour Bridge without approval. These violations often significantly deviate from rules or regulations.
The US studies do not try to classify violations to this level as there is generally insufficient information to say if they were routine or exceptional. For this reason, the ATSB did not attempt to specify the type of violation in this study.
1.3 Validation of HFACS The Human Factors Analysis and Classification System was originally developed for use within the US military both to guide investigations and to analyse accident data (Shappell & Wiegmann, 2000b). Since its development, the classification system has been used in a variety of transport and occupational settings including aviation, road and rail transport (Federal Railroad Administration, 2005; Gaur, 2005; Li & Harris, 2005; Pape et al., 2001; Shappell, 2005; Shappell & Wiegmann, 2000a; Thompson et al., 2005). It has also been used by the medical, oil and mining industries (Shappell, 2005). Globally, the system is gaining acceptance and has now been applied by military and or civilian organisations in the US, Canada, The Netherlands, India, Israel, Greece and United Kingdom (using foreign and not UK accident data). The increasingly wide use of HFACS is establishing it as a reliable and valid accident classification tool.
The system has been extensively used in the US with over 30,000 US civil aviation accidents classified by HFACS as well as a large proportion of military accidents. The developers of HFACS concluded that it reliably accommodated all the human contributory factors identified in the US civil accidents studied (Wiegmann & Shappell, 2001). It has also been used to analyse the major flying operations (commercial, general aviation and emergency medical services) and specific accident types, such as controlled flight into terrain (CFIT) and to compare regions within the US such as Alaska with continental US (Boquet et al., 2005; Detwiler et al., 2005b; Shappell & Wiegmann, 2003a, 2004; Wiegmann & Shappell, 2001; Wiegmann et al., 2005). Within the US aviation studies, the results have been consistent over time, with only small changes in the percentage of accidents associated with unsafe acts observed between earlier and later studies (compare Wiegmann & Shappell, 2001 and Shappell & Wiegmann, 2003b with Wiegmann et al., 2005).
The application of HFACS has also been effective for conducting comparisons between countries. Studies comparing US aviation accidents and those of other countries including China, Greece and India have been consistent (Gaur, 2005; Li & Harris, 2005; Li et al., 2005; Markou et al., 2006). In comparing the HFACS results associated with 523 Taiwanese military accidents with 119 US civil aviation accidents involving regular public transport, Li and Harris (2005) concluded that HFACS was a reliable tool that could be applied to accident data in another country. It should be noted here that Li and Harris compared the results at all levels of the HFACS model using a later version of HFACS that described 19 causal categories rather than the 17 categories used in Wiegmann and Shappell’s 2001 study. In a subsequent study, Li, Harris and Chen (2005) compared Taiwanese accidents with US and Indian accidents, all of which were classified with HFACS, for the purpose of studying the role of culture in aviation
– 4 –
accidents. Their results indicated that while there were differences in the contributory factors between the countries, skill-based errors were associated with the greatest number of accidents in each of the countries followed by decision errors, violations and perceptual errors respectively. It should be noted that the greater proportion of skill-based errors, in the Taiwanese accidents, was small if not negligible. The comparison between the Greek results (Markou et al., 2006) and US results again showed more similarities than differences in the human factors identified in aviation accidents in the two countries.
In summary, HFACS can be applied retrospectively to classify contributing human factors identified in the existing accident record. International studies that have applied HFACS have produced results that show that the pattern of errors and violations are broadly similar.
1.4 Objectives of the current study The purpose of this study was to apply HFACS to discover types of operator error in Australian civil aviation accidents and compare these results with the larger US accident sample.
– 5 –

– 6 –
2 METHODOLOGY
2.1 Data sources This study is based on analysis of all Australian accidents reported to the ATSB for the period 1 January 1993 to 31 December 2002. The US data for the same period were sourced from the Human Factors Analysis and Classification System (HFACS) databases provided by the Civil Aerospace Medical Institute, Federal Aviation Administration. This database contained both National Transportation Safety Board (NTSB) accident classifications and HFACS data for the period 1 January 1993 through to 31 December 2002.
Accident sample
For the Australian component of this study we extracted accidents from the ATSB aviation database that occurred over Australian territory and involved VH-registered, powered aircraft (both rotary and fixed wing). Excluded from the study were accidents involving sabotage, suicide and stolen or hijacked aircraft. These selection criteria were adopted from the original US HFACS studies and adapted where necessary to suit the Australian data and research purposes. Accidents meeting the same criteria described above were extracted from the US database.
To eliminate redundancy, only data from one of the aircraft involved in multi-aircraft collisions, such as mid-air or ground collisions, were included in the US database. The same approach was adopted with the Australian data.
Flying-hour data
Australian flying-hour data were provided by the Bureau of Transport and Regional Economics, Aviation Statistics section. The Bureau surveys aircraft owners listed on the Civil Aircraft Register once a year. The survey collects information on the total aircraft landings and flying hours by type of operation over the preceding six-month period. Australian flying-hour data were reorganised to match the US flying operation type, called Code of Federal Regulation (CFR) parts (see section 2.2 below). United States flying-hour data were sourced from the US Bureau of Transportation Statistics website.
2.2 Classification of flying operations The US flying operation categories, rather than the Australian classifications, were used in this study to allow comparison between the Australian and US data sets. In addition to reclassifying flying-hour data, the US flying regulation for each accident aircraft was allocated as part of the coding process. These US flying regulation codes are briefly explained here.
Part 91 or general aviation describes the rules governing the operation of aircraft within the US not involved in regular passenger transport. General aviation usually involves flights operating for recreation, personal transport, business flying and training. This regulation also covers positioning or ferry flights of both larger aircraft and emergency medical services flights.
– 7 –
Part 121 refers to scheduled domestic airlines and cargo carriers that fly large transport category aircraft. In March 1997, the US definition of Part 121 operations changed from flights with 30 seats to 10 seats. Before March 1997, flights with more than 10 and less than 30 seats flew under Part 135.
Part 125 refers to large US-registered civil aircraft that can carry 20 or more passengers or a maximum payload capacity of 2,722 kg (6,000 lb) or more, but is not used to transport public passengers.
Part 133 covers helicopters flying with external loads only.
Part 135 covers both scheduled (commuter) and non-scheduled (on-demand) flights operating with smaller aircraft of nine or fewer passengers. The non-scheduled operations include flights arranged between the passengers and operator and cargo planes with a payload capacity of 3,402 kg (7,500 lb) or less.
Part 137 includes agricultural aircraft operations such as applying economic poison, fertiliser, plant seed and pest control. It covers any aerial applications directly affecting agricultural, horticultural or forest preservation activities but excludes the dispensing of live insects.
Public use refers to US public or government agencies operating public aircraft and can include aerial policing operations, medical transport, fire-fighting operations and other operations.
2.3 Coding methodology Several pilots and one air traffic controller were recruited as coders and attended a three-day training program led by the developers of HFACS. Each of the coders was employed on the basis of significant aviation experience (eg. as a pilot or air traffic control operator), together with either academic experience or interest in aviation human factors.
Data compatibility between the US and Australia
During the preliminary work, it was identified that a more consistent application of HFACS with the US coding would be achieved if the Australian accidents were first reorganised into the same structure as that used by the NTSB. In this way, the same procedures used in the US studies could be applied to the Australian data. In the US, HFACS codes were applied to accident findings that were considered causal or contributory to the accident by the original investigation team and where the action was attributed to a person or organisation in the original NTSB coding. By applying the NTSB accident classification system to Australian accidents, a similar accident classification structure was achieved and causal and contributory factors were identified, along with the appropriate person code.
The system adopted by the Australian coders replicated, as closely as possible, the process used in the US where accidents are first coded according to the NTSB system and then coded with HFACS. The primary difference between the US and Australian methodology was that the same coders in Australia applied the NTSB taxonomy and HFACS in the same coding process while in the US these processes were performed by two separate agencies at different times.
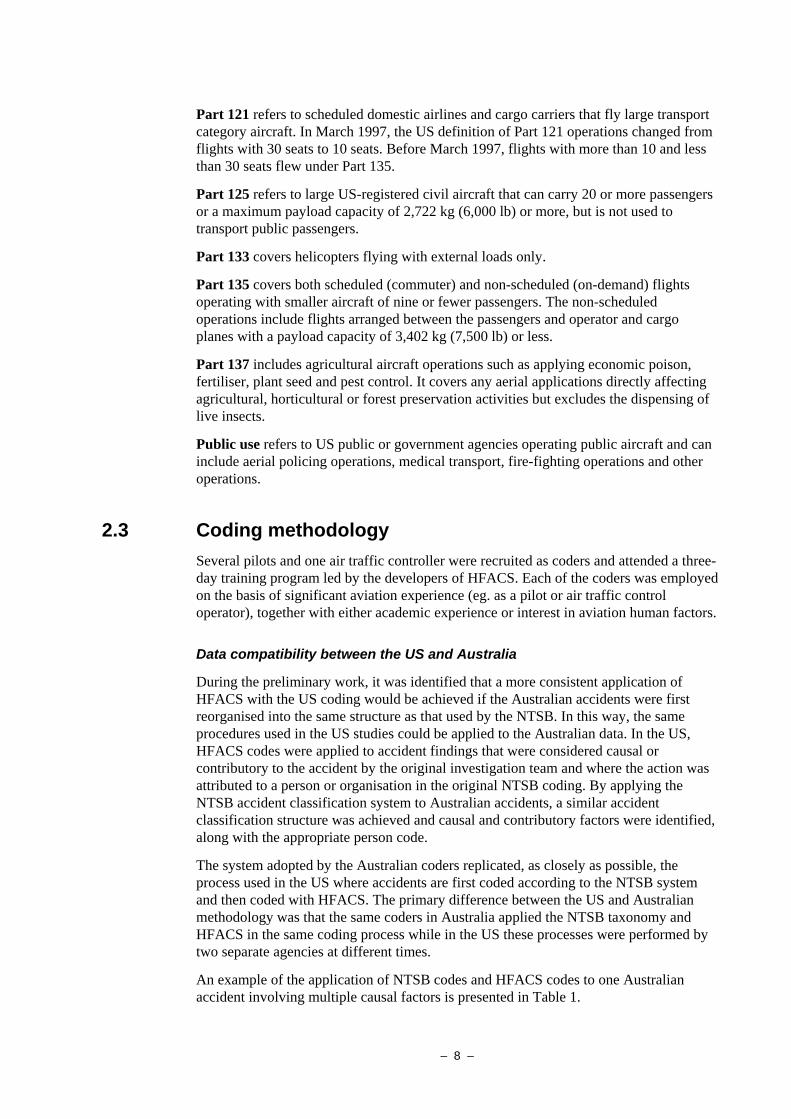
An example of the application of NTSB codes and HFACS codes to one Australian accident involving multiple causal factors is presented in Table 1.
– 8 –
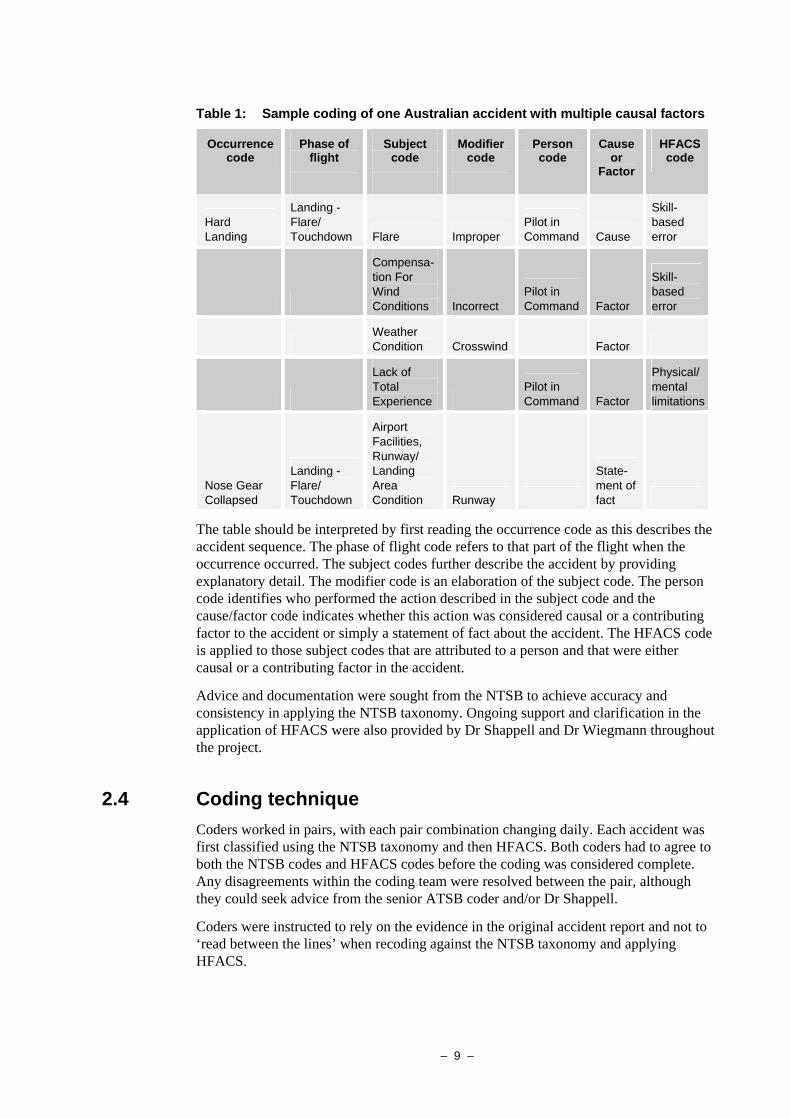
Table 1: Sample coding of one Australian accident with multiple causal factors
Occurrence code
Phase of flight
Subject code
Modifier code
Person code
Cause or
Factor
HFACS code
Hard Landing
Landing - Flare/ Touchdown Flare Improper
Pilot in Command Cause
Skill-based error
Compensa-tion For Wind Conditions Incorrect
Pilot in Command Factor
Skill-based error
Weather Condition Crosswind Factor
Lack of Total Experience
Pilot in Command Factor
Physical/ mental limitations
Nose Gear Collapsed
Landing - Flare/ Touchdown
Airport Facilities, Runway/ Landing Area Condition Runway
State-ment of fact
The table should be interpreted by first reading the occurrence code as this describes the accident sequence. The phase of flight code refers to that part of the flight when the occurrence occurred. The subject codes further describe the accident by providing explanatory detail. The modifier code is an elaboration of the subject code. The person code identifies who performed the action described in the subject code and the cause/factor code indicates whether this action was considered causal or a contributing factor to the accident or simply a statement of fact about the accident. The HFACS code is applied to those subject codes that are attributed to a person and that were either causal or a contributing factor in the accident.
Advice and documentation were sought from the NTSB to achieve accuracy and consistency in applying the NTSB taxonomy. Ongoing support and clarification in the application of HFACS were also provided by Dr Shappell and Dr Wiegmann throughout the project.
2.4 Coding technique Coders worked in pairs, with each pair combination changing daily. Each accident was first classified using the NTSB taxonomy and then HFACS. Both coders had to agree to both the NTSB codes and HFACS codes before the coding was considered complete. Any disagreements within the coding team were resolved between the pair, although they could seek advice from the senior ATSB coder and/or Dr Shappell.
Coders were instructed to rely on the evidence in the original accident report and not to ‘read between the lines’ when recoding against the NTSB taxonomy and applying HFACS.
– 9 –
2.5 Quality assurance process Following completion of the coding, the first 25% of accidents coded were recoded to ensure consistency in the coding process.
The remaining 75% of accidents were reviewed by experienced teams of coders for accuracy in coding. If the review team felt that the accident was not classified appropriately, it was recoded by a new team.
Finally, a sample of completed accidents was sent to the developers of HFACS to review for consistency with the US application of HFACS. Accidents were reviewed and modified as required in response to feedback provided by Dr Shappell.
To quantify the degree of consistency between the Australian and US application of HFACS, a sample of 104 US accidents were independently coded by the Australian coding review team. A Cohen’s Kappa value of 0.65 was calculated, indicating good1 agreement between the Australian and US application of HFACS (Altman, 1991).
2.6 Statistical analyses Statistical analyses were conducted to identify statistically significant differences between selected variations in the Australian and US results and between Australian fatal and non-fatal accidents. The analyses involved calculating the percentage difference between two results and using confidence intervals to determine if this was statistically different.
A confidence interval provides a range within which a true difference is likely to lie (Diekhoff, 1992). To interpret the confidence intervals in this study, if the range between the upper and lower values includes zero, the two results are not statistically different (Davies, 2001).
For the comparisons between Australian and US results, a 99% confidence interval was selected to ensure the highest level of accuracy in identifying differences in the results. A 99% confidence interval was also chosen to address the high level of power resulting from the large number of accidents in the US sample. For the comparisons of Australian data only, where there were fewer accidents, a 95% confidence interval was selected. A 95% confidence interval indicates that we are 95% certain that the true score lies between the upper and lower values.
1 Cohen’s Kappa measures the level of agreement between coders that corrects for any agreement that
occurred by chance alone. The scale of kappa can range from 1.00 with perfect agreement to 0.00 where all agreements occurred by chance alone. A kappa value between 0.41 to 0.60 indicates moderate agreement. A kappa value between 0.61 to 0.80 indicates good agreement and a kappa value between 0.81 to 1.00 indicates very good agreement (Altman,1991).
– 10 –
3 ANALYSIS OF THE DATA
3.1 Comparison of Australian and US accidents and flying activities Between 1993 and 2002, the ATSB recorded 2,0252 aviation accidents involving a VH-registered powered aircraft, under authorised use, that occurred over Australian territory. There were 18,961 accidents recorded in the US with equivalent criteria. These data indicate that there were approximately 9 accidents in the US for every accident in Australia. Flying hours in the US were also appreciably higher, with approximately 16 hours flown in the US to every hour flown in Australia.
Broad measures of Australian and US aviation were compared to determine the validity of conducting further comparisons of the two countries’ accident histories using HFACS.
3.1.1 Accidents by type of flying operation
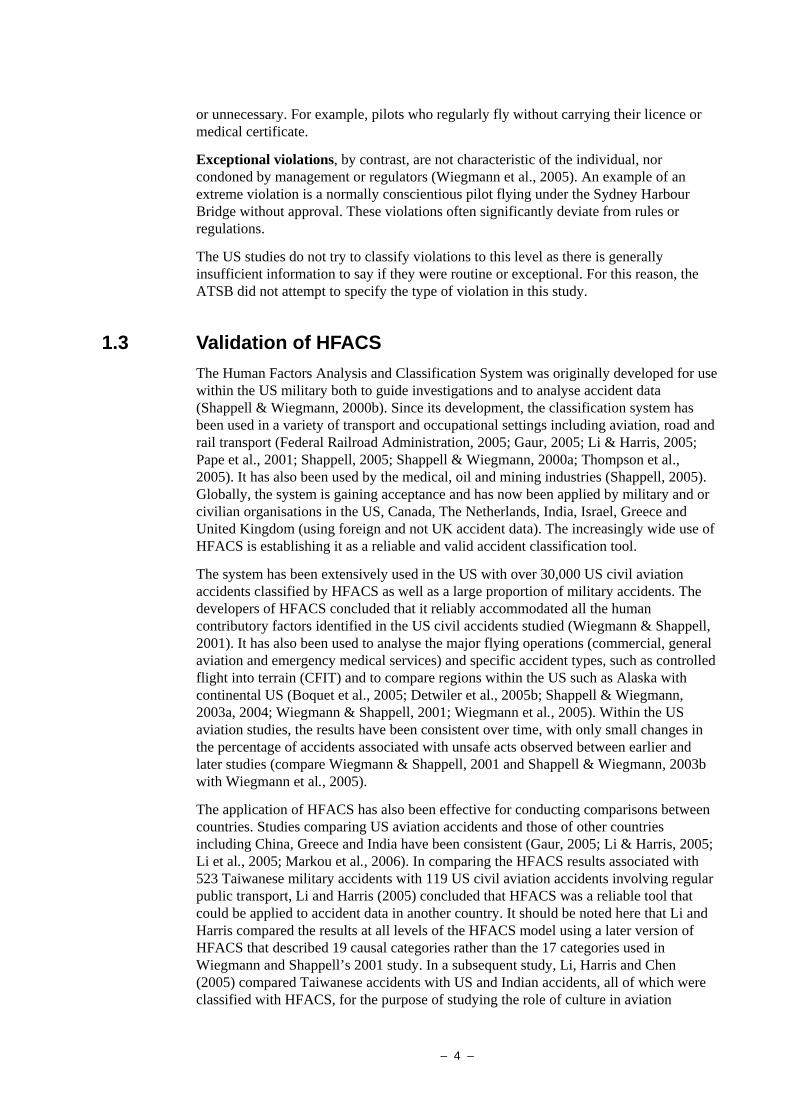
Figure 2 shows the proportion of accidents that occur in different types of US flying operations, as defined in Section 2.2. In both Australia and the US, the greatest proportion of accidents occurred under general aviation (Part 91) activities, followed by on-demand and commuter operations (Part 135) and agricultural operations (Part 137), respectively. The relevant frequencies are included in Appendix C (Table C.1).
Figure 2: Proportion of accidents by type of flying operation
0102030405060708090
100
Gen
eral
avi
atio
n(P
art 9
1)
Air
carri
er (P
art
121)
Rot
orcr
aft e
xter
nal
load
(Par
t 133
)
On-
dem
and/
com
mut
er(P
art 1
35)
Agr
icut
ural
(Par
t13
7)
Pub
lic U
se
Flying operation
Perc
enta
ge o
f acc
iden
ts
AustraliaUS
3.1.2 Flying hours by type of flying operation
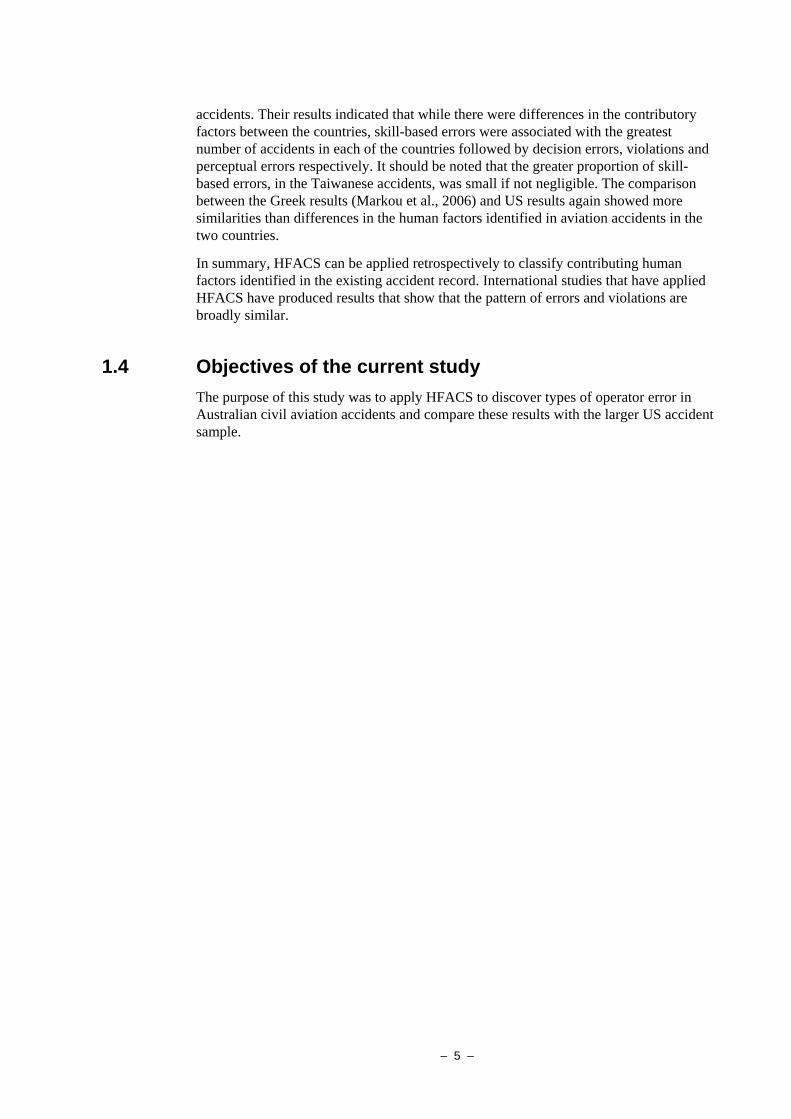
Figure 3 and Table 2 present the proportion of flying hours by operation type for the US and Australia. More Australian flying hours were accrued in on-demand (Part 135, non-
2 Both Australian and US accident figures will differ from the official accident totals due to the criteria
used to select accidents for this study (see Section 2.1 for the selection criteria). The sample of accidents used in this study does not include all reported accidents to ATSB or NTSB.
– 11 –
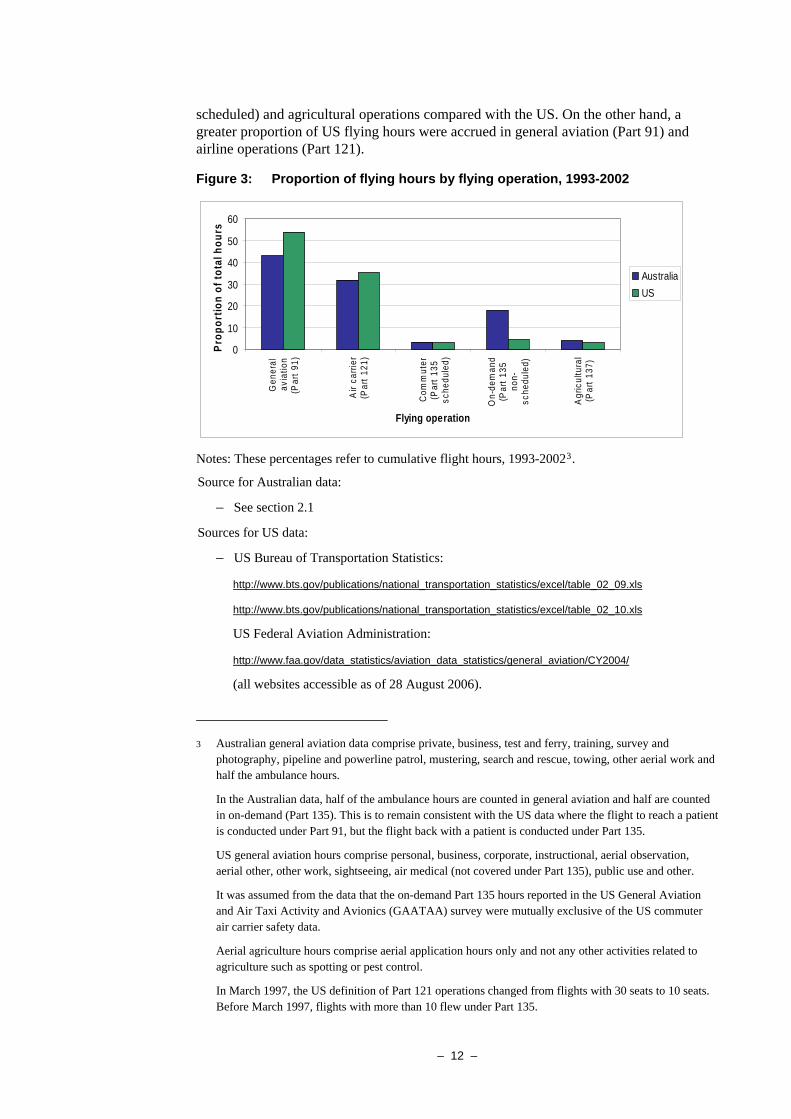
scheduled) and agricultural operations compared with the US. On the other hand, a greater proportion of US flying hours were accrued in general aviation (Part 91) and airline operations (Part 121).
Figure 3: Proportion of flying hours by flying operation, 1993-2002
0
10
20
30
40
50
60
Gen
eral
avia
tion
(Par
t 91)
Air
carri
er(P
art 1
21)
Com
mut
er(P
art 1
35sc
hedu
led)
On-
dem
and
(Par
t 135
non-
sche
dule
d)
Agr
icul
tura
l(P
art 1
37)
Flying operation
Prop
ortio
n of
tota
l hou
rs
AustraliaUS
Notes: These percentages refer to cumulative flight hours, 1993-20023.
Source for Australian data:
– See section 2.1
Sources for US data:
– US Bureau of Transportation Statistics:
http://www.bts.gov/publications/national_transportation_statistics/excel/table_02_09.xls
http://www.bts.gov/publications/national_transportation_statistics/excel/table_02_10.xls
US Federal Aviation Administration:
http://www.faa.gov/data_statistics/aviation_data_statistics/general_aviation/CY2004/
(all websites accessible as of 28 August 2006).
3 Australian general aviation data comprise private, business, test and ferry, training, survey and
photography, pipeline and powerline patrol, mustering, search and rescue, towing, other aerial work and half the ambulance hours.
In the Australian data, half of the ambulance hours are counted in general aviation and half are counted in on-demand (Part 135). This is to remain consistent with the US data where the flight to reach a patient is conducted under Part 91, but the flight back with a patient is conducted under Part 135.
US general aviation hours comprise personal, business, corporate, instructional, aerial observation, aerial other, other work, sightseeing, air medical (not covered under Part 135), public use and other.
It was assumed from the data that the on-demand Part 135 hours reported in the US General Aviation and Air Taxi Activity and Avionics (GAATAA) survey were mutually exclusive of the US commuter air carrier safety data.
Aerial agriculture hours comprise aerial application hours only and not any other activities related to agriculture such as spotting or pest control.
In March 1997, the US definition of Part 121 operations changed from flights with 30 seats to 10 seats. Before March 1997, flights with more than 10 flew under Part 135.
– 12 –
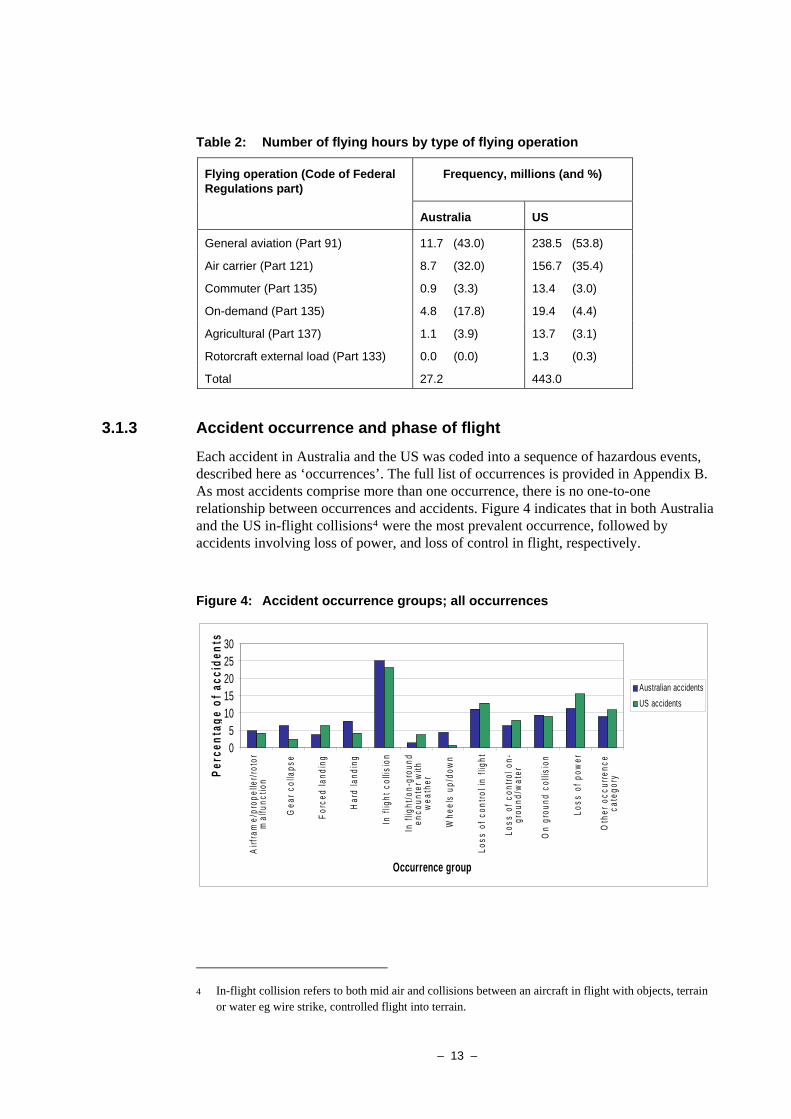
Table 2: Number of flying hours by type of flying operation
Flying operation (Code of Federal Regulations part)
Frequency, millions (and %)
Australia US
General aviation (Part 91) 11.7 (43.0) 238.5 (53.8)
Air carrier (Part 121) 8.7 (32.0) 156.7 (35.4)
Commuter (Part 135) 0.9 (3.3) 13.4 (3.0)
On-demand (Part 135) 4.8 (17.8) 19.4 (4.4)
Agricultural (Part 137) 1.1 (3.9) 13.7 (3.1)
Rotorcraft external load (Part 133) 0.0 (0.0) 1.3 (0.3)
Total 27.2 443.0
3.1.3 Accident occurrence and phase of flight
Each accident in Australia and the US was coded into a sequence of hazardous events, described here as ‘occurrences’. The full list of occurrences is provided in Appendix B. As most accidents comprise more than one occurrence, there is no one-to-one relationship between occurrences and accidents. Figure 4 indicates that in both Australia and the US in-flight collisions4 were the most prevalent occurrence, followed by accidents involving loss of power, and loss of control in flight, respectively.
Figure 4: Accident occurrence groups; all occurrences
05
1015202530
Airf
ram
e/pr
opel
ler/r
otor
mal
func
tion
Gea
r col
laps
e
Forc
ed la
ndin
g
Har
d la
ndin
g
In fl
ight
col
lisio
n
In fl
ight
/on-
grou
nden
coun
ter w
ithw
eath
er
Whe
els
up/d
own
Loss
of c
ontro
l in
fligh
t
Loss
of c
ontro
l on-
grou
nd/w
ater
On
grou
nd c
ollis
ion
Loss
of p
ower
Oth
er o
ccur
renc
eca
tego
ry
Occurrence group
Perc
enta
ge o
f acc
iden
ts
Australian accidentsUS accidents
4 In-flight collision refers to both mid air and collisions between an aircraft in flight with objects, terrain
or water eg wire strike, controlled flight into terrain.
– 13 –
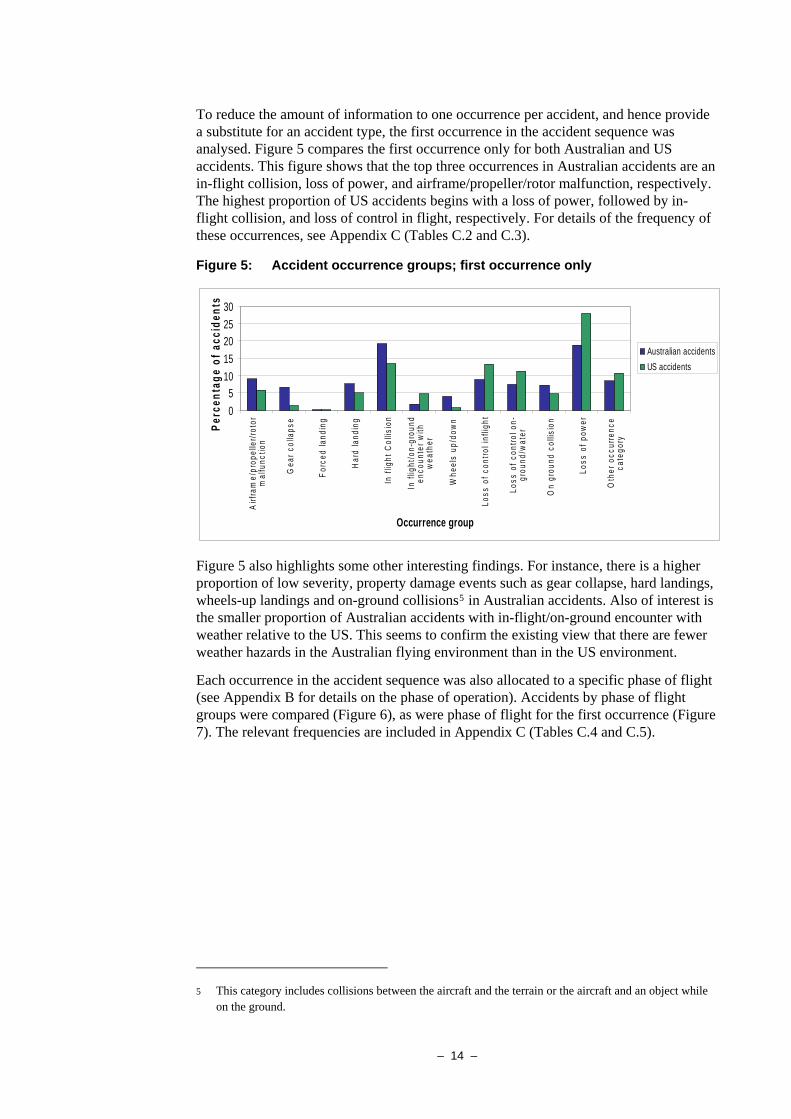
To reduce the amount of information to one occurrence per accident, and hence provide a substitute for an accident type, the first occurrence in the accident sequence was analysed. Figure 5 compares the first occurrence only for both Australian and US accidents. This figure shows that the top three occurrences in Australian accidents are an in-flight collision, loss of power, and airframe/propeller/rotor malfunction, respectively. The highest proportion of US accidents begins with a loss of power, followed by in-flight collision, and loss of control in flight, respectively. For details of the frequency of these occurrences, see Appendix C (Tables C.2 and C.3).
Figure 5: Accident occurrence groups; first occurrence only
05
1015202530
Airf
ram
e/pr
opel
ler/r
otor
mal
func
tion
Gea
r col
laps
e
Forc
ed la
ndin
g
Har
d la
ndin
g
In fl
ight
Col
lisio
n
In fl
ight
/on-
grou
nden
coun
ter w
ithw
eath
er
Whe
els
up/d
own
Loss
of c
ontro
l inf
light
Loss
of c
ontro
l on-
grou
nd/w
ater
On
grou
nd c
ollis
ion
Loss
of p
ower
Oth
er o
ccur
renc
eca
tego
ry
Occurrence group
Perc
enta
ge o
f acc
iden
ts
Australian accidentsUS accidents
Figure 5 also highlights some other interesting findings. For instance, there is a higher proportion of low severity, property damage events such as gear collapse, hard landings, wheels-up landings and on-ground collisions5 in Australian accidents. Also of interest is the smaller proportion of Australian accidents with in-flight/on-ground encounter with weather relative to the US. This seems to confirm the existing view that there are fewer weather hazards in the Australian flying environment than in the US environment.
Each occurrence in the accident sequence was also allocated to a specific phase of flight (see Appendix B for details on the phase of operation). Accidents by phase of flight groups were compared (Figure 6), as were phase of flight for the first occurrence (Figure 7). The relevant frequencies are included in Appendix C (Tables C.4 and C.5).
5 This category includes collisions between the aircraft and the terrain or the aircraft and an object while
on the ground.
– 14 –
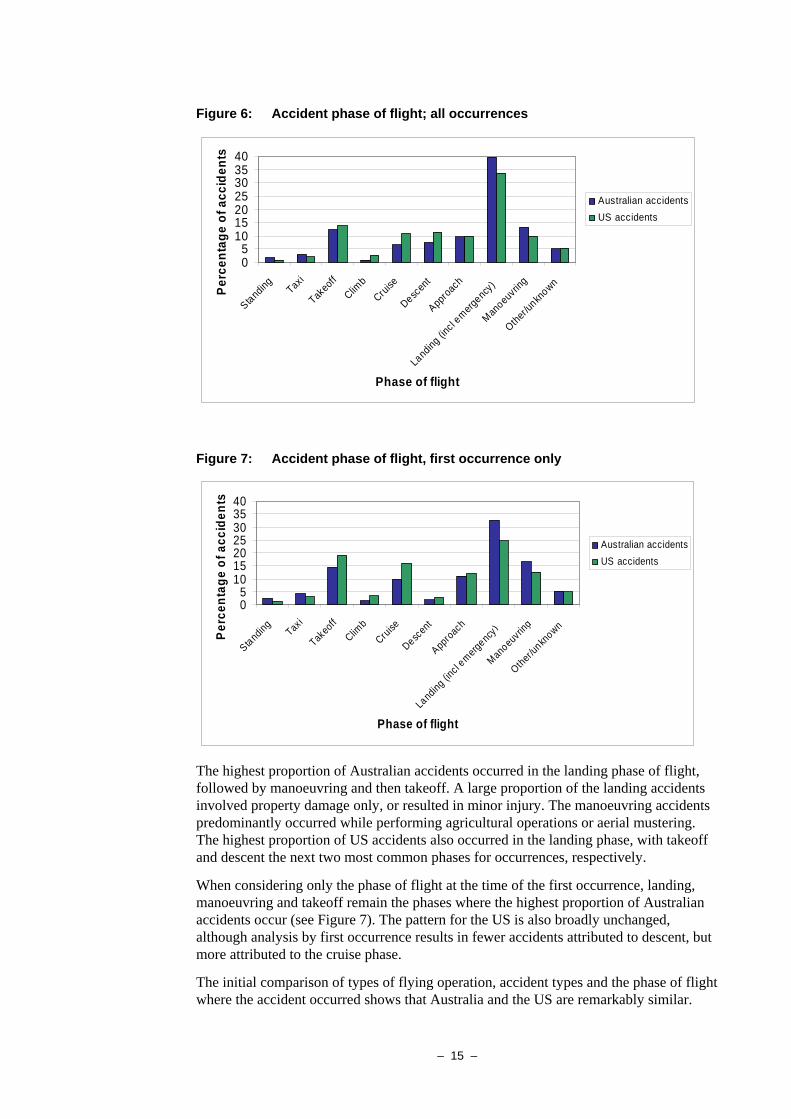
Figure 6: Accident phase of flight; all occurrences
05
10152025303540
Standing Tax
i
Takeo
ff
Climb
Cruise
Descen
t
Approa
ch
Land
ing (in
cl emerg
ency)
Manoeu
vring
Other/u
nknown
Phase of flight
Perc
enta
ge o
f acc
iden
tsAustralian accidentsUS accidents
Figure 7: Accident phase of flight, first occurrence only
05
10152025303540
Standing
Taxi
Takeoff
Climb
Cruise
Descen
t
Approac
h
Landin
g (incl
emergenc
y)
Manoeuvring
Other/u
nknown
Phase of flight
Perc
enta
ge o
f acc
iden
ts
Australian accidentsUS accidents
The highest proportion of Australian accidents occurred in the landing phase of flight, followed by manoeuvring and then takeoff. A large proportion of the landing accidents involved property damage only, or resulted in minor injury. The manoeuvring accidents predominantly occurred while performing agricultural operations or aerial mustering. The highest proportion of US accidents also occurred in the landing phase, with takeoff and descent the next two most common phases for occurrences, respectively.
When considering only the phase of flight at the time of the first occurrence, landing, manoeuvring and takeoff remain the phases where the highest proportion of Australian accidents occur (see Figure 7). The pattern for the US is also broadly unchanged, although analysis by first occurrence results in fewer accidents attributed to descent, but more attributed to the cruise phase.
The initial comparison of types of flying operation, accident types and the phase of flight where the accident occurred shows that Australia and the US are remarkably similar.
– 15 –
Where differences exist, they are likely to be influenced by the differences in the relative proportions of flying hours for each category of operation. Nevertheless, the obvious similarity between the patterns indicated a more detailed comparison was warranted.
3.2 HFACS The HFACS taxonomy classifies the human factors that contribute to accidents at all the four levels of the aviation system comprising organisational influences, unsafe supervision, preconditions for unsafe acts and the unsafe acts of operators (Figure 1). This study was primarily concerned with the subset of accidents where there was at least one aircrew-related unsafe act, and so focuses on the level of unsafe acts of operators.
3.2.1 Accidents with at least one aircrew unsafe act
Over the period studied, 69% of accidents in Australia (1,404 out of 2,025) included at least one unsafe act by aircrew, compared with 72% (13,7006 out of 18,961) of accidents in the US. The remainder involved mechanical failure or no identifiable aircrew error.
While accidents frequently had more than one instance of the same unsafe act (eg skill-based error) each category was only counted once per accident. Counting each group once prevents overrepresentation of some error groups and allows us to determine how many accidents were associated with each category of unsafe act.
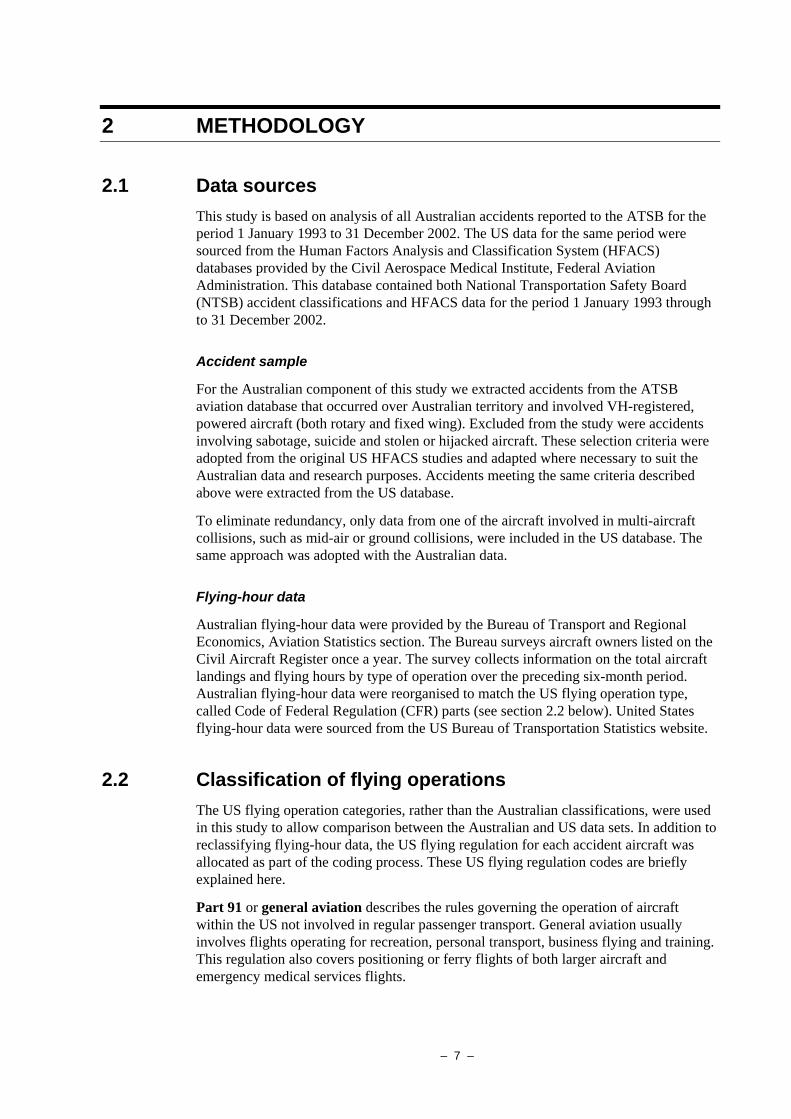
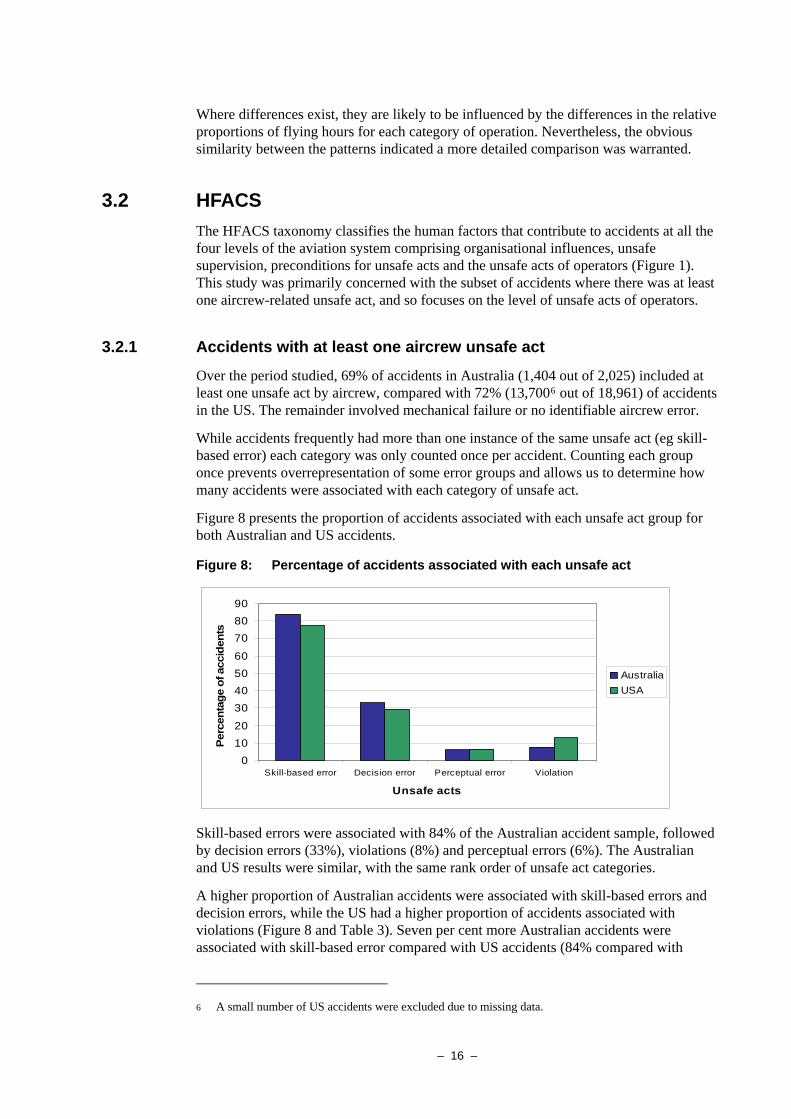
Figure 8 presents the proportion of accidents associated with each unsafe act group for both Australian and US accidents.
Figure 8: Percentage of accidents associated with each unsafe act
01020
30405060
708090
Skill-based error Decision error Perceptual error Violation
Unsafe acts
Perc
enta
ge o
f acc
iden
ts
AustraliaUSA
Skill-based errors were associated with 84% of the Australian accident sample, followed by decision errors (33%), violations (8%) and perceptual errors (6%). The Australian and US results were similar, with the same rank order of unsafe act categories.
A higher proportion of Australian accidents were associated with skill-based errors and decision errors, while the US had a higher proportion of accidents associated with violations (Figure 8 and Table 3). Seven per cent more Australian accidents were associated with skill-based error compared with US accidents (84% compared with
6 A small number of US accidents were excluded due to missing data.
– 16 –
77%). While this difference is statistically significant, the practical importance of this difference appears limited. Violations were significantly less frequent in Australian accidents. There were no significant differences between the proportion of Australian accidents associated with decision or perceptual errors compared with the US results.
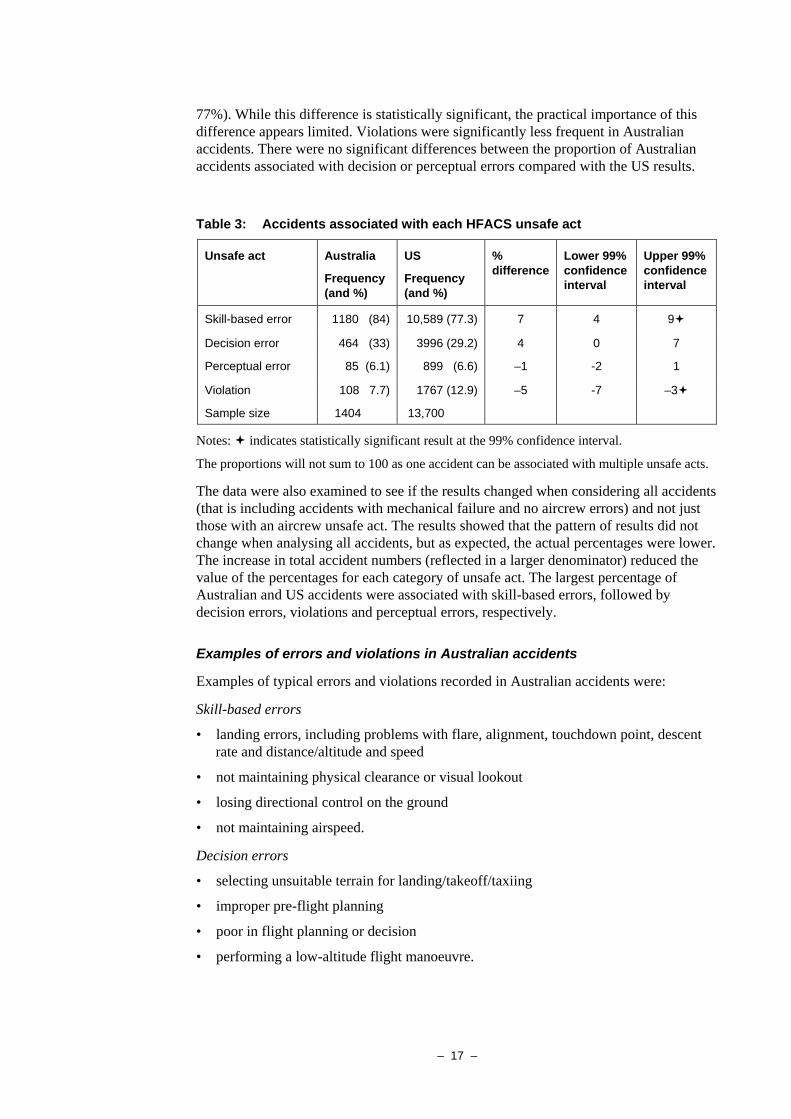
Table 3: Accidents associated with each HFACS unsafe act
Unsafe act Australia
Frequency (and %)
US
Frequency (and %)
% difference
Lower 99% confidence interval
Upper 99% confidence interval
Skill-based error 1180 (84) 10,589 (77.3) 7 4 9
Decision error 464 (33) 3996 (29.2) 4 0 7
Perceptual error 85 (6.1) 899 (6.6) –1 -2 1
Violation 108 7.7) 1767 (12.9) –5 -7 –3
Sample size 1404 13,700
Notes: indicates statistically significant result at the 99% confidence interval.
The proportions will not sum to 100 as one accident can be associated with multiple unsafe acts.
The data were also examined to see if the results changed when considering all accidents (that is including accidents with mechanical failure and no aircrew errors) and not just those with an aircrew unsafe act. The results showed that the pattern of results did not change when analysing all accidents, but as expected, the actual percentages were lower. The increase in total accident numbers (reflected in a larger denominator) reduced the value of the percentages for each category of unsafe act. The largest percentage of Australian and US accidents were associated with skill-based errors, followed by decision errors, violations and perceptual errors, respectively.
Examples of errors and violations in Australian accidents
Examples of typical errors and violations recorded in Australian accidents were:
Skill-based errors
• landing errors, including problems with flare, alignment, touchdown point, descent rate and distance/altitude and speed
• not maintaining physical clearance or visual lookout
• losing directional control on the ground
• not maintaining airspeed.
Decision errors
• selecting unsuitable terrain for landing/takeoff/taxiing
• improper pre-flight planning
• poor in flight planning or decision
• performing a low-altitude flight manoeuvre.
– 17 –
Perceptual errors
• misjudging physical clearance
• losing aircraft control
• problems with visual/aural perception
• misjudging altitude/distance/speed.
Violations
• not following procedures or directives (standard operating procedures)
• visual flight rules into instrument meteorological conditions
• operating an aircraft without proper endorsement or certification
• operating an aircraft outside its weight and balance limits
• performing low-altitude flight manoeuvres.
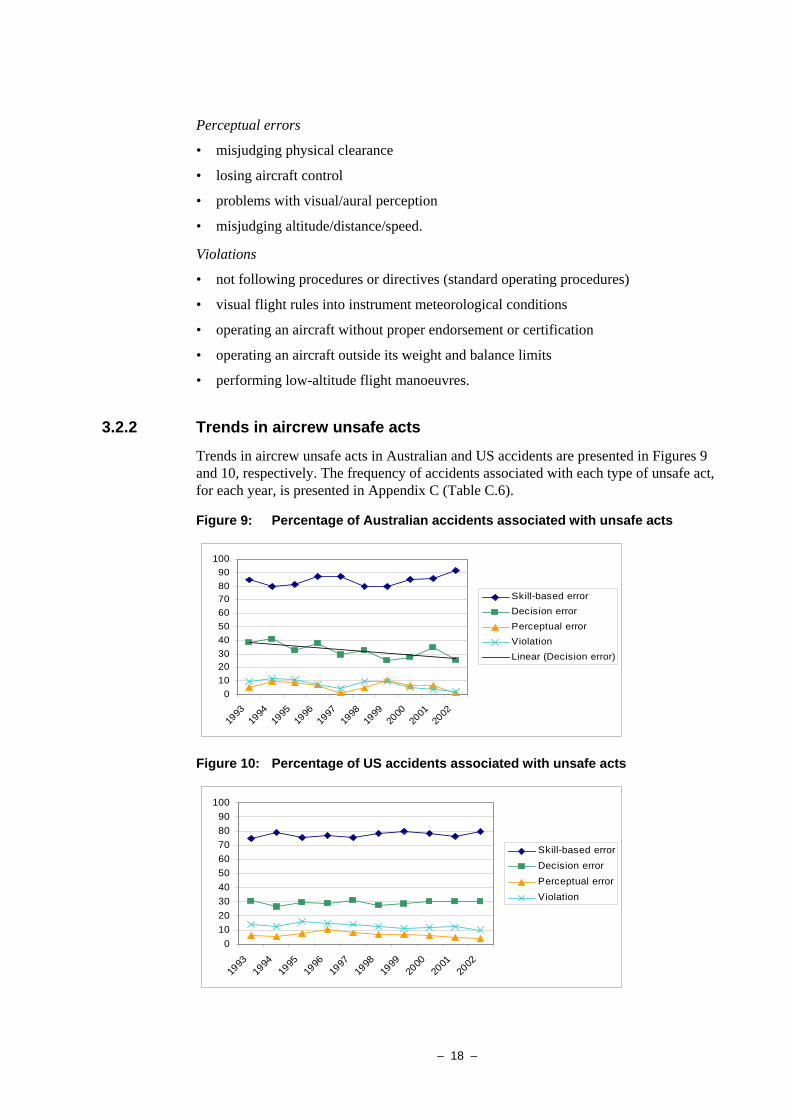
3.2.2 Trends in aircrew unsafe acts
Trends in aircrew unsafe acts in Australian and US accidents are presented in Figures 9 and 10, respectively. The frequency of accidents associated with each type of unsafe act, for each year, is presented in Appendix C (Table C.6).
Figure 9: Percentage of Australian accidents associated with unsafe acts
0102030405060708090
100
1993
1994
1995
1996
1997
1998
1999
2000
2001
2002
Skill-based errorDecision errorPerceptual errorViolationLinear (Decision error)
Figure 10: Percentage of US accidents associated with unsafe acts
0102030405060708090
100
1993
1994
1995
1996
1997
1998
1999
2000
2001
2002
Skill-based errorDecision errorPerceptual errorViolation
– 18 –
Over the 10 year period covered by the study, both the numbers of reported aircrew errors (see Appendix C, Table C.6) and accidents reported to the ATSB have reduced (data not shown). However, despite fluctuations, the proportion of accidents associated with a skill-based error has not changed significantly over time, χ2(1, N=1,404) = 1.82, p = 0.18. The proportion of decision errors identified in Australian accidents, however, has reduced over time χ2(1, N=1,404) = 8.88, p = 0.003.
There were insufficient Australian accident data to determine trends for both violations and perceptual errors.
The graph of the US accidents (Figure 10) presents a more stable picture for all error groups and violations.
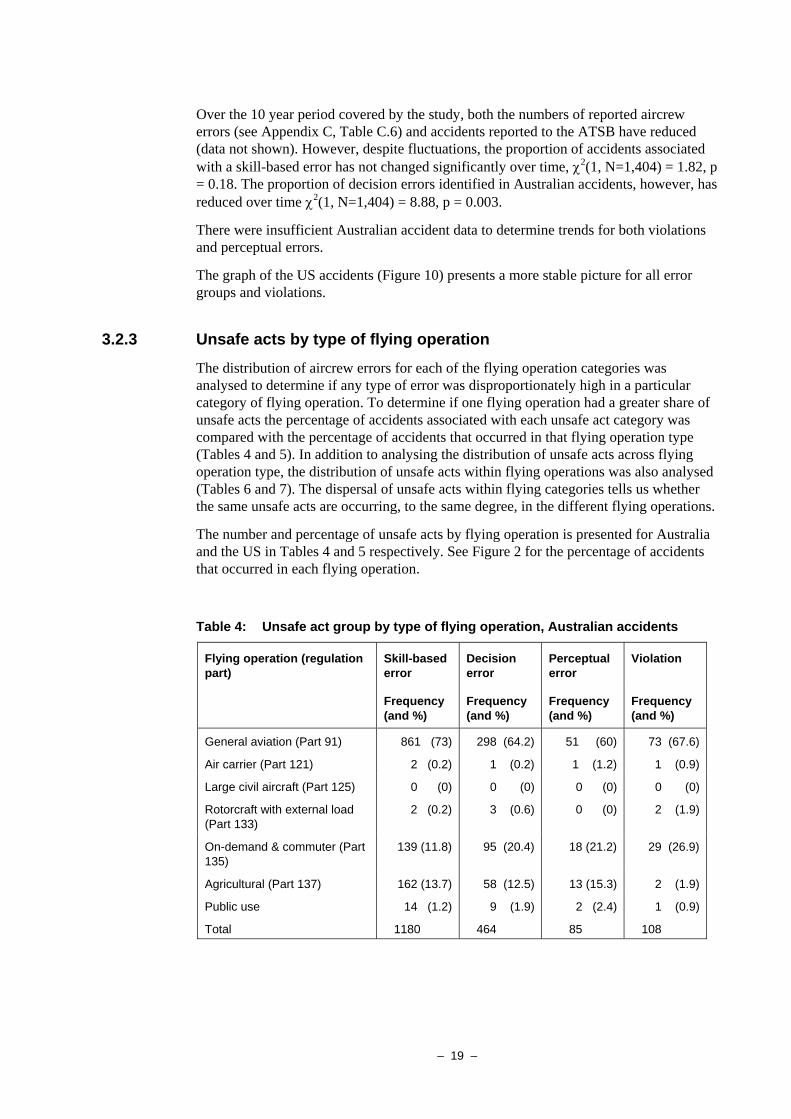
3.2.3 Unsafe acts by type of flying operation
The distribution of aircrew errors for each of the flying operation categories was analysed to determine if any type of error was disproportionately high in a particular category of flying operation. To determine if one flying operation had a greater share of unsafe acts the percentage of accidents associated with each unsafe act category was compared with the percentage of accidents that occurred in that flying operation type (Tables 4 and 5). In addition to analysing the distribution of unsafe acts across flying operation type, the distribution of unsafe acts within flying operations was also analysed (Tables 6 and 7). The dispersal of unsafe acts within flying categories tells us whether the same unsafe acts are occurring, to the same degree, in the different flying operations.
The number and percentage of unsafe acts by flying operation is presented for Australia and the US in Tables 4 and 5 respectively. See Figure 2 for the percentage of accidents that occurred in each flying operation.
Table 4: Unsafe act group by type of flying operation, Australian accidents
Flying operation (regulation part)
Skill-based error
Decision error
Perceptual error
Violation
Frequency (and %)
Frequency (and %)
Frequency (and %)
Frequency (and %)
General aviation (Part 91) 861 (73) 298 (64.2) 51 (60) 73 (67.6)
Air carrier (Part 121) 2 (0.2) 1 (0.2) 1 (1.2) 1 (0.9)
Large civil aircraft (Part 125) 0 (0) 0 (0) 0 (0) 0 (0)
Rotorcraft with external load (Part 133)
2 (0.2) 3 (0.6) 0 (0) 2 (1.9)
On-demand & commuter (Part 135)
139 (11.8) 95 (20.4) 18 (21.2) 29 (26.9)
Agricultural (Part 137) 162 (13.7) 58 (12.5) 13 (15.3) 2 (1.9)
Public use 14 (1.2) 9 (1.9) 2 (2.4) 1 (0.9)
Total 1180 464 85 108
– 19 –
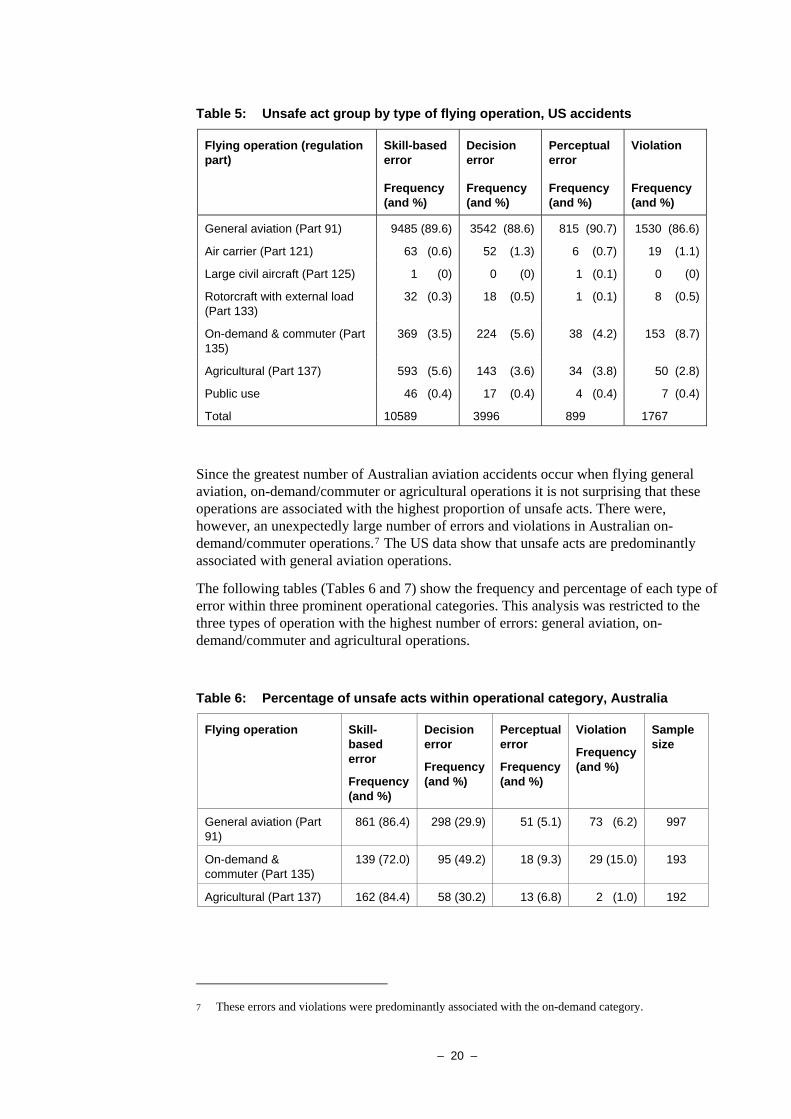
Table 5: Unsafe act group by type of flying operation, US accidents
Flying operation (regulation part)
Skill-based error
Decision error
Perceptual error
Violation
Frequency (and %)
Frequency (and %)
Frequency (and %)
Frequency (and %)
General aviation (Part 91) 9485 (89.6) 3542 (88.6) 815 (90.7) 1530 (86.6)
Air carrier (Part 121) 63 (0.6) 52 (1.3) 6 (0.7) 19 (1.1)
Large civil aircraft (Part 125) 1 (0) 0 (0) 1 (0.1) 0 (0)
Rotorcraft with external load (Part 133)
32 (0.3) 18 (0.5) 1 (0.1) 8 (0.5)
On-demand & commuter (Part 135)
369 (3.5) 224 (5.6) 38 (4.2) 153 (8.7)
Agricultural (Part 137) 593 (5.6) 143 (3.6) 34 (3.8) 50 (2.8)
Public use 46 (0.4) 17 (0.4) 4 (0.4) 7 (0.4)
Total 10589 3996 899 1767
Since the greatest number of Australian aviation accidents occur when flying general aviation, on-demand/commuter or agricultural operations it is not surprising that these operations are associated with the highest proportion of unsafe acts. There were, however, an unexpectedly large number of errors and violations in Australian on-demand/commuter operations.7 The US data show that unsafe acts are predominantly associated with general aviation operations.
The following tables (Tables 6 and 7) show the frequency and percentage of each type of error within three prominent operational categories. This analysis was restricted to the three types of operation with the highest number of errors: general aviation, on-demand/commuter and agricultural operations.
Table 6: Percentage of unsafe acts within operational category, Australia
Flying operation Skill-based error
Frequency (and %)
Decision error
Frequency (and %)
Perceptual error
Frequency (and %)
Violation
Frequency (and %)
Sample size
General aviation (Part 91)
861 (86.4) 298 (29.9) 51 (5.1) 73 (6.2) 997
On-demand & commuter (Part 135)
139 (72.0) 95 (49.2) 18 (9.3) 29 (15.0) 193
Agricultural (Part 137) 162 (84.4) 58 (30.2) 13 (6.8) 2 (1.0) 192
7 These errors and violations were predominantly associated with the on-demand category.
– 20 –
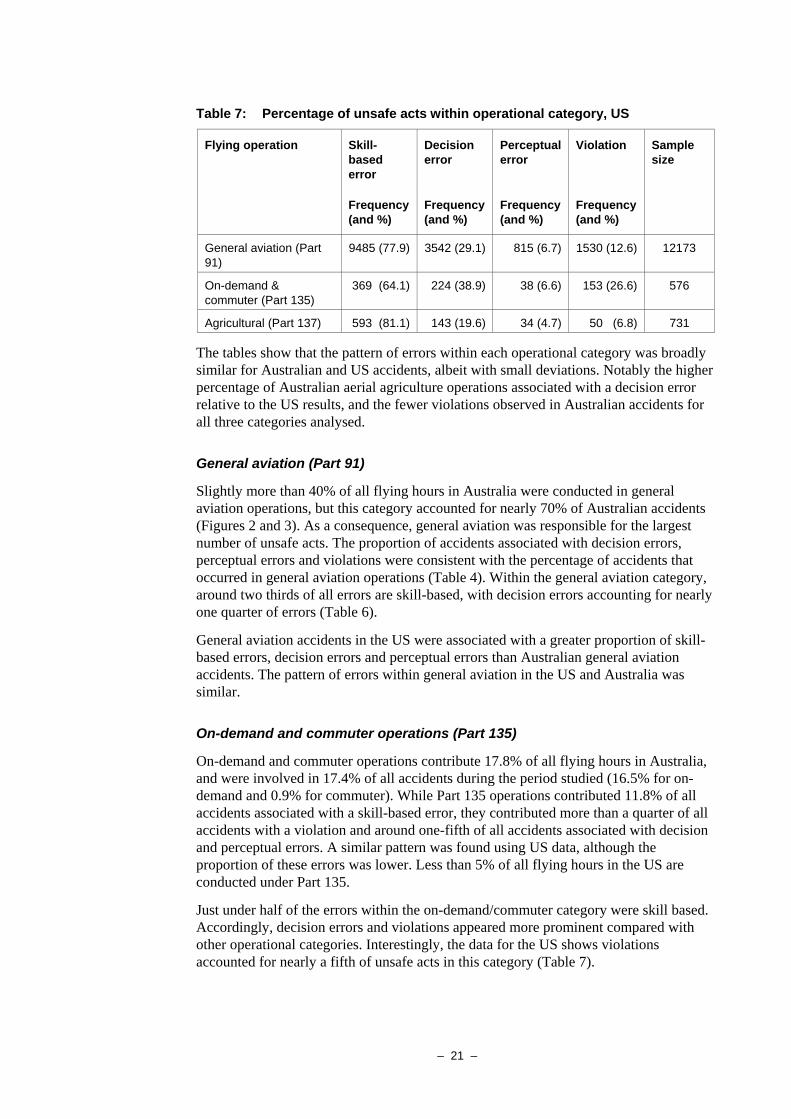
Table 7: Percentage of unsafe acts within operational category, US
Flying operation Skill-based error
Decision error
Perceptual error
Violation
Sample size
Frequency (and %)
Frequency (and %)
Frequency (and %)
Frequency (and %)
General aviation (Part 91)
9485 (77.9) 3542 (29.1) 815 (6.7) 1530 (12.6) 12173
On-demand & commuter (Part 135)
369 (64.1) 224 (38.9) 38 (6.6) 153 (26.6) 576
Agricultural (Part 137) 593 (81.1) 143 (19.6) 34 (4.7) 50 (6.8) 731
The tables show that the pattern of errors within each operational category was broadly similar for Australian and US accidents, albeit with small deviations. Notably the higher percentage of Australian aerial agriculture operations associated with a decision error relative to the US results, and the fewer violations observed in Australian accidents for all three categories analysed.
General aviation (Part 91)
Slightly more than 40% of all flying hours in Australia were conducted in general aviation operations, but this category accounted for nearly 70% of Australian accidents (Figures 2 and 3). As a consequence, general aviation was responsible for the largest number of unsafe acts. The proportion of accidents associated with decision errors, perceptual errors and violations were consistent with the percentage of accidents that occurred in general aviation operations (Table 4). Within the general aviation category, around two thirds of all errors are skill-based, with decision errors accounting for nearly one quarter of errors (Table 6).
General aviation accidents in the US were associated with a greater proportion of skill-based errors, decision errors and perceptual errors than Australian general aviation accidents. The pattern of errors within general aviation in the US and Australia was similar.
On-demand and commuter operations (Part 135)
On-demand and commuter operations contribute 17.8% of all flying hours in Australia, and were involved in 17.4% of all accidents during the period studied (16.5% for on-demand and 0.9% for commuter). While Part 135 operations contributed 11.8% of all accidents associated with a skill-based error, they contributed more than a quarter of all accidents with a violation and around one-fifth of all accidents associated with decision and perceptual errors. A similar pattern was found using US data, although the proportion of these errors was lower. Less than 5% of all flying hours in the US are conducted under Part 135.
Just under half of the errors within the on-demand/commuter category were skill based. Accordingly, decision errors and violations appeared more prominent compared with other operational categories. Interestingly, the data for the US shows violations accounted for nearly a fifth of unsafe acts in this category (Table 7).
– 21 –
Agricultural operations (Part 137)
Aerial agriculture accounts for 11.5% of all Australian accidents, but 13.7% of all accidents with a skill-based error and 15% of all accidents with a perceptual error. These operations contributed the second highest number of skill-based accidents and third highest perceptual error accidents. All the unsafe act groups were underrepresented with respect to the total proportion of accidents in US agricultural operations.
The pattern of errors within agricultural operations was very similar to the pattern found in general aviation. Violations identified in Australian agricultural operations were extremely low. This might be because HFACS only codes for violations when they are known to be deliberate, and the data rarely supported that finding.
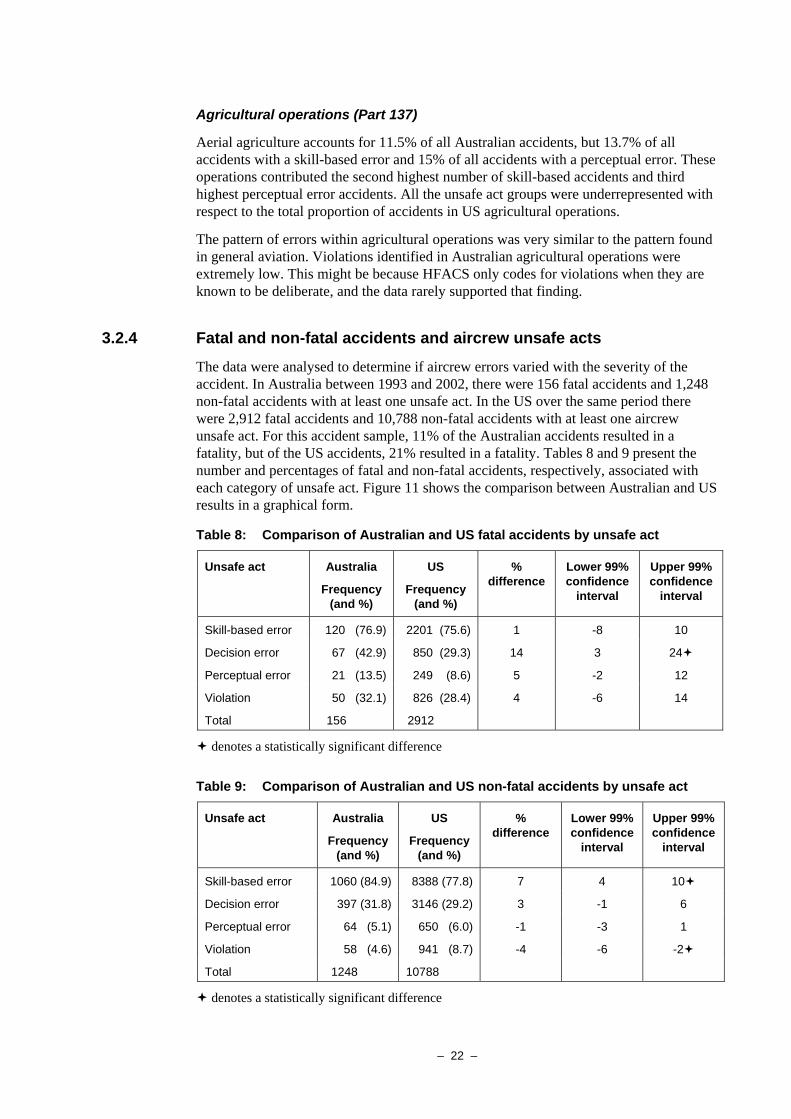
3.2.4 Fatal and non-fatal accidents and aircrew unsafe acts
The data were analysed to determine if aircrew errors varied with the severity of the accident. In Australia between 1993 and 2002, there were 156 fatal accidents and 1,248 non-fatal accidents with at least one unsafe act. In the US over the same period there were 2,912 fatal accidents and 10,788 non-fatal accidents with at least one aircrew unsafe act. For this accident sample, 11% of the Australian accidents resulted in a fatality, but of the US accidents, 21% resulted in a fatality. Tables 8 and 9 present the number and percentages of fatal and non-fatal accidents, respectively, associated with each category of unsafe act. Figure 11 shows the comparison between Australian and US results in a graphical form.
Table 8: Comparison of Australian and US fatal accidents by unsafe act
Unsafe act Australia
Frequency (and %)
US
Frequency (and %)
% difference
Lower 99% confidence
interval
Upper 99% confidence
interval
Skill-based error 120 (76.9) 2201 (75.6) 1 -8 10
Decision error 67 (42.9) 850 (29.3) 14 3 24
Perceptual error 21 (13.5) 249 (8.6) 5 -2 12
Violation 50 (32.1) 826 (28.4) 4 -6 14
Total 156 2912
denotes a statistically significant difference
Table 9: Comparison of Australian and US non-fatal accidents by unsafe act
Unsafe act Australia
Frequency (and %)
US
Frequency (and %)
% difference
Lower 99% confidence
interval
Upper 99% confidence
interval
Skill-based error 1060 (84.9) 8388 (77.8) 7 4 10
Decision error 397 (31.8) 3146 (29.2) 3 -1 6
Perceptual error 64 (5.1) 650 (6.0) -1 -3 1
Violation 58 (4.6) 941 (8.7) -4 -6 -2
Total 1248 10788
denotes a statistically significant difference
– 22 –
Comparing Australian and US fatal accidents
Table 8 shows that the only statistically significant difference between Australian and US fatal accidents is the higher percentage of Australian fatal accidents associated with a decision error (see also Figure 11).
Comparing Australian and US non-fatal accidents
Significantly more Australian non-fatal accidents were associated with skill-based errors compared to US non-fatal accidents but fewer Australian non-fatal accidents were associated with violations (Table 9; see also Figure 11).
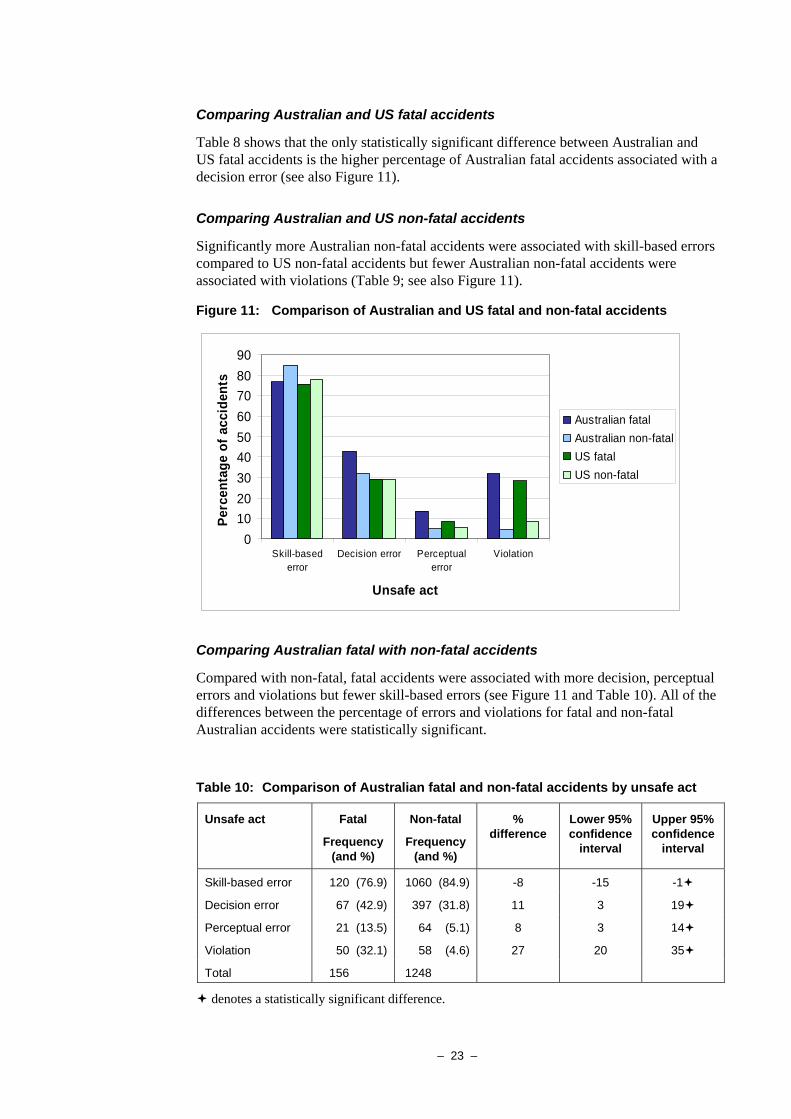
Figure 11: Comparison of Australian and US fatal and non-fatal accidents
0102030405060708090
Skill-basederror
Decision error Perceptualerror
Violation
Unsafe act
Perc
enta
ge o
f acc
iden
ts
Australian fatalAustralian non-fatalUS fatalUS non-fatal
Comparing Australian fatal with non-fatal accidents
Compared with non-fatal, fatal accidents were associated with more decision, perceptual errors and violations but fewer skill-based errors (see Figure 11 and Table 10). All of the differences between the percentage of errors and violations for fatal and non-fatal Australian accidents were statistically significant.
Table 10: Comparison of Australian fatal and non-fatal accidents by unsafe act
Unsafe act Fatal
Frequency (and %)
Non-fatal
Frequency (and %)
% difference
Lower 95% confidence
interval
Upper 95% confidence
interval
Skill-based error 120 (76.9) 1060 (84.9) -8 -15 -1
Decision error 67 (42.9) 397 (31.8) 11 3 19
Perceptual error 21 (13.5) 64 (5.1) 8 3 14
Violation 50 (32.1) 58 (4.6) 27 20 35
Total 156 1248
denotes a statistically significant difference.
– 23 –
Comparing US fatal with non-fatal accidents
Similar to the Australian results, the US fatal accidents were associated with more violations but fewer skill-based errors. Unlike the Australian results, decision errors were not different for fatal and non-fatal accidents.
While the distribution of errors and violations associated with fatal accidents is similar to the pattern for accidents generally, it is noteworthy that a higher proportion of fatal accidents in both Australia and the US were coded with a violation.
3.2.5 Precipitating error
Australian accidents were analysed to identify the unsafe act that precipitated the accident. This was conducted to determine if any particular category of unsafe act was more likely to induce an accident.
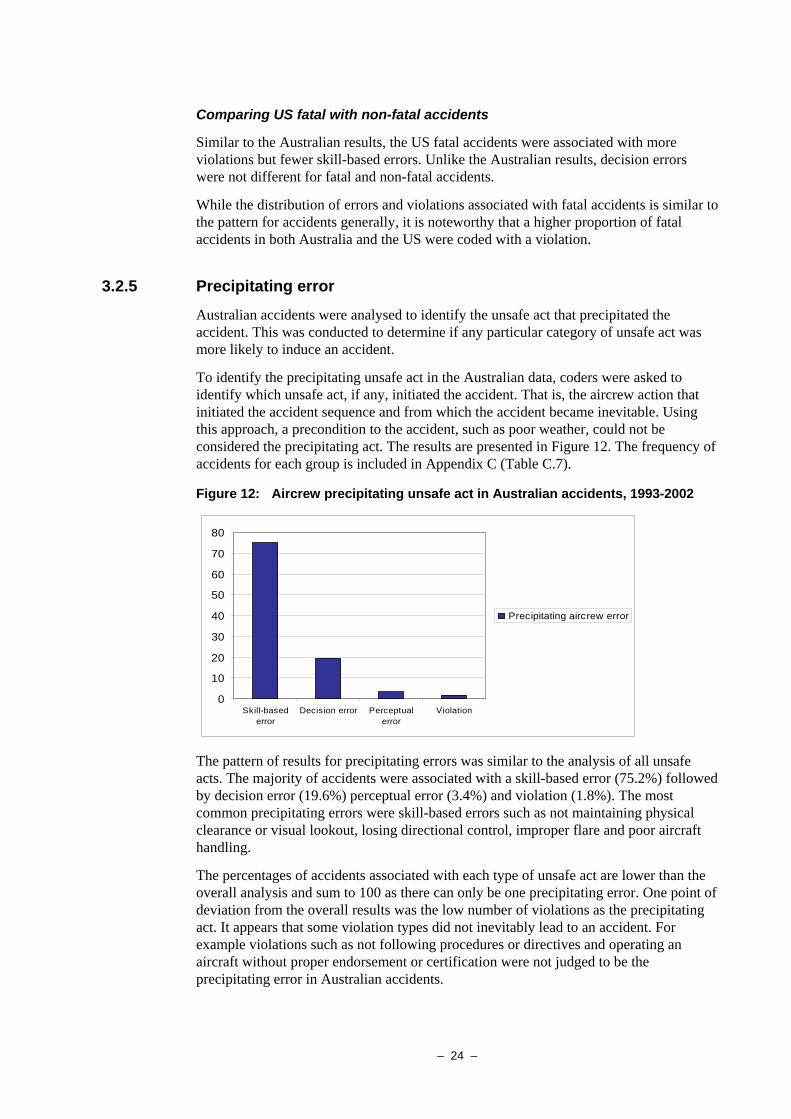
To identify the precipitating unsafe act in the Australian data, coders were asked to identify which unsafe act, if any, initiated the accident. That is, the aircrew action that initiated the accident sequence and from which the accident became inevitable. Using this approach, a precondition to the accident, such as poor weather, could not be considered the precipitating act. The results are presented in Figure 12. The frequency of accidents for each group is included in Appendix C (Table C.7).
Figure 12: Aircrew precipitating unsafe act in Australian accidents, 1993-2002
0
10
20
30
40
50
60
70
80
Skill-basederror
Decision error Perceptualerror
Violation
Precipitating aircrew error
The pattern of results for precipitating errors was similar to the analysis of all unsafe acts. The majority of accidents were associated with a skill-based error (75.2%) followed by decision error (19.6%) perceptual error (3.4%) and violation (1.8%). The most common precipitating errors were skill-based errors such as not maintaining physical clearance or visual lookout, losing directional control, improper flare and poor aircraft handling.
The percentages of accidents associated with each type of unsafe act are lower than the overall analysis and sum to 100 as there can only be one precipitating error. One point of deviation from the overall results was the low number of violations as the precipitating act. It appears that some violation types did not inevitably lead to an accident. For example violations such as not following procedures or directives and operating an aircraft without proper endorsement or certification were not judged to be the precipitating error in Australian accidents.
– 24 –
4 DISCUSSION The two objectives of this study were to systematically analyse the types of aircrew-related unsafe acts occurring in Australian accidents and to compare the Australian results with the larger sample of US accidents in order to learn more about the underlying human causes of aviation accidents.
The results have identified the unsafe acts involved in Australian aviation accidents and how Australian and US accidents compared using the NTSB taxonomy and HFACS. Finally, the utility of HFACS for developing new strategies to improve aviation safety is discussed.
4.1 What does the application of HFACS tell us about Australian aviation? Sixty nine per cent of Australian accidents involved at least one aircrew unsafe act. The most prevalent category of unsafe act in Australian accidents was skill-based errors followed by decision errors, violations and perceptual errors, respectively. These findings are consistent with similar international studies (Gaur, 2005; Markou et al., 2006).
Skill-based errors were disproportionately high in both general aviation (private/business operations) and agricultural operations. There may be several reasons for this. Explanations might include the flying experience (both in terms of total experience and currency) of general aviation pilots (Wiegmann et al., 2005), and in the case of aerial agriculture operations, cockpit distractions interfering with the monitoring of flight parameters such as airspeed and altitude. Both of these categories are predominantly single-pilot operations, where the skills of the lone pilot are the last line of defence to prevent an accident. Regular passenger transport operations on the other hand are multi-crew operations, and errors of any type were rare. The low error rate is reflected in the exceptional safety record for this category of operations.
The trend data indicated that the proportion of accidents in Australia with a skill-based error has remained steady over time, but the proportion of accidents associated with decision errors has decreased. It is unclear what lies behind these findings. These results suggest that there is considerable scope to improve accident rates in private and business operations by addressing the underlying causes associated with skill-based errors. To further understand this issue it would be important to develop a clearer understanding of which particular skills are failing. Based on the application of HFACS presented here it is difficult to determine where efforts to enhance skills would receive most reward. In large part that may be due to the diverse range of errors that fit this category. Perhaps one of the key challenges with the application of HFACS is that so many errors are categorised as skill-based that without more detailed analysis, the ability to develop evidence-based strategies may be limited. To that end it would be useful to analyse this error category further to more clearly understand the types of skill sets that need improving.
This study also found that the severity of injury varied with the type of aircrew error associated with the accident. Violations, decision errors and perceptual errors were more common in fatal accidents. Violations were identified in 32% of fatal accidents, but less than 5% of non-fatal accidents. The relationship between violations and fatal accidents is perhaps not surprising given that two of the more common types of violations in fatal
– 25 –
accidents involved VFR rated pilots flying into IMC and low-altitude flight manoeuvres. An earlier ATSB research paper (Batt & O'Hare, 2005) found that 76% of VFR into IMC accidents resulted in a fatality. Loss of control in flight during unnecessary low-level flight is also more likely to result in a fatal accident (Australian Transport Safety Bureau, 2004).
While the results of the analysis conducted here show a link between both decision errors and violations with fatal accidents, it should also be recognised that skill-based errors, while proportionately lower in fatal accidents compared with non-fatal accidents, were still very high (76.9% and 84.9% respectively). It is unclear whether the combination of error types, or a combination of violations and errors, is more important than a particular type of error or violation alone. The findings of this study suggest that the fatal accident rate might be reduced if decision-making can be improved, and if violations are reduced. However, the interaction between errors also needs to be understood more fully in order to develop a better understanding of the relationship between error types and the severity of the accident.
A study of the errors deemed to have made the accident inevitable (identified as the precipitating error) might provide some evidence that the way errors combine is a more important determinant of the severity of the accident. While the analysis presented here indicates that more violations and decision errors accompany fatal accidents, the assessments based on the precipitating error indicate that these errors were less commonly associated with the point at which the accident became inevitable. One explanation for this is that decision errors and/or violations act in concert with other errors (usually skill-based errors), and when they do, the accident is more likely to result in fatalities. In other words, a more severe accident may result if the pilot’s skills are unable to cope with, or compensate for, a preceding violation or decision error. Hence, an initial error or violation may result in a more serious outcome if it is compounded by a subsequent error.
4.2 How do Australia and the US compare?
A general overview of Australian and US accidents
The comparison of Australian and US data covered the period 1992 to 2002. The study examined 2,025 accidents in Australia, and 18,961 in the US. The highest proportion of activity for both countries was in general aviation (Part 91), followed by air carrier operations (Part 121). More than half of all flights in the US were conducted under Part 91 operations, while just under half of all flights in Australia were flown under this regulation category. Australia had considerably more on-demand operations (Part 135 non-scheduled) than the US (17.8% and 4.4% respectively), and this category had a correspondingly higher accident rate (17.4% compared with 4.3%).
Although the number of accidents is considerably higher in the US, their accident rate appears to be much lower. Activity data for the US records 443 million flight hours over this period giving a rate of 4.3 accidents per 100,000 hours, whereas Australia recorded 27.2 million flight hours and 7.4 accidents per 100,000 hours. The difference is considerable and is not easily explained. In 2005 the NTSB published a report examining the methodology used in the US to estimate activity data for general aviation and on-demand operations. The report found that the survey methodology used to develop estimates of annual hours flown in these categories is likely to be inaccurate and may not have provided a reliable basis for estimating accident rate trends in the US
– 26 –
(National Transportation Safety Board, 2005). Hence, a comparison of accident rates in Australia and the US based on hours flown may be misleading, and should be treated with some caution.
Nearly 90% of US accidents involved general aviation (Part 91) flights, while in Australia just under 70% of accidents were in general aviation (Part 91). Accidents in other categories were either infrequent or rare.
The phase of flight where the accident occurred was very similar for both countries. The landing was the most common phase of flight for accidents, with take-off and manoeuvring the next most common stages of flight for Australian accidents. Australia had a higher proportion of accidents during landing and during manoeuvring compared with the US, and the US had a higher proportion of accidents attributed to cruise and descent phases of flight.
An overview of Australian and US accidents using HFACS
Despite the apparent difference in accident rates, the proportion of accidents that involved an unsafe act was similar: of the 2,025 accidents in Australia, 1,404 (69%) were identified as involving an unsafe act while 13,700 accidents (72%) in the US involved an unsafe act.
Moreover, the pattern of results between US and Australian accidents was remarkably similar. The rank order of unsafe act categories was the same in the accident sets for both countries. Skill-based errors were by far the most common type of aircrew error followed by decision errors, violations and perceptual errors, in that order.
Differences between Australian and US results included a higher percentage of skill-based errors in Australian accidents but a significantly higher number of US accidents were associated with a violation.
The percentage of skill-based errors was high for both Australian and US accidents and we regard the difference (84% compared to 77%) to be minor and not of practical importance. Violations on the other hand, were found in nearly twice as many of the US accidents (12.9% of US accidents but only 7.7% of Australian accidents). The impact of this difference is limited by the potential underreporting of violations in the Australian data. Insufficient evidence in the accident reports to code a violation was common. For example, evidence that the pilot intentionally flew with insufficient fuel was needed to code a fuel reserve violation. When only fatal accidents are considered, for which the most detailed investigation information is available, the percentage of US and Australian accidents associated with a violation is similar.
There was also a significant difference between the number of fatal and non-fatal Australian accidents associated with decision errors and perceptual errors, which was not the case for US accidents. Fatal aviation accidents in Australia were associated with more decision errors than non-fatal accidents (43% of fatal accidents in Australia were associated with a decision error while 32% of non-fatal accidents involved a decision error). For US accidents, 29.3% of fatal accidents and 29.2% of non-fatal accidents were associated with decision errors.
Consistent with the Australian results, the association of decision errors with fatal accidents has been demonstrated in other studies (O'Hare et al., 1994; Wiegmann & Shappell, 1997). O’Hare et al. (1994) found decision errors were associated with 30.5% of non-fatal accidents but 62.5% of fatal accidents. Wiegmann and Shappell (1997), using a classification scheme developed prior to HFACS, found that judgement errors
– 27 –
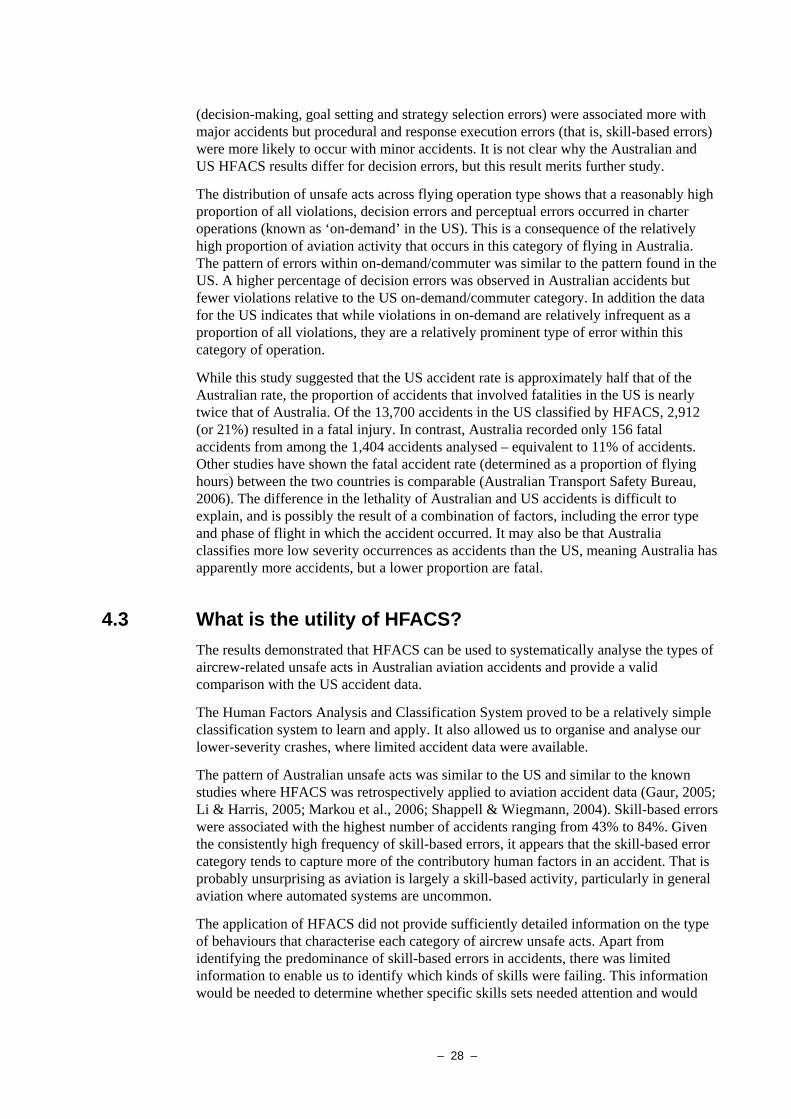
(decision-making, goal setting and strategy selection errors) were associated more with major accidents but procedural and response execution errors (that is, skill-based errors) were more likely to occur with minor accidents. It is not clear why the Australian and US HFACS results differ for decision errors, but this result merits further study.
The distribution of unsafe acts across flying operation type shows that a reasonably high proportion of all violations, decision errors and perceptual errors occurred in charter operations (known as ‘on-demand’ in the US). This is a consequence of the relatively high proportion of aviation activity that occurs in this category of flying in Australia. The pattern of errors within on-demand/commuter was similar to the pattern found in the US. A higher percentage of decision errors was observed in Australian accidents but fewer violations relative to the US on-demand/commuter category. In addition the data for the US indicates that while violations in on-demand are relatively infrequent as a proportion of all violations, they are a relatively prominent type of error within this category of operation.
While this study suggested that the US accident rate is approximately half that of the Australian rate, the proportion of accidents that involved fatalities in the US is nearly twice that of Australia. Of the 13,700 accidents in the US classified by HFACS, 2,912 (or 21%) resulted in a fatal injury. In contrast, Australia recorded only 156 fatal accidents from among the 1,404 accidents analysed – equivalent to 11% of accidents. Other studies have shown the fatal accident rate (determined as a proportion of flying hours) between the two countries is comparable (Australian Transport Safety Bureau, 2006). The difference in the lethality of Australian and US accidents is difficult to explain, and is possibly the result of a combination of factors, including the error type and phase of flight in which the accident occurred. It may also be that Australia classifies more low severity occurrences as accidents than the US, meaning Australia has apparently more accidents, but a lower proportion are fatal.
4.3 What is the utility of HFACS? The results demonstrated that HFACS can be used to systematically analyse the types of aircrew-related unsafe acts in Australian aviation accidents and provide a valid comparison with the US accident data.
The Human Factors Analysis and Classification System proved to be a relatively simple classification system to learn and apply. It also allowed us to organise and analyse our lower-severity crashes, where limited accident data were available.
The pattern of Australian unsafe acts was similar to the US and similar to the known studies where HFACS was retrospectively applied to aviation accident data (Gaur, 2005; Li & Harris, 2005; Markou et al., 2006; Shappell & Wiegmann, 2004). Skill-based errors were associated with the highest number of accidents ranging from 43% to 84%. Given the consistently high frequency of skill-based errors, it appears that the skill-based error category tends to capture more of the contributory human factors in an accident. That is probably unsurprising as aviation is largely a skill-based activity, particularly in general aviation where automated systems are uncommon.
The application of HFACS did not provide sufficiently detailed information on the type of behaviours that characterise each category of aircrew unsafe acts. Apart from identifying the predominance of skill-based errors in accidents, there was limited information to enable us to identify which kinds of skills were failing. This information would be needed to determine whether specific skills sets needed attention and would
– 28 –
also assist with the development of targeted strategies to address common deficiencies. Of more interest perhaps, is the suggestion that the interaction of errors and violations is more important for accounting for the severity of an accident. A deeper appreciation of the way errors might work in concert may provide more meaningful insights than the study of each error type in isolation.
In this report, the NTSB accident subject codes were used as a substitute for identifying the type of behaviours that characterise each category of aircrew unsafe acts. But since this was not the taxonomy’s primary purpose, these codes were not ideal for the task. The ATSB is currently developing a new framework to assist and enhance investigation analysis. The Safety Investigation Information Management System (SIIMS) is intended to offer improved methodology to identify and understand the role of safety factors – events that increase the risk to safety. Data from earlier investigations will also be recoded to comply with the SIIMS framework. This new system may offer some advantages over the application of HFACS to accident data. A comparison between the insights available from SIIMS and those from HFACS would be worthwhile.
In summary, HFACS enabled a comprehensive analysis of the human errors contributing to Australian aviation accidents and comparison with US accidents. The application of HFACS identified the most common type of unsafe act but on its own, and at the level of ‘unsafe acts of the operator’, did not provide sufficient insights to suggest specific strategies to enhance aviation safety.
– 29 –

– 30 –
5 CONCLUSIONS The application of HFACS to Australian accident data has provided a new perspective to consider the contribution of unsafe acts to aviation accidents. The study has confirmed previous studies conducted elsewhere that skill-based errors are more common than any other type of error or violation. Skill-based errors were also the most common error type irrespective of the severity of the accident. This finding suggests that improving skills, especially among general aviation pilots, should make a positive contribution to the overall accident rate.
However, it also appears that decision errors and violations become more important factors for fatal accidents. Improvements in aeronautical decision-making and the modification of risk-taking behaviour remain important components of any strategy to reduce the rate of fatal accidents.
Overall, while some differences were found in the comparison between the patterns of Australian and US accidents, it appears that many of the human factors issues associated with accidents are the same for both countries. Any new initiatives that can reduce accident rates in one country are likely to be equally effective if applied to the other. However, specific strategies are difficult to develop based on the results of HFACS analysis at the level of ‘unsafe acts of the operator’ alone. There was also no clear basis for the much higher lethality of US accidents compared with Australia. The relative frequency of errors and violations alone does not explain the difference.
Based on the findings presented here, a further study is warranted to provide a more detailed understanding of the specific sets of skills represented within this error category. Moreover, the interaction between different error types, or error types and violations, would need to be understood better. While decision errors and violations are more prominent in fatal accidents, the frequency of skill-based errors remains very high for these accidents and so are likely to play an important role in determining the severity of an accident.
– 31 –

– 32 –
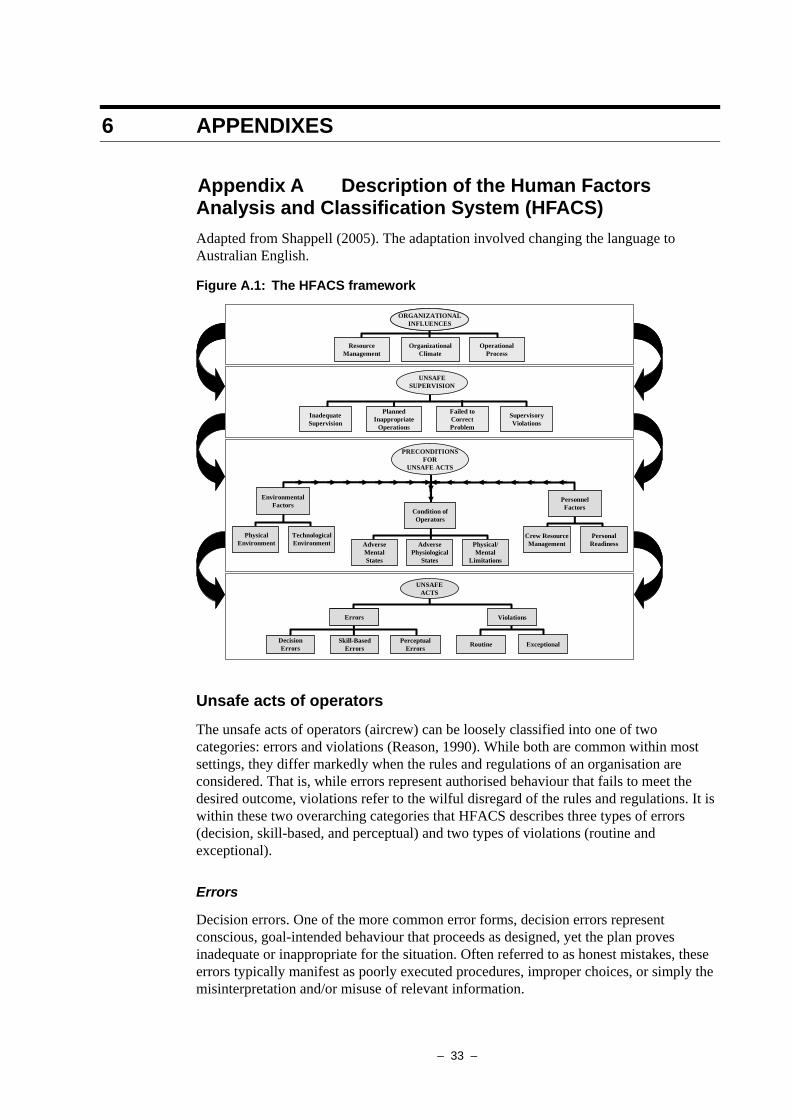
6 APPENDIXES
Appendix A Description of the Human Factors Analysis and Classification System (HFACS) Adapted from Shappell (2005). The adaptation involved changing the language to Australian English.
Figure A.1: The HFACS framework
Errors
UNSAFEACTS
Errors
PerceptualErrors
Skill-BasedErrors
DecisionErrors ExceptionalRoutine
Violations
InadequateSupervision
PlannedInappropriate
Operations
Failed toCorrectProblem
SupervisoryViolations
UNSAFESUPERVISION
ResourceManagement
OrganizationalClimate
OperationalProcess
ORGANIZATIONALINFLUENCES
PRECONDITIONSFOR
UNSAFE ACTS
Condition of Operators
Physical/Mental
Limitations
Adverse Mental States
Technological Environment
Physical Environment
PersonalReadiness
Crew Resource Management
Personnel Factors
Adverse Physiological
States
Environmental Factors
Unsafe acts of operators
The unsafe acts of operators (aircrew) can be loosely classified into one of two categories: errors and violations (Reason, 1990). While both are common within most settings, they differ markedly when the rules and regulations of an organisation are considered. That is, while errors represent authorised behaviour that fails to meet the desired outcome, violations refer to the wilful disregard of the rules and regulations. It is within these two overarching categories that HFACS describes three types of errors (decision, skill-based, and perceptual) and two types of violations (routine and exceptional).
Errors
Decision errors. One of the more common error forms, decision errors represent conscious, goal-intended behaviour that proceeds as designed, yet the plan proves inadequate or inappropriate for the situation. Often referred to as honest mistakes, these errors typically manifest as poorly executed procedures, improper choices, or simply the misinterpretation and/or misuse of relevant information.
– 33 –
Skill-based errors. In contrast to decision errors, the second error form, skill-based errors, occurs with little or no conscious thought. Indeed, just as decision errors can be thought of as ‘thinking’ errors, skill-based errors can be thought of as ‘doing’ errors. For instance, little thought goes into turning one’s steering wheel or shifting gears in an automobile. Likewise, basic flight skills such as stick and rudder movements and visual scanning refer more to how one does something rather than where one is going or why. The difficulty with these highly practiced and seemingly automatic behaviours is that they are particularly susceptible to attention and/or memory failures. As a result, skill-based errors frequently appear as the breakdown in visual scan patterns, inadvertent activation/deactivation of switches, forgotten intentions, and omitted items in checklists. Even the manner (or skill) with which one flies an aircraft (aggressive, tentative, or controlled) can affect safety.
Perceptual errors. While decision and skill-based errors have dominated most accident databases and have, therefore, been included in most error frameworks, the third and final error form, perceptual errors, has received comparatively less attention. No less important, these ‘perceiving’ errors arise when sensory input is degraded, or ‘unusual’ as is often the case when flying at night, in bad weather, or in other visually impoverished environments. Faced with acting on imperfect or incomplete information, aircrew run the risk of misjudging distances, altitude, and descent rates, as well as responding incorrectly to a variety of visual/vestibular illusions.
Violations
Routine violations. Although there are many ways to distinguish between types of violations, two distinct forms have been identified based on their aetiology. The first, routine violations, tends to be habitual by nature and is often enabled by a system of supervision and management that tolerates such departures from the rules (Reason, 1990). Often referred to as ‘bending the rules’, the classic example is that of the individual who drives their automobile consistently 5–10 mph faster than allowed by law. While clearly against the law, the behaviour is, in effect, sanctioned by local authorities (police) who often will not enforce the law until speeds in excess of 10 mph over the posted limit are observed.
Exceptional violations. These types of violations, on the other hand, are isolated departures from authority, neither typical of the individual nor condoned by management. For example, while authorities might condone driving 65 in a 55 mph zone, driving 105 mph in a 55 mph zone would almost certainly result in a speeding ticket. It is important to note that, while most exceptional violations are appalling, they are not considered ‘exceptional’ because of their extreme nature. Rather, they are regarded as exceptional because they are neither typical of the individual nor condoned by authority.
Preconditions for unsafe acts
Simply focusing on unsafe acts, however, is like focusing on a patient’s symptoms without understanding the underlying disease state that caused it. As such, investigators must dig deeper into the preconditions for unsafe acts. Within HFACS, three major subdivisions are described: 1) condition of the operator; 2) personnel factors; and 3) environmental factors.
– 34 –
Condition of operators
Adverse mental states. Being prepared mentally is critical in nearly every endeavour; perhaps it is even more so in aviation. With this in mind, the first of three categories, adverse mental states, was created to account for those mental conditions that adversely affect performance and contribute to unsafe acts. Principal among these are the loss of situational awareness, mental fatigue, circadian dysrhythmia, and pernicious attitudes such as overconfidence, complacency, and misplaced motivation.
Adverse physiological states. Equally important, however, are those adverse physiological states that preclude the safe conduct of flight. Particularly important to aviation are conditions such as spatial disorientation, visual illusions, hypoxia, illness, intoxication, and a whole host of pharmacological and medical abnormalities known to affect performance. It is important to understand that conditions such as spatial disorientation are physiological states that cannot be turned on or off — they just exist. As a result, these adverse physiological states often lead to the commission of unsafe acts like perceptual errors. For instance, it is not uncommon in aviation for a pilot to become spatially disoriented (adverse physiological state) and subsequently misjudge the aircraft’s pitch or attitude (perceptual error), resulting in a loss of control and/or collision with the terrain.
Physical and/or mental limitations. The third and final category of substandard conditions, physical/mental limitations, includes those instances when necessary sensory information is either unavailable, or if available, individuals simply do not have the aptitude, skill, or time to safely deal with it. In aviation, the former often includes not seeing other aircraft or obstacles due to the size and/or contrast of the object in the visual field. Likewise, there are instances when an individual simply may not possess the necessary aptitude, physical ability, or proficiency to operate safely. After all, just as not everyone can play linebacker for their favourite professional football team or be a concert pianist, not everyone has the aptitude or physical attributes necessary to fly aircraft.
Personnel factors
Often things that we do to ourselves will lead to undesirable conditions and unsafe acts, as described above. Referred to as personnel factors, these preconditions have been divided into two general categories: crew resource management and personal readiness.
Crew resource management. It is not hard to imagine that when all members of the crew are not acting in a coordinated manner, confusion (adverse mental state) and poor decisions in the cockpit can ensue. Crew resource mismanagement, as it is referred to here, includes the failures of both inter- and intra-cockpit communication, as well as communication with ATC and other ground personnel. This category also includes those instances when crew members do not work together as a team, or when individuals directly responsible for the conduct of operations fail to coordinate activities before, during, and after a flight.
Personal readiness. Individuals must, by necessity, ensure that they are adequately prepared for flight. Consequently, the category of personal readiness was created to account for those instances when rules such as disregarding crew rest requirements, violating alcohol restrictions, or self-medicating, are not adhered to. However, even behaviours that do not necessarily violate existing rules or regulations (eg. running ten miles before piloting an aircraft or not observing good dietary practices) may reduce the operating capabilities of the individual and are, therefore, captured here as well.
– 35 –
Environmental factors
Although not human per se, environmental factors can also contribute to the substandard conditions of operators and hence to unsafe acts. Very broadly, these environmental factors can be captured within two general categories: the physical environment and the technological environment.
Physical environment. The impact that the physical environment can have on aircrew has long been known, and much has been documented in the literature on this topic (eg. Nicogossian, Huntoon, & Pool, 1994; Reinhart, 1996). The term ‘physical environment’ refers to both the operational environment (eg. weather, altitude, terrain) as well as the ambient environment, such as heat, vibration, lighting, and toxins in the cockpit. For example, flying into adverse weather reduces visual cues, which can lead to spatial disorientation and perceptual errors. Other aspects of the physical environment such as heat can cause dehydration, which reduces a pilot’s alertness level, producing a subsequent slowing of decision-making processes or even the inability to control the aircraft. Likewise, a loss of pressurisation at high altitudes or manoeuvring at high altitudes without supplemental oxygen in unpressurised aircraft can result in hypoxia, which leads to delirium, confusion, and a host of unsafe acts.
Technological environment. Within the context of HFACS, the term ‘technological environment’ encompasses a variety of issues, including the design of equipment and controls, display/interface characteristics, checklist design, and automation, to name a few. Indeed, one of the classic design problems first discovered in aviation was the similarity between the controls used to raise and lower the flaps and those used to raise and lower the landing gear. Such similarities often caused confusion among pilots, resulting in the frequent raising of the landing gear while still on the ground. Likewise, automation designed to improve human performance can have unforeseen consequences. For example, highly reliable automation has been shown to induce adverse mental states such as overconfidence and complacency, resulting in pilots following the instructions of the automation even when common sense suggests otherwise. In contrast, unreliable automation can often result in a lack of confidence and disuse of automation even though aided performance is safer than unaided performance (Wickens & Hollands, 2000).
Unsafe supervision
Clearly, aircrews are responsible for their actions and, as such, must be held accountable. However, in some instances, they are the unwitting inheritors of latent failures attributable to those who supervise them. To account for these latent failures, the overarching category of unsafe supervision was created within which four categories (inadequate supervision, planned inappropriate operations, failed to correct known problems, and supervisory violations) are included.
Inadequate supervision. This category refers to failures within the supervisory chain of command as a direct result of some supervisory action or inaction. At a minimum, supervisors must provide the opportunity for individuals to succeed. It is expected, therefore, that individuals will receive adequate training, professional guidance, oversight, and operational leadership, and that all will be managed appropriately. When this is not the case, aircrew can become isolated, thereby increasing the risks associated with day-to-day operations.
Planned inappropriate operations. The risks associated with supervisory failures come in many forms. Occasionally, for example, the operational tempo and/or schedule are
– 36 –
planned such that individuals are put at unacceptable risk and, ultimately, performance is adversely affected. As such, the category of planned inappropriate operations was created to account for all aspects of improper or inappropriate crew scheduling and operational planning, which may focus on such issues as crew pairing, crew rest, and managing the risk associated with specific flights.
Failed to correct known problems. The remaining two categories of unsafe supervision, the failure to correct known problems and supervisory violations, are similar, yet considered separately within HFACS. Failed to correct known problems refers to those instances when deficiencies among individuals, equipment, training, or other related safety areas are known to the supervisor, yet are allowed to continue uncorrected. For example, the failure to consistently correct or discipline inappropriate behaviour certainly fosters an unsafe atmosphere but is not considered a violation if no specific rules or regulations are broken.
Supervisory violations. This category is reserved for those instances when supervisors wilfully disregard existing rules and regulations. For instance, permitting aircrew to operate an aircraft without current qualifications or license is a flagrant violation that may set the stage for the tragic sequence of events that may follow.
Organisational Influences
Where decisions and practices by front-line supervisors and middle management can adversely impact aircrew performance, fallible decisions of upper-level management may directly affect supervisors and the personnel they manage. Unfortunately, these organisational influences often go unnoticed or unreported by even the best-intentioned accident investigators. The HFACS framework describes three latent organisational failures: 1) resource management, 2) organisational climate, and 3) operational processes.
Resource management. This category refers to the management, allocation, and maintenance of organisational resources, including human resource management (selection, training, staffing), monetary safety budgets, and equipment design (ergonomic specifications). In general, corporate decisions about how such resources should be managed centre around two distinct objectives — the goal of safety and the goal of on-time, cost-effective operations. In times of prosperity, both objectives can be easily balanced and satisfied. However, there may also be times of fiscal austerity that demand some give and take between the two. Unfortunately, history tells us that safety is often the loser in such battles, as safety and training are often the first to be cut in organisations experiencing financial difficulties.
Organisational climate. The concept of an organisation’s culture has been described in many ways; however, here it refers to a broad class of organisational variables that influence worker performance. One telltale sign of an organisation’s climate is its structure, as reflected in the chain-of-command, delegation of authority and responsibility, communication channels, and formal accountability for actions. Just like in the cockpit, communication and coordination are vital within an organisation. However, an organisation’s policies and culture are also good indicators of its climate. Consequently, when policies are ill-defined, adversarial, or conflicting, or when they are supplanted by unofficial rules and values, confusion abounds, and safety suffers within an organisation.
Operational process. Finally, operational process refers to formal processes (operational tempo, time pressures, production quotas, incentive systems, schedules, etc.), procedures
– 37 –
(performance standards, objectives, documentation, instructions about procedures, etc.), and oversight within the organisation (organisational self-study, risk management, and the establishment and use of safety programs). Poor upper-level management and decisions concerning each of these organisational factors can also have a negative, albeit indirect, effect on operator performance and system safety.
References
Nicogossian, A. E., Huntoon, C. L., & Pool, S. L. (1994). Space physiology and medicine (3rd edition). Baltimore, MD: Williams and Wilkins.
Reason, J. (1990). Human error. New York: Cambridge University Press.
Reinhart, R. (1996). Basic flight physiology (2nd edition). New York: McGraw Hill.
Wickens, C. D., & Hollands, J. G. (2000). Engineering psychology and human performance (3rd edition). Upper Saddle River, NJ: Prentice Hall.
– 38 –
Appendix B Occurrence codes and phase of flight codes Codes used by the National Transportation Safety Board (US) in categorising accident occurrences and phases of operation (National Transportation Safety Board, 1998)
Source: National Transportation Safety Board (1998). Aviation coding manual, Washington, DC, National Transportation Safety Board.
– 39 –
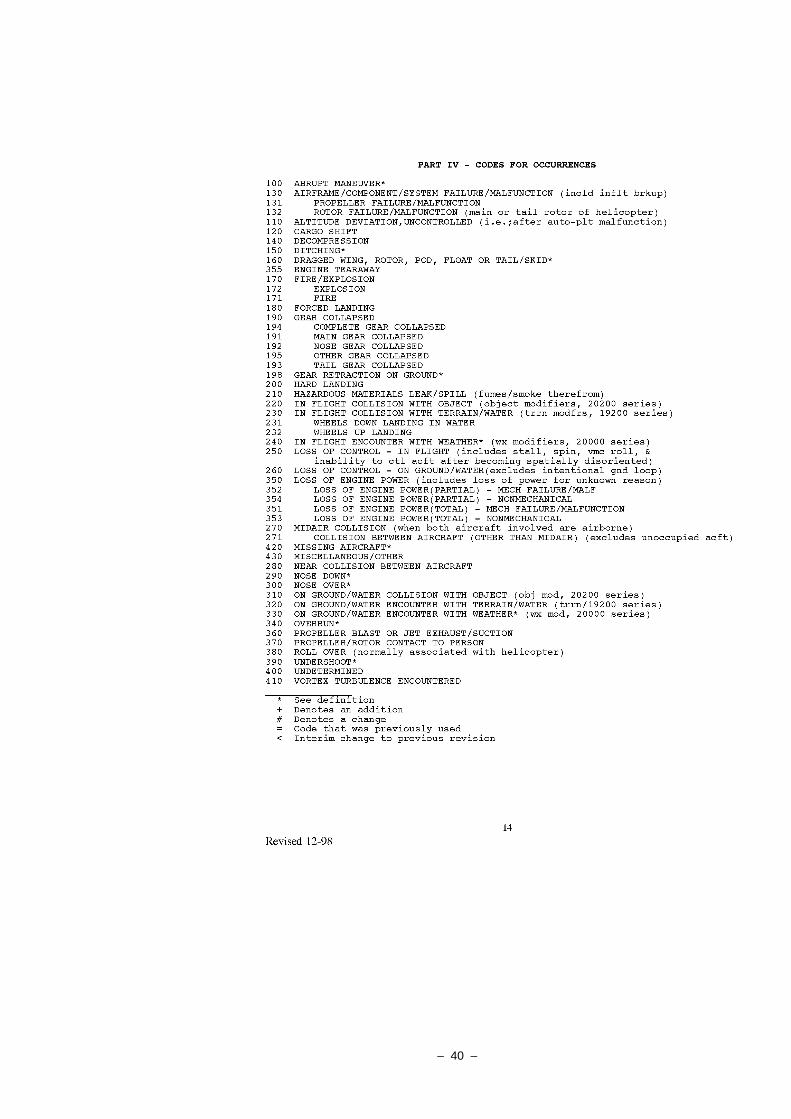
– 40 –
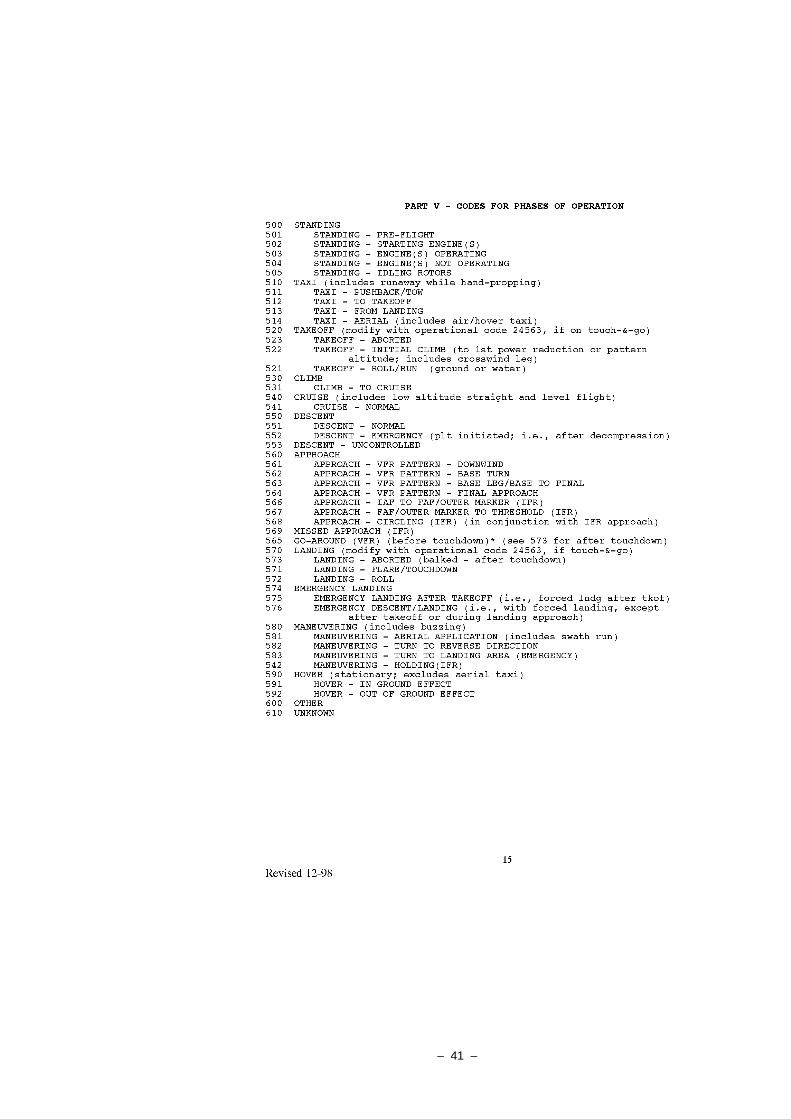
– 41 –
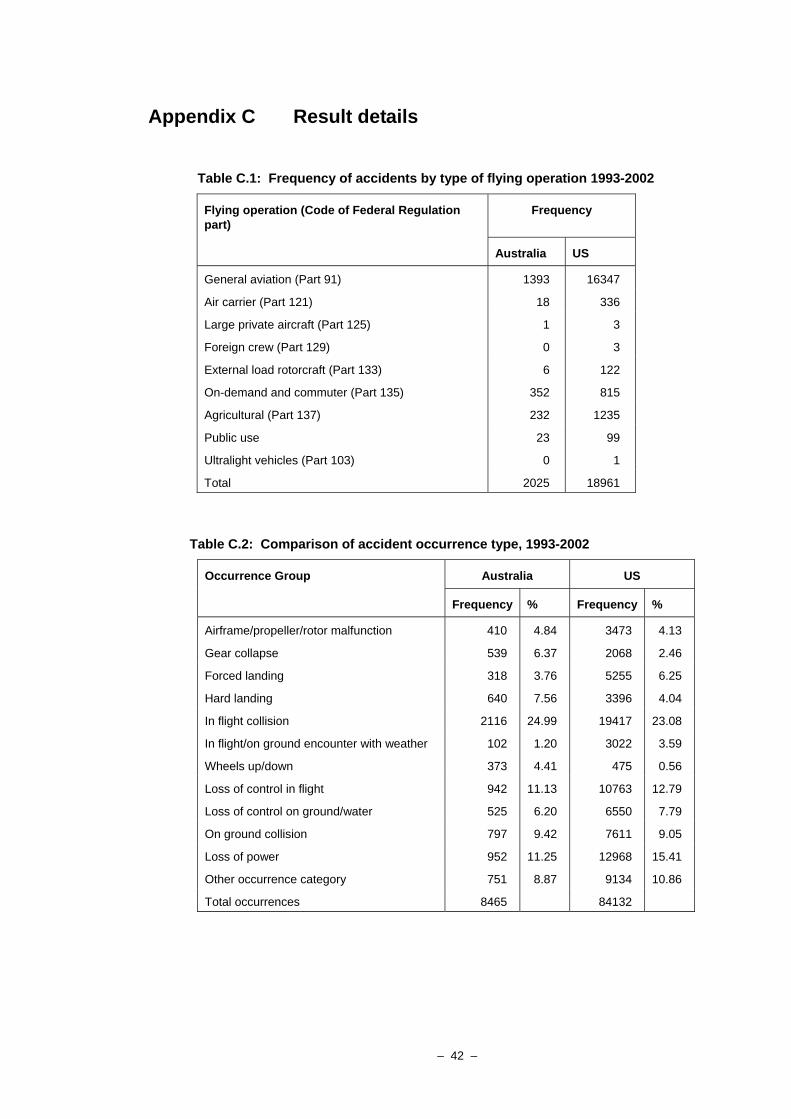
Appendix C Result details
Table C.1: Frequency of accidents by type of flying operation 1993-2002
Flying operation (Code of Federal Regulation part)
Frequency
Australia US
General aviation (Part 91) 1393 16347
Air carrier (Part 121) 18 336
Large private aircraft (Part 125) 1 3
Foreign crew (Part 129) 0 3
External load rotorcraft (Part 133) 6 122
On-demand and commuter (Part 135) 352 815
Agricultural (Part 137) 232 1235
Public use 23 99
Ultralight vehicles (Part 103) 0 1
Total 2025 18961
Table C.2: Comparison of accident occurrence type, 1993-2002
Occurrence Group Australia US
Frequency % Frequency %
Airframe/propeller/rotor malfunction 410 4.84 3473 4.13
Gear collapse 539 6.37 2068 2.46
Forced landing 318 3.76 5255 6.25
Hard landing 640 7.56 3396 4.04
In flight collision 2116 24.99 19417 23.08
In flight/on ground encounter with weather 102 1.20 3022 3.59
Wheels up/down 373 4.41 475 0.56
Loss of control in flight 942 11.13 10763 12.79
Loss of control on ground/water 525 6.20 6550 7.79
On ground collision 797 9.42 7611 9.05
Loss of power 952 11.25 12968 15.41
Other occurrence category 751 8.87 9134 10.86
Total occurrences 8465 84132
– 42 –
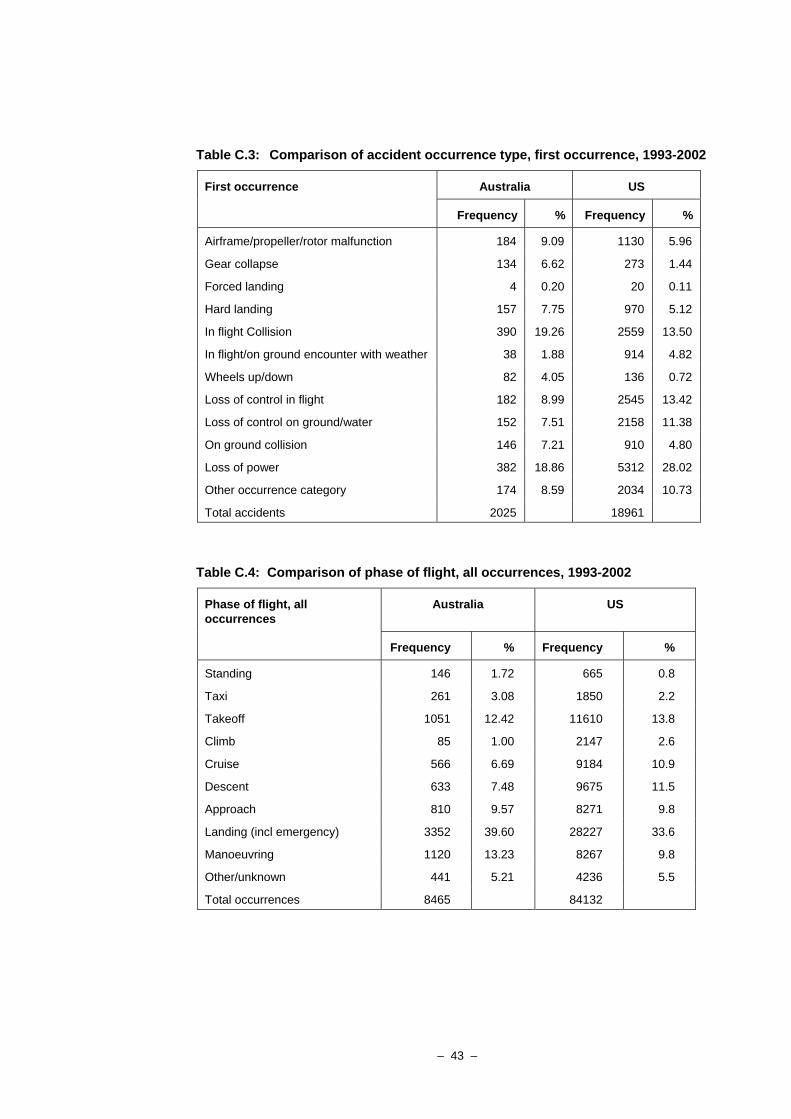
Table C.3: Comparison of accident occurrence type, first occurrence, 1993-2002
First occurrence Australia US
Frequency % Frequency %
Airframe/propeller/rotor malfunction 184 9.09 1130 5.96
Gear collapse 134 6.62 273 1.44
Forced landing 4 0.20 20 0.11
Hard landing 157 7.75 970 5.12
In flight Collision 390 19.26 2559 13.50
In flight/on ground encounter with weather 38 1.88 914 4.82
Wheels up/down 82 4.05 136 0.72
Loss of control in flight 182 8.99 2545 13.42
Loss of control on ground/water 152 7.51 2158 11.38
On ground collision 146 7.21 910 4.80
Loss of power 382 18.86 5312 28.02
Other occurrence category 174 8.59 2034 10.73
Total accidents 2025 18961
Table C.4: Comparison of phase of flight, all occurrences, 1993-2002
Phase of flight, all occurrences
Australia US
Frequency % Frequency %
Standing 146 1.72 665 0.8
Taxi 261 3.08 1850 2.2
Takeoff 1051 12.42 11610 13.8
Climb 85 1.00 2147 2.6
Cruise 566 6.69 9184 10.9
Descent 633 7.48 9675 11.5
Approach 810 9.57 8271 9.8
Landing (incl emergency) 3352 39.60 28227 33.6
Manoeuvring 1120 13.23 8267 9.8
Other/unknown 441 5.21 4236 5.5
Total occurrences 8465 84132
– 43 –
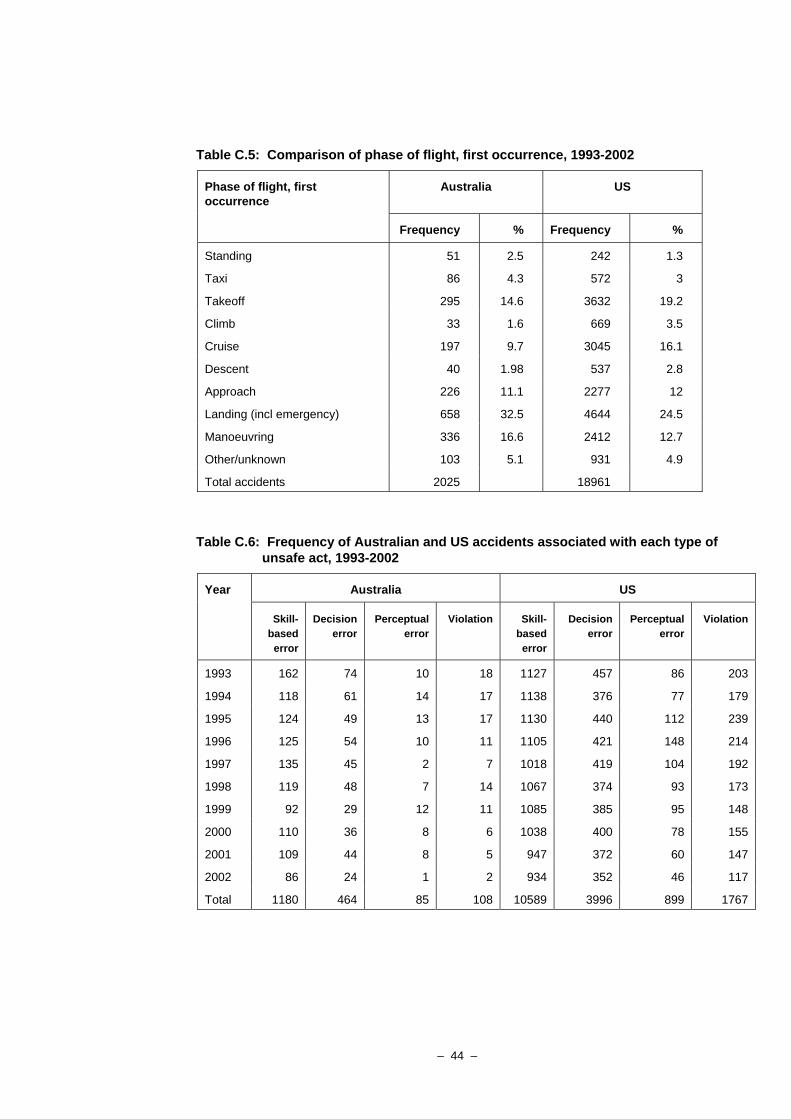
Table C.5: Comparison of phase of flight, first occurrence, 1993-2002
Phase of flight, first occurrence
Australia US
Frequency % Frequency %
Standing 51 2.5 242 1.3
Taxi 86 4.3 572 3
Takeoff 295 14.6 3632 19.2
Climb 33 1.6 669 3.5
Cruise 197 9.7 3045 16.1
Descent 40 1.98 537 2.8
Approach 226 11.1 2277 12
Landing (incl emergency) 658 32.5 4644 24.5
Manoeuvring 336 16.6 2412 12.7
Other/unknown 103 5.1 931 4.9
Total accidents 2025 18961
Table C.6: Frequency of Australian and US accidents associated with each type of unsafe act, 1993-2002
Year Australia US
Skill-based error
Decision error
Perceptual error
Violation Skill-based error
Decision error
Perceptual error
Violation
1993 162 74 10 18 1127 457 86 203
1994 118 61 14 17 1138 376 77 179
1995 124 49 13 17 1130 440 112 239
1996 125 54 10 11 1105 421 148 214
1997 135 45 2 7 1018 419 104 192
1998 119 48 7 14 1067 374 93 173
1999 92 29 12 11 1085 385 95 148
2000 110 36 8 6 1038 400 78 155
2001 109 44 8 5 947 372 60 147
2002 86 24 1 2 934 352 46 117
Total 1180 464 85 108 10589 3996 899 1767
– 44 –
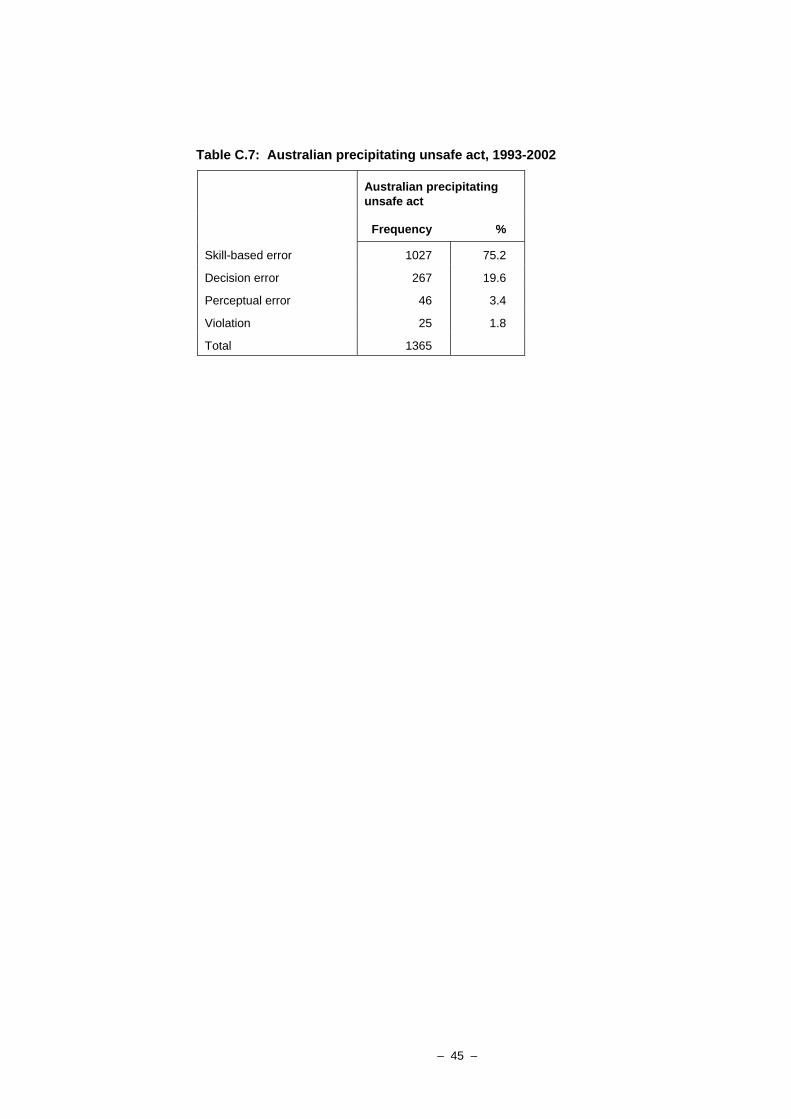
Table C.7: Australian precipitating unsafe act, 1993-2002
Australian precipitating unsafe act
Frequency %
Skill-based error 1027 75.2
Decision error 267 19.6
Perceptual error 46 3.4
Violation 25 1.8
Total 1365
– 45 –

– 46 –
7 REFERENCES Adams, D. (2006). A layman's introduction to human factors in aircraft accident and incident
investigation (Safety Information Paper B2006/0094). Canberra: Australian Transport Safety Bureau.
Altman, D. G. (1991). Practical statistics for medical research. Boca Raton: Chapman & Hall/CRC.
Australian Transport Safety Bureau. (2004). General aviation fatal accidents: How do they happen? A review of general aviation accidents 1991 to 2000 (Aviation Research Paper B2004/0010). Canberra: Australian Transport Safety Bureau.
Australian Transport Safety Bureau. (2006). International fatality rates: A comparison of Australian civil aviation fatality rates with international data (Aviation Research & Analysis Report B2006/0002). Canberra: Australian Transport Safety Bureau.
Batt, R., & O'Hare, D. (2005). General aviation pilot behaviours in the face of adverse weather (Aviation Research Investigation Report B2000/0127). Canberra: Australian Transport Safety Bureau.
Boquet, A., Detwiler, C., Holcomb, K., Holcomb, K., Shappell, S. A., & Wiegmann, D. A. (2005). Human error associated with air medical transport accidents in the United States: Manuscript submitted for publication.
Davies, H. T. O. (2001). What are confidence intervals? Retrieved 28 August 2006, from http://www.evidence-based-medicine.co.uk/ebmfiles/WhatareConfInter.pdf
Detwiler, C., Boquet, A., Holcomb, K., Hackworth, C., Pfeiderer, E., Wiegmann, D. A., et al. (2005a). Beneath the tip of the iceberg:A human factors analysis of general aviation accidents in Alaska versus the rest of the United States (DOT/FAA/AM-06/7). Oklahoma City, OK 73125: Civil Aerospace Medical Institute, Federal Aviation Administration.
Detwiler, C., Holcomb, K., Boquet, A., Wiegmann, D. A., & Shappell, S. A. (2005b). A human error analysis of general aviation and commercial air tour accidents. Paper presented at the 76th Annual Meeting of the Aerospace Medical Association, Kansas City, MO.
Diekhoff, G. (1992). Statistics for the social and behavioural sciences:Univariate, bivariate, multivariate. Dubuque, IA: Wm. C. Brown Publishers.
Federal Railroad Administration. (2005). Human factors root cause analysis of accidents/incidents involving remote control locomotive operations (No. RR05-05). Washington, DC: US Department of Transportation.
Gaur, D. (2005). Human factors analysis and classification system applied to civil aircraft accidents in India. Aviation, Space and Environmental Medicine, 76(5), 501-505.
Helmreich, R. L., & Merritt, A. C. (1998). Culture at work in aviation and medicine: National, organizational and professional influences. Aldershot, United Kingdom: Ashgate.
Li, W.-C., & Harris, D. (2005). HFACS analysis of ROC air force aviation accidents:Reliability analysis and cross-cultural comparison. International Journal of Applied Aviation Studies, 5(1), 65-81.
Li, W.-C., Harris, D., & Chen, S.-Y. (2005). Eastern minds in western cockpits: Cross-cultural comparison of aviation mishaps by applying human factors analysis and classification system (HFACS). Manuscript submitted for publication.
Lourens, P. F. (1989). Error analysis and applications in transportation systems. Accident Analysis & Prevention, 419-426.
– 47 –
Markou, I., Papadopoulos, I., Pouliezos, N., & Poulimenakos, S. (2006). Air accidents-incidents human factors analysis:The Greek experience 1983-2003. Paper presented at the 18th annual European Aviation Safety Seminar, Athens, Greece.
National Transportation Safety Board. (1998). Aviation coding manual. Washington, DC: National Transportation Safety Board.
National Transportation Safety Board. (2005). Current procedures for collecting and reporting US general aviation accident and activity data (NTSB/SR-05/02 PB2005-917002). Washington, DC: National Transportation Safety Board.
O'Hare, D. (2000). The 'wheel of misfortune':A taxonomic approach to human factors in accident investigation and analysis in aviation and other complex systems. Ergonomics, 43(12), 2001-2019.
O'Hare, D., Wiggins, M., Batt, R., & Morrison, D. (1994). Cognitive failure analysis for aircraft accident investigation. Ergonomics, 37(11), 1855-1869.
Pape, A. M., Wiegmann, D. A., & Shappell, S. A. (2001). Air traffic control (ATC) related accidents and incidents:A human factors analysis. Paper presented at the 11th International Symposium on Aviation Psychology, The Ohio State University, Columbus OH.
Shappell, S. A. (2005). Assessment and development of safety programs targeting human error in general aviation: Clemson University, Clemson, SC.
Shappell, S. A., & Wiegmann, D. A. (2000a). Is proficiency eroding among US naval aircrews? A quantitative analysis using the human factors analysis and classification system. Paper presented at the 44th Annual meeting of the Human Factors and Ergonomics Society, San Diego California, USA.
Shappell, S. A., & Wiegmann, D. A. (2000b). The human factors analysis and classification system-HFACS (DOT/FAA/AM-00/7). Oklahoma City, OK: Civil Aeromedical Institute, Federal Aviation Administration.
Shappell, S. A., & Wiegmann, D. A. (2003a). A human error analysis of general aviation controlled flight into terrain (CFIT) accidents occurring between 1990-1998 (DOT/FAA/AM-03/4). Oklahoma City, OK: Civil Aerospace Medical Institute, Federal Aviation Administration.
Shappell, S. A., & Wiegmann, D. A. (2003b). Reshaping the way we look at general aviation accidents using the human factors analysis and classification system. Paper presented at the Proceedings of the 12th International Symposium on Aviation Psychology, Dayton, Ohio USA.
Shappell, S. A., & Wiegmann, D. A. (2004). HFACS analysis of military and civilian aviation accidents: A North American comparison. Paper presented at the Annual Meeting of the International Society of Air Safety Investigators, Queensland, Australia.
Thompson, W. T., Tvaryanas, A. P., & Constable, S. (2005). US military unmanned aerial vehicle mishaps: Assessment of the role of human factors using human factors analysis and classification system (HFACS) (HSW-PE-BR-TR-2005-0001). Brooks City-Base: United States Air Force, 311th Human Systems Wing.
Wiegmann, D. A., & Shappell, S. A. (1997). Human factors analysis of postaccident data:Applying theoretical taxonomies of human error. The International Journal of Aviation Psychology, 7(1), 67-81.
Wiegmann, D. A., & Shappell, S. A. (2001). A human error analysis of commercial aviation accidents using the human factors analysis and classification system (HFACS) (DOT/FAA/AM-01/3). Oklahoma City, OK: Civil Aeromedical Institute.
– 48 –
Wiegmann, D. A., & Shappell, S. A. (2003). A human error approach to aviation accident analysis: The human factors analysis and classification system. London, UK: Ashgate Publishing Company.
Wiegmann, D. A., Shappell, S. A., Boquet, A., Detwiler, C., Holcomb, K., & Faaborg, T. (2005). Human error and general aviation accidents: A comprehensive, fine-grained analysis using HFACS (AHFD-05-08/FAA-05-03). Savoy, Illinois: University of Illinois.
– 49 –