Embed Size (px)
Citation preview
Atithidevo Bhava
INDIA TOURISM STATISTICSINDIA TOURISM STATISTICS
at a Glance 2013 at a Glance 2013
INDIA TOURISM STATISTICS
at a Glance 2013
Incredible !ndia
India Tourism Statistics at a Glance 2013
S.
No Table No.
Subject Page Number
1 Important Facts About Tourism, 2013 1
2 1 Foreign Tourist Arrivals (FTAs) in India, 1997-2014 (till June) 2
3 2 Month-wise Foreign Tourist Arrivals (FTAs) in India, 2012-2014 (till June) 3
4 3 Foreign Exchange Earnings (FEE), in US $ Million, from Tourism in India, 1997-2014 (till June)
4
5 4 Foreign Exchange Earnings (FEE), in ` Rs Crore, from Tourism in India, 1997-2014 (till June)
5
6 5 Month-wise Foreign Exchange Earnings (FEE), in US$ Million, from Tourism in India, 2012-2014 (till June) 6
7 6 Month-wise Foreign Exchange Earnings (FEE), in ` R Crore, from Tourism
in India, 2012-2014 (till June) 7
8 7 Top 10 Source Countries for Foreign Tourist Arrivals (FTAs) in India in 2013.
8
9 8
Number of Indian Nationals Departures (INDs) from India, 1997-2013. 9
10 9 Number of Domestic Tourist Visits (DTVs) to all States/UTs in India, 1997-2013.
10
11 10 Number of Foreign Tourist Visits (FTVs) to all States/UTs in India, 1997 - 2013.
11
12 11 Share of Top 10 States/UTs of India in number of Domestic Tourist Visits in 2013. 12
13 12
Share of Top 10 States/UTs of India in number of Foreign Tourist Visits in 2013. 13
14 13 14
15
Share of India in International Tourist Arrivals in World and Asia & the Pacific Region, 1997-2013.
14 Share of India in International Tourism Receipt in World and Asia & the Pacific Region, 1997-2013.
15
16 15 Share of Top 10 Countries of the World and India in International Tourist Arrivals in 2013.
16
17 16 Share of Top 10 Countries of the World and India in International Tourism Receipt in 2013.
17
18 17 Nationality-wise Visa on Arrivals (VoAs) in India during, 2011-2013. 18
19 18 Airport-wise Statistics of Tourist Visa on Arrivals during, 2011-2013 19
20 19 Scheme-wise Plan Allocation and Expenditure 2013-2014. 20
21 20 Number of Approved Hotels and Hotel Rooms in the Country
2013. during, 21
21 Number of Operators Approved by the Ministry of Tourism in the Countryduring, 2013.
INDEX
22 21
Atithidevo Bhava
INDIA TOURISM STATISTICSINDIA TOURISM STATISTICS
at a Glance 2013 at a Glance 2013
INDIA TOURISM STATISTICS
at a Glance 2013
Incredible !ndia
Incredible !ndia
www.tourism.gov.inwww.incredibleindia.orgMarket Research Division
Ministry of Tourism, Government of IndiaNew DelhiJuly - 2014
vrqY;!Hkkjr
Incredible India, Front 18 x 26.5, 31-7-2014
Incredible India, Back 18 x 26.5, 31-7-2014
Incredible India, Front 18 x 26.5, 31-7-2014
India Tourism Statistics at a Glance 20131
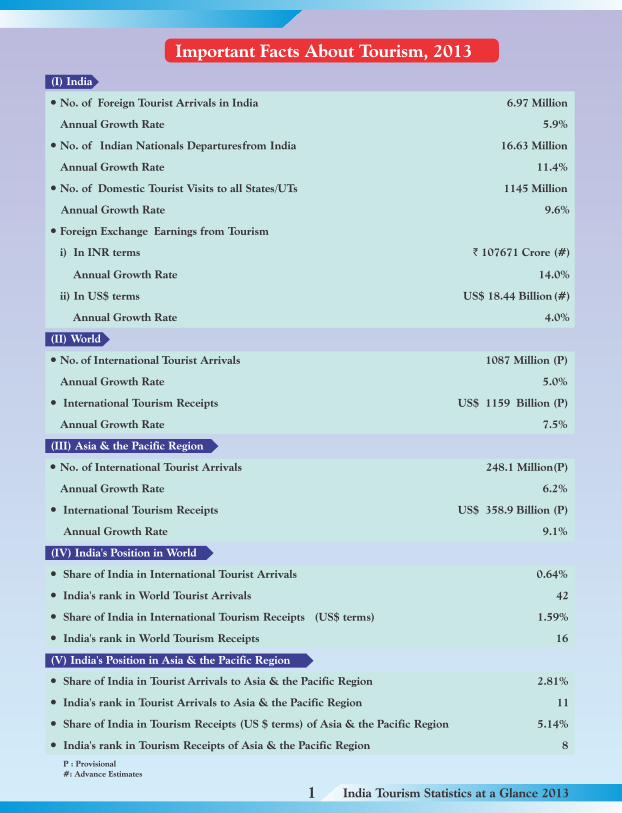
(II) World
● No. of International Tourist Arrivals 1087 Million (P)
Annual Growth Rate 5.0%
● International Tourism Receipts US$ 1159 Billion (P)
Annual Growth Rate 7.5%
● 248.1 Million(P) No. of International Tourist Arrivals
Annual Growth Rate 6.2%
● International Tourism Receipts US$ 358.9 Billion (P)
9.1%
● Share of India in International Tourist Arrivals 0.64%
● India's rank in World Tourist Arrivals 42
● Share of India in International Tourism Receipts (US$ terms) 1.59%
● India's rank in World Tourism Receipts 16
● Share of India in Tourist Arrivals to Asia & the Pacific Region 2.81%
● India's rank in Tourist Arrivals to Asia & the Pacific Region 11
● Share of India in Tourism Receipts (US $ terms) of Asia & the Pacific Region 5.14%
● India's rank in Tourism Receipts of Asia & the Pacific Region 8
P : Provisional
#: Advance Estimates
Important Facts About Tourism, 2013
(III) Asia & the Pacific Region
Annual Growth Rate
(IV) India's Position in World
(V) India's Position in Asia & the Pacific Region
● No. of Foreign Tourist Arrivals in India 6.97 Million
Annual Growth Rate 5.9%
● No. of Indian Nationals Departures from India 16.63 Million
Annual Growth Rate 11.4%
● No. of Domestic Tourist Visits to all States/UTs
Annual Growth Rate
● Foreign Exchange Earnings from Tourism
i) In INR terms ` 107671
Annual Growth Rate
ii) In US$ terms US$
Annual Growth Rate
(I) India
9.6%
(#)
14.0%
1145 Million
Crore
4.0%
(#)18.44 Billion
India Tourism Statistics at a Glance 20131
India Tourism Statistics at a Glance 20132
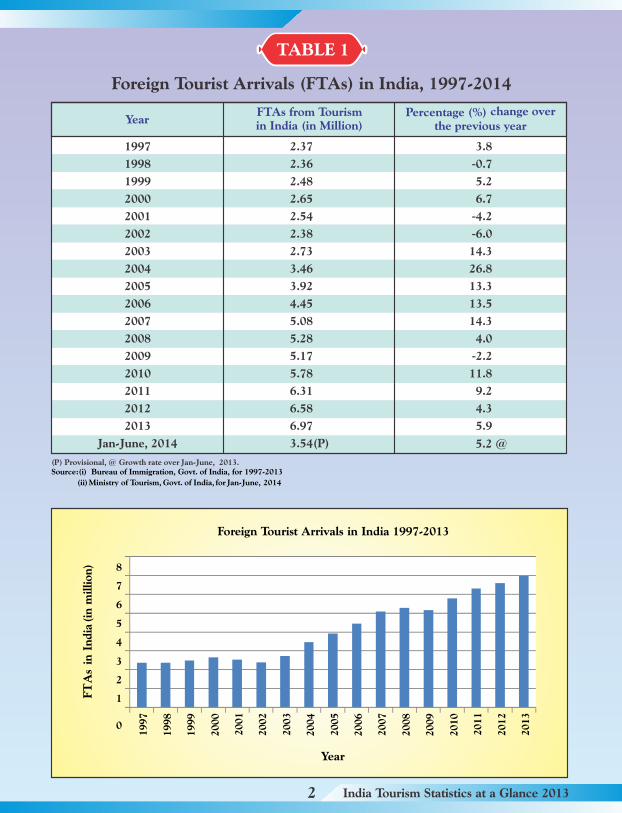
TABLE 1
Foreign Tourist Arrivals (FTAs) in India, 1997-2014
(P) Provisional, @ Growth rate over Jan-June, 2013.Source:(i) Bureau of Immigration, Govt. of India, for 1997-2013
(ii) Ministry of Tourism, Govt. of India, for Jan-June, 2014
0
1
2
3
4
5
6
7
8
1997
1998
1999
2000
2001
2002
2003
2004
2005
2006
2007
2008
2009
2010
2011
2012
2013
FT
As
in I
ndia
(in
million
)
Year
Foreign Tourist Arrivals in India 1997-2013
Percentage (%) change over the previous year
YearFTAs from Tourism in India (in Million)
1997
1998
1999
2000
2001
2002
2003
2004
2005
2006
2007
2008
2009
2010
2011
2012
2013
Jan-June, 2014
2.37
2.36
2.48
2.65
2.54
2.38
2.73
3.46
3.92
4.45
5.08
5.28
5.17
5.78
6.31
6.58
6.97
3.54(P)
3.8
-0.7
5.2
6.7
-4.2
-6.0
14.3
26.8
13.3
13.5
14.3
4.0
-2.2
11.8
9.2
4.3
5.9
5.2 @
India Tourism Statistics at a Glance 20133
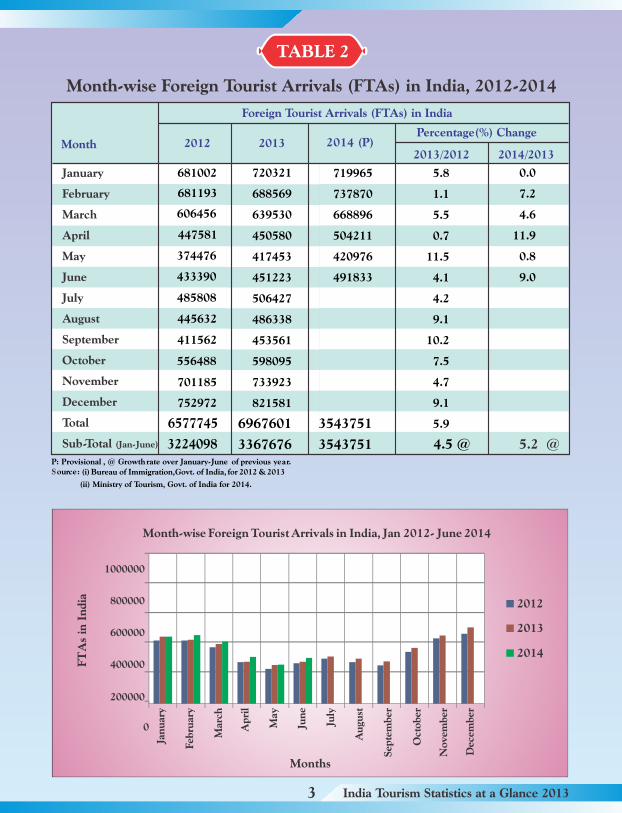
Source: (i) Bureau of Immigration, Govt. of India, for 2012 & 2013
(ii) Ministry of Tourism, Govt. of India for 2014.
P: Provisional , @ Growth rate over January-June of previous year.
TABLE 2
Month-wise Foreign Tourist Arrivals (FTAs) in India, 2012-2014
2012
2013
2014
0
200000
400000
600000
800000
1000000
FT
As
in I
ndia
Jan
uar
y
Feb
ruar
y
Mar
ch
Apri
l
May
Jun
e
Au
gust
Sep
tem
ber
Oct
ober
Novem
ber
Dec
ember
Month-wise Foreign Tourist Arrivals in India, Jan 2012- June 2014
July
2013/2012 2014/2013
Foreign Tourist Arrivals (FTAs) in India
2012 2013 2014 (P)Percentage(%) Change
681002
681193
606456
447581
374476
433390
485808
445632
411562
556488
701185
752972
6577745
3224098
720321
688569
639530
450580
417453
451223
506427
486338
453561
598095
733923
821581
6967601
3367676
719965
737870
668896
504211
420976
491833
3543751
3543751
0.0
7.2
4.6
11.9
0.8
9.0
5.2 @
January
February
March
April
May
June
July
August
September
October
November
December
Total
Sub-Total (Jan-June)
Month
5.8
1.1
5.5
0.7
11.5
4.1
4.2
9.1
10.2
7.5
4.7
9.1
5.9
4.5 @
Months
India Tourism Statistics at a Glance 20134
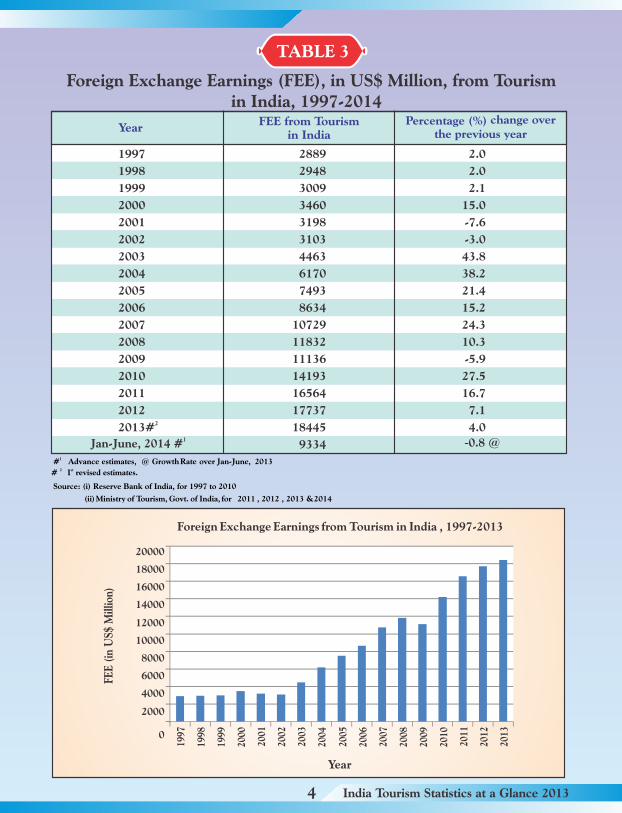
TABLE 3
Foreign Exchange Earnings (FEE), in US$ Million, from Tourism in India, 1997-2014
1# Advance estimates, @ Growth Rate over Jan-June, 20132 st# I revised estimates.
Source: (i) Reserve Bank of India, for 1997 to 2010
(ii) Ministry of Tourism, Govt. of India, for 2011 , 2012 , 2013 & 2014
Foreign Exchange Earnings from Tourism in India , 1997-2013
0
2000
4000
6000
8000
10000
12000
14000
16000
18000
20000
1997
1998
1999
2000
2001
2002
2003
2004
2005
2006
2007
2008
2009
2010
2011
2012
2013
FEE
(in
US$
Mill
ion)
Year
Percentage (%) change over the previous year
YearFEE from Tourism
in India
1997
1998
1999
2000
2001
2002
2003
2004
2005
2006
2007
2008
2009
2010
2011
201222013#
2889
2948
3009
3460
3198
3103
4463
6170
7493
8634
10729
11832
11136
14193
16564
17737
18445
9334
2.0
2.0
2.1
15.0
-7.6
-3.0
43.8
38.2
21.4
15.2
24.3
10.3
-5.9
27.5
16.7
7.1
4.0
-0.8 @1Jan-June, 2014 #
India Tourism Statistics at a Glance 20135
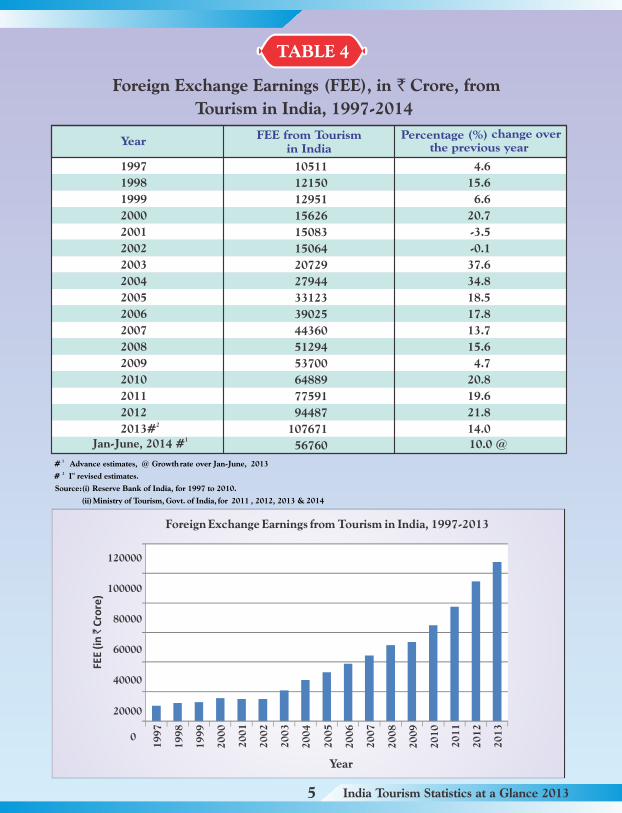
TABLE 4
Foreign Exchange Earnings (FEE), in ` Crore, from
Tourism in India, 1997-2014
# 1 Advance estimates, @ Growth rate over Jan-June, 20132 st# I revised estimates.
Source:(i) Reserve Bank of India, for 1997 to 2010.
(ii) Ministry of Tourism, Govt. of India, for 2011 , 2012, 2013 & 2014
Foreign Exchange Earnings from Tourism in India, 1997-2013
FEE(in `Crore)
0
20000
40000
60000
80000
100000
120000
19
97
19
98
19
99
20
00
20
01
20
02
20
03
20
04
20
05
20
06
20
07
20
08
20
09
20
10
20
11
20
12
20
13
Year
Percentage (%) change over the previous year
YearFEE from Tourism
in India
1997
1998
1999
2000
2001
2002
2003
2004
2005
2006
2007
2008
2009
2010
2011
201222013#
10511
12150
12951
15626
15083
15064
20729
27944
33123
39025
44360
51294
53700
64889
77591
94487
107671
56760
4.6
15.6
6.6
20.7
-3.5
-0.1
37.6
34.8
18.5
17.8
13.7
15.6
4.7
20.8
19.6
21.8
14.0
10.0 @1Jan-June, 2014 #
India Tourism Statistics at a Glance 20136
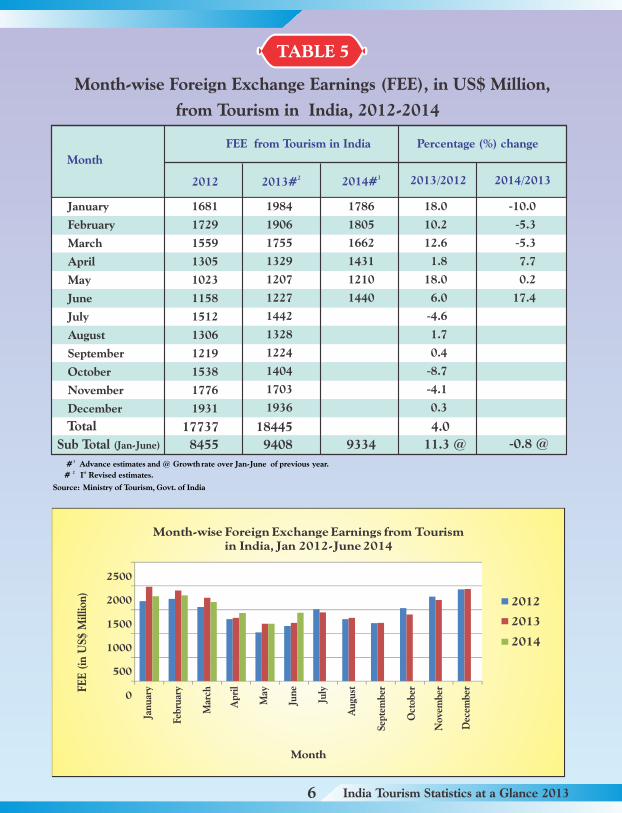
TABLE 5
Month-wise Foreign Exchange Earnings (FEE), in US$ Million,
from Tourism in India, 2012-2014
# 1 Advance estimates and @ Growth rate over Jan-June of previous year.2 st# I Revised estimates.
Source: Ministry of Tourism, Govt. of India
FE
E (
in U
S$ M
illio
n)
Month
0
2012
2013
2014
500
1000
1500
2000
2500
Jan
uar
y
Febr
uar
y
Mar
ch
Apr
il
May
Jun
e
Au
gust
Sept
embe
r
Oct
ober
Nov
embe
r
Dec
embe
r
July
Month-wise Foreign Exchange Earnings from Tourism in India, Jan 2012-June 2014
Month
FEE from Tourism in India Percentage (%) change
2012 22013#12014# 2013/2012 2014/2013
January
February
March
April
May
June
July
August
September
October
November
December
Sub Total (Jan-June)
1681
1729
1559
1305
1023
1158
1512
1306
1219
1538
1776
1931
1984
1906
1755
1329
1207
1227
1442
1328
1224
1404
1703
1936
1786
1805
1662
1431
1210
1440
18.0
10.2
12.6
1.8
18.0
6.0
-4.6
1.7
0.4
-8.7
-4.1
0.3
-10.0
-5.3
-5.3
7.7
0.2
17.4
-0.8 @9334
Total 17737
8455
18445
9408
4.0
11.3 @
India Tourism Statistics at a Glance 20137
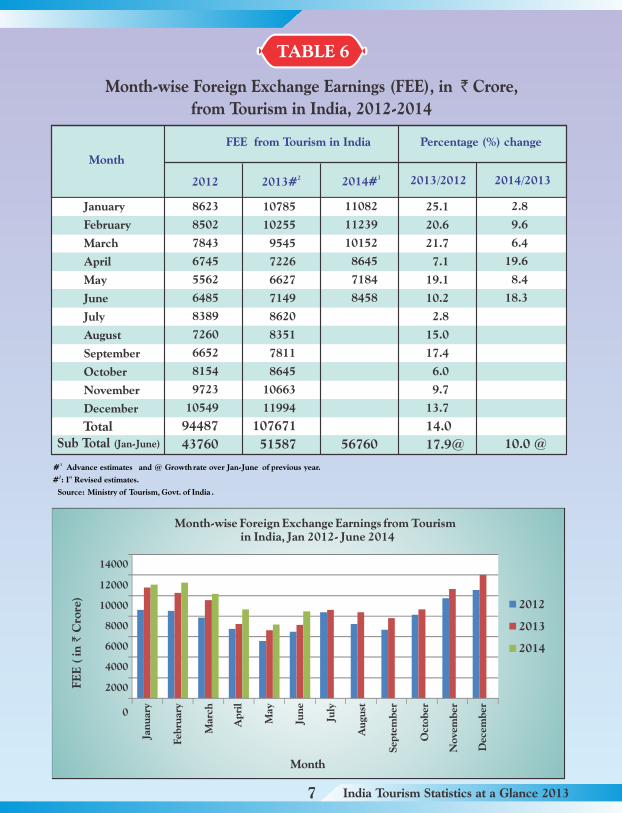
TABLE 6
Month-wise Foreign Exchange Earnings (FEE), in ` Crore,
from Tourism in India, 2012-2014
# 1 Advance estimates and @ Growth rate over Jan-June of previous year.2 st# : I Revised estimates.
Source: Ministry of Tourism, Govt. of India .
FE
E (
in `
Cro
re)
Month
Month-wise Foreign Exchange Earnings from Tourism in India, Jan 2012- June 2014
0
2000
4000
6000
8000
10000
12000
14000
2012
2013
2014
Jan
uar
y
Feb
ruar
y
Mar
ch
Apri
l
May
Jun
e
Au
gust
Sep
tem
ber
Oct
ober
Novem
ber
Dec
ember
July
Month
FEE from Tourism in India Percentage (%) change
2012 22013#12014# 2013/2012 2014/2013
January
February
March
April
May
June
July
August
September
October
November
December
Sub Total (Jan-June)
8623
8502
7843
6745
5562
6485
8389
7260
6652
8154
9723
10549
10785
10255
9545
7226
6627
7149
8620
8351
7811
8645
10663
11994
11082
11239
10152
8645
7184
8458
25.1
20.6
21.7
7.1
19.1
10.2
2.8
15.0
17.4
6.0
9.7
13.7
2.8
9.6
6.4
19.6
8.4
18.3
10.0 @56760
Total 94487
43760
107671
51587
14.0
17.9@
India Tourism Statistics at a Glance 20138
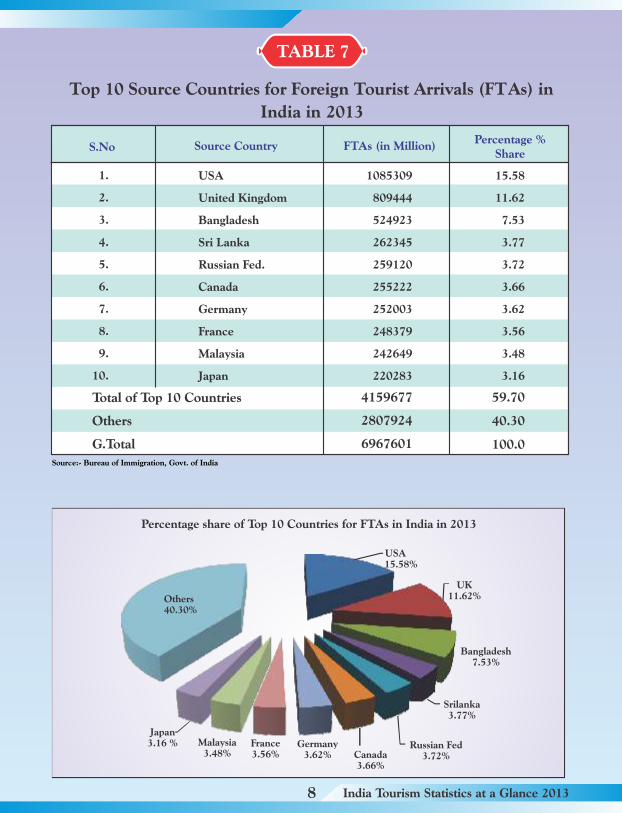
TABLE 7
Top 10 Source Countries for Foreign Tourist Arrivals (FTAs) in
India in 2013
Source:- Bureau of Immigration, Govt. of India
Percentage share of Top 10 Countries for FTAs in India in 2013
S.No Source CountryPercentage %
ShareFTAs (in Million)
1.
2.
3.
4.
5.
6.
7.
8.
9.
10.
USA
United Kingdom
Bangladesh
Sri Lanka
Russian Fed.
Canada
Germany
France
Malaysia
Japan
1085309
809444
524923
262345
259120
255222
252003
248379
242649
220283
15.58
11.62
7.53
3.77
3.72
3.66
3.62
3.56
3.48
3.16
Total of Top 10 Countries
Others
G.Total
4159677
2807924
6967601
59.70
40.30
100.0
Others40.30%
Japan3.16 % Malaysia
3.48%France3.56%
Germany3.62% Canada
3.66%
Russian Fed3.72%
Srilanka3.77%
Bangladesh7.53%
UK11.62%
USA 15.58%
India Tourism Statistics at a Glance 20139
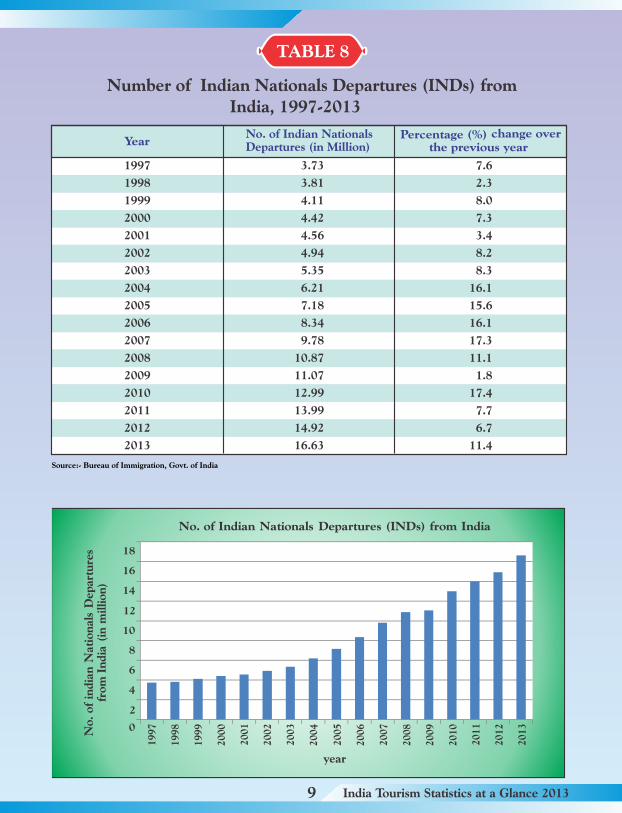
TABLE 8
Number of Indian Nationals Departures (INDs) from India, 1997-2013
Source:- Bureau of Immigration, Govt. of India
No.
of
india
n N
ati
on
als
Dep
artu
res
from
In
dia
(in
million
)
No. of Indian Nationals Departures (INDs) from India
year
0
2
4
6
8
10
12
14
16
18
19
97
19
98
19
99
20
00
20
01
20
02
20
03
20
04
20
05
20
06
20
07
20
08
20
09
20
10
20
11
20
12
20
13
Percentage (%) change over the previous yearYear
1997
1998
1999
2000
2001
2002
2003
2004
2005
2006
2007
2008
2009
2010
2011
2012
2013
3.73
3.81
4.11
4.42
4.56
4.94
5.35
6.21
7.18
8.34
9.78
10.87
11.07
12.99
13.99
14.92
16.63
7.6
2.3
8.0
7.3
3.4
8.2
8.3
16.1
15.6
16.1
17.3
11.1
1.8
17.4
7.7
6.7
11.4
No. of Indian Nationals Departures (in Million)
India Tourism Statistics at a Glance 201310
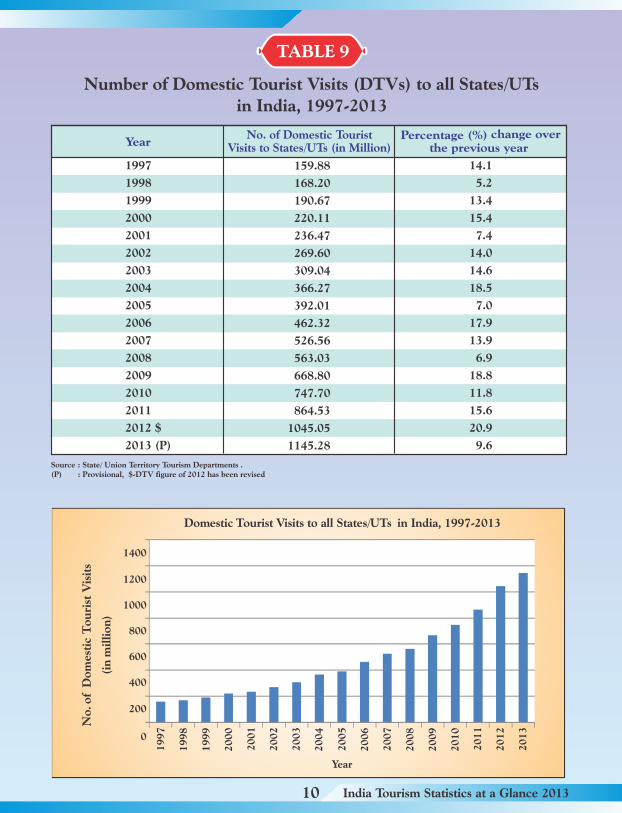
TABLE 9
Number of Domestic Tourist Visits (DTVs) to all States/UTs in India, 1997-2013
Source : State/ Union Territory Tourism Departments . (P) : Provisional, $-DTV figure of 2012 has been revised
Domestic Tourist Visits to all States/UTs in India, 1997-2013
Year
No. o
f D
om
esti
c T
ou
rist
Vis
its
(in
mil
lion
)
0
200
400
600
800
1000
1200
1400
19
97
19
98
19
99
20
00
20
01
20
02
20
03
20
04
20
05
20
06
20
07
20
08
20
09
20
10
20
11
20
12
20
13
Percentage (%) change over the previous yearYear
1997
1998
1999
2000
2001
2002
2003
2004
2005
2006
2007
2008
2009
2010
2011
2012 $
2013 (P)
No. of Domestic Tourist Visits to States/UTs (in Million)
159.88
168.20
190.67
220.11
236.47
269.60
309.04
366.27
392.01
462.32
526.56
563.03
668.80
747.70
864.53
1045.05
1145.28
14.1
5.2
13.4
15.4
7.4
14.0
14.6
18.5
7.0
17.9
13.9
6.9
18.8
11.8
15.6
20.9
9.6
India Tourism Statistics at a Glance 201311
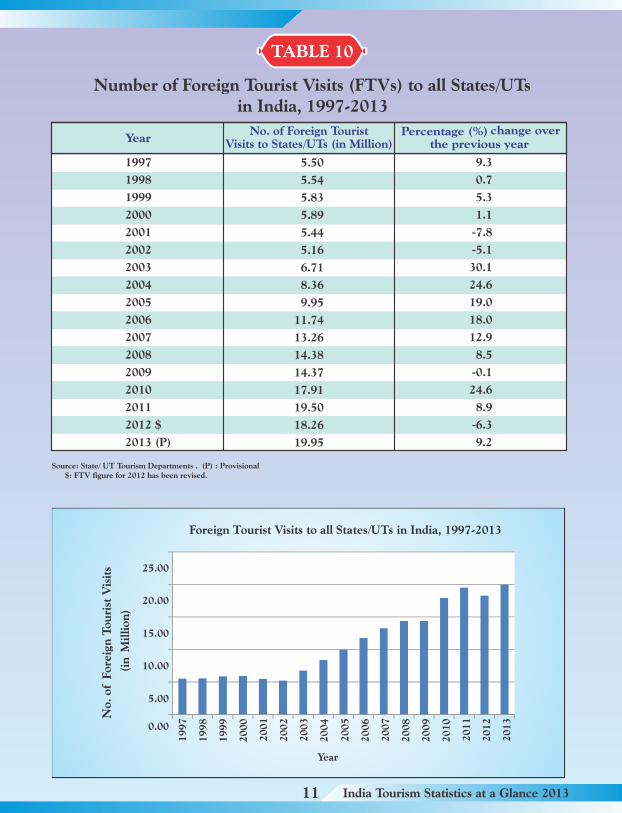
TABLE 10
Number of Foreign Tourist Visits (FTVs) to all States/UTs in India, 1997-2013
Source: State/ UT Tourism Departments . (P) : Provisional $: FTV figure for 2012 has been revised.
No. of
Fore
ign
Tou
rist
Vis
its
(i
n M
illi
on
)
Year
Foreign Tourist Visits to all States/UTs in India, 1997-2013
0.00
5.00
10.00
15.00
20.00
25.00
19
97
19
98
19
99
20
00
20
01
20
02
20
03
20
04
20
05
20
06
20
07
20
08
20
09
20
10
20
11
20
12
20
13
Percentage (%) change over the previous yearYear
1997
1998
1999
2000
2001
2002
2003
2004
2005
2006
2007
2008
2009
2010
2011
2012 $
2013 (P)
No. of Foreign Tourist Visits to States/UTs (in Million)
5.50
5.54
5.83
5.89
5.44
5.16
6.71
8.36
9.95
11.74
13.26
14.38
14.37
17.91
19.50
18.26
19.95
9.3
0.7
5.3
1.1
-7.8
-5.1
30.1
24.6
19.0
18.0
12.9
8.5
-0.1
24.6
8.9
-6.3
9.2
India Tourism Statistics at a Glance 201312
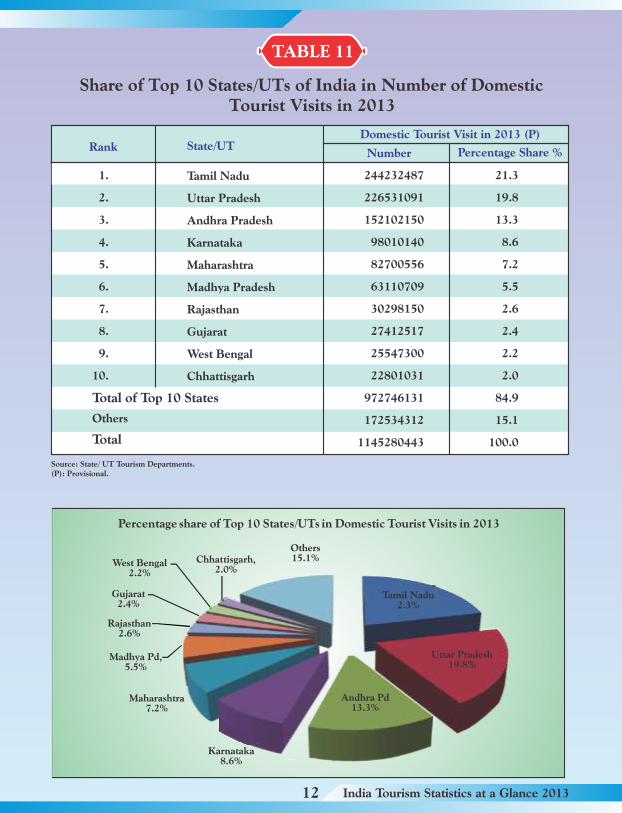
TABLE 11
Share of Top 10 States/UTs of India in Number of Domestic Tourist Visits in 2013
Source: State/ UT Tourism Departments.(P): Provisional.
Percentage share of Top 10 States/UTs in Domestic Tourist Visits in 2013
Rank State/UT
1.
2.
3.
4.
5.
6.
7.
8.
9.
10.
Tamil Nadu
Uttar Pradesh
Andhra Pradesh
Karnataka
Maharashtra
Madhya Pradesh
Rajasthan
Gujarat
West Bengal
Chhattisgarh
Percentage Share %Number
Domestic Tourist Visit in 2013 (P)
Total of Top 10 States
Others
Total
21.3
19.8
13.3
8.6
7.2
5.5
2.6
2.4
2.2
2.0
84.9
15.1
100.0
244232487
226531091
152102150
98010140
82700556
63110709
30298150
27412517
25547300
22801031
972746131
172534312
1145280443
Chhattisgarh,2.0%
Others15.1%West Bengal
2.2%
Gujarat2.4%
Rajasthan2.6%
Madhya Pd, 5.5%
Maharashtra7.2%
Karnataka8.6%
Andhra Pd13.3%
Uttar Pradesh19.8%
Tamil Nadu2.3%
India Tourism Statistics at a Glance 201313
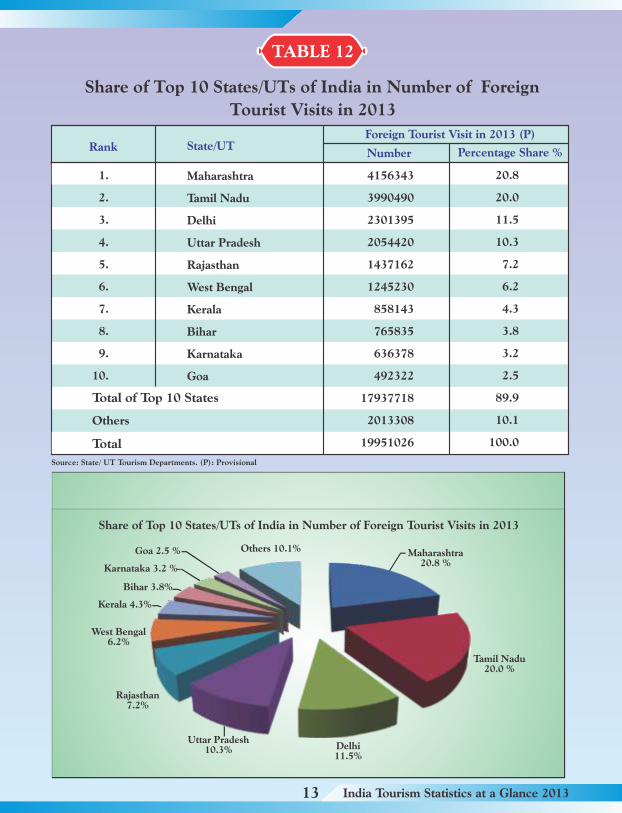
TABLE 12
Share of Top 10 States/UTs of India in Number of Foreign
Tourist Visits in 2013
Source: State/ UT Tourism Departments. (P): Provisional
Rank State/UT
1.
2.
3.
4.
5.
6.
7.
8.
9.
10.
Percentage Share %Number
Foreign Tourist Visit in 2013 (P)
Maharashtra
Tamil Nadu
Delhi
Uttar Pradesh
Rajasthan
West Bengal
Kerala
Bihar
Karnataka
Goa
4156343
3990490
2301395
2054420
1437162
1245230
858143
765835
636378
492322
17937718
2013308
19951026
20.8
20.0
11.5
10.3
7.2
6.2
4.3
3.8
3.2
2.5
89.9
10.1
100.0
Total of Top 10 States
Others
Total
Others 10.1%Goa 2.5 %
Karnataka 3.2 %
Bihar 3.8%
Kerala 4.3%
West Bengal6.2%
Rajasthan7.2%
Uttar Pradesh10.3% Delhi
11.5%
Tamil Nadu20.0 %
Maharashtra20.8 %
Share of Top 10 States/UTs of India in Number of Foreign Tourist Visits in 2013
India Tourism Statistics at a Glance 201314
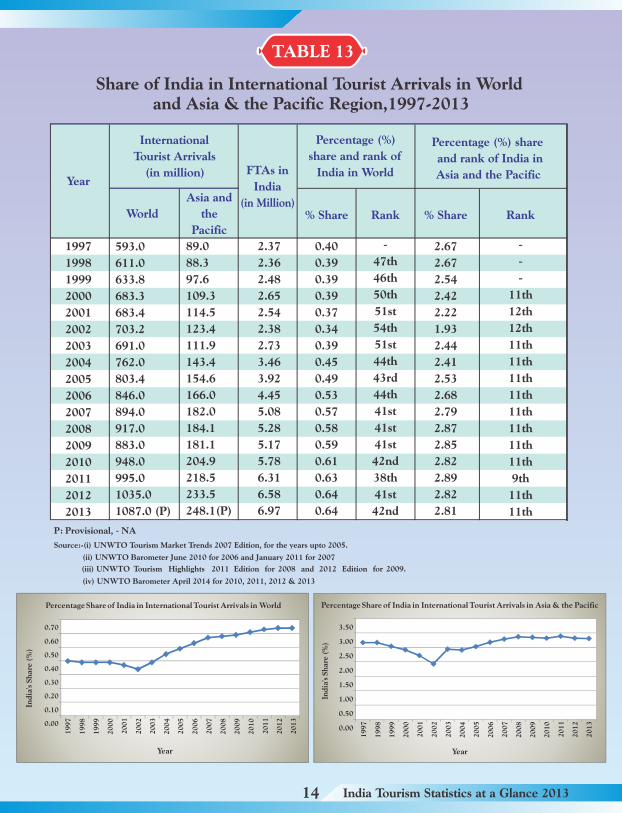
TABLE 13
Share of India in International Tourist Arrivals in World and Asia & the Pacific Region,1997-2013
World
Asia and
the
Pacific% Share Rank % Share Rank
Year
International
Tourist Arrivals
(in million) FTAs in
India
(in Million)
Percentage (%)
share and rank of
India in World
Percentage (%) share
and rank of India in
Asia and the Pacific
1997
1998
1999
2000
2001
2002
2003
2004
2005
2006
2007
2008
2009
2010
2011
2012
2013
593.0
611.0
633.8
683.3
683.4
703.2
691.0
762.0
803.4
846.0
894.0
917.0
883.0
948.0
995.0
1035.0
1087.0 (P)
89.0
88.3
97.6
109.3
114.5
123.4
111.9
143.4
154.6
166.0
182.0
184.1
181.1
204.9
218.5
233.5
248.1(P)
2.37
2.36
2.48
2.65
2.54
2.38
2.73
3.46
3.92
4.45
5.08
5.28
5.17
5.78
6.31
6.58
6.97
0.40
0.39
0.39
0.39
0.37
0.34
0.39
0.45
0.49
0.53
0.57
0.58
0.59
0.61
0.63
0.64
0.64
-
47th
46th
50th
51st
54th
51st
44th
43rd
44th
41st
41st
41st
42nd
38th
41st
42nd
2.67
2.67
2.54
2.42
2.22
1.93
2.44
2.41
2.53
2.68
2.79
2.87
2.85
2.82
2.89
2.82
2.81
-
-
-
11th
12th
12th
11th
11th
11th
11th
11th
11th
11th
11th
9th
11th
11th
P: Provisional, - NA
(iv) UNWTO Barometer April 2014 for 2010, 2011, 2012 & 2013
Source:-(i) UNWTO Tourism Market Trends 2007 Edition, for the years upto 2005.
(ii) UNWTO Barometer June 2010 for 2006 and January 2011 for 2007
(iii) UNWTO Tourism Highlights 2011 Edition for 2008 and 2012 Edition for 2009.
0.00
0.10
0.20
0.30
0.40
0.50
0.60
0.70
Ind
ia's
Sh
are (
%)
Year
Percentage Share of India in International Tourist Arrivals in World
19
97
19
98
19
99
20
00
20
01
20
02
20
03
20
04
20
05
20
06
20
07
20
08
20
09
20
10
20
11
20
12
20
13
0.00
0.50
1.00
1.50
2.00
2.50
3.00
3.50
Ind
ia's
Sh
are (
%)
Percentage Share of India in International Tourist Arrivals in Asia & the Pacific
Year
19
97
19
98
19
99
20
00
20
01
20
02
20
03
20
04
20
05
20
06
20
07
20
08
20
09
20
10
20
11
20
12
20
13
India Tourism Statistics at a Glance 201315
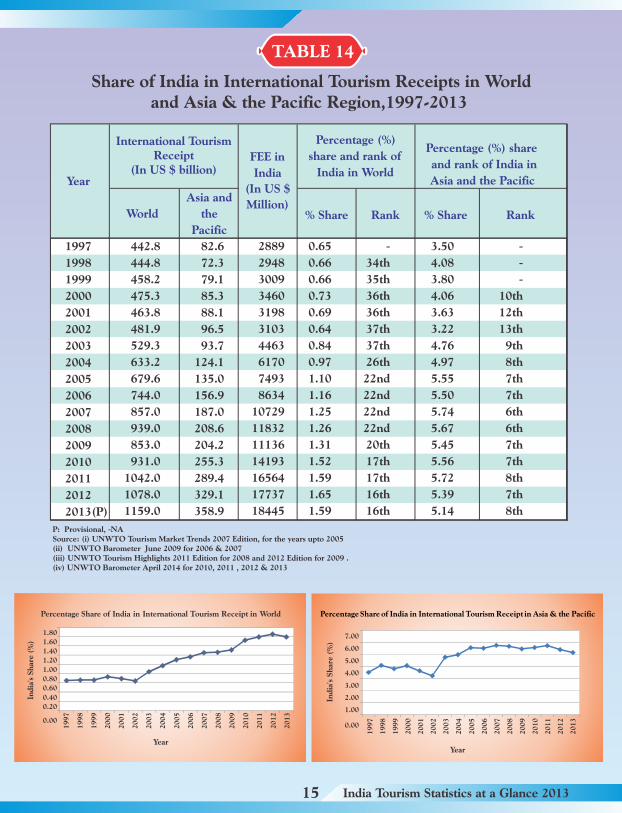
TABLE 14
Share of India in International Tourism Receipts in World and Asia & the Pacific Region,1997-2013
World
Asia and
the
Pacific% Share Rank % Share Rank
Year
FEE in
India
(In US $
Million)
Percentage (%)
share and rank of
India in World
Percentage (%) share
and rank of India in
Asia and the Pacific
1997
1998
1999
2000
2001
2002
2003
2004
2005
2006
2007
2008
2009
2010
2011
2012
2013(P)
International Tourism Receipt
(In US $ billion)
442.8
444.8
458.2
475.3
463.8
481.9
529.3
633.2
679.6
744.0
857.0
939.0
853.0
931.0
1042.0
1078.0
1159.0
82.6
72.3
79.1
85.3
88.1
96.5
93.7
124.1
135.0
156.9
187.0
208.6
204.2
255.3
289.4
329.1
358.9
2889 0.65 - 3.50 -
2948 0.66 34th 4.08 -
3009 0.66 35th 3.80 -
3460 0.73 36th 4.06 10th
3198 0.69 36th 3.63 12th
3103 0.64 37th 3.22 13th
4463 0.84 37th 4.76 9th
6170 0.97 26th 4.97 8th
7493 1.10 22nd 5.55 7th
8634 1.16 22nd 5.50 7th
10729 1.25 22nd 5.74 6th
11832 1.26 22nd 5.67 6th
11136 1.31 20th 5.45 7th
14193 1.52 17th 5.56 7th
16564 1.59 17th 5.72 8th
17737 1.65 16th 5.39 7th
18445 1.59 16th 5.14 8th
P: Provisional, -NASource: (i) UNWTO Tourism Market Trends 2007 Edition, for the years upto 2005(ii) UNWTO Barometer June 2009 for 2006 & 2007 (iii) UNWTO Tourism Highlights 2011 Edition for 2008 and 2012 Edition for 2009 . (iv) UNWTO Barometer April 2014 for 2010, 2011 , 2012 & 2013
Year
India
's S
har
e (%
)
Percentage Share of India in International Tourism Receipt in World
Year
0.00
0.20
0.40
0.60
0.80
1.00
1.20
1.40
1.60
1.80
19
97
19
98
19
99
20
00
20
01
20
02
20
03
20
04
20
05
20
06
20
07
20
08
20
09
20
10
20
11
20
12
20
13
India
's S
hare
(%
)
Percentage Share of India in International Tourism Receipt in Asia & the Pacific
19
97
19
98
19
99
20
00
20
01
20
02
20
03
20
04
20
05
20
06
20
07
20
08
20
09
20
10
20
11
20
12
20
13
15
0.00
1.00
2.00
3.00
4.00
5.00
6.00
7.00
India Tourism Statistics at a Glance 201316
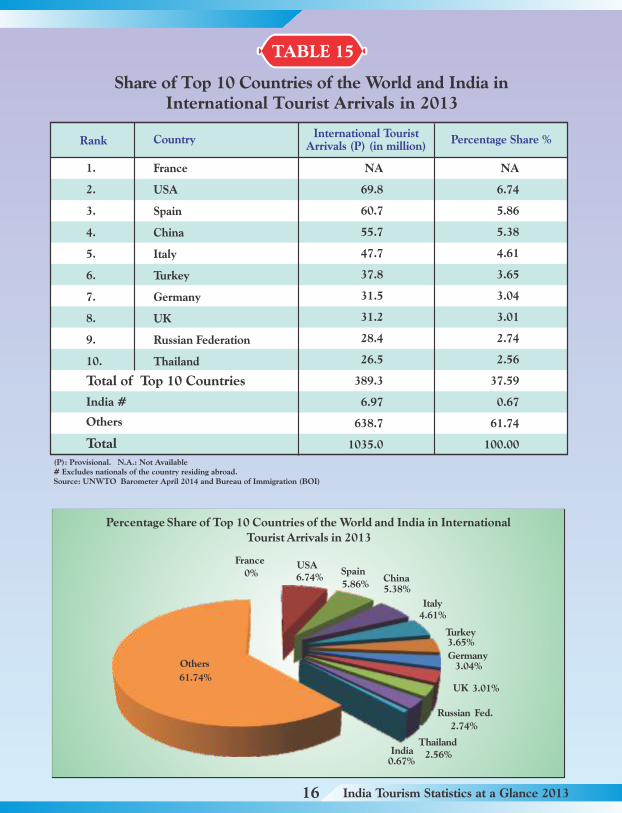
Share of Top 10 Countries of the World and India in International Tourist Arrivals in 2013
TABLE 15
Rank Country Percentage Share %
1.
2.
3.
4.
5.
6.
7.
8.
9.
10.
International Tourist Arrivals (P) (in million)
France
USA
Spain
China
Italy
Turkey
Germany
UK
Russian Federation
Thailand
NA
69.8
60.7
55.7
47.7
37.8
31.5
31.2
28.4
26.5
389.3
6.97
638.7
1035.0
NA
6.74
5.86
5.38
4.61
3.65
3.04
3.01
2.74
2.56
37.59
0.67
61.74
100.00
(P): Provisional. N.A.: Not Available # Excludes nationals of the country residing abroad.Source: UNWTO Barometer April 2014 and Bureau of Immigration (BOI)
Percentage Share of Top 10 Countries of the World and India in International
Tourist Arrivals in 2013
France
0%USA6.74%
Spain
5.86%China5.38%
Italy4.61%
Turkey3.65%
Germany3.04%
UK 3.01%
Russian Fed.
2.74%
Thailand2.56%India
0.67%
Others
61.74%
Total of Top 10 Countries
India #
Others
Total
India Tourism Statistics at a Glance 201317
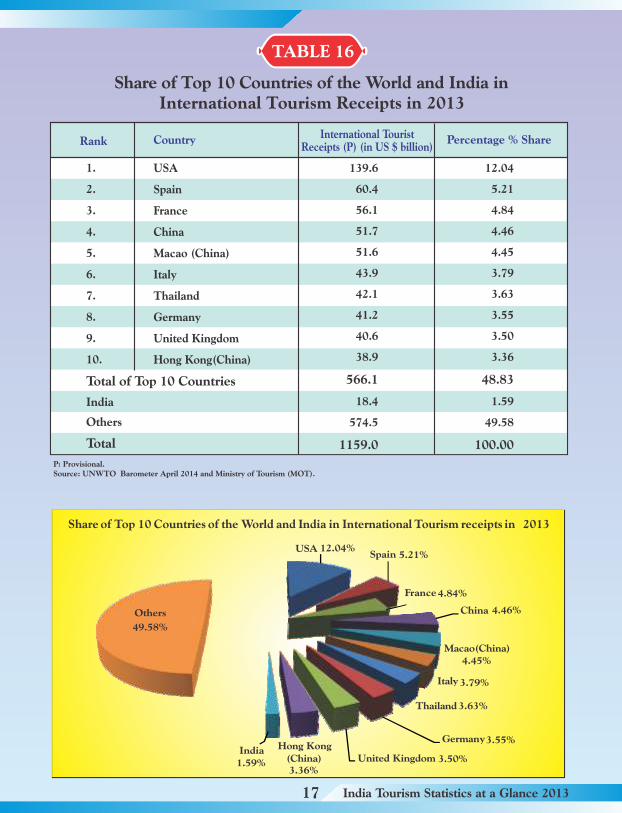
TABLE 16
Share of Top 10 Countries of the World and India in International Tourism Receipts in 2013
Rank Country Percentage % Share
1.
2.
3.
4.
5.
6.
7.
8.
9.
10.
International TouristReceipts (P) (in US $ billion)
USA
Spain
France
China
Macao (China)
Italy
Thailand
Germany
United Kingdom
Hong Kong(China)
139.6
60.4
56.1
51.7
51.6
43.9
42.1
41.2
40.6
38.9
566.1
18.4
574.5
1159.0
12.04
5.21
4.84
4.46
4.45
3.79
3.63
3.55
3.50
3.36
48.83
1.59
49.58
100.00
P: Provisional. Source: UNWTO Barometer April 2014 and Ministry of Tourism (MOT).
Share of Top 10 Countries of the World and India in International Tourism receipts in 2013
USA 12.04%Spain 5.21%
France4.84%
China 4.46%
Macao(China)4.45%
Italy 3.79%
Thailand3.63%
Germany3.55%
United Kingdom 3.50%
Hong Kong
(China)3.36%
India 1.59%
Others
49.58%
Total of Top 10 Countries
India
Others
Total
India Tourism Statistics at a Glance 201318
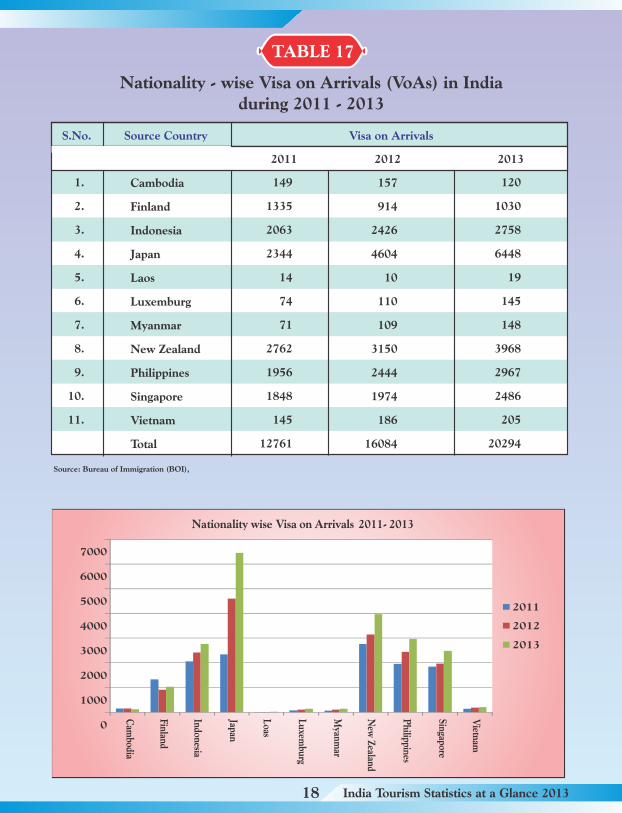
TABLE 17
Nationality - wise Visa on Arrivals (VoAs) in India during 2011 - 2013
1.
2.
3.
4.
5.
6.
7.
8.
9.
10.
11.
Cambodia
Finland
Indonesia
Japan
Laos
Luxemburg
Myanmar
New Zealand
Philippines
Singapore
Vietnam
Total
149
1335
2063
2344
14
74
71
2762
1956
1848
145
12761
157
914
2426
4604
10
110
109
3150
2444
1974
186
16084
120
1030
2758
6448
19
145
148
3968
2967
2486
205
20294
S.No. Source Country Visa on Arrivals
Source: Bureau of Immigration (BOI),
0
1000
2000
3000
4000
5000
6000
7000
Nationality wise Visa on Arrivals 2011- 2013
2011
2012
2013
Cam
bodia
Finland
Indonesia
Japan
Loas
Luxem
burg
Myanm
ar
New
Zealand
Philippines
Singapore
Vietnam
2011 2012 2013
India Tourism Statistics at a Glance 201319
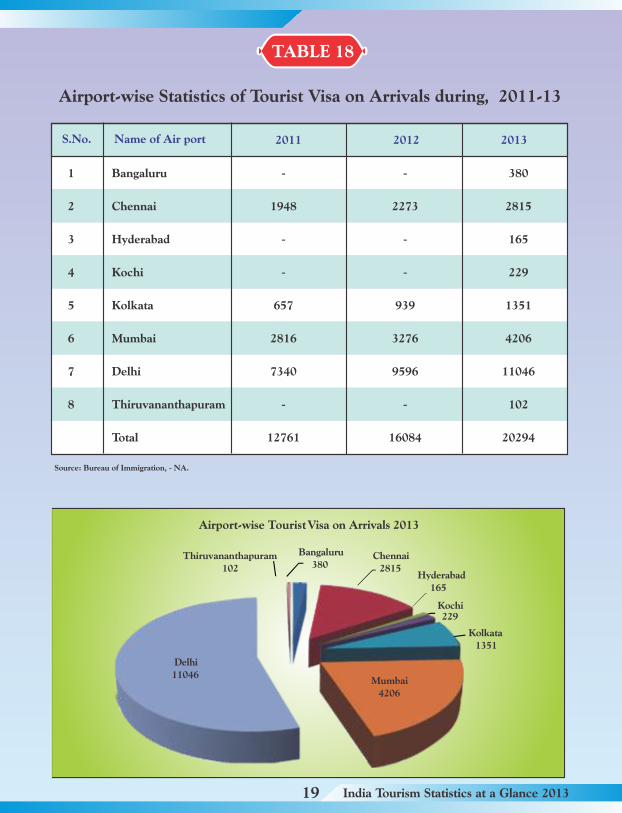
TABLE 18
Airport-wise Statistics of Tourist Visa on Arrivals during, 2011-13
1 Bangaluru - - 380
2 Chennai 1948 2273 2815
3 Hyderabad - - 165
4 Kochi - - 229
5 Kolkata 657 939 1351
6 Mumbai 2816 3276 4206
7 Delhi 7340 9596 11046
8 Thiruvananthapuram - - 102
Total 12761 16084 20294
Source: Bureau of Immigration, - NA.
Airport-wise Tourist Visa on Arrivals 2013
Bangaluru
380Chennai
2815Hyderabad
165
Kochi229
Kolkata
1351
Thiruvananthapuram
102
Delhi
11046Mumbai
4206
2011 2012 2013S.No. Name of Air port
India Tourism Statistics at a Glance 201320
TABLE 19
A
1
B
1
2
3
4
5
6
7
8
9
10
11
12
13
14
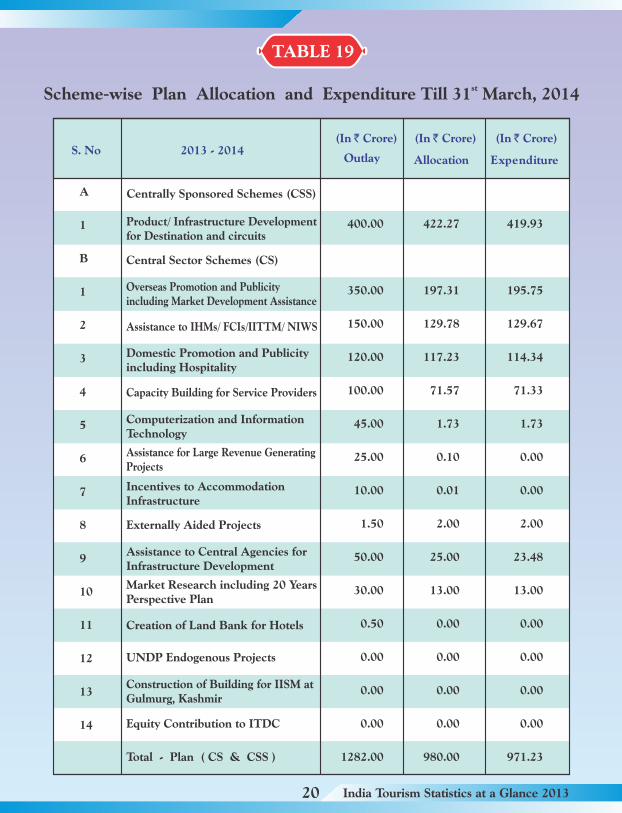
Creation of Land Bank for Hotels
UNDP Endogenous Projects
Construction of Building for IISM at Gulmurg, Kashmir
Equity Contribution to ITDC
Total - Plan ( CS & CSS )
Centrally Sponsored Schemes (CSS)
Product/ Infrastructure Development for Destination and circuits
Central Sector Schemes (CS)
Overseas Promotion and Publicity including Market Development Assistance
Assistance to IHMs/ FCIs/IITTM/ NIWS
Domestic Promotion and Publicity including Hospitality
Capacity Building for Service Providers
Computerization and Information Technology
Assistance for Large Revenue Generating Projects
Incentives to Accommodation Infrastructure
Externally Aided Projects
Assistance to Central Agencies for Infrastructure Development
Market Research including 20 Years Perspective Plan
422.27
197.31
129.78
117.23
71.57
1.73
0.10
0.01
2.00
25.00
13.00
0.00
0.00
0.00
0.00
980.00
419.93
195.75
129.67
114.34
71.33
1.73
0.00
0.00
2.00
23.48
13.00
0.00
0.00
0.00
0.00
971.23
400.00
350.00
150.00
120.00
100.00
45.00
25.00
10.00
1.50
50.00
30.00
0.50
0.00
0.00
0.00
1282.00
st Scheme-wise Plan Allocation and Expenditure Till 31 March, 2014
2013 - 2014 Expenditure
(In ̀ Crore)(In ̀ Crore)
Outlay Allocation
(In ̀ Crore)S. No
India Tourism Statistics at a Glance 201321
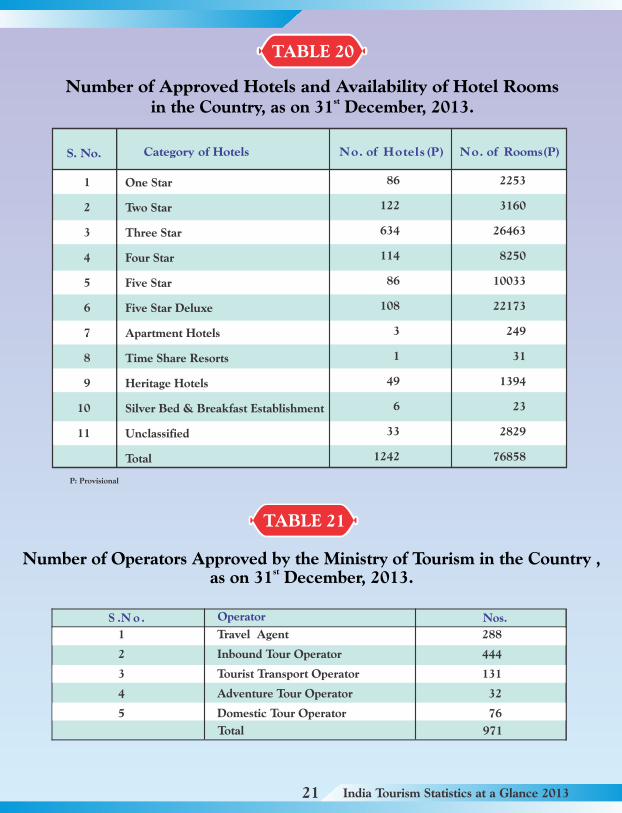
S. No. Category of Hotels No. of Hotels(P) No. of Rooms(P)
Number of Approved Hotels and Availability of Hotel Rooms stin the Country, as on 31 December, 2013.
S .N o . Operator Nos.
Number of Operators Approved by the Ministry of Tourism in the Country , stas on 31 December, 2013.
TABLE 20
TABLE 21
P: Provisional
Total 971
One Star
Two Star
Three Star
Four Star
Five Star
Five Star Deluxe
Apartment Hotels
Time Share Resorts
Heritage Hotels
Silver Bed & Breakfast Establishment
Unclassified
Total
1
2
3
4
5
6
7
8
9
10
11
86
122
634
114
86
108
3
1
49
6
33
1242
2253
3160
26463
8250
10033
22173
249
31
1394
23
2829
76858
1 Travel Agent 288
2 Inbound Tour Operator 444
3 Tourist Transport Operator 131
4 Adventure Tour Operator 32
5 Domestic Tour Operator 76
Incredible !ndia
www.tourism.gov.inwww.incredibleindia.orgMarket Research Division
Ministry of Tourism, Government of IndiaNew DelhiJuly - 2014
vrqY;!Hkkjr