Embed Size (px)
Citation preview
130
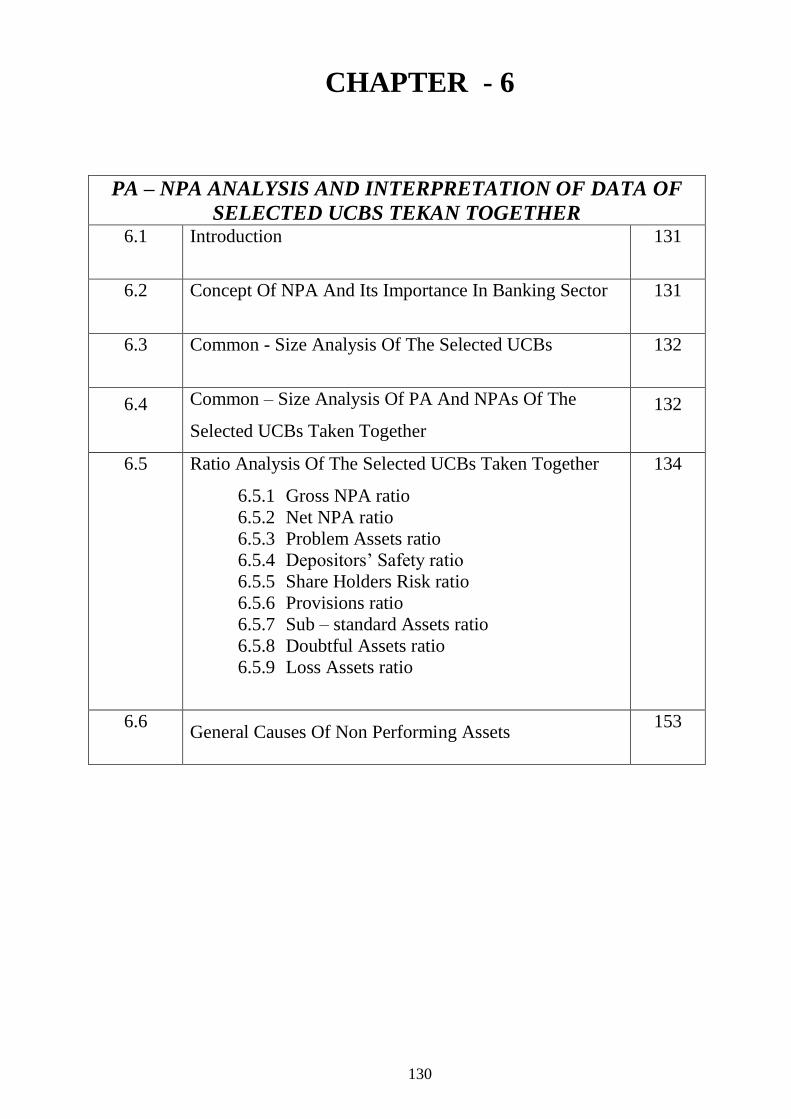
CHAPTER - 6
PA – NPA ANALYSIS AND INTERPRETATION OF DATA OF
SELECTED UCBS TEKAN TOGETHER 6.1 Introduction 131
6.2 Concept Of NPA And Its Importance In Banking Sector 131
6.3 Common - Size Analysis Of The Selected UCBs 132
6.4 Common – Size Analysis Of PA And NPAs Of The
Selected UCBs Taken Together
132
6.5 Ratio Analysis Of The Selected UCBs Taken Together
6.5.1 Gross NPA ratio
6.5.2 Net NPA ratio
6.5.3 Problem Assets ratio
6.5.4 Depositors‟ Safety ratio
6.5.5 Share Holders Risk ratio
6.5.6 Provisions ratio
6.5.7 Sub – standard Assets ratio
6.5.8 Doubtful Assets ratio
6.5.9 Loss Assets ratio
134
6.6 General Causes Of Non Performing Assets
153
131
CHAPTER - 6 PA – NPA ANALYSIS AND INTERPRETATION OF DATA OF
SELECTED UCBS TEKAN TOGETHER
6.1 INTRODUCTION:
In today‟s world of healthy competition where all business units and industries
are trying to survive in the market, the banking sector too can not be aloof from
competition in market. As liberalization and globalization has opened door for free
entry in any business, the co-operative sector of banking has to face competition from
not only nationalized or commercial banks but also from private financial instructions
and foreign banks. Two or three decades back, profit had a back seat and came as an
end product. They never consciously planned their business of banking from the profit
point of view. But today profit is a sign of vitality and success in a competitive
scenario. It ensures survival and growth and can eventually become the only parameter
for performance evaluation. Profit depends upon NPA provisions. Hence, for a banker,
NPA has become very significant.
In this chapter an attempt has been made to find out the importance of PA and
NPA in banking sector and to measure the level of NPA of banking sector using
accounting techniques of NPA analysis and statistical tools along with graphs and
charts.
6.2 CONCEPT OF NPA AND ITS IMPORTANCE IN BANKING SECTOR:
Guidelines issued by Reserve Bank of India regarding recognition, asset
classification and provisioning norms have compelled banks in India not to show true
financial picture in the balance sheet but also to take corrective steps for improving
their loan portfolio. With the adoption of these guidelines, banks are now fully vigilant
about quality of their loan assets and various steps are being taken by them to reduce
the NPAs. It is always better to follow the proper policy for appraisal, supervision and
follow – up of advances to avoid NPAs. However, risks attached to lending cannot be
completely eliminated. If certain advances are converted into NPAs, it is necessary to
take corrective steps to reduce them. Reduction in NPAs is necessary to improve
profitability.
132
6.3 COMMON - SIZE ANALYSIS OF THE SELECTED UCBs:
The entire picture of the PA and NPA of the selected UCBs under study has
been presented in the form of common – size statement for the period spreading from
2001-02 to 2008-09. An attempt to analyze PA and NPA of the selected UCBs with
the help of their common - size PA and NPA statement is made at this stage. Here the
figures of total advances have been taken as equal to 100 and the percentage of
individual items of PA and NPAs has been calculated. Common - size PA and NPA
statement has been presented in appendices 7.2 to 7.11
6.4 COMMON – SIZE ANALYSIS OF PA AND NPAs OF THE SELECTED
UCBs TAKEN TOGETHER:
Consolidated PA and NPAs of all the selected UCBs under study has been
presented in appendix 7.1. The appendix clearly indicates the ratio of PA and NPAs of
all the selected UCBs during the period of study. The proportion of each component of
the PA and NPAs statement has also been found out considering the total Advances as
100.
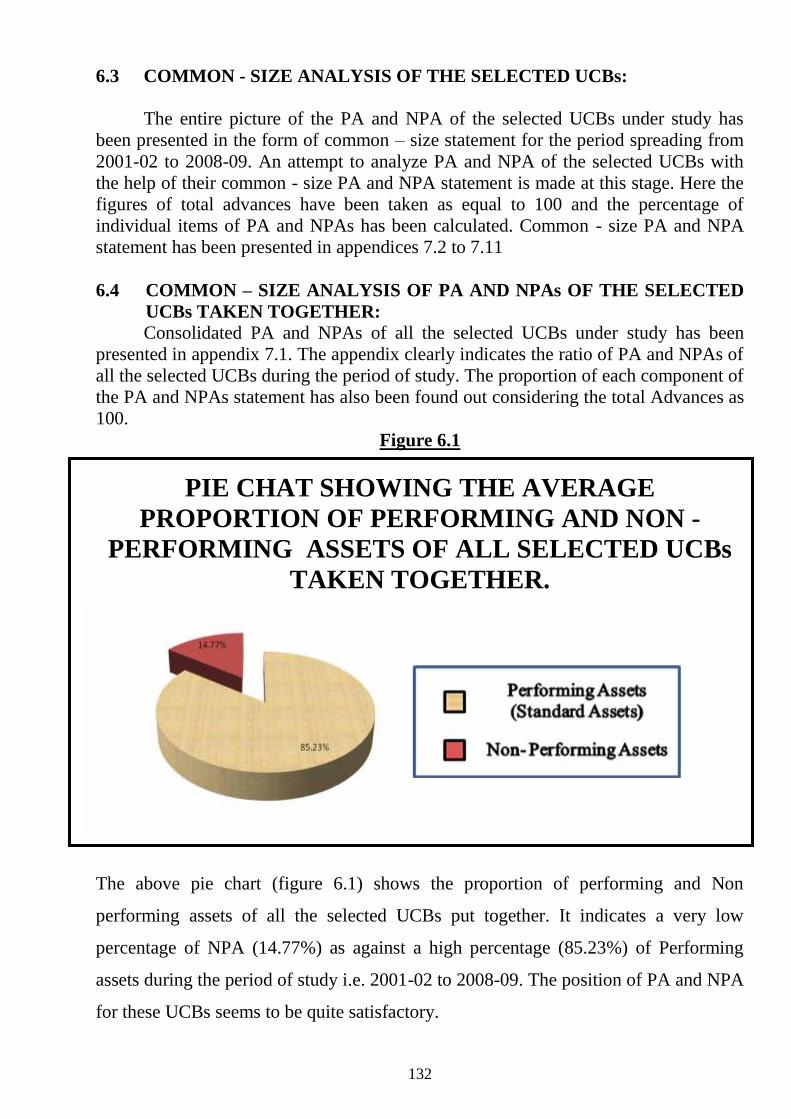
Figure 6.1
PIE CHAT SHOWING THE AVERAGE
PROPORTION OF PERFORMING AND NON -
PERFORMING ASSETS OF ALL SELECTED UCBs
TAKEN TOGETHER.
The above pie chart (figure 6.1) shows the proportion of performing and Non
performing assets of all the selected UCBs put together. It indicates a very low
percentage of NPA (14.77%) as against a high percentage (85.23%) of Performing
assets during the period of study i.e. 2001-02 to 2008-09. The position of PA and NPA
for these UCBs seems to be quite satisfactory.
133
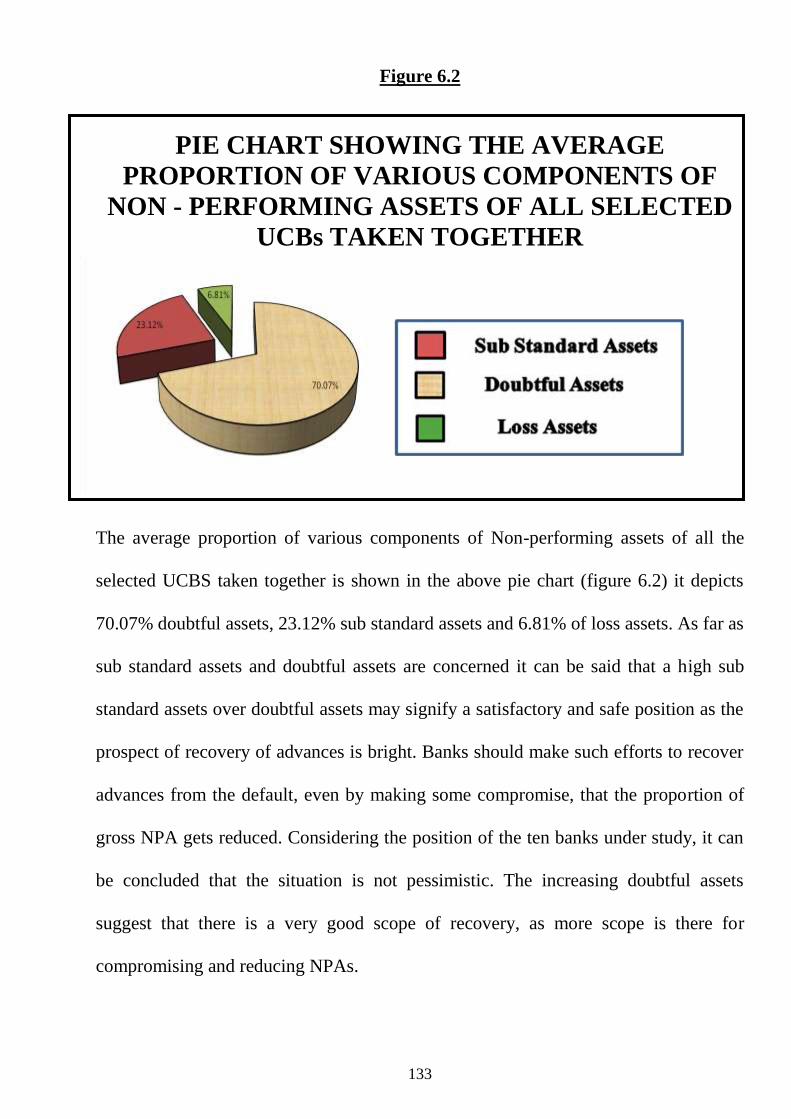
Figure 6.2
PIE CHART SHOWING THE AVERAGE
PROPORTION OF VARIOUS COMPONENTS OF
NON - PERFORMING ASSETS OF ALL SELECTED
UCBs TAKEN TOGETHER
The average proportion of various components of Non-performing assets of all the
selected UCBS taken together is shown in the above pie chart (figure 6.2) it depicts
70.07% doubtful assets, 23.12% sub standard assets and 6.81% of loss assets. As far as
sub standard assets and doubtful assets are concerned it can be said that a high sub
standard assets over doubtful assets may signify a satisfactory and safe position as the
prospect of recovery of advances is bright. Banks should make such efforts to recover
advances from the default, even by making some compromise, that the proportion of
gross NPA gets reduced. Considering the position of the ten banks under study, it can
be concluded that the situation is not pessimistic. The increasing doubtful assets
suggest that there is a very good scope of recovery, as more scope is there for
compromising and reducing NPAs.
134
6.5 RATIO ANALYSIS OF THE SELECTED UCBs:
An attempt has also been made to judge the position of NPAs of the UCBs
through ratio analysis using important ratios as follows:
6.5.10 Gross NPA ratio.
6.5.11 Net NPA ratio.
6.5.12 Problem Assets ratio.
6.5.13 Depositors‟ Safety ratio.
6.5.14 Share Holders Risk ratio.
6.5.15 Provisions ratio.
6.5.16 Sub – standard Assets ratio.
6.5.17 Doubtful Assets ratio.
6.5.18 Loss Assets ratio.
135
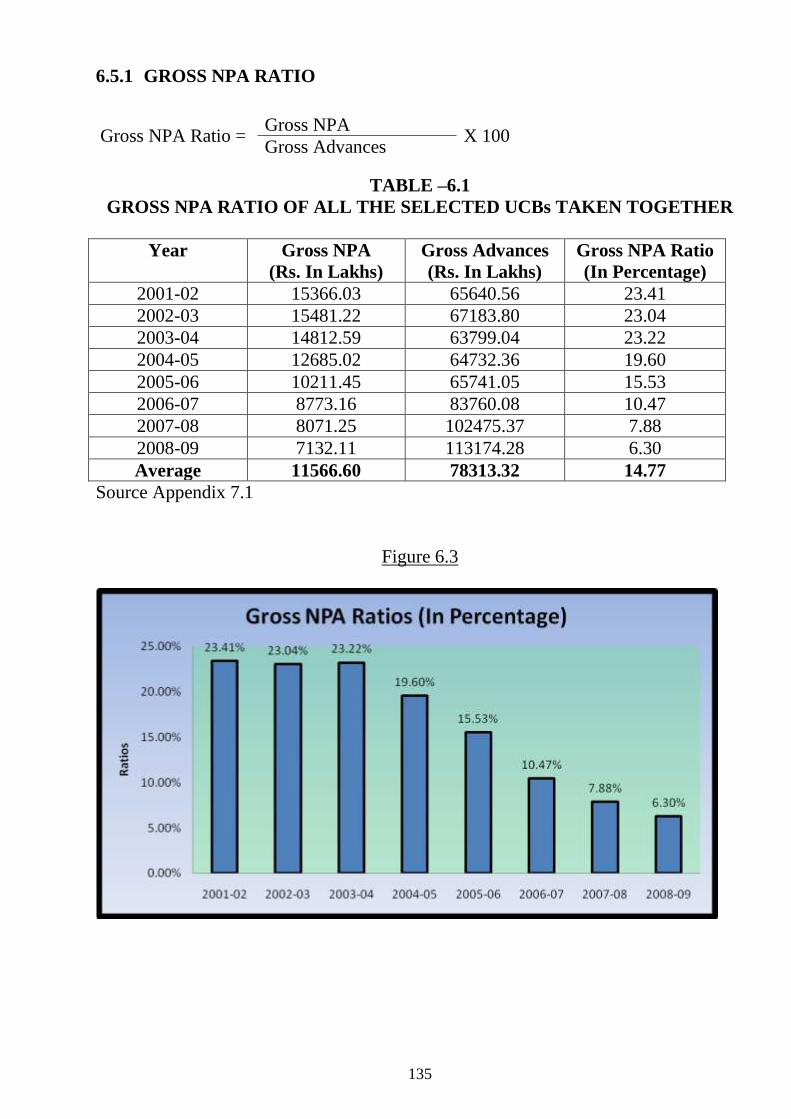
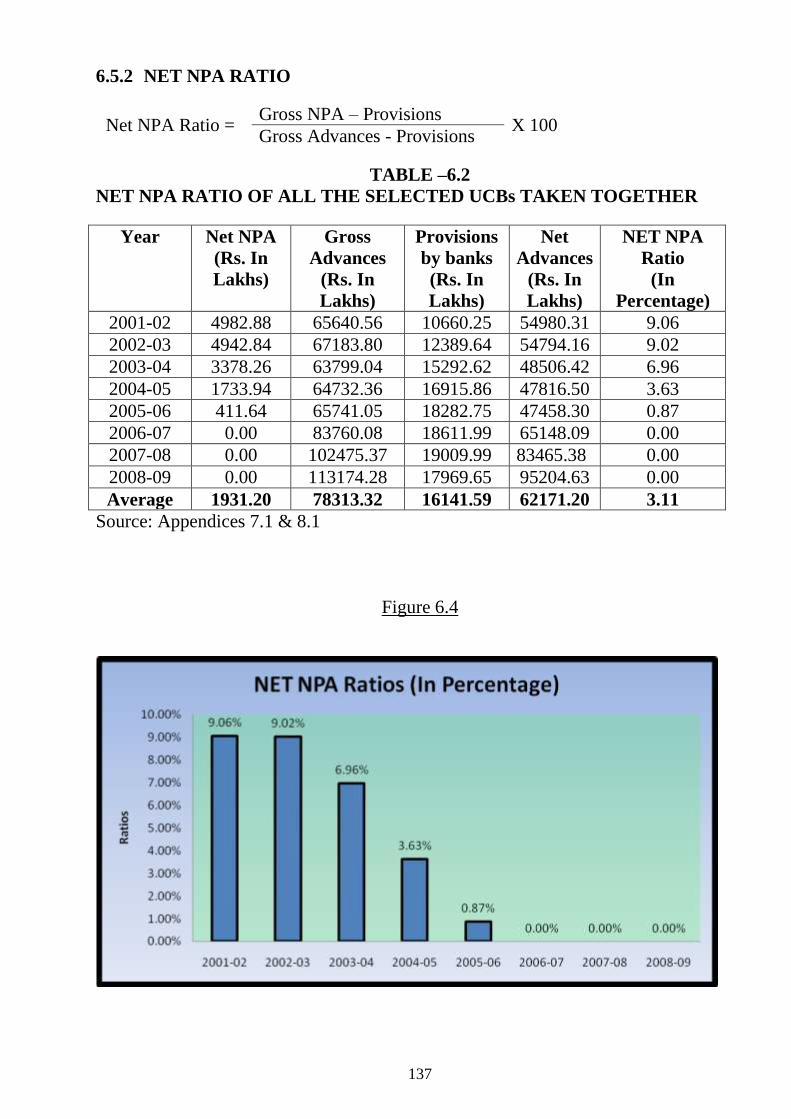
6.5.1 GROSS NPA RATIO
Gross NPA Ratio = Gross NPA
X 100 Gross Advances
TABLE –6.1
GROSS NPA RATIO OF ALL THE SELECTED UCBs TAKEN TOGETHER
Year Gross NPA
(Rs. In Lakhs)
Gross Advances
(Rs. In Lakhs)
Gross NPA Ratio
(In Percentage)
2001-02 15366.03 65640.56 23.41
2002-03 15481.22 67183.80 23.04
2003-04 14812.59 63799.04 23.22
2004-05 12685.02 64732.36 19.60
2005-06 10211.45 65741.05 15.53
2006-07 8773.16 83760.08 10.47
2007-08 8071.25 102475.37 7.88
2008-09 7132.11 113174.28 6.30
Average 11566.60 78313.32 14.77
Source Appendix 7.1
Figure 6.3
136
The above table and graph makes it very clear that the average
gross NPA of all the UCBs under study is very satisfactory. It is seen
that the gross NPA which was 23.41% in 2001-02 reduced marginally
every year and finally reached 6.30% in 2008-09 which is much lower
than the average gross NPA (14.77%). It goes without saying that the
UCBs are taking good care and following ideal norms of granting
advances, so that the recovery is satisfactory leading to lower gross
NPA. It is very encouraging that the gross NPA ratio in the last three
years is very much lower than the average 14.77%.
137
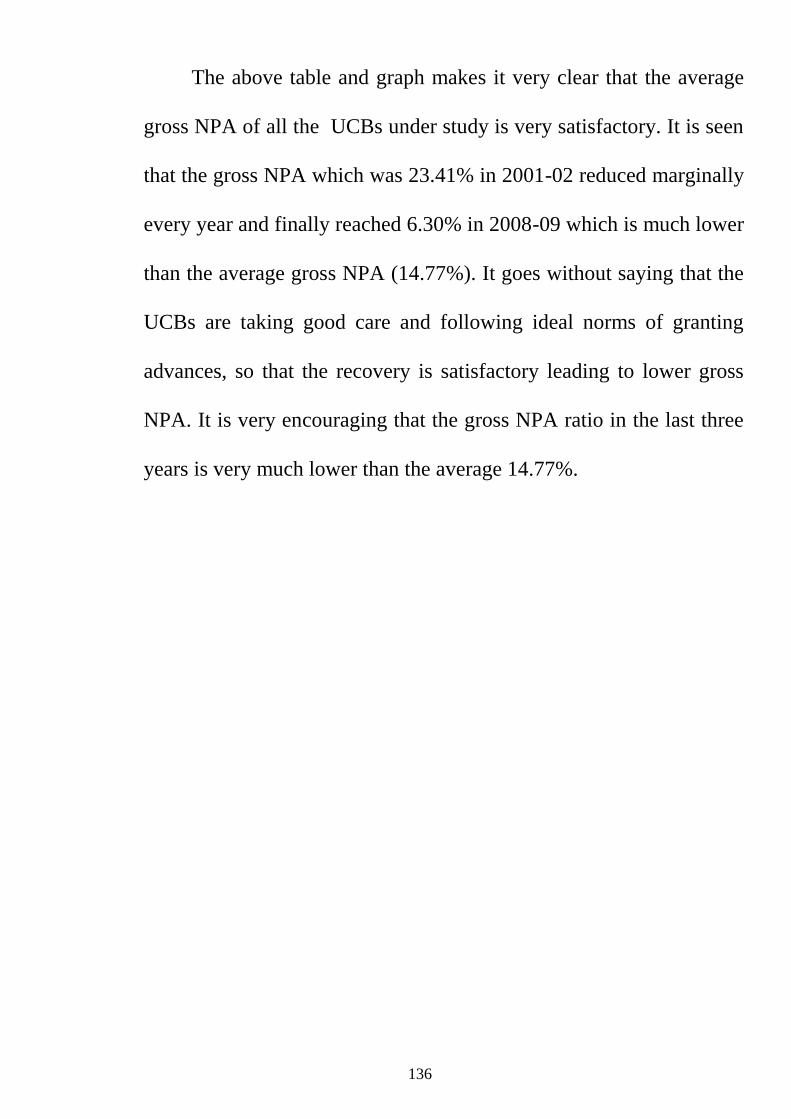
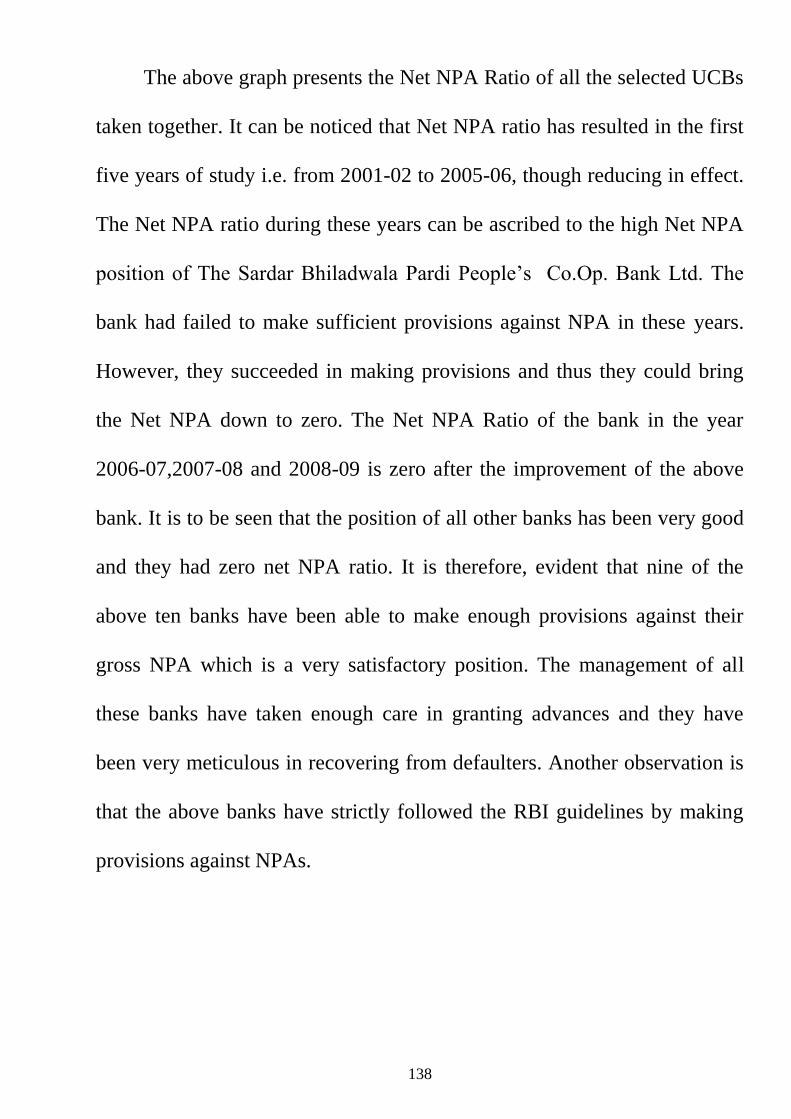
6.5.2 NET NPA RATIO
Net NPA Ratio = Gross NPA – Provisions
X 100 Gross Advances - Provisions
TABLE –6.2
NET NPA RATIO OF ALL THE SELECTED UCBs TAKEN TOGETHER
Year Net NPA
(Rs. In
Lakhs)
Gross
Advances
(Rs. In
Lakhs)
Provisions
by banks
(Rs. In
Lakhs)
Net
Advances
(Rs. In
Lakhs)
NET NPA
Ratio
(In
Percentage)
2001-02 4982.88 65640.56 10660.25 54980.31 9.06
2002-03 4942.84 67183.80 12389.64 54794.16 9.02
2003-04 3378.26 63799.04 15292.62 48506.42 6.96
2004-05 1733.94 64732.36 16915.86 47816.50 3.63
2005-06 411.64 65741.05 18282.75 47458.30 0.87
2006-07 0.00 83760.08 18611.99 65148.09 0.00
2007-08 0.00 102475.37 19009.99 83465.38 0.00
2008-09 0.00 113174.28 17969.65 95204.63 0.00
Average 1931.20 78313.32 16141.59 62171.20 3.11
Source: Appendices 7.1 & 8.1
Figure 6.4
138
The above graph presents the Net NPA Ratio of all the selected UCBs
taken together. It can be noticed that Net NPA ratio has resulted in the first
five years of study i.e. from 2001-02 to 2005-06, though reducing in effect.
The Net NPA ratio during these years can be ascribed to the high Net NPA
position of The Sardar Bhiladwala Pardi People‟s Co.Op. Bank Ltd. The
bank had failed to make sufficient provisions against NPA in these years.
However, they succeeded in making provisions and thus they could bring
the Net NPA down to zero. The Net NPA Ratio of the bank in the year
2006-07,2007-08 and 2008-09 is zero after the improvement of the above
bank. It is to be seen that the position of all other banks has been very good
and they had zero net NPA ratio. It is therefore, evident that nine of the
above ten banks have been able to make enough provisions against their
gross NPA which is a very satisfactory position. The management of all
these banks have taken enough care in granting advances and they have
been very meticulous in recovering from defaulters. Another observation is
that the above banks have strictly followed the RBI guidelines by making
provisions against NPAs.
139
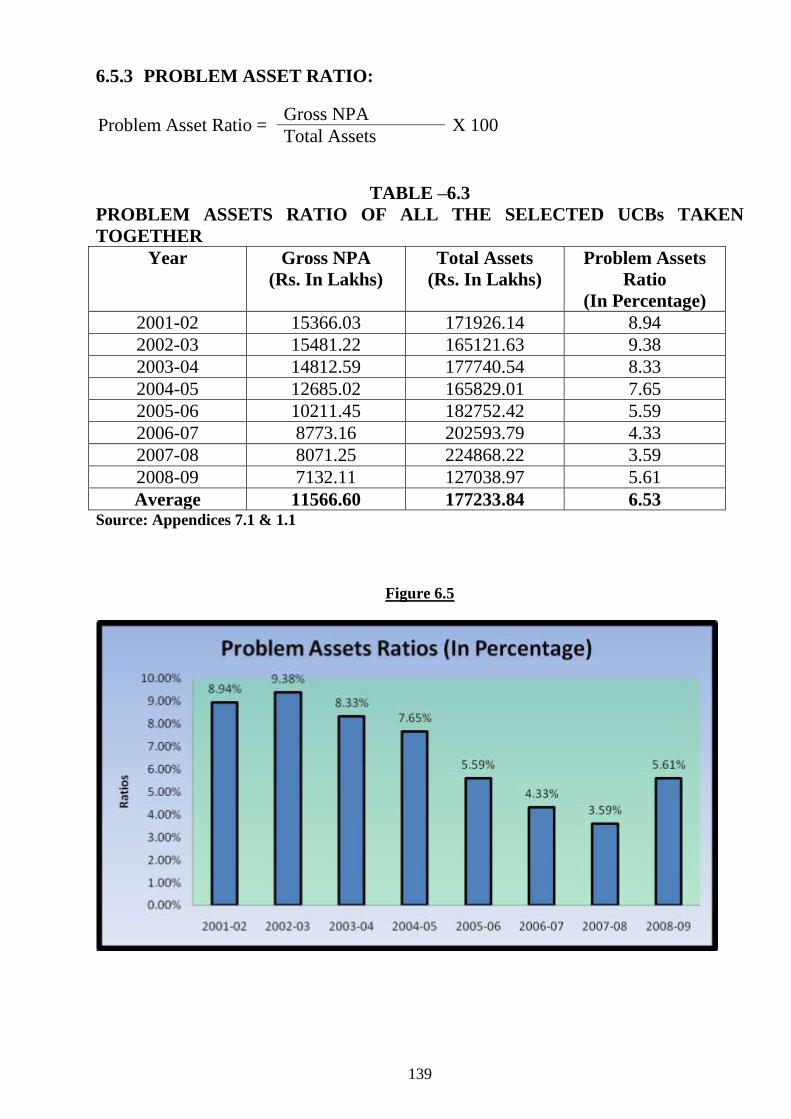
6.5.3 PROBLEM ASSET RATIO:
Problem Asset Ratio = Gross NPA
X 100 Total Assets
TABLE –6.3
PROBLEM ASSETS RATIO OF ALL THE SELECTED UCBs TAKEN
TOGETHER
Year Gross NPA
(Rs. In Lakhs)
Total Assets
(Rs. In Lakhs)
Problem Assets
Ratio
(In Percentage)
2001-02 15366.03 171926.14 8.94
2002-03 15481.22 165121.63 9.38
2003-04 14812.59 177740.54 8.33
2004-05 12685.02 165829.01 7.65
2005-06 10211.45 182752.42 5.59
2006-07 8773.16 202593.79 4.33
2007-08 8071.25 224868.22 3.59
2008-09 7132.11 127038.97 5.61
Average 11566.60 177233.84 6.53 Source: Appendices 7.1 & 1.1
Figure 6.5
140
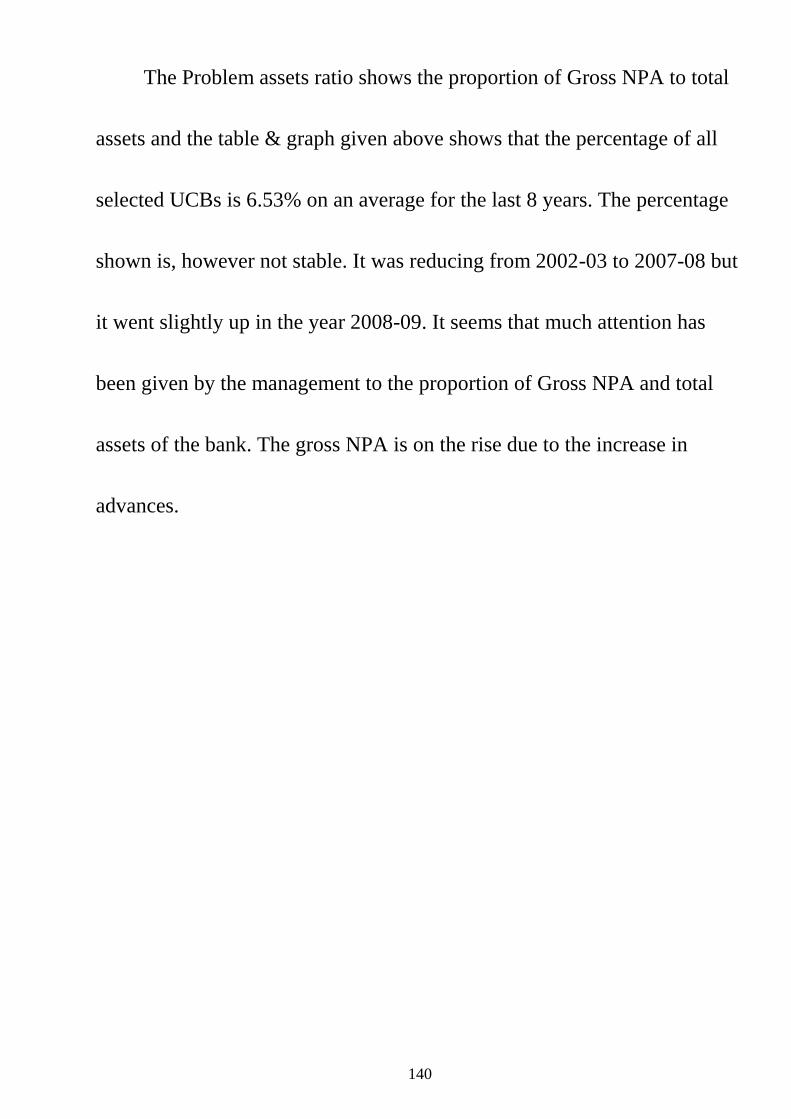
The Problem assets ratio shows the proportion of Gross NPA to total
assets and the table & graph given above shows that the percentage of all
selected UCBs is 6.53% on an average for the last 8 years. The percentage
shown is, however not stable. It was reducing from 2002-03 to 2007-08 but
it went slightly up in the year 2008-09. It seems that much attention has
been given by the management to the proportion of Gross NPA and total
assets of the bank. The gross NPA is on the rise due to the increase in
advances.
141
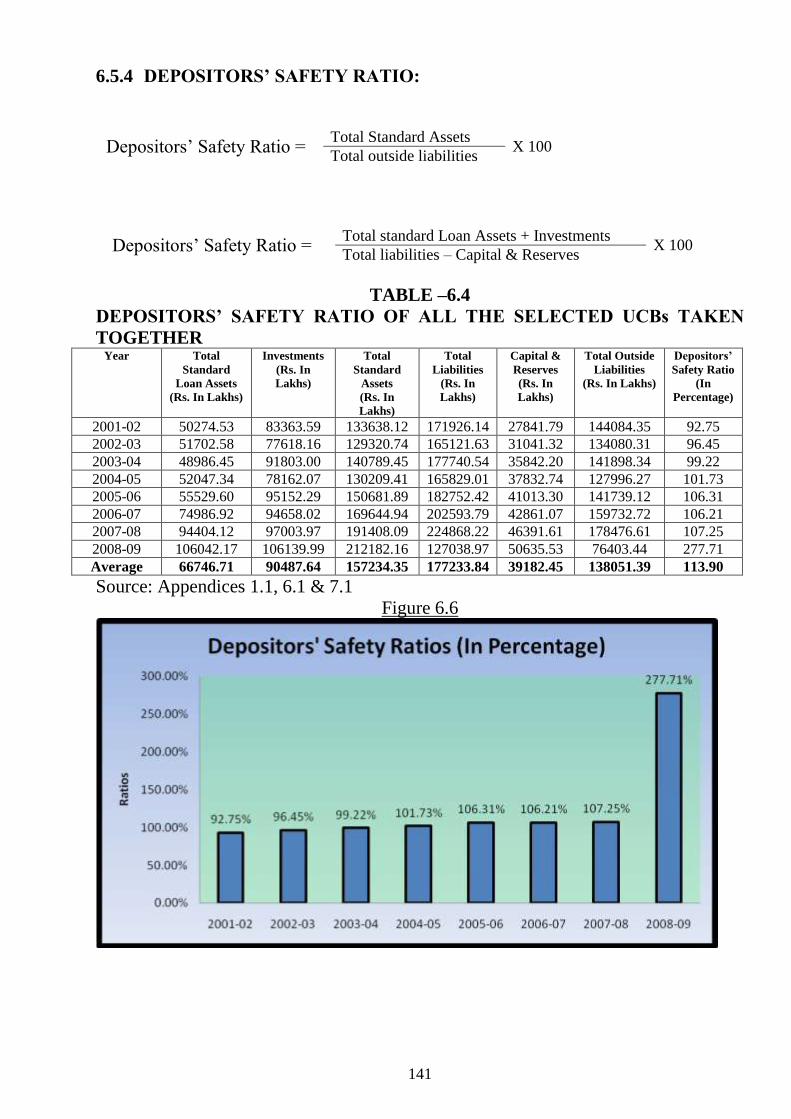
6.5.4 DEPOSITORS‟ SAFETY RATIO:
Depositors‟ Safety Ratio = Total Standard Assets
X 100 Total outside liabilities
Depositors‟ Safety Ratio = Total standard Loan Assets + Investments
X 100 Total liabilities – Capital & Reserves
TABLE –6.4
DEPOSITORS‟ SAFETY RATIO OF ALL THE SELECTED UCBs TAKEN
TOGETHER Year Total
Standard
Loan Assets
(Rs. In Lakhs)
Investments
(Rs. In
Lakhs)
Total
Standard
Assets
(Rs. In
Lakhs)
Total
Liabilities
(Rs. In
Lakhs)
Capital &
Reserves
(Rs. In
Lakhs)
Total Outside
Liabilities
(Rs. In Lakhs)
Depositors‟
Safety Ratio
(In
Percentage)
2001-02 50274.53 83363.59 133638.12 171926.14 27841.79 144084.35 92.75
2002-03 51702.58 77618.16 129320.74 165121.63 31041.32 134080.31 96.45
2003-04 48986.45 91803.00 140789.45 177740.54 35842.20 141898.34 99.22
2004-05 52047.34 78162.07 130209.41 165829.01 37832.74 127996.27 101.73
2005-06 55529.60 95152.29 150681.89 182752.42 41013.30 141739.12 106.31
2006-07 74986.92 94658.02 169644.94 202593.79 42861.07 159732.72 106.21
2007-08 94404.12 97003.97 191408.09 224868.22 46391.61 178476.61 107.25
2008-09 106042.17 106139.99 212182.16 127038.97 50635.53 76403.44 277.71
Average 66746.71 90487.64 157234.35 177233.84 39182.45 138051.39 113.90
Source: Appendices 1.1, 6.1 & 7.1
Figure 6.6
142
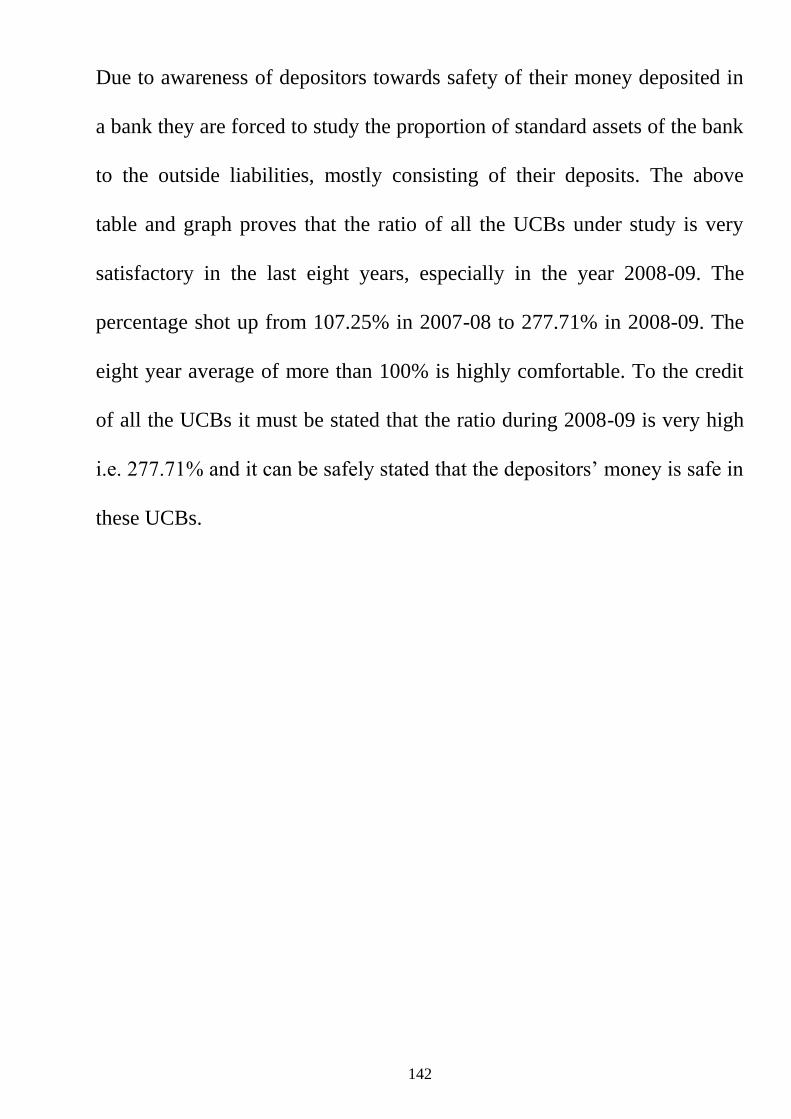
Due to awareness of depositors towards safety of their money deposited in
a bank they are forced to study the proportion of standard assets of the bank
to the outside liabilities, mostly consisting of their deposits. The above
table and graph proves that the ratio of all the UCBs under study is very
satisfactory in the last eight years, especially in the year 2008-09. The
percentage shot up from 107.25% in 2007-08 to 277.71% in 2008-09. The
eight year average of more than 100% is highly comfortable. To the credit
of all the UCBs it must be stated that the ratio during 2008-09 is very high
i.e. 277.71% and it can be safely stated that the depositors‟ money is safe in
these UCBs.
143
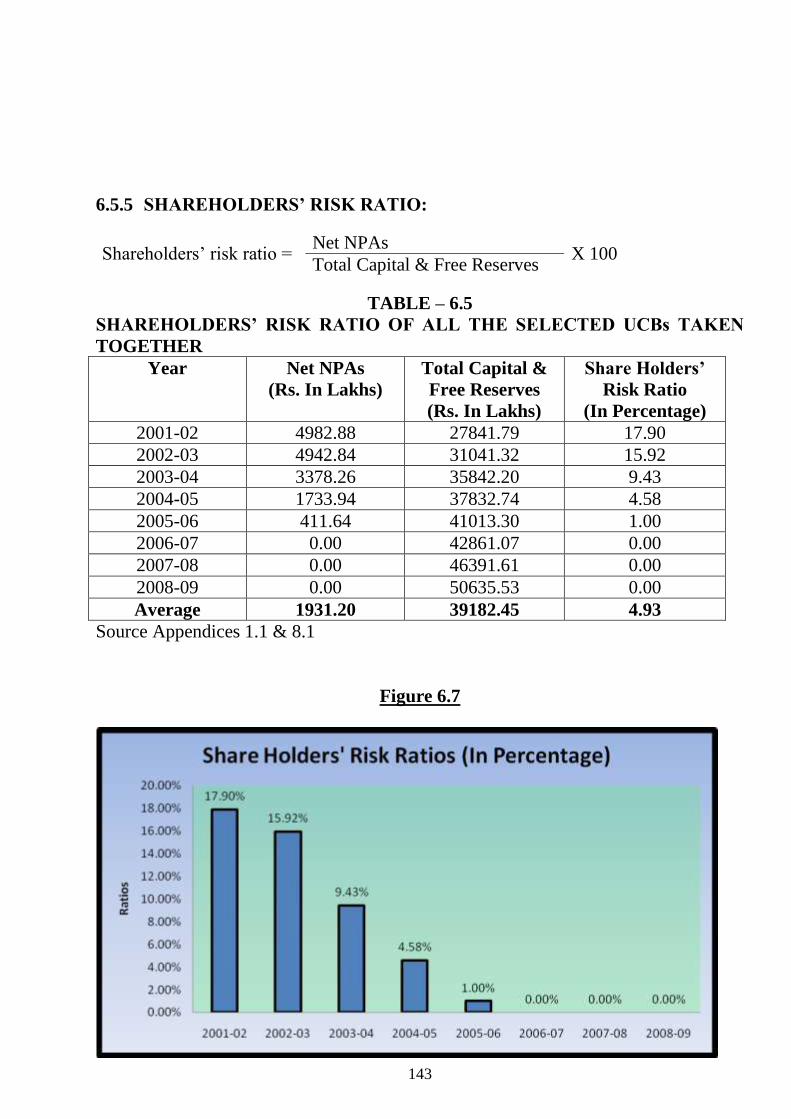
6.5.5 SHAREHOLDERS‟ RISK RATIO:
Shareholders‟ risk ratio = Net NPAs
X 100 Total Capital & Free Reserves
TABLE – 6.5
SHAREHOLDERS‟ RISK RATIO OF ALL THE SELECTED UCBs TAKEN
TOGETHER
Year Net NPAs
(Rs. In Lakhs)
Total Capital &
Free Reserves
(Rs. In Lakhs)
Share Holders‟
Risk Ratio
(In Percentage)
2001-02 4982.88 27841.79 17.90
2002-03 4942.84 31041.32 15.92
2003-04 3378.26 35842.20 9.43
2004-05 1733.94 37832.74 4.58
2005-06 411.64 41013.30 1.00
2006-07 0.00 42861.07 0.00
2007-08 0.00 46391.61 0.00
2008-09 0.00 50635.53 0.00
Average 1931.20 39182.45 4.93
Source Appendices 1.1 & 8.1
Figure 6.7
144
Like depositors, the shareholders are also exposed to great risk if the
Net NPA is positive or more than zero. Hence it is necessary to see that the
shareholders‟ funds are safe in view of the NPA. So, this ratio becomes
important from the view point of the shareholders. From the table and graph
given above, we can see the position of the selected UCBs. A risk ratio is
resulted in the first five year and it is only due to The Sardar Bhiladwala
Pardi People‟s Co.Op. Bank Ltd. Which had failed in making provisions
against NPAs. However, it is a happy sign that the risk ratio in the last three
years is zero. As the Net NPA of all the banks taken together is zero in the
last three years, it is natural that the shareholders‟ risk ratio is also zero.
This signifies that the shareholders‟ funds in these banks are clearly safe.
145
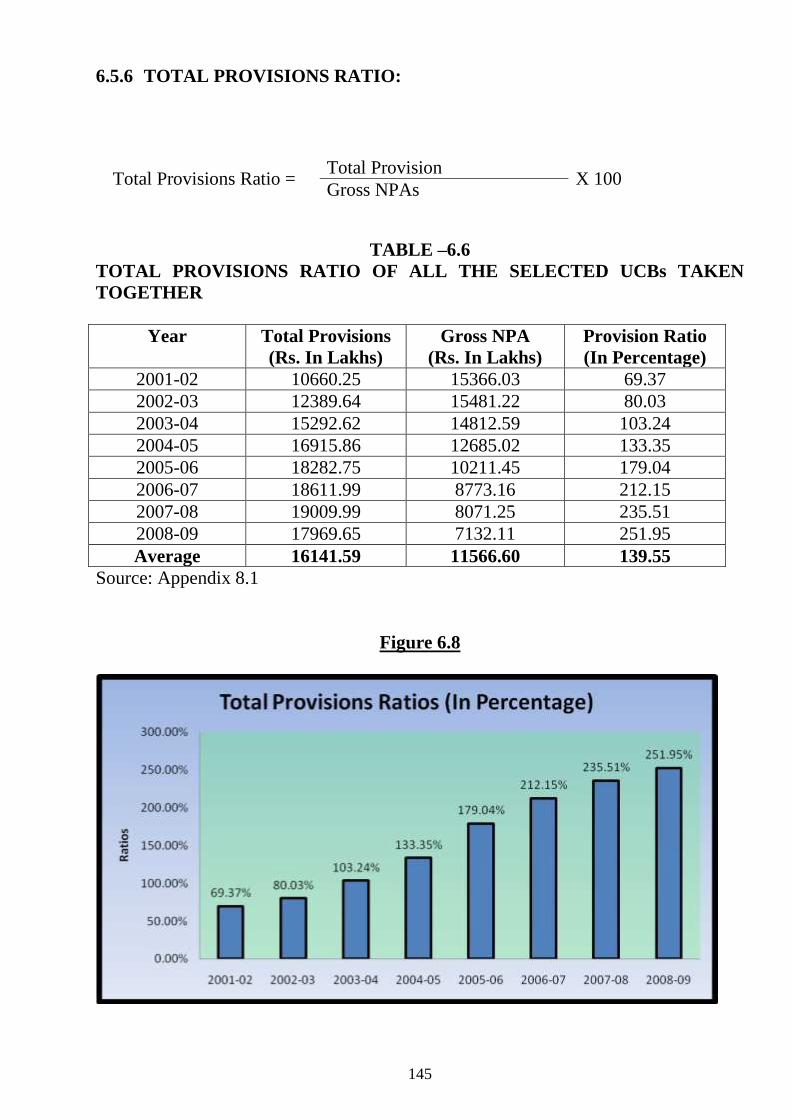
6.5.6 TOTAL PROVISIONS RATIO:
Total Provisions Ratio = Total Provision
X 100 Gross NPAs
TABLE –6.6
TOTAL PROVISIONS RATIO OF ALL THE SELECTED UCBs TAKEN
TOGETHER
Year Total Provisions
(Rs. In Lakhs)
Gross NPA
(Rs. In Lakhs)
Provision Ratio
(In Percentage)
2001-02 10660.25 15366.03 69.37
2002-03 12389.64 15481.22 80.03
2003-04 15292.62 14812.59 103.24
2004-05 16915.86 12685.02 133.35
2005-06 18282.75 10211.45 179.04
2006-07 18611.99 8773.16 212.15
2007-08 19009.99 8071.25 235.51
2008-09 17969.65 7132.11 251.95
Average 16141.59 11566.60 139.55
Source: Appendix 8.1
Figure 6.8
146
Since the publication of the Narsimham Committee
Report, the RBI published guidelines for making provisions against NPAs
for all banks, including Co. Op. banks. The total provisions against gross
NPAs must be such that its Net NPA comes to zero. It means that three
must be 100% provision, so that the above table, it is seen that all the
selected UCBs have made more than enough provisions for their gross
NPA. During the last eight years the provisions Ratio has been above 100%
expect in 2001-02 and 2002-03 due to The sardar Bhiladwala Pardi
People‟s Co.Op. Bank Ltd. This marks a very satisfactory position and it
signifies the satisfactory policy of the managements. It has even exceeded
the limits laid down by the RBI.
As per appendix 8.8 the gross NPA of The sardar
Bhiladwala Pardi People‟s Co.Op. Bank during 2001-02 to 2005-06 were
more than 40 to 50 percent of the total advances. But in the last three years
i.e. 2006-07 to 2008-09 the Net NPA is zero as enough provisions were
made against Gross NPA.
It should be noticed that in the last three years the
provision ratio has exceeded 200 percent which is a very positive sign.
147
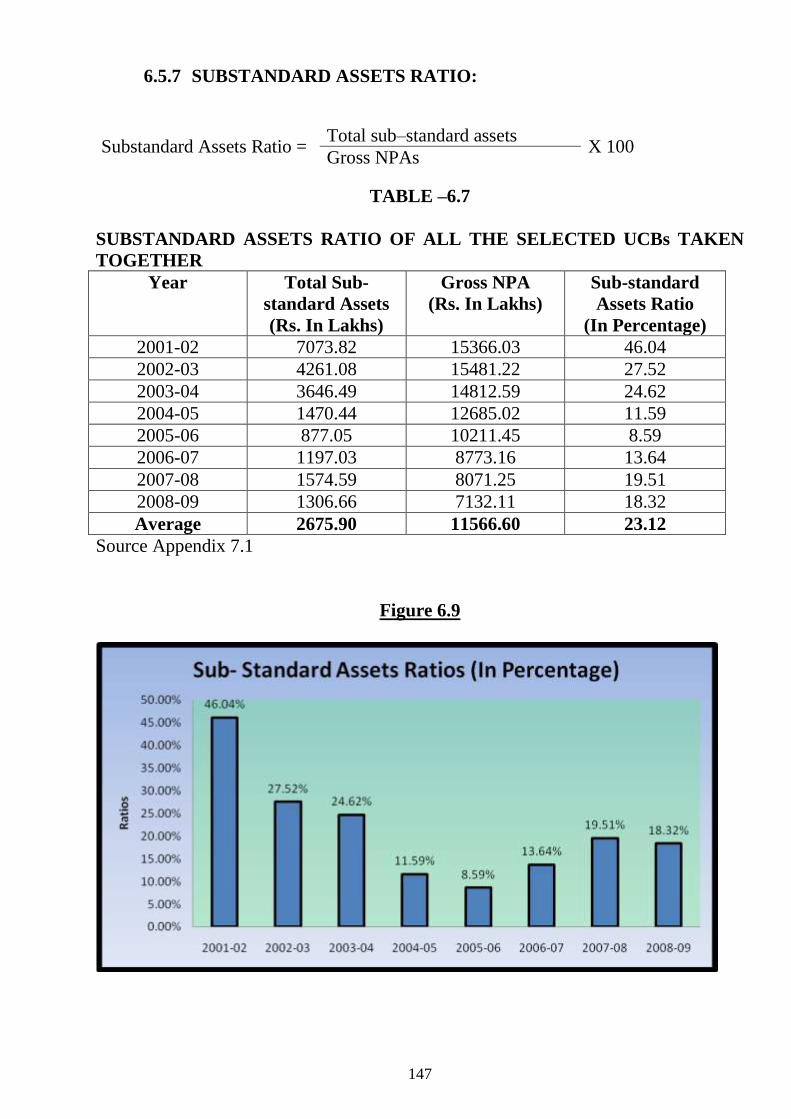
6.5.7 SUBSTANDARD ASSETS RATIO:
Substandard Assets Ratio = Total sub–standard assets
X 100 Gross NPAs
TABLE –6.7
SUBSTANDARD ASSETS RATIO OF ALL THE SELECTED UCBs TAKEN
TOGETHER
Year Total Sub-
standard Assets
(Rs. In Lakhs)
Gross NPA
(Rs. In Lakhs)
Sub-standard
Assets Ratio
(In Percentage)
2001-02 7073.82 15366.03 46.04
2002-03 4261.08 15481.22 27.52
2003-04 3646.49 14812.59 24.62
2004-05 1470.44 12685.02 11.59
2005-06 877.05 10211.45 8.59
2006-07 1197.03 8773.16 13.64
2007-08 1574.59 8071.25 19.51
2008-09 1306.66 7132.11 18.32
Average 2675.90 11566.60 23.12
Source Appendix 7.1
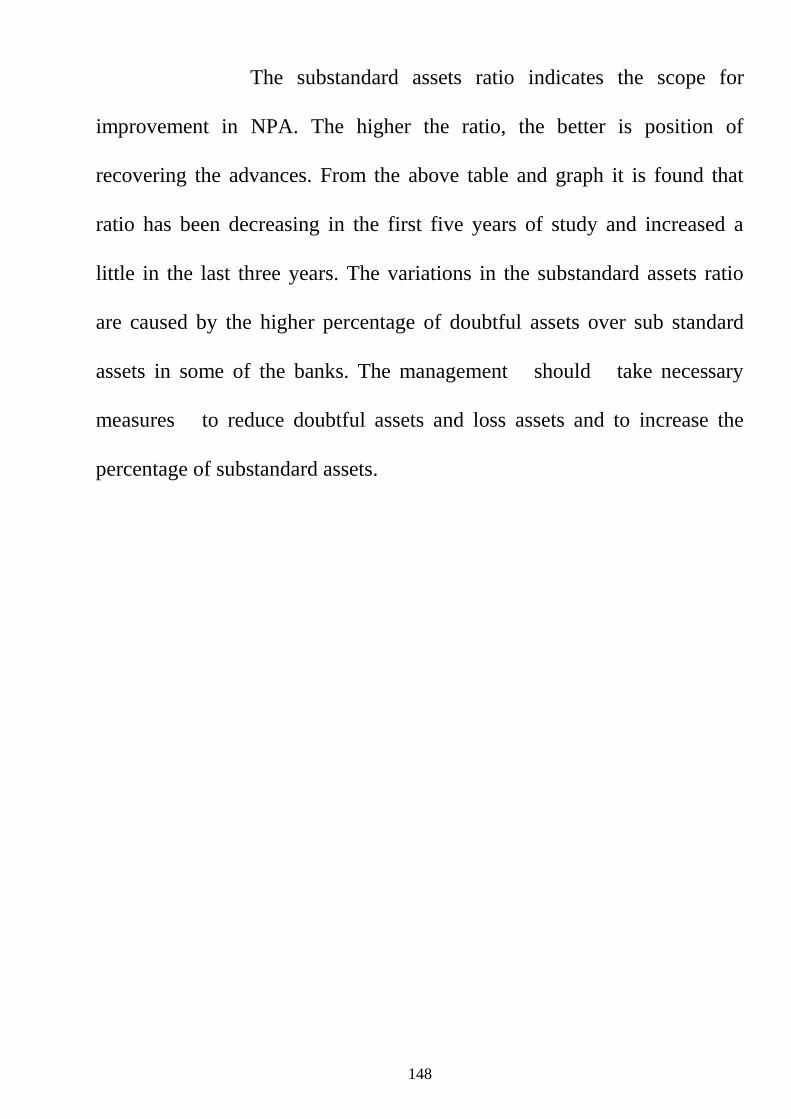
Figure 6.9
148
The substandard assets ratio indicates the scope for
improvement in NPA. The higher the ratio, the better is position of
recovering the advances. From the above table and graph it is found that
ratio has been decreasing in the first five years of study and increased a
little in the last three years. The variations in the substandard assets ratio
are caused by the higher percentage of doubtful assets over sub standard
assets in some of the banks. The management should take necessary
measures to reduce doubtful assets and loss assets and to increase the
percentage of substandard assets.
149
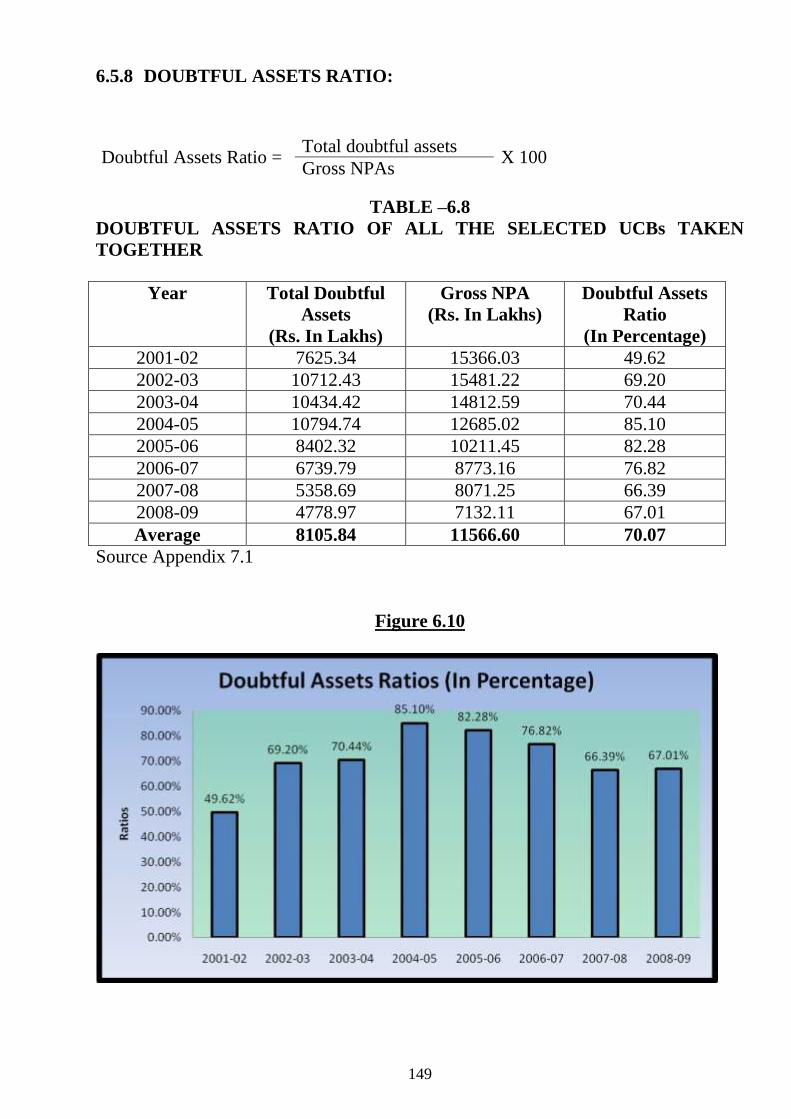
6.5.8 DOUBTFUL ASSETS RATIO:
Doubtful Assets Ratio = Total doubtful assets
X 100 Gross NPAs
TABLE –6.8
DOUBTFUL ASSETS RATIO OF ALL THE SELECTED UCBs TAKEN
TOGETHER
Year Total Doubtful
Assets
(Rs. In Lakhs)
Gross NPA
(Rs. In Lakhs)
Doubtful Assets
Ratio
(In Percentage)
2001-02 7625.34 15366.03 49.62
2002-03 10712.43 15481.22 69.20
2003-04 10434.42 14812.59 70.44
2004-05 10794.74 12685.02 85.10
2005-06 8402.32 10211.45 82.28
2006-07 6739.79 8773.16 76.82
2007-08 5358.69 8071.25 66.39
2008-09 4778.97 7132.11 67.01
Average 8105.84 11566.60 70.07
Source Appendix 7.1
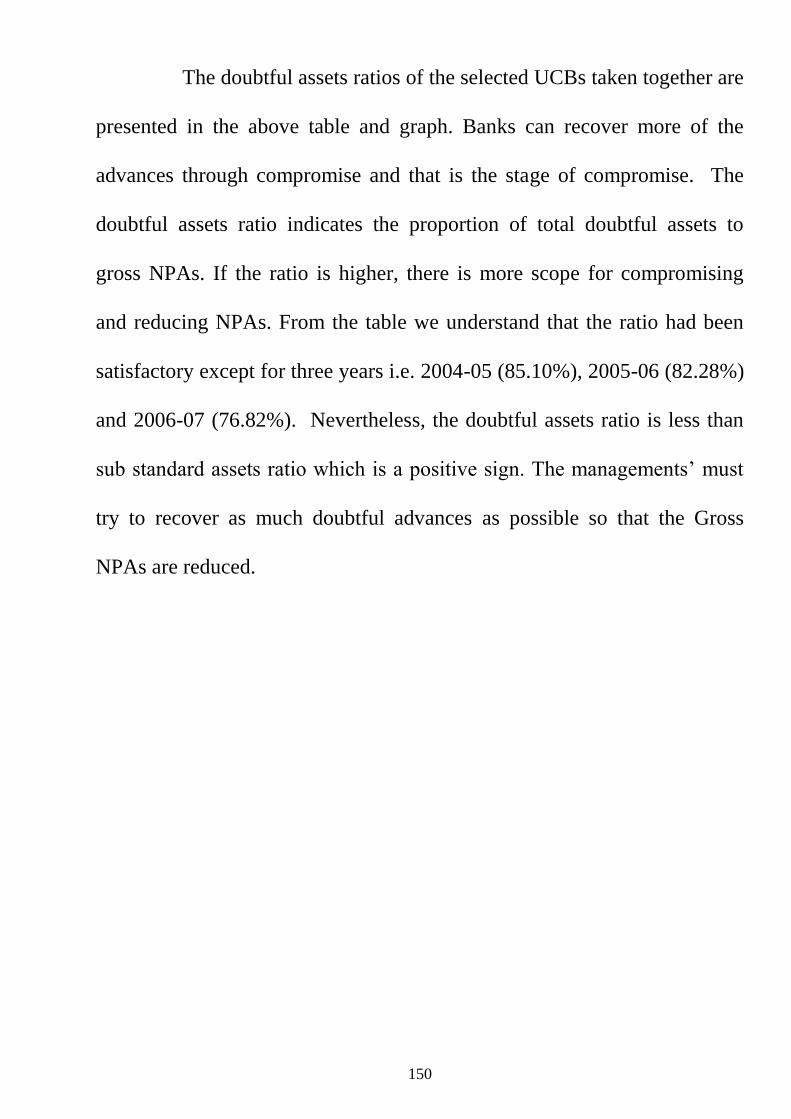
Figure 6.10
150
The doubtful assets ratios of the selected UCBs taken together are
presented in the above table and graph. Banks can recover more of the
advances through compromise and that is the stage of compromise. The
doubtful assets ratio indicates the proportion of total doubtful assets to
gross NPAs. If the ratio is higher, there is more scope for compromising
and reducing NPAs. From the table we understand that the ratio had been
satisfactory except for three years i.e. 2004-05 (85.10%), 2005-06 (82.28%)
and 2006-07 (76.82%). Nevertheless, the doubtful assets ratio is less than
sub standard assets ratio which is a positive sign. The managements‟ must
try to recover as much doubtful advances as possible so that the Gross
NPAs are reduced.
151
6.5.9 LOSS ASSETS RATIO:
Loss Assets Ratio = Total Loss Assets
X 100 Gross NPAs
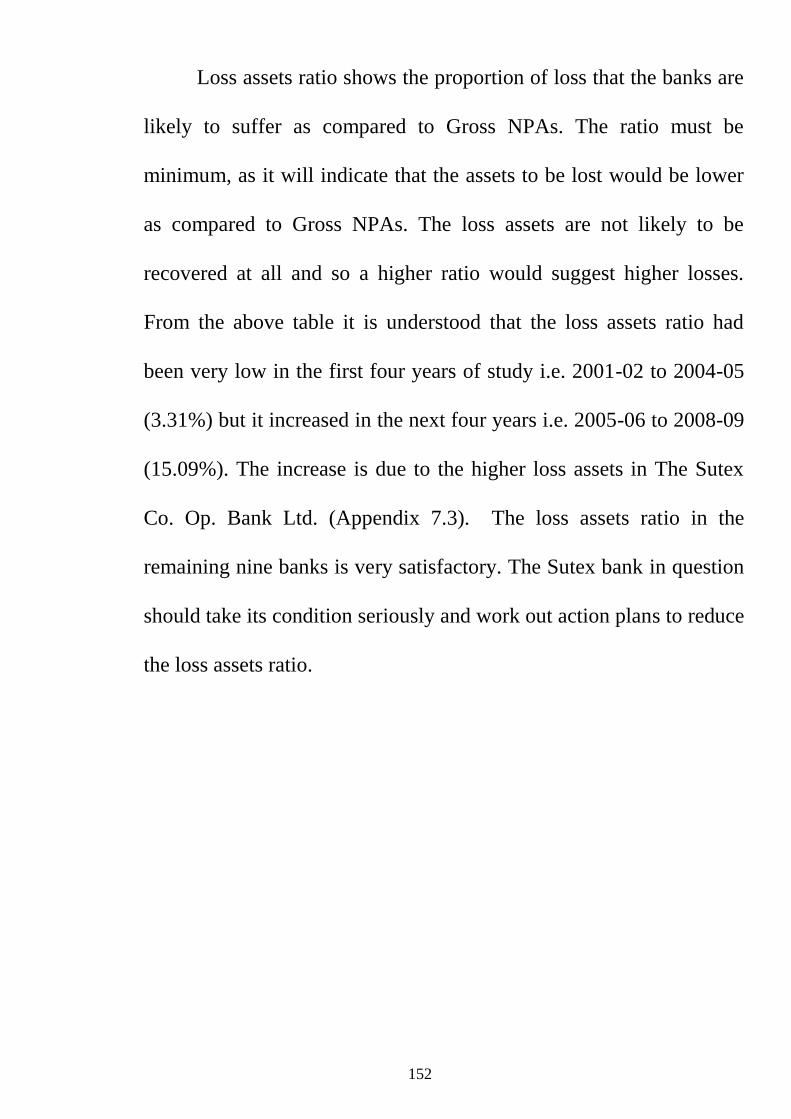
TABLE –6.9
LOSS ASSETS RATIO OF ALL THE SELECTED UCBs TAKEN TOGETHER
Year Total Loss Assets
(Rs. In Lakhs)
Gross NPA
(Rs. In Lakhs)
Loss Assets Ratio
(In Percentage)
2001-02 666.87 15366.03 4.34
2002-03 507.71 15481.22 3.28
2003-04 731.68 14812.59 4.94
2004-05 419.84 12685.02 3.31
2005-06 932.08 10211.45 9.13
2006-07 836.34 8773.16 9.53
2007-08 1137.97 8071.25 14.10
2008-09 1076.48 7132.11 15.09
Average 788.62 11566.60 6.81
Source Appendix 7.1
Figure 6.11
152
Loss assets ratio shows the proportion of loss that the banks are
likely to suffer as compared to Gross NPAs. The ratio must be
minimum, as it will indicate that the assets to be lost would be lower
as compared to Gross NPAs. The loss assets are not likely to be
recovered at all and so a higher ratio would suggest higher losses.
From the above table it is understood that the loss assets ratio had
been very low in the first four years of study i.e. 2001-02 to 2004-05
(3.31%) but it increased in the next four years i.e. 2005-06 to 2008-09
(15.09%). The increase is due to the higher loss assets in The Sutex
Co. Op. Bank Ltd. (Appendix 7.3). The loss assets ratio in the
remaining nine banks is very satisfactory. The Sutex bank in question
should take its condition seriously and work out action plans to reduce
the loss assets ratio.
153
6.6 GENERAL CAUSES OF NON PERFORMING ASSETS
A bank with 100% performing assets is quite impossible as NPAs are sure to
occur at one stage or another. The causes of such NPAs are many which may be
broadly classified into three, viz. internal factors, external factors and internal and
external factors together.
INTERNAL FACTORS
The internal factors leading to NPAs may work at either institutional level or
borrower‟s level or both.
A. Institutional level:
The Institution‟s philosophy, its policy, procedure and people should be well co-
ordinated. Very often aggressive lending policy and absence of well designed
procedures for sanctioning advances result in high NPA levels. Before sanctioning
loans gathering, processing and analyzing information are at the heart of decision
making, failing which the bank‟s loan portfolio gets ruined. Appraisal deficiencies
have put many banks in difficult conditions. In addition, delays in sanctioning loans
and inappropriate repayment schedules worsen the situation. At post sanction stage
inappropriate disbursement and Lack of adequate supervision / monitoring develop
problems and losses. For example, sound loans at the initial stage are not good for any
bank.
Other Causes :
Credit concentration deficiency causes NPAs as lack of information regarding
repaid or growing areas for financing hinder accuracy. Secondly, credit process issues
like sanctioning advances under unsatisfactory terms, violating credit principles lead
to destruction of the bank. Over extension of credit to directors, large share holders
and lending under pressure from interested parties also cause trouble.
Technical in competence and lack of complacency also cause NPAs. Inadequate
supervision unfamiliar borrowers and dependence on oral information instead of
reliable complete financial data, optimistic interpretation of credit weakness are
dangerous.
154
Poor selection of risks involving highly leveraged loans to establish business
situation were bank financed share of required capitals is large related to the equity
investment of owners, may also cause unpleasant situation.
Lack of assessment of the credit worthiness of borrowers is get another reason
for high NPAs. Loans based on expectations of successful completions of business
rather than borrowers‟ creditworthiness are always at risk. Loans made because of
benefits such as large balance in deposits in a bank rather than on sound security or
collateral are also not advisable. Loans against problematic collaterals might also
cause NPAs. Liquidation of such collaterals and loans against collaterals without
adequate margin create hurdles for a bank.
B. Borrowers’ Level;
Project related problems, managerial aspects like failure in marketing,
inefficient management, labour problems and product obsolesces cause NPAs. Also,
financial indiscipline like diversion of funs for different purposes is another cause of
this situation.
EXTERNAL FACTORS
The external factors are those factors that lead advances into NPA beyond the
control of borrowers or institution i.e. banks. Such factors are natural calamities, state
of economy, recession or competition, trade policy, technological , advances,
regulatory advances , environmental pollution control requirements, lack of adequate
support from the legal system , loan waivers etc. These factors are not exhaustive but
inclusive. The factors that affect the NPAs would reflect in the policies of the bank
especially for lending, recovery management, monitoring and effective supervision. If
proper attention is not given to recovery Management of NPAs, banks will lose their
profitability and will not be able to satisfy its creditors and share holders.
The internal and external factors lending accounts to NPAs are enlisted below:
155
INTERNAL FACTORS:
1. Improper appraisal of the credit proposal / credit requirements.
2. Lack of Supervision and follow up.
3. Vested interest
4. Improper treatment to borrowers (attitude as well as system constraints)
EXTERNAL FACTORS
1. Recession in economy / industry not visualized earlier.
2. Failure of the product or service to take off.
3. Internal conflict among the promoters.
4. Mismanagement of the unit.
5. Willful default.