Embed Size (px)
Citation preview
Underground Space Use: Analysis of the Past and Lessons for the Future – Erdem & Solak (eds)© 2005 Taylor & Francis Group, London, ISBN 04 1537 452 9
821
1 INTRODUCTION
It is estimated that in the coming years the under-ground construction in Europe and in the other parts ofthe world will increase tremendously, typical exam-ples are tunnels, microtunnels, storage caverns (oil, gas,waste etc.). Mechanical rock excavation offers manyadvantages over conventional drill and blast techniques.These include improved safety, minimal ground dis-turbances, elimination of blast vibration, reduced venti-lation requirements etc. In addition, mechanical boringis capable of providing much higher rates of advanceat lower cost than drill and blast excavation. A degreeof uncertainty is always present on selecting equip-ment, predicting machine performance, estimating jobduration, costs etc. However accumulated and pub-lished data from tunneling projects serve to improvepredicting the machine performance and scheduling ofjob duration, this paper is prepared under this objective.
2 DESCRIPTION OF THE TUNNEL PROJECTAND TUNNEL GEOLOGY
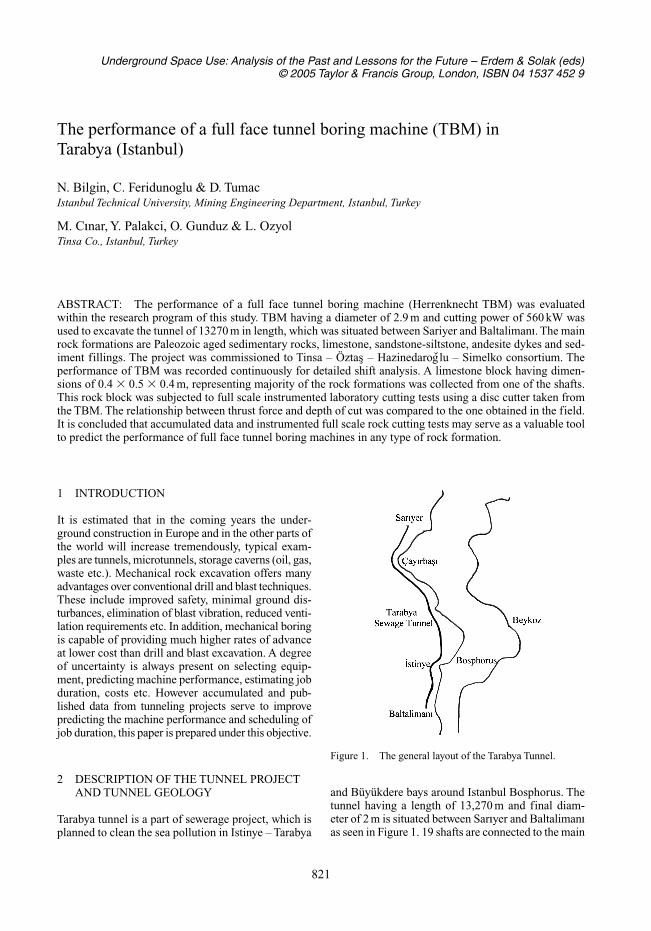
Tarabya tunnel is a part of sewerage project, which isplanned to clean the sea pollution in Istinye – Tarabya
and Büyükdere bays around Istanbul Bosphorus. Thetunnel having a length of 13,270 m and final diam-eter of 2 m is situated between Sar�yer and Baltaliman�as seen in Figure 1. 19 shafts are connected to the main
The performance of a full face tunnel boring machine (TBM) in Tarabya (Istanbul)
N. Bilgin, C. Feridunoglu & D. TumacIstanbul Technical University, Mining Engineering Department, Istanbul, Turkey
M. C�nar, Y. Palakci, O. Gunduz & L. OzyolTinsa Co., Istanbul, Turkey
ABSTRACT: The performance of a full face tunnel boring machine (Herrenknecht TBM) was evaluatedwithin the research program of this study. TBM having a diameter of 2.9 m and cutting power of 560 kW wasused to excavate the tunnel of 13270 m in length, which was situated between Sariyer and Baltaliman�. The mainrock formations are Paleozoic aged sedimentary rocks, limestone, sandstone-siltstone, andesite dykes and sed-iment fillings. The project was commissioned to Tinsa – Öztas – Hazinedarog
�lu – Simelko consortium. The
performance of TBM was recorded continuously for detailed shift analysis. A limestone block having dimen-sions of 0.4 � 0.5 � 0.4 m, representing majority of the rock formations was collected from one of the shafts.This rock block was subjected to full scale instrumented laboratory cutting tests using a disc cutter taken fromthe TBM. The relationship between thrust force and depth of cut was compared to the one obtained in the field.It is concluded that accumulated data and instrumented full scale rock cutting tests may serve as a valuable toolto predict the performance of full face tunnel boring machines in any type of rock formation.
Figure 1. The general layout of the Tarabya Tunnel.
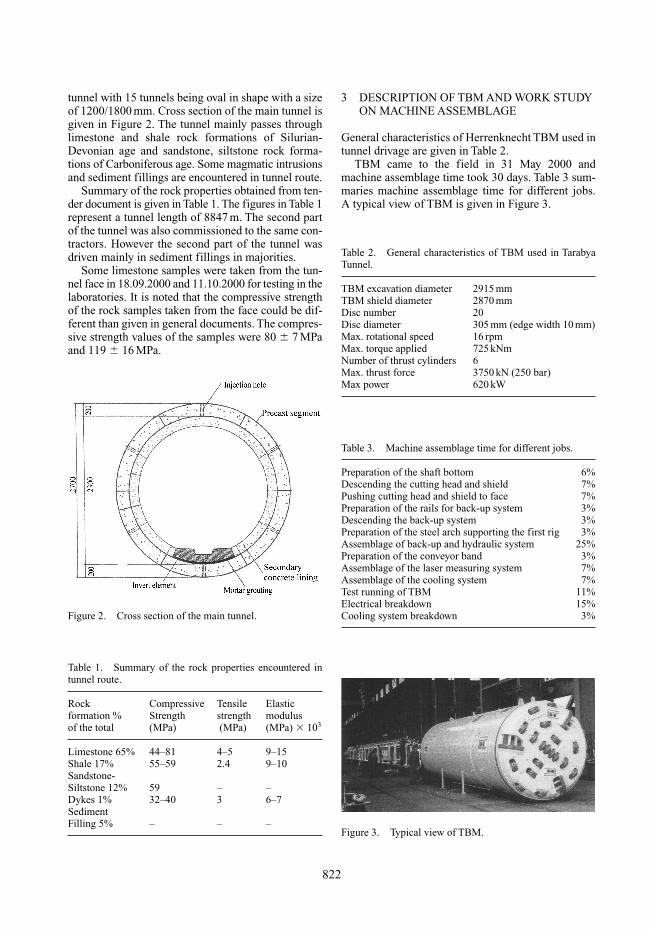
tunnel with 15 tunnels being oval in shape with a sizeof 1200/1800 mm. Cross section of the main tunnel isgiven in Figure 2. The tunnel mainly passes throughlimestone and shale rock formations of Silurian-Devonian age and sandstone, siltstone rock forma-tions of Carboniferous age. Some magmatic intrusionsand sediment fillings are encountered in tunnel route.
Summary of the rock properties obtained from ten-der document is given in Table 1. The figures in Table 1represent a tunnel length of 8847 m. The second partof the tunnel was also commissioned to the same con-tractors. However the second part of the tunnel wasdriven mainly in sediment fillings in majorities.
Some limestone samples were taken from the tun-nel face in 18.09.2000 and 11.10.2000 for testing in thelaboratories. It is noted that the compressive strengthof the rock samples taken from the face could be dif-ferent than given in general documents. The compres-sive strength values of the samples were 80 � 7 MPaand 119 � 16 MPa.
3 DESCRIPTION OF TBM AND WORK STUDYON MACHINE ASSEMBLAGE
General characteristics of Herrenknecht TBM used intunnel drivage are given in Table 2.
TBM came to the field in 31 May 2000 andmachine assemblage time took 30 days. Table 3 sum-maries machine assemblage time for different jobs. A typical view of TBM is given in Figure 3.
822
Figure 2. Cross section of the main tunnel.
Table 1. Summary of the rock properties encountered intunnel route.
Rock Compressive Tensile Elastic formation % Strength strength modulusof the total (MPa) (MPa) (MPa) � 103
Limestone 65% 44–81 4–5 9–15Shale 17% 55–59 2.4 9–10Sandstone-Siltstone 12% 59 – –Dykes 1% 32–40 3 6–7SedimentFilling 5% – – –
Table 2. General characteristics of TBM used in TarabyaTunnel.
TBM excavation diameter 2915 mmTBM shield diameter 2870 mmDisc number 20Disc diameter 305 mm (edge width 10 mm)Max. rotational speed 16 rpmMax. torque applied 725 kNmNumber of thrust cylinders 6Max. thrust force 3750 kN (250 bar)Max power 620 kW
Figure 3. Typical view of TBM.
Table 3. Machine assemblage time for different jobs.
Preparation of the shaft bottom 6%Descending the cutting head and shield 7%Pushing cutting head and shield to face 7%Preparation of the rails for back-up system 3%Descending the back-up system 3%Preparation of the steel arch supporting the first rig 3%Assemblage of back-up and hydraulic system 25%Preparation of the conveyor band 3%Assemblage of the laser measuring system 7%Assemblage of the cooling system 7%Test running of TBM 11%Electrical breakdown 15%Cooling system breakdown 3%
4 RECORDING THE PERFORMANCE OF TBM
The tunnel excavation started in July 2000 and fin-ished in November 2004. The performance of TBMwas recorded continuously for detailed shift analysis.Table 4 is a summary of overall performance for7700 m of tunnel drivage.
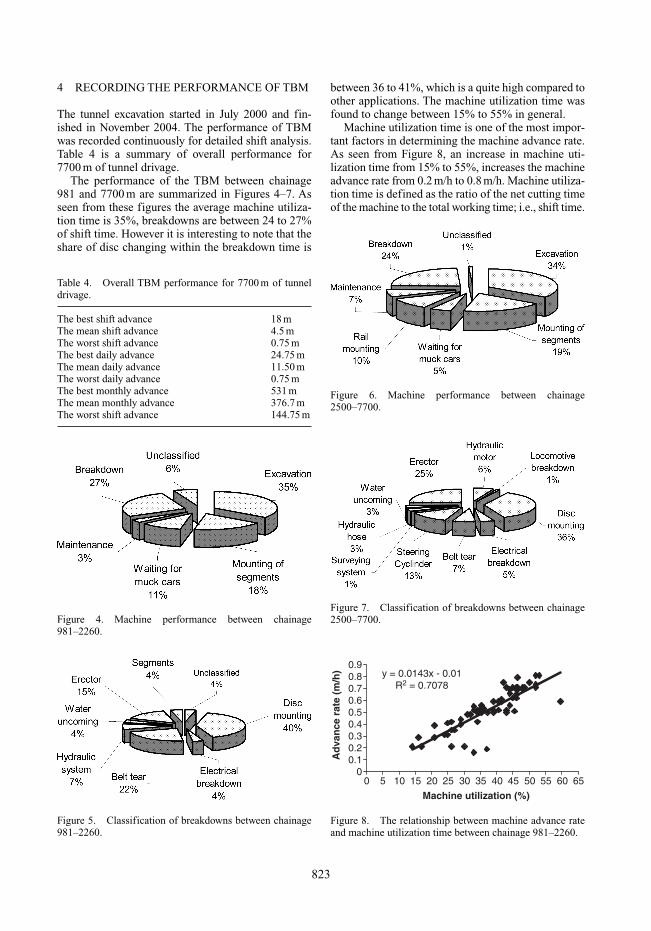
The performance of the TBM between chainage981 and 7700 m are summarized in Figures 4–7. Asseen from these figures the average machine utiliza-tion time is 35%, breakdowns are between 24 to 27%of shift time. However it is interesting to note that theshare of disc changing within the breakdown time is
between 36 to 41%, which is a quite high compared toother applications. The machine utilization time wasfound to change between 15% to 55% in general.
Machine utilization time is one of the most impor-tant factors in determining the machine advance rate.As seen from Figure 8, an increase in machine uti-lization time from 15% to 55%, increases the machineadvance rate from 0.2 m/h to 0.8 m/h. Machine utiliza-tion time is defined as the ratio of the net cutting timeof the machine to the total working time; i.e., shift time.
823
Table 4. Overall TBM performance for 7700 m of tunneldrivage.
The best shift advance 18 mThe mean shift advance 4.5 mThe worst shift advance 0.75 mThe best daily advance 24.75 mThe mean daily advance 11.50 mThe worst daily advance 0.75 mThe best monthly advance 531 mThe mean monthly advance 376.7 mThe worst shift advance 144.75 m
Figure 4. Machine performance between chainage981–2260.
Figure 5. Classification of breakdowns between chainage981–2260.
Figure 6. Machine performance between chainage2500–7700.
Figure 7. Classification of breakdowns between chainage2500–7700.
y = 0.0143x - 0.01R2 = 0.7078
00.10.20.30.40.50.60.70.80.9
0 5 10 15 20 25 30 35 40 45 50 55 60 65
Machine utilization (%)
Ad
van
ce r
ate
(m/h
)
Figure 8. The relationship between machine advance rateand machine utilization time between chainage 981–2260.
5 FULL SCALE ROCK CUTTING TESTS IN THE LABORATORY AND ESTIMATIONOF THE MACHINE CUTTING RATE
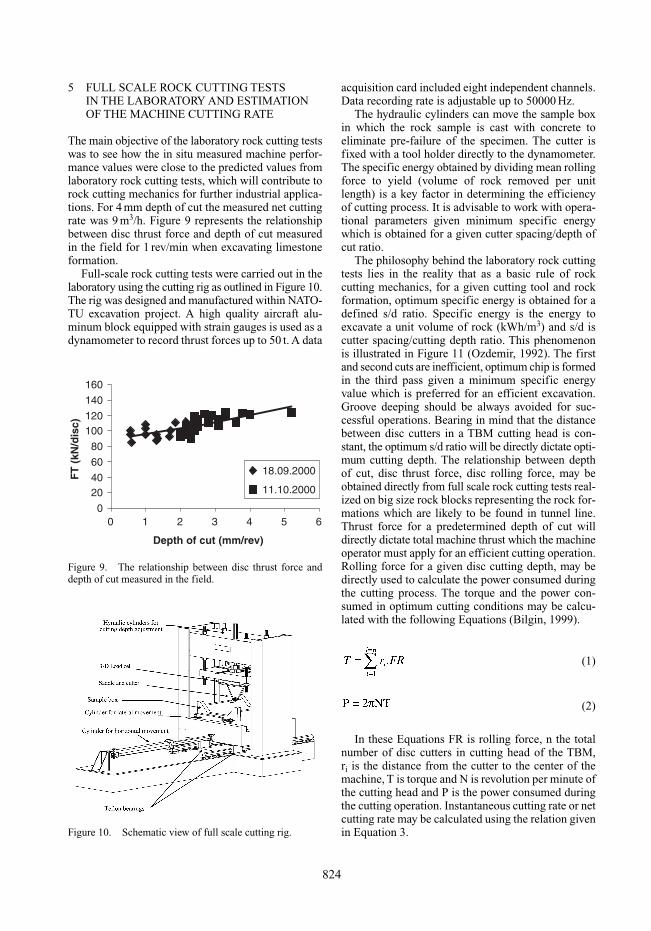
The main objective of the laboratory rock cutting testswas to see how the in situ measured machine perfor-mance values were close to the predicted values fromlaboratory rock cutting tests, which will contribute torock cutting mechanics for further industrial applica-tions. For 4 mm depth of cut the measured net cuttingrate was 9 m3/h. Figure 9 represents the relationshipbetween disc thrust force and depth of cut measuredin the field for 1 rev/min when excavating limestoneformation.
Full-scale rock cutting tests were carried out in thelaboratory using the cutting rig as outlined in Figure 10.The rig was designed and manufactured within NATO-TU excavation project. A high quality aircraft alu-minum block equipped with strain gauges is used as adynamometer to record thrust forces up to 50 t. A data
acquisition card included eight independent channels.Data recording rate is adjustable up to 50000 Hz.
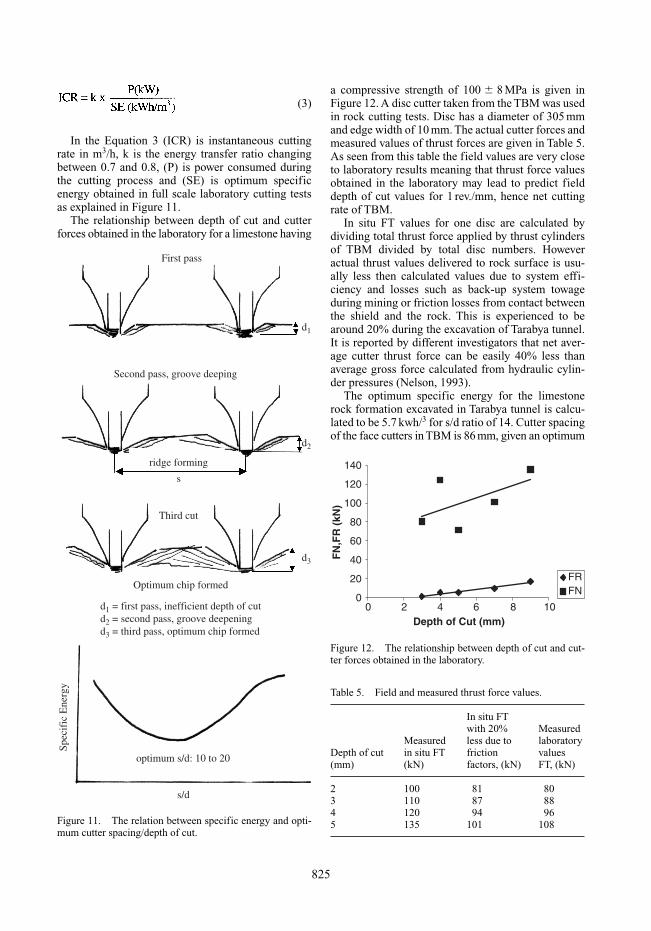
The hydraulic cylinders can move the sample boxin which the rock sample is cast with concrete toeliminate pre-failure of the specimen. The cutter isfixed with a tool holder directly to the dynamometer.The specific energy obtained by dividing mean rollingforce to yield (volume of rock removed per unitlength) is a key factor in determining the efficiency of cutting process. It is advisable to work with opera-tional parameters given minimum specific energywhich is obtained for a given cutter spacing/depth ofcut ratio.
The philosophy behind the laboratory rock cuttingtests lies in the reality that as a basic rule of rock cutting mechanics, for a given cutting tool and rockformation, optimum specific energy is obtained for adefined s/d ratio. Specific energy is the energy toexcavate a unit volume of rock (kWh/m3) and s/d iscutter spacing/cutting depth ratio. This phenomenonis illustrated in Figure 11 (Ozdemir, 1992). The firstand second cuts are inefficient, optimum chip is formedin the third pass given a minimum specific energyvalue which is preferred for an efficient excavation.Groove deeping should be always avoided for suc-cessful operations. Bearing in mind that the distancebetween disc cutters in a TBM cutting head is con-stant, the optimum s/d ratio will be directly dictate opti-mum cutting depth. The relationship between depth of cut, disc thrust force, disc rolling force, may beobtained directly from full scale rock cutting tests real-ized on big size rock blocks representing the rock for-mations which are likely to be found in tunnel line.Thrust force for a predetermined depth of cut willdirectly dictate total machine thrust which the machineoperator must apply for an efficient cutting operation.Rolling force for a given disc cutting depth, may bedirectly used to calculate the power consumed duringthe cutting process. The torque and the power con-sumed in optimum cutting conditions may be calcu-lated with the following Equations (Bilgin, 1999).
(1)
(2)
In these Equations FR is rolling force, n the totalnumber of disc cutters in cutting head of the TBM, ri is the distance from the cutter to the center of themachine, T is torque and N is revolution per minute ofthe cutting head and P is the power consumed duringthe cutting operation. Instantaneous cutting rate or netcutting rate may be calculated using the relation givenin Equation 3.
824
0
2040
60
80
100120
140
160
0 3
Depth of cut (mm/rev)
FT
(kN
/dis
c)
18.09.2000
11.10.2000
1 2 4 5 6
Figure 9. The relationship between disc thrust force anddepth of cut measured in the field.
Figure 10. Schematic view of full scale cutting rig.
(3)
In the Equation 3 (ICR) is instantaneous cuttingrate in m3/h, k is the energy transfer ratio changingbetween 0.7 and 0.8, (P) is power consumed duringthe cutting process and (SE) is optimum specificenergy obtained in full scale laboratory cutting testsas explained in Figure 11.
The relationship between depth of cut and cutterforces obtained in the laboratory for a limestone having
a compressive strength of 100 � 8 MPa is given inFigure 12. A disc cutter taken from the TBM was usedin rock cutting tests. Disc has a diameter of 305 mmand edge width of 10 mm. The actual cutter forces andmeasured values of thrust forces are given in Table 5.As seen from this table the field values are very closeto laboratory results meaning that thrust force valuesobtained in the laboratory may lead to predict fielddepth of cut values for 1 rev./mm, hence net cuttingrate of TBM.
In situ FT values for one disc are calculated bydividing total thrust force applied by thrust cylindersof TBM divided by total disc numbers. Howeveractual thrust values delivered to rock surface is usu-ally less then calculated values due to system effi-ciency and losses such as back-up system towageduring mining or friction losses from contact betweenthe shield and the rock. This is experienced to bearound 20% during the excavation of Tarabya tunnel.It is reported by different investigators that net aver-age cutter thrust force can be easily 40% less thanaverage gross force calculated from hydraulic cylin-der pressures (Nelson, 1993).
The optimum specific energy for the limestonerock formation excavated in Tarabya tunnel is calcu-lated to be 5.7 kwh/3 for s/d ratio of 14. Cutter spacingof the face cutters in TBM is 86 mm, given an optimum
825
d3
Third cut
Optimum chip formed
d1 = first pass, inefficient depth of cutd2 = second pass, groove deepeningd3 = third pass, optimum chip formed
First pass
d1
Second pass, groove deeping
ridge forming
d2
s
Spec
ific
Ene
rgy
optimum s/d: 10 to 20
s/d
Figure 11. The relation between specific energy and opti-mum cutter spacing/depth of cut.
0
20
40
60
80
100
120
140
0 6 10Depth of Cut (mm)
FN
,FR
(kN
)
FRFN
2 4 8
Figure 12. The relationship between depth of cut and cut-ter forces obtained in the laboratory.
Table 5. Field and measured thrust force values.
In situ FTwith 20% Measured
Measured less due to laboratoryDepth of cut in situ FT friction values(mm) (kN) factors, (kN) FT, (kN)
2 100 81 803 110 87 884 120 94 965 135 101 108
depth of cut of 6 mm. Rolling force FR for one discfor 6 mm depth of cut is calculated to be 9.82 kN fromFigure 12. The torque and the cutting power for opti-mum depth of cut are calculated using equation 1 and 2as 142.4 kNm and 239 kW consecutively. In optimumcutting condition instantaneous cutting rate of the TBMmay be calculated using equation 3 as given below.
Optimum thrust force for one disc cutter fromFigure 12 is found to be 10.8 t Optimum thrust forcethat TBM operator should apply taking into accountthe 20% friction losses;
In field, during the excavation of Tarabya tunnelthe instantaneous cutting rate of 33.5 m/h was obtainedduring some shifts.
6 CONCLUSION
Tunnel excavation in Tarabya started in July 2000 andfinished in November 2004. The main rock formationexcavated were Paleozoic aged sedimentary rocks,
limestone, sandstone – siltstone and andasite dykes.The mean monthly advance rate of 377 m was obtainedwith a machine utilization time of 35%. It is shown thatlaboratory full-scale cutting tests may serve as a use-ful guide for an efficient excavation. It is shown thatoptimum cutting conditions were obtained using a totalmachine thrust force of 259 t given an optimum discpenetration of 6 mm/revolution.
7 ACKNOWLEDGEMENT
The authors are grateful to Tinsa – Öztas –Hazinedaroglu – Simelko consortium given access tofield data and Prof.Dr. Levent Ozdemir from CSM,USA for helping to construct laboratory facilities.
REFERENCES
Bilgin N. et al. 1999. The Performance Prediction of a TBMin Tuzla-Dragos Sewerage Tunnel. In: T.Allen et al. (eds).The World Tunnel Congress, Oslo 31 May 3 June:817–822, Rotterdam: Balkema.
Bilgin N. et al. 1999. The Performance Prediction of a TBMin Difficult Ground Condition. AFTES-Journees d’EtudesInternationales de Paris, 25–28 October, 115–121.
Nelson P. 1993. TBM Performance Analysis with Referenceto Rock Properties, Mechanized Excavation. In: J.A. Hudson (ed). Comprehensive Rock Engineering 4: 27.
Ozdemir L. 1992. Short Course Notes. Mechanical Excava-tion Techniques in Underground Construction, 2 Volumes,ITU Faculty of Mines.
826