Embed Size (px)
DESCRIPTION
Oil Industry Q1 2015
Citation preview
© 2014 Erik Townsend – www.eriktownsend.com Page 1
THE PEAK OIL INVESTOR
First Quarter 2015 – Written March 8, 2015
In this issue… Since the last issue… Understanding the Baker Hughes Rig Count Crude Oil Market Outlook Tank storage, Floating storage, and Waiting storage This is Ground Control to David Rosenberg! Trading Strategies
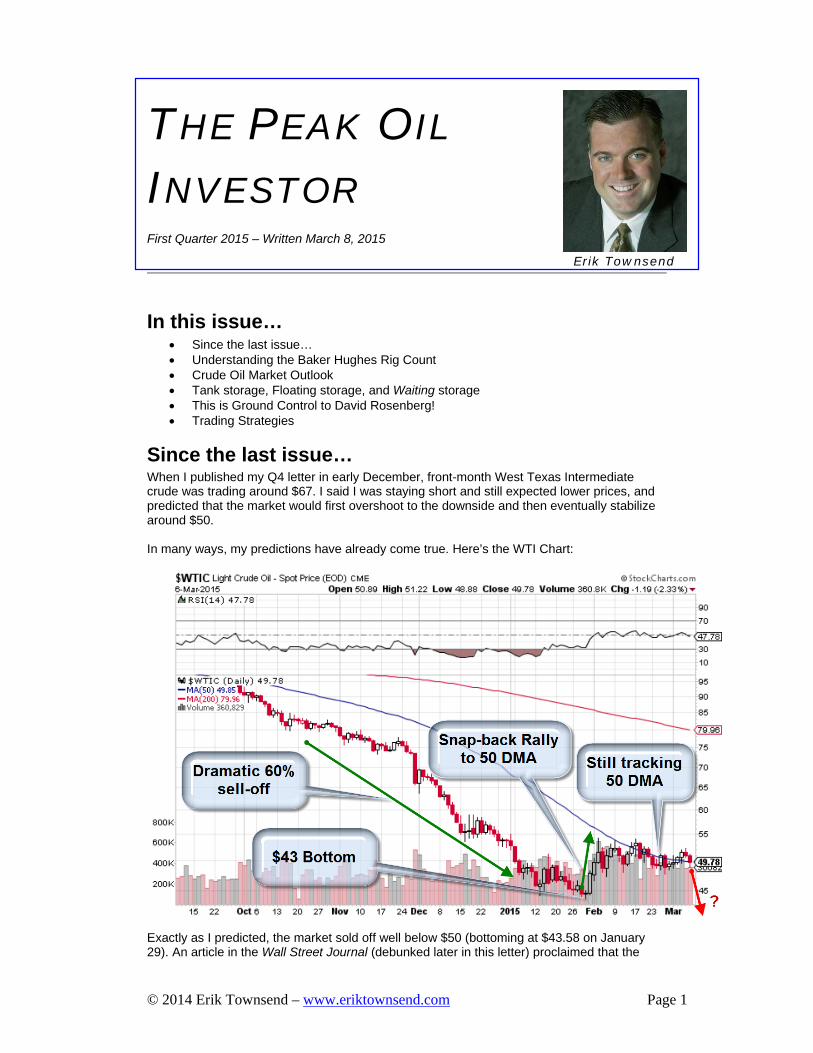
Since the last issue… When I published my Q4 letter in early December, front-month West Texas Intermediate crude was trading around $67. I said I was staying short and still expected lower prices, and predicted that the market would first overshoot to the downside and then eventually stabilize around $50. In many ways, my predictions have already come true. Here’s the WTI Chart:
Exactly as I predicted, the market sold off well below $50 (bottoming at $43.58 on January 29). An article in the Wall Street Journal (debunked later in this letter) proclaimed that the
Erik Townsend
© 2014 Erik Townsend – www.eriktownsend.com Page 2
Baker Hughes rig count released on that day portended a recovery in prices, and that article appears to have been the primary catalyst to spark a snap-back rally to the 50-day moving average. In just 3 days WTI climbed all the way back to $54, nearly a 24% rally from the intraday low on Jan. 29th. The market is now consolidating along its 50-DMA line, which has turned almost flat at just under $50/bbl. In many ways it would appear that I called it perfectly, and that the bottom is now in at $43.58, and we might expect the market to only go up from here. But I don’t think so. The Jan 29th low came too early to be the final low. All the production estimates I’ve seen suggest that U.S. production will peak around April or May. We’re still seeing huge inventory builds every week, and there’s a very real risk of running out of on-land storage capacity. The alternative is floating storage (tanker ships chartered for the purpose of storing rather than transporting oil), but to really make that alternative viable, we’d need a steeper 1-year contango in the market, meaning either the front month has farther to sell off or the back months are going to rally first, ahead of the front months, widening the contango spread. I think the former is far more likely, and my expectation is that the final low will be below $40 sometime later in March or in April. I could be wrong and the bottom may already be in, but I doubt it.
Understanding the Baker Hughes Rig Count It never ceases to amaze me how ridiculously incorrect ideas can move markets when the right person or publication says them. In the case of the 24% 3-day rally off the Jan. 29th lows, the principal catalyst for the move appears to have been the Wall Street Journal’s proclamation that the Baker Hughes Rig Count report had been exceptionally soft. WSJ’s “analysis” concluded that less new oil wells means less oil production, and therefore, prices should be expected to recover. Sure enough, the Baker Hughes rig count became the buzzword de jure in all the financial media for the next few days, and prices rocketed back up to key resistance at their 50-day moving average. At risk of confusing the WSJ story with actual relevant facts, that was actually the 7th soft weekly rig count report in a row, and all the prior soft rig count reports had resulted in an acceleration of the downward sell-off in oil prices! But now, suddenly, the exact same bit of information suddenly had the exact opposite meaning it had for the previous 6 weeks in a row! Why? Because The Wall Street Journal said it. Then it went viral. I even heard one of the “journalists” on a financial cable channel proclaim “The rig count is way down and that means they’re starting to cap producing wells!” Hello? Is it really possible that we live in a world where the financial media are so categorically incompetent? First of all, the rig count refers to drilling rigs that are drilling new oil wells. Assuming we’re talking about “tight oil” wells that rely on multi-stage hydraulic fracturing to release the oil from the rock, those wells still have to be completed after they are drilled, and the fracking process is a big job. Drilling rigs operating today are creating new shale oil wells that won’t begin actually producing oil for at least 6 months. This has absolutely nothing to do with “capping wells” as the cable TV anchor put it. (The industry jargon for what he was talking about would be shutting in producing wells, and that’s not happening yet). The reason the rapidly declining rig count is actually a bearish indication (yes, the esteemed Wall Street Journal got it exactly backwards) is that it indicates that oil exploration and production companies (who presumably have the best data) know this supply glut is not over yet. If they thought it was over, they wouldn’t be scuttling their projects and writing off losses on deposits already paid to the rig operators. The WSJ’s thesis that a reduction in rig count portends lower future oil production and therefore higher prices is not entirely without merit. That’s exactly what we should expect 6 to 12 months into the future. A reasonable way to have interpreted the soft Baker Hughes rig count print would have been to predict crude oil futures for delivery months 6-12 months into the future to go up in price, as near-dated contracts simultaneously continue to fall in price because the supply glut is being caused by wells already in production that won’t be shut in
© 2014 Erik Townsend – www.eriktownsend.com Page 3
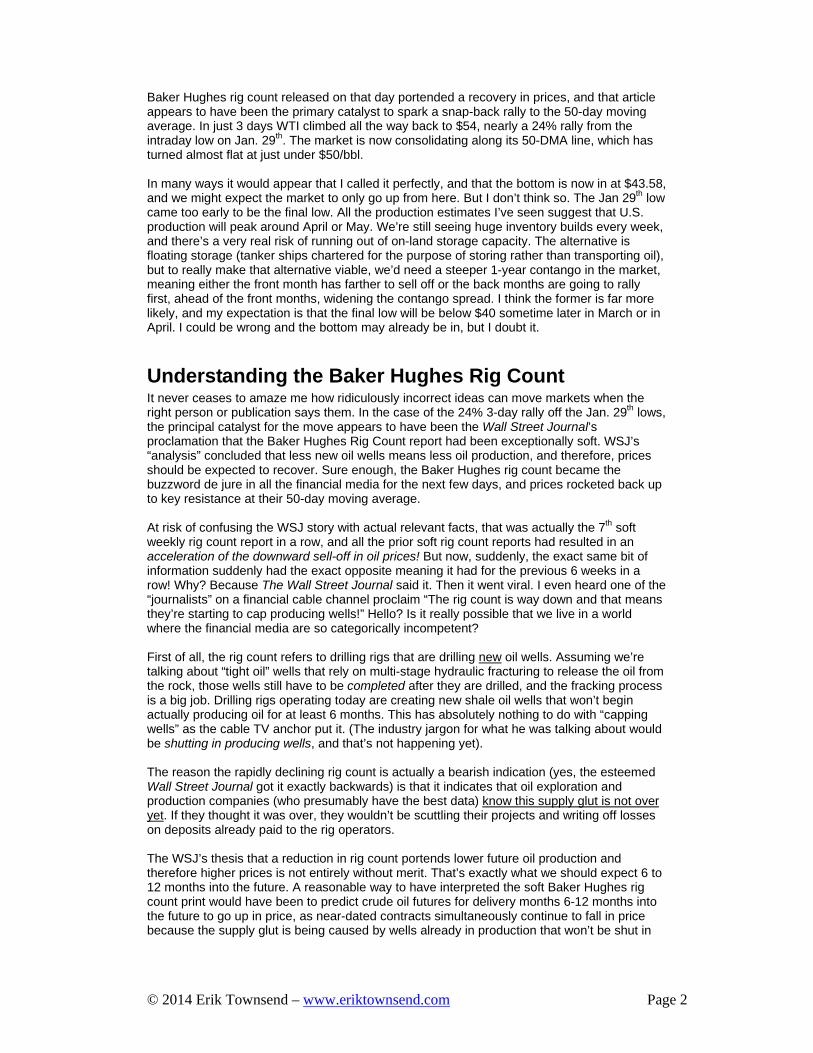
unless prices drop below the cash cost of production, which is approximately $35 for the median shale operator. The way you would test the hypothesis posited by WSJ would be to look at the 1-year contango spread, meaning the difference in price between the near delivery month and the same month of the following year. That spread actually contracted on Jan. 29th, directly refuting WSJ’s hypothesis. If only WSJ had the sophistication to do their homework! More to the point, the WSJ analysis focused on the wrong question. The excess of U.S. production is coming from wells already in production. It’s true that laying down of drilling rigs (lower rig count) will prevent that problem from being made even worse in the future, but so far as resolving the current supply glut dilemma, the rig count isn’t what’s important. What matters is what options exist to deal with the excess oil being produced from wells already in production. Thanks to the very steep decline rates associated with tight oil plays, that supply imbalance won’t last forever if the drilling rigs are laid down, which is clearly happening. But the data I’ve seen suggest we still have a couple more months of increasing production and we’re already producing more than we’re consuming. Where does the extra oil go? It has to be stored. Fortunately, as of last summer we were operating at near record-low inventory levels in the U.S., so only a few months ago we had plenty of room to store a whole lot of oil. But no more:
As of February 20th, we were at 60% capacity nation-wide, and growing rapidly. There was just less than 200 million barrels of remaining storage capacity. When we consider that the excess of supply over demand is about 1 million barrels per day, it would seem that we have almost 200 days, or about 6 months, before the tanks fill up and more expensive floating storage becomes the only viable alternative. But there’s more to the story than that. A popular trading strategy sometimes called collateral mining goes like this: A big institutional player doesn’t want to speculate or take any market risk. They only want a sure bet. So they buy a lot of physical crude oil. Not futures contracts, but actual physical oil that they pay to store in tanks in Cushing, Oklahoma. For sake of argument, let’s say they bought 10 million barrels of oil, using up about 5% of the remaining storage capacity. They don’t want to take any market risk, so they go short 10,000 front-month futures contracts. The two positions exactly balance out (long 10 million barrels physical, and short 10 million barrels worth of futures contracts), so they have no market risk. But here’s the trick: When that front month futures contract expires, they have to roll their short (hedge) position forward to the next delivery month. Let’s say they were short the April contract, and roll to the May contract. Well guess what? We’re seeing record 1-2 spread contango right now. That’s just a fancy way to say that the

© 2014 Erik Townsend – www.eriktownsend.com Page 4
May contract is priced more than $2 higher that the April contract. So they get to cover their hedge at one price and simultaneously put it back on in the next delivery contract by selling $2 higher. That $2 difference is pure profit (it’s called contango yield) to the investor! Hey wait a minute, can that really be true? $2/bbl on barrels priced around $50 is a 4% return in one month! And this is a “risk-free” trade because the position is fully hedged. The investor has to pay storage costs for the oil sitting in a tank in Cushing, but the storage fee is way less than the contango yield, and he still enjoys a double-digit annualized risk-free return. Sound too good to be true? It really is true, but it won’t last long. Eventually the market will stabilize and we won’t have $2+ contango on the front-month futures spread. But for now, yes, this trade really is possible. More to the point, it’s irresistible to those with deep enough pockets to put it on in size, so we should expect them to pile into the trade as fast as they can. Using up the remaining storage capacity as they do. My point is simply that we don’t necessarily have 6 months before storage fills up, as many analysts have concluded from the degree of oversupply and the number of barrels of storage capacity still remaining. There is a very strong economic incentive for investors who are sufficiently sophisticated (and capitalized) to buy all the physical crude they can get their hands on, store it, and make a killing on the contango yield for as long as it lasts. Some day the contango will disappear and they’ll just deliver the oil into the short contract they’re already holding rather than rolling it. But until then, they’re making a killing. How is that possible? Where does all this risk-free money they’re making actually come from? The answer is out of your pocket if you’re not careful. I’ll explain that risk in the next article below. I suspect the reason we’re suddenly seeing 10+ million barrel weekly inventory builds is precisely because this exact trade is being put on by the biggest investment banks and hedge funds. They’re a very enterprising lot, and it won’t surprise me if they manage to fill up substantially all of the storage tanks faster than anyone expects. What happens if they do? The front month price gets pushed WAY down because there’s no place to put the oil. And what does that mean? A wider 1-2 (first to second delivery month) spread, and an even higher contango yield for the bankers! A final point on the rig count: Tight oil plays are a two-part process. The first step is to drill the well, and that’s what the [drilling] rig count tells us: how many drilling rigs are drilling new wells. The next step is to hydraulically fracture the newly drilled well. At first it might seem this is just the next logical step, and the drilling rig count and fracking crew count must be identical. Not true! Quite a few drilled wells have not been completed, and there is now a huge frack-log of drilled wells that have not yet been completed (fracked). A lot of people are talking about the rig count as if it’s a measure of how many new wells are about to start producing, and this just isn’t true. It’s not until those drilled wells are completed that they can be placed into production, and there are now 3,000+ drilled wells that operators have deferred completion on. See Tank Storage, Floating Storage, and Waiting Storage later in this issue for more perspective on what this might mean for the market in coming months.
Crude Oil Market Outlook Ok, so what does all this mean and what can we expect from here? My guess is that the bottom isn’t yet in. Admittedly, I thought the snap-back to the 50-DMA would only last a couple of days, and that prices would promptly roll back over to new lower lows. So far that hasn’t happened, as the media have been obsessed with “the bottom is in” calls. But the supply-demand dynamics just don’t support a bottom here. My forecast is that prices should soon move considerably lower. If my prediction (in the prior article) about big hedge funds and banks piling into the collateral mining trade comes true, we could see sudden and dramatic inventory builds – possibly as high as 20mm bbl in a single week. If that happens, most market participants will incorrectly conclude that this means the supply-demand imbalance is that large, and a panic sell-off will result. Of course the supply glut isn’t really any bigger than it was last week. All that will really be happening is the bankers are setting themselves up to make a killing at the expense of
© 2014 Erik Townsend – www.eriktownsend.com Page 5
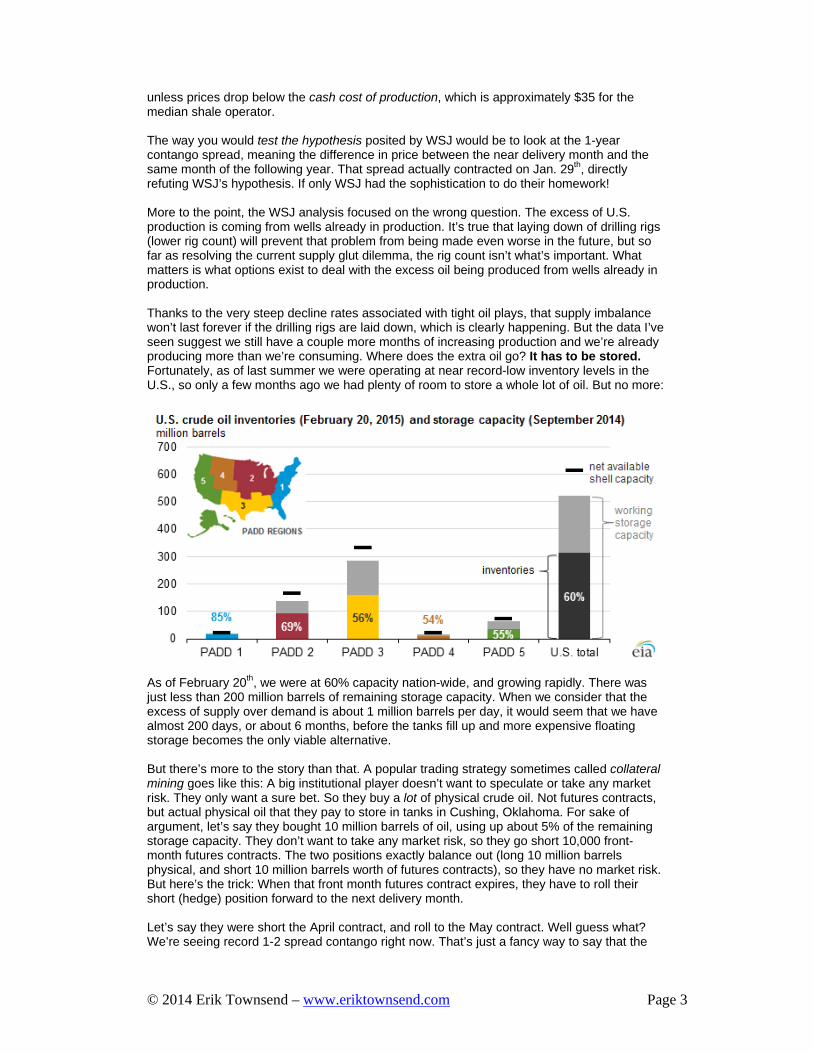
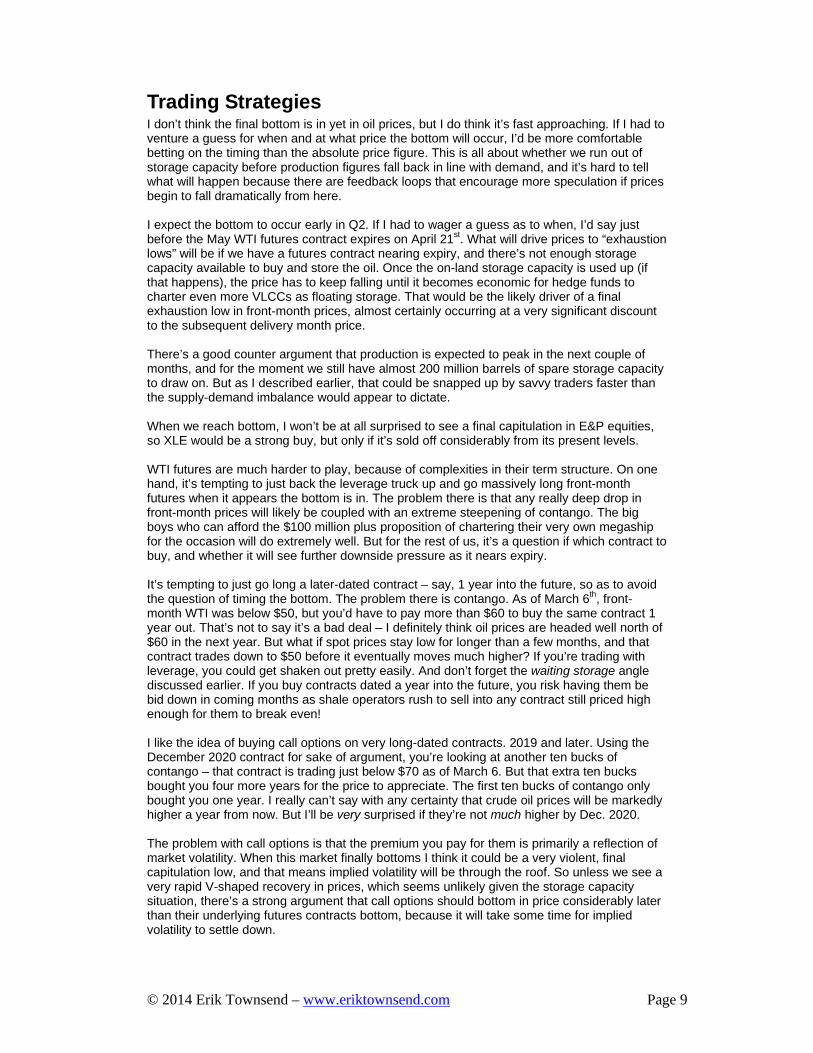
everyone else. But that’s a trick they have considerable experience with, so my confidence is high that they won’t miss this opportunity. Remember – if prices start selling off in a panic type of event, that just means that the contango in the 1-2 spread will widen even more. That increases the bankers’ profit markedly. Now, you don’t think any good upstanding banker or hedge fund manager would ever stoop so low as to make public statements that induce a panic just for the sake of making a higher risk-free return for themselves, do you? No, that sort of thing never happens… So I think the downside from here may still be considerable in terms of WTI front-month prices. But here’s the problem: What makes the most money for the bankers is a super-steepening of contango? Let’s say that sometime in April, the May WTI contract crashes all the way to $30. Holy cow, you think, this is an epic low and time to buy the USO (crude oil ETF), right? Not so fast! Where does that risk-free profit for the bankers actually come from? It’s all in the contango yield. And who pays that? The commodity ETFs like USO that hold long futures contracts and have to roll them forward every month, constantly selling low (front month) and buying high (next month) futures. In a bizarre and perverted way, the retail investor who buys USO trying to get in at the bottom is actually subsidizing the biggest banks’ and hedge funds’ risk-free returns! I think that oil E&P companies (a popular ETF for those is XLE) are likely to be the hardest hit by this. The fact that prices for oil to be delivered just a few months into the future will still be above $45 won’t enter the psyche of most investors. If we really get an epic sell-off in front month futures, the market will interpret that front-month price as the “new reality”, and the XLE could crash. That will probably be the best buying opportunity – buying E&P shares when the front-month price bottoms. The key will be to value them based on moderately longer-dated WTI futures prices rather than using the artificially depressed front month. Here’s the XLE chart as of March 6:
© 2014 Erik Townsend – www.eriktownsend.com Page 6
XLE peaked at $101.52 back in June. At $77, it’s only down 25% from its high, in a market where crude oil was down over 60% and is still 53% below its high. Right now, my sense is that “surely, the bottom must be in now” sentiment is ruling the day. If we see WTI trade well below the prior $43.58 low, as I believe is likely, I think XLE could crash in a panic sell-off. It will be a strong buy (at a much lower price) when oil prices finally bottom. Buying USO at the bottom would expose the investor to a big tracking error due to subsidizing the bankers’ contango yield. But XLE is more likely to discount the lowest front-month price as a proxy for future revenues, making it a safer play from the bottom in crude prices.
Tank Storage, Floating Storage, Waiting Storage
By now the concepts of domestic storage (meaning big tanks in the USA where crude oil can be stored) and floating storage (meaning crude oil tanker ships that can be used to store rather than transport crude oil) are understood. Guess what? We have a new kind of storage hitting the market. I’m calling it waiting to produce storage. I think it could play a big role in the term structure of WTI crude futures in coming months, and most analysts don’t yet understand it.
There are presently more than 3,000 oil wells that have been drilled but not yet completed and placed into production. At first glance, it would appear that there must be a backlog of wells awaiting completion crews to put them into production or something. But there’s more to it than that. These wells are not waiting for the completion crew to show up and start fracking. Rather, these are wells whose owners have made a conscious decision to defer completion for now.
Put yourself in the shoes of a shale oil producer. You’ve got a bunch of wells already drilled. The capex is already sunk drilling the well, so you’re darned well going to put that well into production, sooner or later. But hold on – if you rush the process and get that well up and running, producing next month, you’ll be selling into the May’15 delivery contract, which closed at $51.47 on March 6th. But look at the April 2016 contract… It closed at $60.13! So instead of selling the April’15 contract and then having to rush to produce that oil in time to deliver into that contract, you could instead sell the April’16 contract for almost ten bucks a barrel more! Then you just sit on your drilled but not yet completed well until early 2016, and take your time getting into production this time next year!
Why is this important? Again, put yourself in the shale operator’s shoes. If he sells into the April’15 contract, he’s going to have a real hard time breaking even. But if he can weather a one year delay getting into production, he can get almost 20% more for the same oil. More to the point, if he waits around to see what happens next in this market, those longer dated contracts might start dropping in price. But if he moves right now, he can start selling the longer-dated contracts that are still trading at a considerable premium (contango), and then slow down his production crew to be ready to deliver against higher prices he locked in today. For many operators, $60 is above their break-even price, but $50 isn’t!
My whole point here is that the shale operators have a strong incentive to idle already-drilled wells for a year, and start selling the long dated contracts now to take advantage of the higher prices. That means a whole lot of selling of long-dated contracts that would not otherwise occur, and that, in turn, means we can expect the steep contango in the one-year forward strip to flatten out as more shale operators figure out this opportunity.
Bottom line, for those of us who are keen to buy long-dated crude oil futures “when the market bottoms”, it will be important to monitor this trend. It may be that the longer-dated contracts bottom several weeks or months after the bottom occurs in the front-month.
This is Ground Control to David Rosenberg! I’m dumbfounded by the number of really smart people whom I respect that have all begun shaking their heads and rolling their eyes, exclaiming “How could anyone possibly think that
© 2014 Erik Townsend – www.eriktownsend.com Page 7
lower energy prices are anything but unequivocally GOOD for the economy?” David Rosenberg (for whom I have great respect) is one such voice, and there are many others. So let me try to explain it for them… Nobody I can think of is saying that lower energy prices (unto themselves) are bad for the economy. What quite a few of us are saying is that the combination of persistently high oil prices and easy money policies from the Federal Reserve over the past few years led to a massive mal-investment, to borrow a term from Austrian economics, in the shale patch. Now much lower oil prices dictate that this mal-investment in the shale patch must now be unwound. That will be the source of the coming economic damage – the unwinding of yet another financial excess funded by reckless easy money policy from central banks. Myriad tight oil projects were funded based on an economic viability analysis that assumed oil prices could never go below $75. If that sounds like it rhymes with “Housing prices could never go down across the board because they never have before”, that’s because it’s exactly the same perverted logic! In some cases, it’s actually the same individuals who created the subprime debacle who were behind the massive boom easy money lending to shale drillers in the form of junk bond issuance. Why these guys still have jobs baffles me. The common belief that lower oil prices do not threaten the shale drillers because they were hedged is a fallacy. The shale operators didn’t hedge all of their forward production. They only hedged as much as they had to in order to satisfy their bankers. And because of Fed easy money policy, lending standards were incredibly low. In some cases, they even used so-called 3-way collars, meaning that the lower end of a collar hedge is implemented by a put spread rather than an outright long put option. This means that some of these operators were hedged only down to a lower threshold, typically $60 to $75, below which it was assumed protection was not needed because it was thought that prices could never go that low. Some of these guys are now effectively unhedged, and I predict that a massive wave of junk bond defaults in the shale patch may be just over the horizon. Shale operators aren’t the only example of mal-investment that occurs as an unintended consequence of the Fed’s easy money policies. Look no farther than the Baltic Dry Index, which recently touched an all-time low. How is this possible unless the global economy literally stopped and nothing was being shipped across oceans anymore? The answer is that there’s been a massive boom in shipbuilding in recent years, thanks to central bank easy money policies. The Baltic Dry is exposing that boom for the mal-investment it truly was. How is it possible that the stock market keeps on pushing through to new all-time highs, even as macro data have been deteriorating notably in recent weeks? In my opinion, the primary driver has been share buy-back programs that serve to enrich corporate officers for running up the price of a company’s shares by buying them hand over fist with easy money borrowed in the corporate bond market thanks to the Fed’s easy money policies. But is any of this sustainable in the long term? Can this “new normal” of central bank largesse and easy credit policies continue indefinitely? And what will happen when the spigot is turned off and the easy money dries up? What will save equity market valuations when there’s no more easy money for share buyback programs? What will happen to oil prices when there’s no more easy money to fund Shale Revolution 2.0? And how will all those corporations ever service the mountain of new debt they’ve taken on to fund share buybacks in an environment where eventually, there won’t be any more easy money to keep their revenue and profits in record territory despite deteriorating macroeconomic fundamentals? I predict the next major financial crisis will not be a stock market crisis, but rather a bond market crisis. Both public and private sectors have pushed the limits of sanity with the mountain of debt they’ve taken on. Central bankers’ easy money policies are the only reason this charade has gone on as long as it has, and it can’t continue indefinitely.
© 2014 Erik Townsend – www.eriktownsend.com Page 8
The event that will eventually tie the central bankers’ hands and bring on a major crisis will be a serious inflation threat. Right now we’re awash in deflationary pressure, but throughout history, epic inflations have generally been preceded by periods of deflation. And that’s where I think we are now: basking in complacency, and foolishly believing that central banks can solve all future problems that might ever develop with the printing press. A return to historically normal interest rates would literally bankrupt the U.S. government, almost overnight. What will we do when a tidal wave of inflation eventually hits the economy? Paul Volcker himself has said recently that because of the excessive national debt, it would be completely impossible to defeat a runaway inflation by raising short-term interest rates the way he did in the early ‘80s. This can’t go on forever. At some point, we have to face the stark reality that the cause of the 2008 Financial Crisis was that the world had borrowed and spent beyond its means, and the over-financialized economy had been stretched to its limit. The policy response has been to borrow and print even more money, socializing Wall Street’s losses and permanently encumbering the public balance sheet with an unserviceable debt burden that threatens the prosperity of future generations. This is analogous to a person living beyond their means on credit cards resorting to applying for even more new credit cards so they can use cash advances on the new card to make the minimum payment on the existing accounts! This will end very badly, and any stock market crisis that may result will pale in significance to the bond market crisis that could cripple almost all Western economies. Our elected leaders are doing everything possible to make the problem worse, gaining only a delay in how long it takes before the inevitable occurs. The bigger the ship, the longer it takes to change course. And the U.S. economy is an awfully big ship. I’m astonished this has gone on for 6 years now, and I have no idea how much longer it has to play out. But eventually, we’re going to see a credit market crisis that eclipses anything we’ve ever seen before. What will be the catalyst to reverse the deflation trend and bring on a crippling wave of inflation? One possibility is that the carnage in the junk bond market from shale operator defaults could de-rail the financing for a second “shale revolution”. Oil prices could rise dramatically from below $50 to above $150 in the course of less than a year. I’m not necessarily predicting that outcome, but I think it entirely realistic, and I’m not sure the economy could survive the blow. So, Rosie, how is it that oil prices could be a bad thing for the economy? The answer is they would be a good thing if they were occurring because of a sustainable, structural condition of adequate supply to meet demand. But that’s not what we’re experiencing right now. The current rout in energy prices is an anomaly. It’s just one facet of the unorderly unwinding of mal-investment in the shale patch, which occurred primarily as an unintended consequence of central bank easy money policies. First we get the positive unintended consequence – cheaper energy prices and a boost to the economy. Next comes a junk bond market dislocation, and then eventually, much, much higher oil prices after the reality of the shale patch mal-investment is widely understood and there’s no more easy money to fund the next chapter of the shale “miracle” saga. And oh, by the way, don’t forget that the big “elephant” fields of the middle-east are already in an irreversible state of decline. We’re living in a temporary delusion that is giving us temporarily low energy prices at the probable expense of much higher energy prices a few years down the road. Yes, it’s true that there are short-term benefits to the economy from this temporary reprieve in oil prices. By the same token, heroine feels good at first. But eventually it wreaks havoc and kills the addict. The amount of junk bonds issued by the shale operators is comparable to the amount of subprime mortgage-backed securities outstanding in 2007. Whether we experience another credit contagion remains to be seen.
© 2014 Erik Townsend – www.eriktownsend.com Page 9
Trading Strategies I don’t think the final bottom is in yet in oil prices, but I do think it’s fast approaching. If I had to venture a guess for when and at what price the bottom will occur, I’d be more comfortable betting on the timing than the absolute price figure. This is all about whether we run out of storage capacity before production figures fall back in line with demand, and it’s hard to tell what will happen because there are feedback loops that encourage more speculation if prices begin to fall dramatically from here. I expect the bottom to occur early in Q2. If I had to wager a guess as to when, I’d say just before the May WTI futures contract expires on April 21st. What will drive prices to “exhaustion lows” will be if we have a futures contract nearing expiry, and there’s not enough storage capacity available to buy and store the oil. Once the on-land storage capacity is used up (if that happens), the price has to keep falling until it becomes economic for hedge funds to charter even more VLCCs as floating storage. That would be the likely driver of a final exhaustion low in front-month prices, almost certainly occurring at a very significant discount to the subsequent delivery month price. There’s a good counter argument that production is expected to peak in the next couple of months, and for the moment we still have almost 200 million barrels of spare storage capacity to draw on. But as I described earlier, that could be snapped up by savvy traders faster than the supply-demand imbalance would appear to dictate. When we reach bottom, I won’t be at all surprised to see a final capitulation in E&P equities, so XLE would be a strong buy, but only if it’s sold off considerably from its present levels. WTI futures are much harder to play, because of complexities in their term structure. On one hand, it’s tempting to just back the leverage truck up and go massively long front-month futures when it appears the bottom is in. The problem there is that any really deep drop in front-month prices will likely be coupled with an extreme steepening of contango. The big boys who can afford the $100 million plus proposition of chartering their very own megaship for the occasion will do extremely well. But for the rest of us, it’s a question if which contract to buy, and whether it will see further downside pressure as it nears expiry. It’s tempting to just go long a later-dated contract – say, 1 year into the future, so as to avoid the question of timing the bottom. The problem there is contango. As of March 6th, front-month WTI was below $50, but you’d have to pay more than $60 to buy the same contract 1 year out. That’s not to say it’s a bad deal – I definitely think oil prices are headed well north of $60 in the next year. But what if spot prices stay low for longer than a few months, and that contract trades down to $50 before it eventually moves much higher? If you’re trading with leverage, you could get shaken out pretty easily. And don’t forget the waiting storage angle discussed earlier. If you buy contracts dated a year into the future, you risk having them be bid down in coming months as shale operators rush to sell into any contract still priced high enough for them to break even! I like the idea of buying call options on very long-dated contracts. 2019 and later. Using the December 2020 contract for sake of argument, you’re looking at another ten bucks of contango – that contract is trading just below $70 as of March 6. But that extra ten bucks bought you four more years for the price to appreciate. The first ten bucks of contango only bought you one year. I really can’t say with any certainty that crude oil prices will be markedly higher a year from now. But I’ll be very surprised if they’re not much higher by Dec. 2020. The problem with call options is that the premium you pay for them is primarily a reflection of market volatility. When this market finally bottoms I think it could be a very violent, final capitulation low, and that means implied volatility will be through the roof. So unless we see a very rapid V-shaped recovery in prices, which seems unlikely given the storage capacity situation, there’s a strong argument that call options should bottom in price considerably later than their underlying futures contracts bottom, because it will take some time for implied volatility to settle down.
© 2014 Erik Townsend – www.eriktownsend.com Page 10
The bottom line here is that this could be a really messy process, and you need to anticipate some volatility. The moment when the ultimate low front-month price occurs is not the same as the moment when longer-dated contracts bottom, and buying front-month exposure with the intention of rolling it forward as it nears expiry invites the risk of having to subsidize a really fat contango yield for the bankers who put on the collateral mining trade. In short, there’s no free lunch and “getting in at the bottom” will be a real challenge, even for traders who correctly gauge when the final bottom is in for crude oil prices. For anyone other than professional traders who have their finger on the pulse of the market all day long, I think the most prudent course of action would be to start dollar cost-averaging into ETFs like XLE and OIH beginning in April, reaching your full target allocation by June. That’s my best guess for the window of time during which the bottom is most likely to occur, assuming it hasn’t already.
IMPORTANT DISCLAIMER Erik Townsend is not a Registered Investment Advisor, nor is he a Broker Dealer. Nothing in this letter should be construed as investment advice. This information is presented for entertainment and informational purposes only. Always consult a licensed investment professional before making important investment decisions.