Embed Size (px)
Citation preview

Pearson Edexcel GCSE (9-1) Sciences Term 1 detailed summer planning document
From September each lessons in the Year 9 Free Teaching and Learning Support will be supported by:
1 x detailed lesson plan
1 x powerpoint with learning outcomes
1 x knowledge retention quick fire quiz
1 x practical worksheet with student instructions
1 x student book spread (sample booklets will be printed)
1 x digital resource (video, animation, interactive)
Checkpoint teaching and learning support (3 x worksheets, 1 x powerpoint)
2 x differentiated homework worksheets
1 x set of answers
In addition there will be short End of Term summative tests.
To sign up for the free support materials please click here.
This planning document summarises the lesson ideas contained in the Edexcel GCSE (9-1) Year 9 Free Teaching and Learning Support for
September 2015. It also details the practical activities in the free support and the equipment needed to run them. Core practicals are in italics.
Please note: Resources and lesson ideas are awaiting endorsement by Edexcel. The specification is the advanced specification published by Edexcel.
© Pearson Education Ltd 2015. Copying permitted for registered institution only. This material is not copyright free.
Biology Spec points covered Starter options Practical activity Teacher-led activity
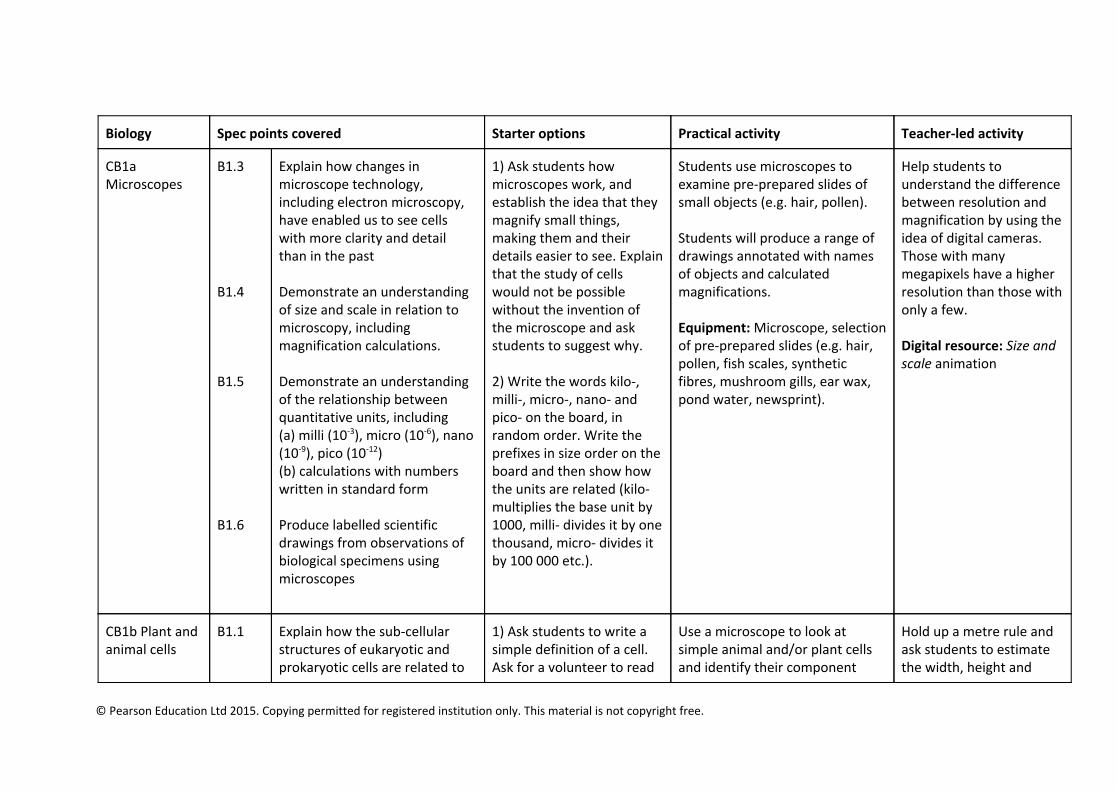
CB1a Microscopes
B1.3 B1.4 B1.5 B1.6
Explain how changes in microscope technology, including electron microscopy, have enabled us to see cells with more clarity and detail than in the past Demonstrate an understanding of size and scale in relation to microscopy, including magnification calculations. Demonstrate an understanding of the relationship between quantitative units, including (a) milli (10-3), micro (10-6), nano (10-9), pico (10-12) (b) calculations with numbers written in standard form Produce labelled scientific drawings from observations of biological specimens using microscopes
1) Ask students how microscopes work, and establish the idea that they magnify small things, making them and their details easier to see. Explain that the study of cells would not be possible without the invention of the microscope and ask students to suggest why. 2) Write the words kilo-, milli-, micro-, nano- and pico- on the board, in random order. Write the prefixes in size order on the board and then show how the units are related (kilo- multiplies the base unit by 1000, milli- divides it by one thousand, micro- divides it by 100 000 etc.).
Students use microscopes to examine pre-prepared slides of small objects (e.g. hair, pollen). Students will produce a range of drawings annotated with names of objects and calculated magnifications. Equipment: Microscope, selection of pre-prepared slides (e.g. hair, pollen, fish scales, synthetic fibres, mushroom gills, ear wax, pond water, newsprint).
Help students to understand the difference between resolution and magnification by using the idea of digital cameras. Those with many megapixels have a higher resolution than those with only a few. Digital resource: Size and scale animation
CB1b Plant and animal cells
B1.1
Explain how the sub-cellular structures of eukaryotic and prokaryotic cells are related to
1) Ask students to write a simple definition of a cell. Ask for a volunteer to read
Use a microscope to look at simple animal and/or plant cells and identify their component
Hold up a metre rule and ask students to estimate the width, height and
© Pearson Education Ltd 2015. Copying permitted for registered institution only. This material is not copyright free.
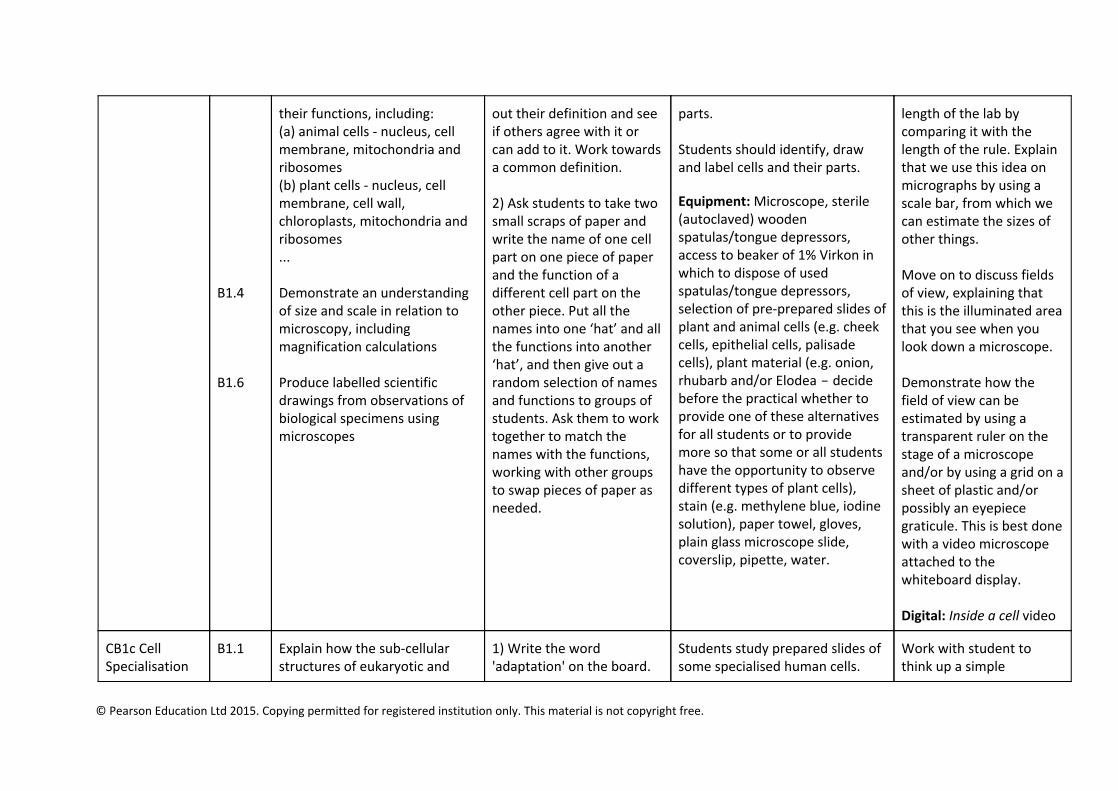
B1.4 B1.6
their functions, including: (a) animal cells - nucleus, cell membrane, mitochondria and ribosomes (b) plant cells - nucleus, cell membrane, cell wall, chloroplasts, mitochondria and ribosomes ... Demonstrate an understanding of size and scale in relation to microscopy, including magnification calculations Produce labelled scientific drawings from observations of biological specimens using microscopes
out their definition and see if others agree with it or can add to it. Work towards a common definition. 2) Ask students to take two small scraps of paper and write the name of one cell part on one piece of paper and the function of a different cell part on the other piece. Put all the names into one ‘hat’ and all the functions into another ‘hat’, and then give out a random selection of names and functions to groups of students. Ask them to work together to match the names with the functions, working with other groups to swap pieces of paper as needed.
parts. Students should identify, draw and label cells and their parts.
Equipment: Microscope, sterile (autoclaved) wooden spatulas/tongue depressors, access to beaker of 1% Virkon in which to dispose of used spatulas/tongue depressors, selection of pre-prepared slides of plant and animal cells (e.g. cheek cells, epithelial cells, palisade cells), plant material (e.g. onion, rhubarb and/or Elodea − decide before the practical whether to provide one of these alternatives for all students or to provide more so that some or all students have the opportunity to observe different types of plant cells), stain (e.g. methylene blue, iodine solution), paper towel, gloves, plain glass microscope slide, coverslip, pipette, water.
length of the lab by comparing it with the length of the rule. Explain that we use this idea on micrographs by using a scale bar, from which we can estimate the sizes of other things. Move on to discuss fields of view, explaining that this is the illuminated area that you see when you look down a microscope. Demonstrate how the field of view can be estimated by using a transparent ruler on the stage of a microscope and/or by using a grid on a sheet of plastic and/or possibly an eyepiece graticule. This is best done with a video microscope attached to the whiteboard display. Digital: Inside a cell video
CB1c Cell Specialisation
B1.1
Explain how the sub-cellular structures of eukaryotic and
1) Write the word 'adaptation' on the board.
Students study prepared slides of some specialised human cells.
Work with student to think up a simple
© Pearson Education Ltd 2015. Copying permitted for registered institution only. This material is not copyright free.
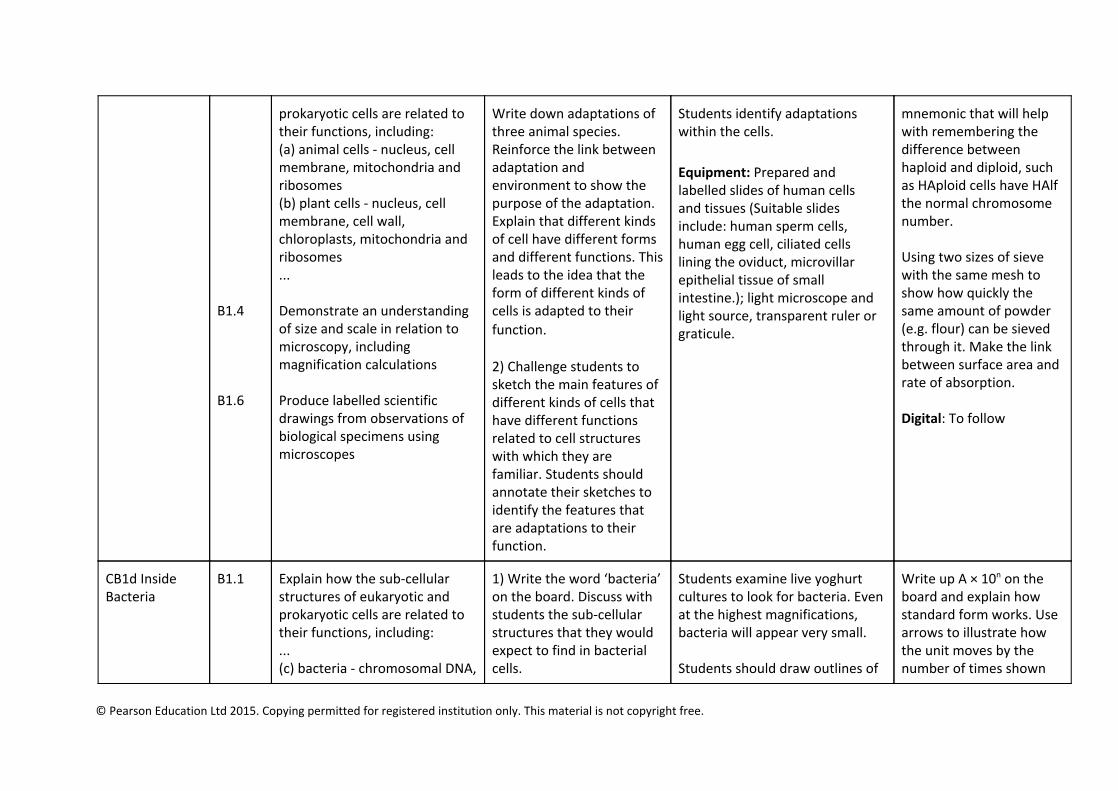
B1.4 B1.6
prokaryotic cells are related to their functions, including: (a) animal cells - nucleus, cell membrane, mitochondria and ribosomes (b) plant cells - nucleus, cell membrane, cell wall, chloroplasts, mitochondria and ribosomes ... Demonstrate an understanding of size and scale in relation to microscopy, including magnification calculations Produce labelled scientific drawings from observations of biological specimens using microscopes
Write down adaptations of three animal species. Reinforce the link between adaptation and environment to show the purpose of the adaptation. Explain that different kinds of cell have different forms and different functions. This leads to the idea that the form of different kinds of cells is adapted to their function. 2) Challenge students to sketch the main features of different kinds of cells that have different functions related to cell structures with which they are familiar. Students should annotate their sketches to identify the features that are adaptations to their function.
Students identify adaptations within the cells.
Equipment: Prepared and labelled slides of human cells and tissues (Suitable slides include: human sperm cells, human egg cell, ciliated cells lining the oviduct, microvillar epithelial tissue of small intestine.); light microscope and light source, transparent ruler or graticule.
mnemonic that will help with remembering the difference between haploid and diploid, such as HAploid cells have HAlf the normal chromosome number. Using two sizes of sieve with the same mesh to show how quickly the same amount of powder (e.g. flour) can be sieved through it. Make the link between surface area and rate of absorption. Digital: To follow
CB1d Inside Bacteria
B1.1
Explain how the sub-cellular structures of eukaryotic and prokaryotic cells are related to their functions, including: ... (c) bacteria - chromosomal DNA,
1) Write the word ‘bacteria’ on the board. Discuss with students the sub-cellular structures that they would expect to find in bacterial cells.
Students examine live yoghurt cultures to look for bacteria. Even at the highest magnifications, bacteria will appear very small. Students should draw outlines of
Write up A × 10n on the board and explain how standard form works. Use arrows to illustrate how the unit moves by the number of times shown
© Pearson Education Ltd 2015. Copying permitted for registered institution only. This material is not copyright free.
B1.5
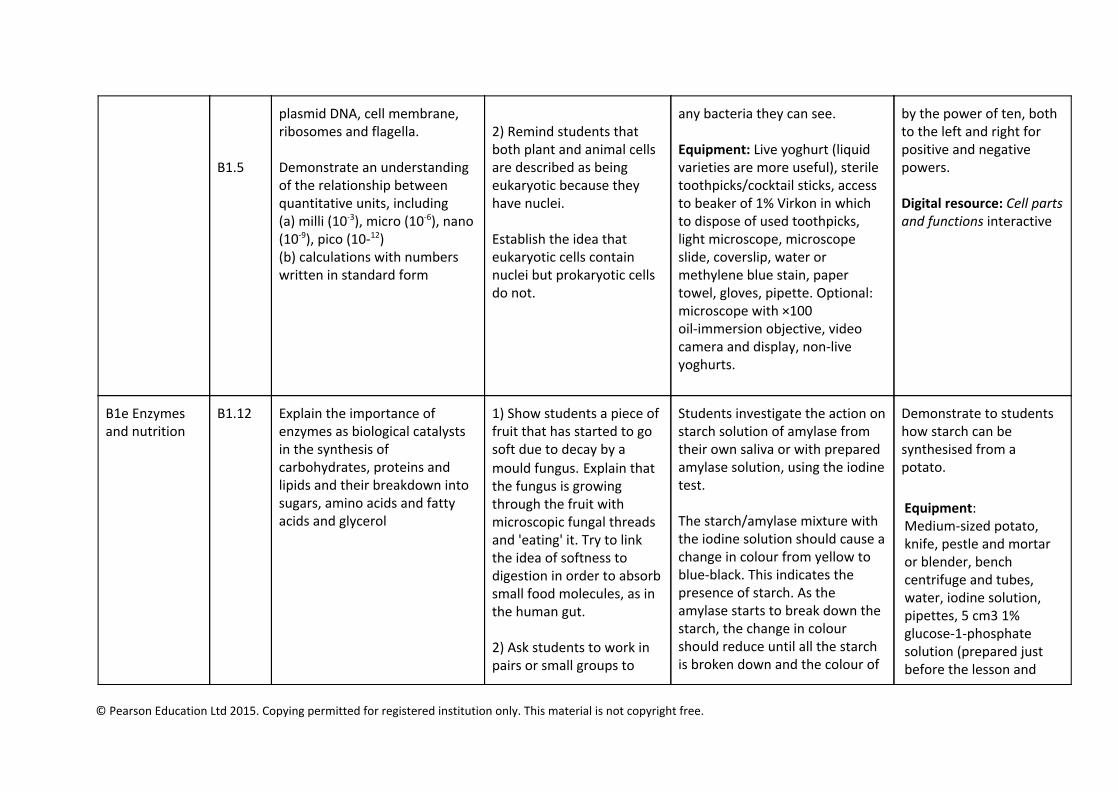
plasmid DNA, cell membrane, ribosomes and flagella. Demonstrate an understanding of the relationship between quantitative units, including (a) milli (10-3), micro (10-6), nano (10-9), pico (10-12) (b) calculations with numbers written in standard form
2) Remind students that both plant and animal cells are described as being eukaryotic because they have nuclei. Establish the idea that eukaryotic cells contain nuclei but prokaryotic cells do not.
any bacteria they can see. Equipment: Live yoghurt (liquid varieties are more useful), sterile toothpicks/cocktail sticks, access to beaker of 1% Virkon in which to dispose of used toothpicks, light microscope, microscope slide, coverslip, water or methylene blue stain, paper towel, gloves, pipette. Optional: microscope with ×100 oil-immersion objective, video camera and display, non-live yoghurts.
by the power of ten, both to the left and right for positive and negative powers. Digital resource: Cell parts and functions interactive
B1e Enzymes and nutrition
B1.12 Explain the importance of enzymes as biological catalysts in the synthesis of carbohydrates, proteins and lipids and their breakdown into sugars, amino acids and fatty acids and glycerol
1) Show students a piece of fruit that has started to go soft due to decay by a mould fungus. Explain that the fungus is growing through the fruit with microscopic fungal threads and 'eating' it. Try to link the idea of softness to digestion in order to absorb small food molecules, as in the human gut. 2) Ask students to work in pairs or small groups to
Students investigate the action on starch solution of amylase from their own saliva or with prepared amylase solution, using the iodine test. The starch/amylase mixture with the iodine solution should cause a change in colour from yellow to blue-black. This indicates the presence of starch. As the amylase starts to break down the starch, the change in colour should reduce until all the starch is broken down and the colour of
Demonstrate to students how starch can be synthesised from a potato.
Equipment: Medium-sized potato, knife, pestle and mortar or blender, bench centrifuge and tubes, water, iodine solution, pipettes, 5 cm3 1% glucose-1-phosphate solution (prepared just before the lesson and
© Pearson Education Ltd 2015. Copying permitted for registered institution only. This material is not copyright free.
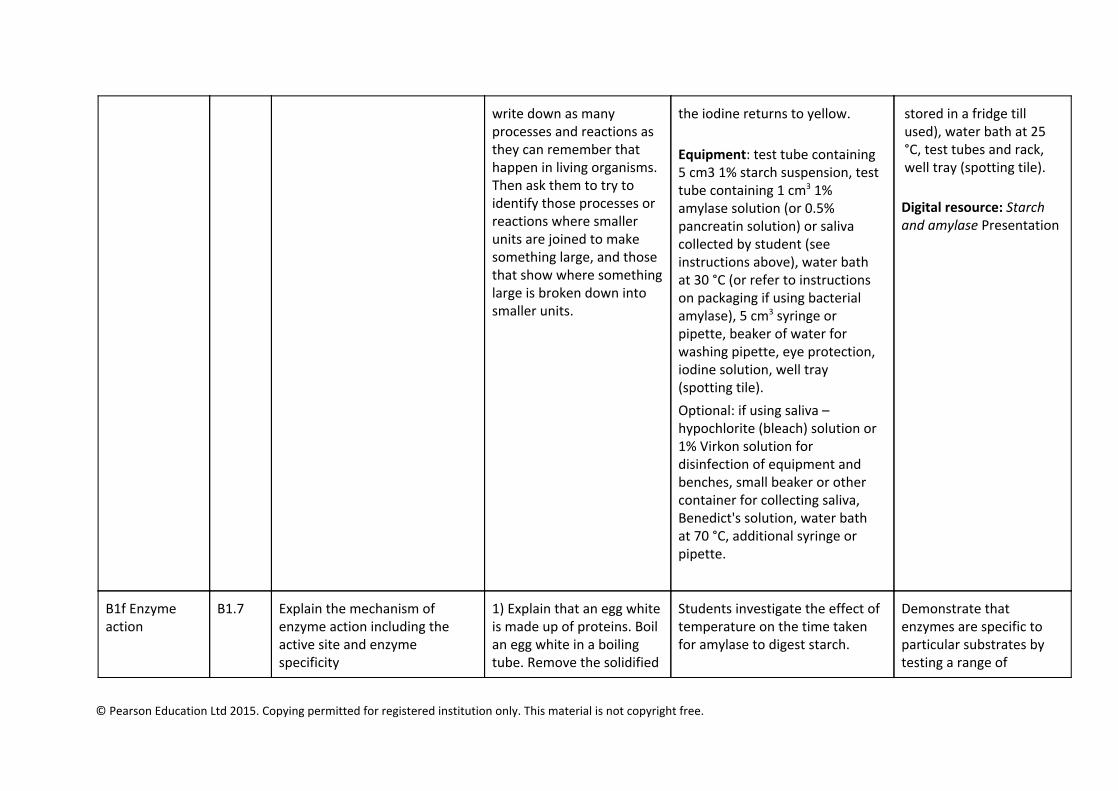
write down as many processes and reactions as they can remember that happen in living organisms. Then ask them to try to identify those processes or reactions where smaller units are joined to make something large, and those that show where something large is broken down into smaller units.
the iodine returns to yellow.
Equipment: test tube containing 5 cm3 1% starch suspension, test tube containing 1 cm3 1% amylase solution (or 0.5% pancreatin solution) or saliva collected by student (see instructions above), water bath at 30 °C (or refer to instructions on packaging if using bacterial amylase), 5 cm3 syringe or pipette, beaker of water for washing pipette, eye protection, iodine solution, well tray (spotting tile).
Optional: if using saliva – hypochlorite (bleach) solution or 1% Virkon solution for disinfection of equipment and benches, small beaker or other container for collecting saliva, Benedict's solution, water bath at 70 °C, additional syringe or pipette.
stored in a fridge till used), water bath at 25 °C, test tubes and rack, well tray (spotting tile).
Digital resource: Starch and amylase Presentation
B1f Enzyme action
B1.7
Explain the mechanism of enzyme action including the active site and enzyme specificity
1) Explain that an egg white is made up of proteins. Boil an egg white in a boiling tube. Remove the solidified
Students investigate the effect of temperature on the time taken for amylase to digest starch.
Demonstrate that enzymes are specific to particular substrates by testing a range of
© Pearson Education Ltd 2015. Copying permitted for registered institution only. This material is not copyright free.
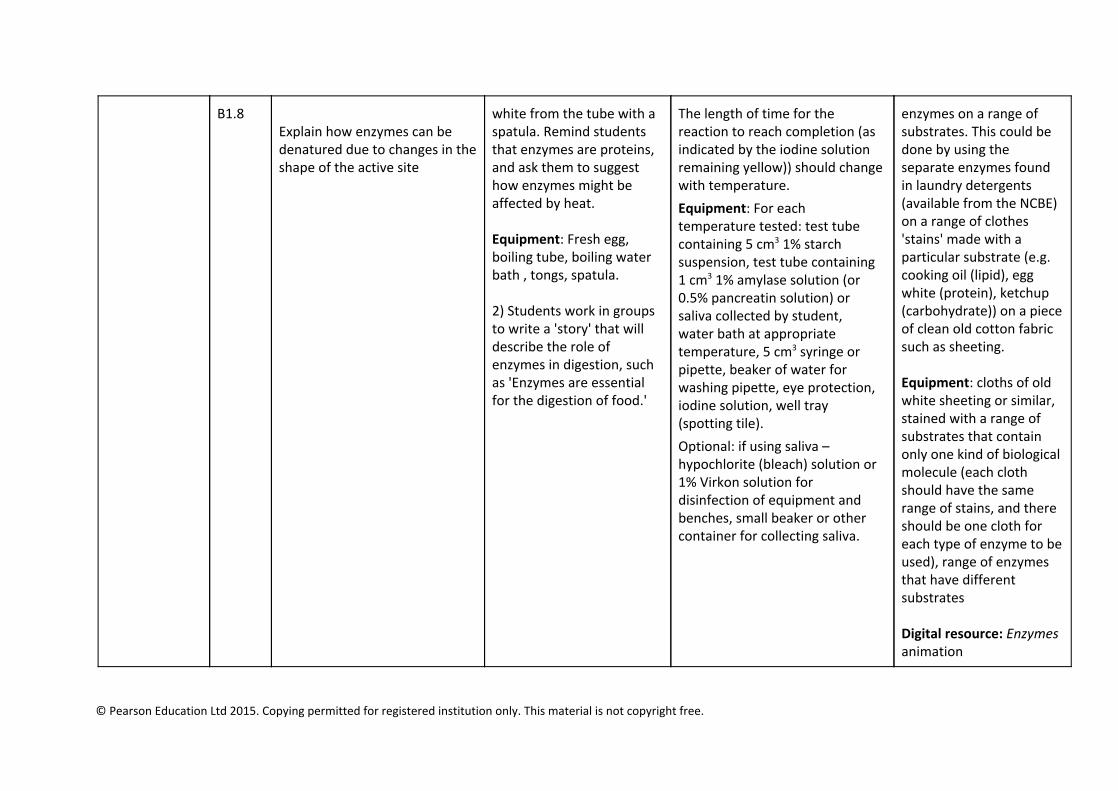
B1.8 Explain how enzymes can be denatured due to changes in the shape of the active site
white from the tube with a spatula. Remind students that enzymes are proteins, and ask them to suggest how enzymes might be affected by heat. Equipment: Fresh egg, boiling tube, boiling water bath , tongs, spatula. 2) Students work in groups to write a 'story' that will describe the role of enzymes in digestion, such as 'Enzymes are essential for the digestion of food.'
The length of time for the reaction to reach completion (as indicated by the iodine solution remaining yellow)) should change with temperature.
Equipment: For each temperature tested: test tube containing 5 cm3 1% starch suspension, test tube containing 1 cm3 1% amylase solution (or 0.5% pancreatin solution) or saliva collected by student, water bath at appropriate temperature, 5 cm3 syringe or pipette, beaker of water for washing pipette, eye protection, iodine solution, well tray (spotting tile).
Optional: if using saliva – hypochlorite (bleach) solution or 1% Virkon solution for disinfection of equipment and benches, small beaker or other container for collecting saliva.
enzymes on a range of substrates. This could be done by using the separate enzymes found in laundry detergents (available from the NCBE) on a range of clothes 'stains' made with a particular substrate (e.g. cooking oil (lipid), egg white (protein), ketchup (carbohydrate)) on a piece of clean old cotton fabric such as sheeting. Equipment: cloths of old white sheeting or similar, stained with a range of substrates that contain only one kind of biological molecule (each cloth should have the same range of stains, and there should be one cloth for each type of enzyme to be used), range of enzymes that have different substrates Digital resource: Enzymes animation
© Pearson Education Ltd 2015. Copying permitted for registered institution only. This material is not copyright free.
B1g Enzymes activity
B1.9 B1.11 B1.10
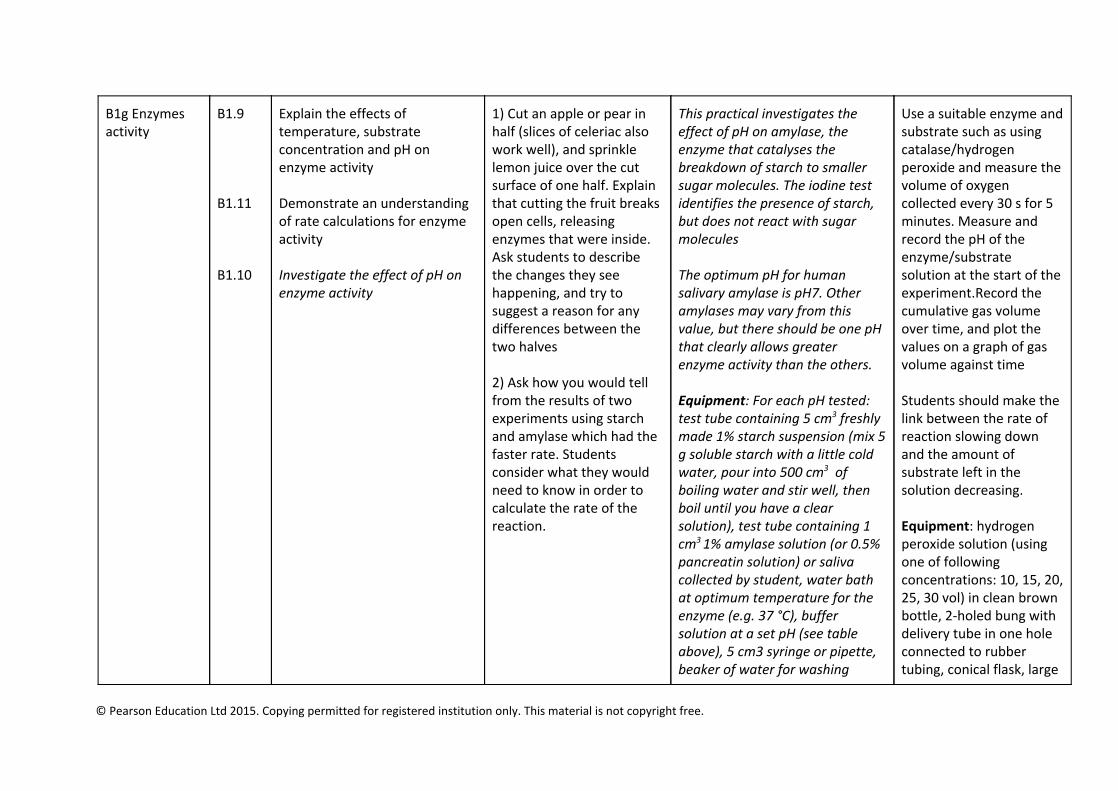
Explain the effects of temperature, substrate concentration and pH on enzyme activity Demonstrate an understanding of rate calculations for enzyme activity Investigate the effect of pH on enzyme activity
1) Cut an apple or pear in half (slices of celeriac also work well), and sprinkle lemon juice over the cut surface of one half. Explain that cutting the fruit breaks open cells, releasing enzymes that were inside. Ask students to describe the changes they see happening, and try to suggest a reason for any differences between the two halves 2) Ask how you would tell from the results of two experiments using starch and amylase which had the faster rate. Students consider what they would need to know in order to calculate the rate of the reaction.
This practical investigates the effect of pH on amylase, the enzyme that catalyses the breakdown of starch to smaller sugar molecules. The iodine test identifies the presence of starch, but does not react with sugar molecules The optimum pH for human salivary amylase is pH7. Other amylases may vary from this value, but there should be one pH that clearly allows greater enzyme activity than the others. Equipment: For each pH tested: test tube containing 5 cm3 freshly made 1% starch suspension (mix 5 g soluble starch with a little cold water, pour into 500 cm3 of boiling water and stir well, then boil until you have a clear solution), test tube containing 1 cm3 1% amylase solution (or 0.5% pancreatin solution) or saliva collected by student, water bath at optimum temperature for the enzyme (e.g. 37 °C), buffer solution at a set pH (see table above), 5 cm3 syringe or pipette, beaker of water for washing
Use a suitable enzyme and substrate such as using catalase/hydrogen peroxide and measure the volume of oxygen collected every 30 s for 5 minutes. Measure and record the pH of the enzyme/substrate solution at the start of the experiment.Record the cumulative gas volume over time, and plot the values on a graph of gas volume against time Students should make the link between the rate of reaction slowing down and the amount of substrate left in the solution decreasing. Equipment: hydrogen peroxide solution (using one of following concentrations: 10, 15, 20, 25, 30 vol) in clean brown bottle, 2-holed bung with delivery tube in one hole connected to rubber tubing, conical flask, large
© Pearson Education Ltd 2015. Copying permitted for registered institution only. This material is not copyright free.
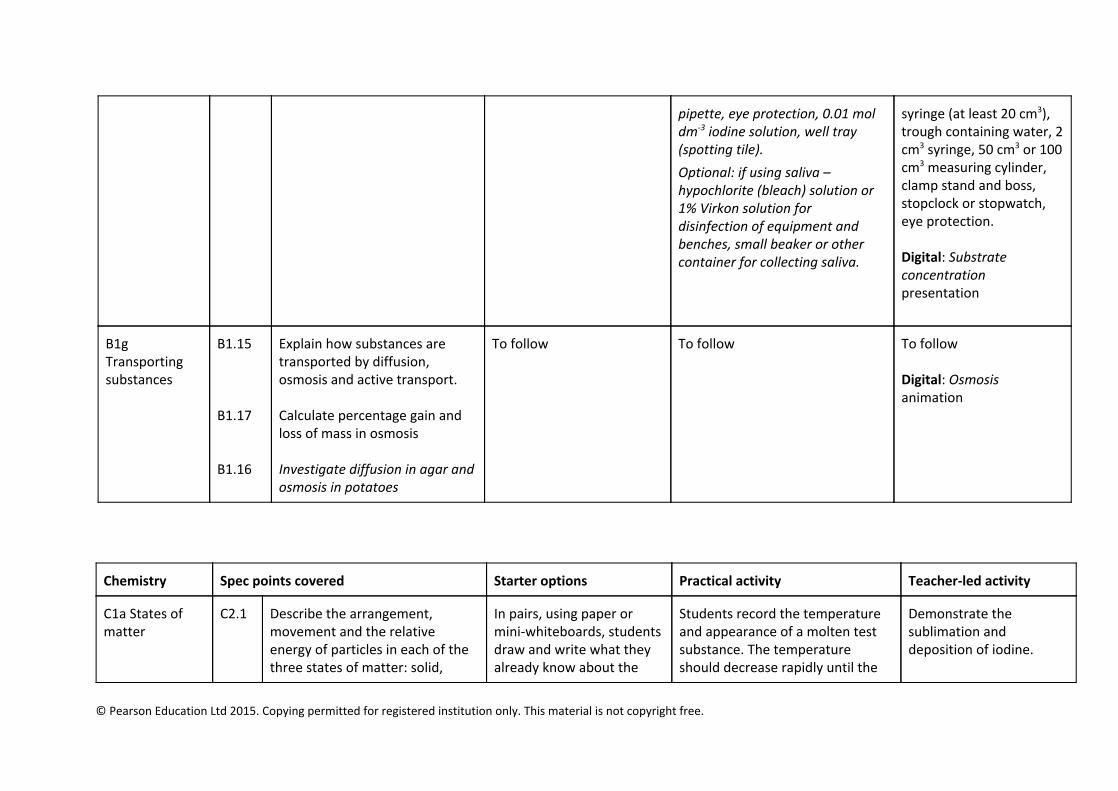
pipette, eye protection, 0.01 mol dm-3 iodine solution, well tray (spotting tile).
Optional: if using saliva – hypochlorite (bleach) solution or 1% Virkon solution for disinfection of equipment and benches, small beaker or other container for collecting saliva.
syringe (at least 20 cm3), trough containing water, 2 cm3 syringe, 50 cm3 or 100 cm3 measuring cylinder, clamp stand and boss, stopclock or stopwatch, eye protection. Digital: Substrate concentration presentation
B1g Transporting substances
B1.15 B1.17 B1.16
Explain how substances are transported by diffusion, osmosis and active transport. Calculate percentage gain and loss of mass in osmosis Investigate diffusion in agar and osmosis in potatoes
To follow To follow To follow Digital: Osmosis animation
Chemistry Spec points covered Starter options Practical activity Teacher-led activity
C1a States of matter
C2.1
Describe the arrangement, movement and the relative energy of particles in each of the three states of matter: solid,
In pairs, using paper or mini-whiteboards, students draw and write what they already know about the
Students record the temperature and appearance of a molten test substance. The temperature should decrease rapidly until the
Demonstrate the sublimation and deposition of iodine.
© Pearson Education Ltd 2015. Copying permitted for registered institution only. This material is not copyright free.
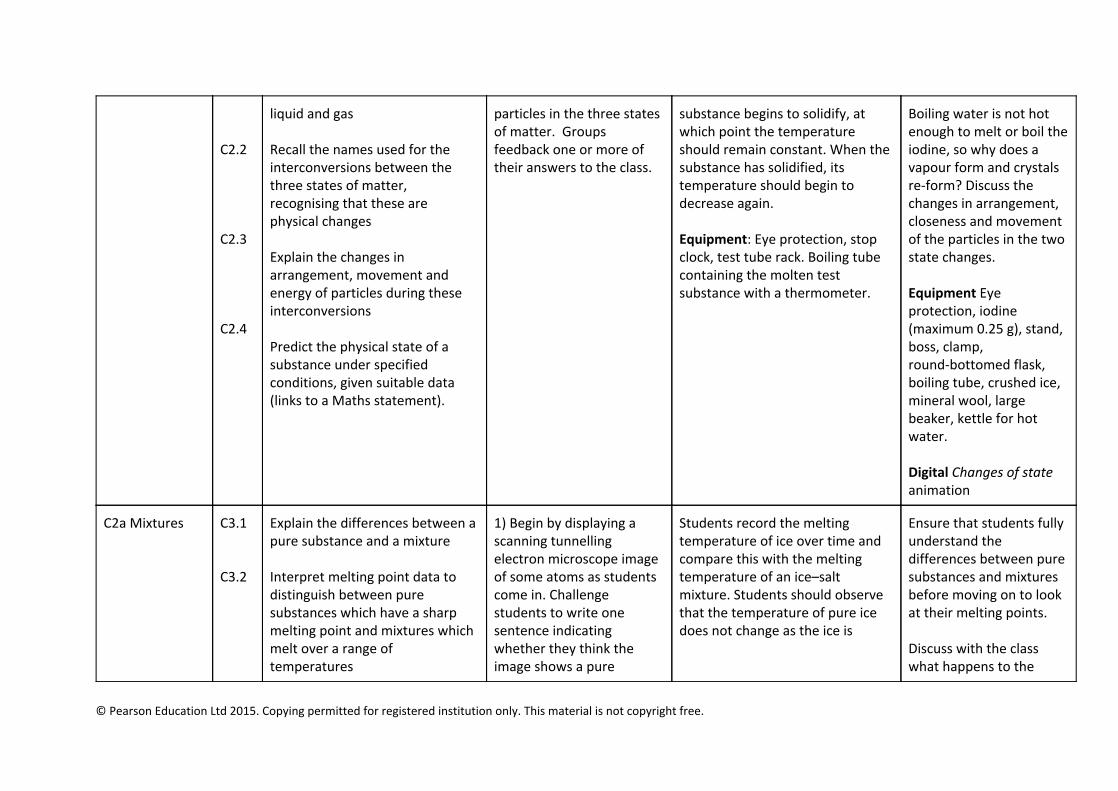
C2.2 C2.3 C2.4
liquid and gas Recall the names used for the interconversions between the three states of matter, recognising that these are physical changes Explain the changes in arrangement, movement and energy of particles during these interconversions Predict the physical state of a substance under specified conditions, given suitable data (links to a Maths statement).
particles in the three states of matter. Groups feedback one or more of their answers to the class.
substance begins to solidify, at which point the temperature should remain constant. When the substance has solidified, its temperature should begin to decrease again. Equipment: Eye protection, stop clock, test tube rack. Boiling tube containing the molten test substance with a thermometer.
Boiling water is not hot enough to melt or boil the iodine, so why does a vapour form and crystals re-form? Discuss the changes in arrangement, closeness and movement of the particles in the two state changes. Equipment Eye protection, iodine (maximum 0.25 g), stand, boss, clamp, round-bottomed flask, boiling tube, crushed ice, mineral wool, large beaker, kettle for hot water. Digital Changes of state animation
C2a Mixtures C3.1 C3.2
Explain the differences between a pure substance and a mixture Interpret melting point data to distinguish between pure substances which have a sharp melting point and mixtures which melt over a range of temperatures
1) Begin by displaying a scanning tunnelling electron microscope image of some atoms as students come in. Challenge students to write one sentence indicating whether they think the image shows a pure
Students record the melting temperature of ice over time and compare this with the melting temperature of an ice–salt mixture. Students should observe that the temperature of pure ice does not change as the ice is
Ensure that students fully understand the differences between pure substances and mixtures before moving on to look at their melting points. Discuss with the class what happens to the
© Pearson Education Ltd 2015. Copying permitted for registered institution only. This material is not copyright free.
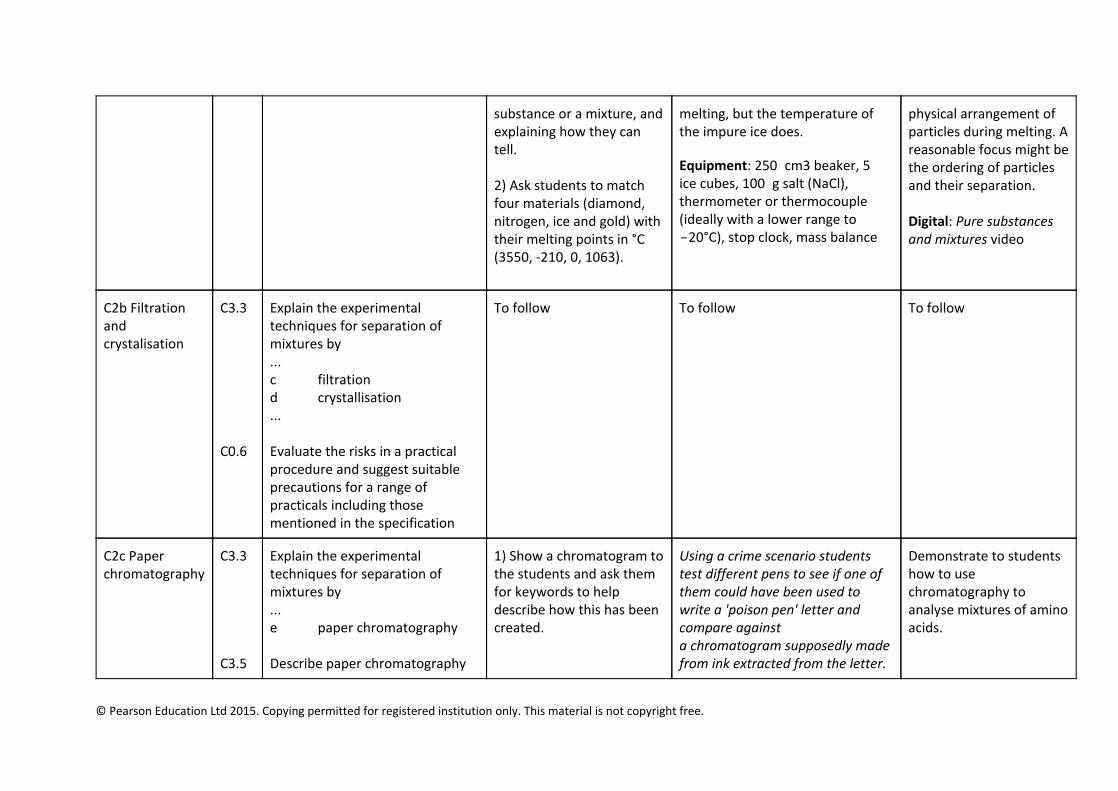
substance or a mixture, and explaining how they can tell. 2) Ask students to match four materials (diamond, nitrogen, ice and gold) with their melting points in °C (3550, -210, 0, 1063).
melting, but the temperature of the impure ice does.
Equipment: 250 cm3 beaker, 5 ice cubes, 100 g salt (NaCl), thermometer or thermocouple (ideally with a lower range to −20°C), stop clock, mass balance
physical arrangement of particles during melting. A reasonable focus might be the ordering of particles and their separation. Digital: Pure substances and mixtures video
C2b Filtration and crystalisation
C3.3 C0.6
Explain the experimental techniques for separation of mixtures by ... c filtration d crystallisation ... Evaluate the risks in a practical procedure and suggest suitable precautions for a range of practicals including those mentioned in the specification
To follow To follow To follow
C2c Paper chromatography
C3.3 C3.5
Explain the experimental techniques for separation of mixtures by ... e paper chromatography Describe paper chromatography
1) Show a chromatogram to the students and ask them for keywords to help describe how this has been created.
Using a crime scenario students test different pens to see if one of them could have been used to write a 'poison pen' letter and compare against a chromatogram supposedly made from ink extracted from the letter.
Demonstrate to students how to use chromatography to analyse mixtures of amino acids.
© Pearson Education Ltd 2015. Copying permitted for registered institution only. This material is not copyright free.
C2.6 C3.7
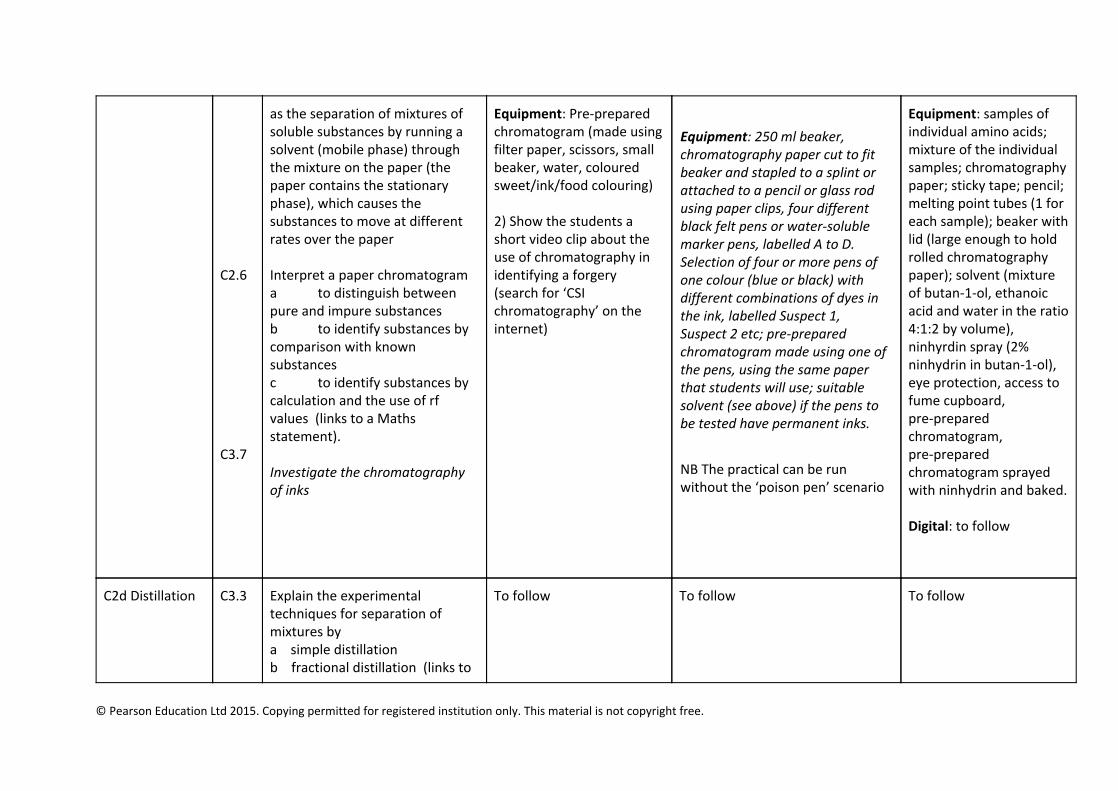
as the separation of mixtures of soluble substances by running a solvent (mobile phase) through the mixture on the paper (the paper contains the stationary phase), which causes the substances to move at different rates over the paper Interpret a paper chromatogram a to distinguish between pure and impure substances b to identify substances by comparison with known substances c to identify substances by calculation and the use of rf values (links to a Maths statement). Investigate the chromatography of inks
Equipment: Pre-prepared chromatogram (made using filter paper, scissors, small beaker, water, coloured sweet/ink/food colouring) 2) Show the students a short video clip about the use of chromatography in identifying a forgery (search for ‘CSI chromatography’ on the internet)
Equipment: 250 ml beaker, chromatography paper cut to fit beaker and stapled to a splint or attached to a pencil or glass rod using paper clips, four different black felt pens or water-soluble marker pens, labelled A to D. Selection of four or more pens of one colour (blue or black) with different combinations of dyes in the ink, labelled Suspect 1, Suspect 2 etc; pre-prepared chromatogram made using one of the pens, using the same paper that students will use; suitable solvent (see above) if the pens to be tested have permanent inks.
NB The practical can be run without the ‘poison pen’ scenario
Equipment: samples of individual amino acids; mixture of the individual samples; chromatography paper; sticky tape; pencil; melting point tubes (1 for each sample); beaker with lid (large enough to hold rolled chromatography paper); solvent (mixture of butan-1-ol, ethanoic acid and water in the ratio 4:1:2 by volume), ninhyrdin spray (2% ninhydrin in butan-1-ol), eye protection, access to fume cupboard, pre-prepared chromatogram, pre-prepared chromatogram sprayed with ninhydrin and baked. Digital: to follow
C2d Distillation C3.3
Explain the experimental techniques for separation of mixtures by a simple distillation b fractional distillation (links to
To follow To follow To follow
© Pearson Education Ltd 2015. Copying permitted for registered institution only. This material is not copyright free.
C0.6
a Maths statement). Evaluate the risks in a practical procedure and suggest suitable precautions for a range of practicals including those mentioned in the specification
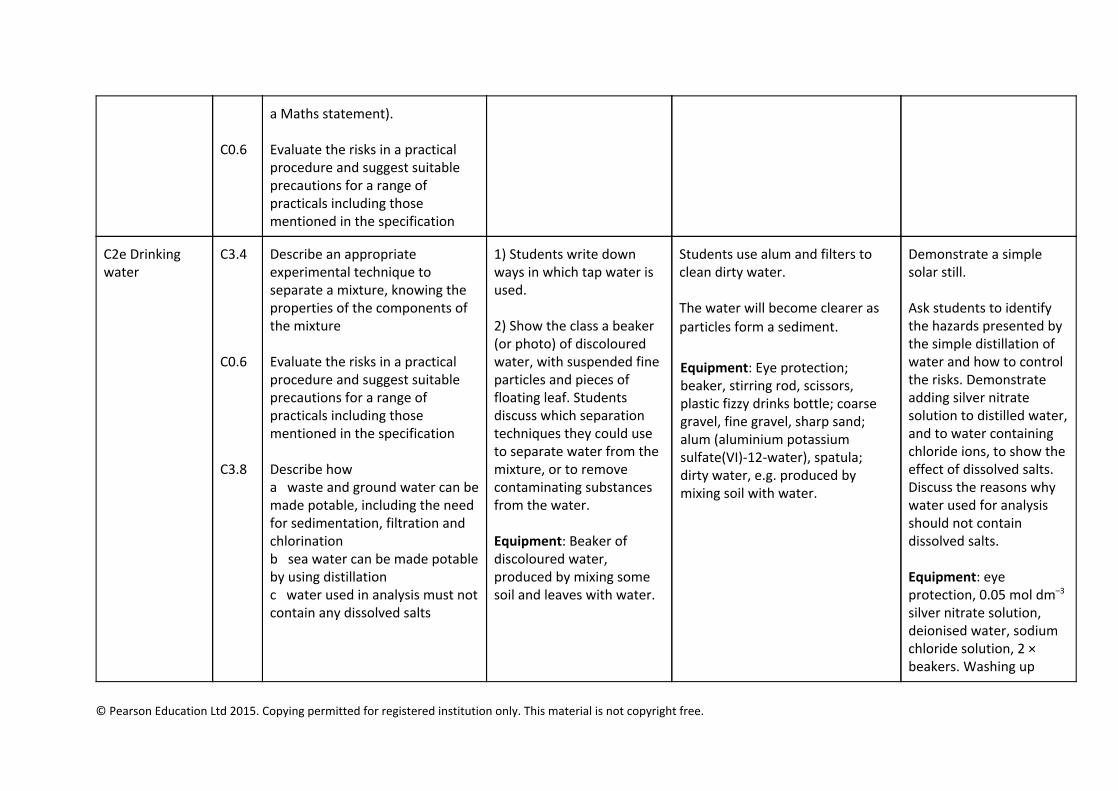
C2e Drinking water
C3.4 C0.6 C3.8
Describe an appropriate experimental technique to separate a mixture, knowing the properties of the components of the mixture Evaluate the risks in a practical procedure and suggest suitable precautions for a range of practicals including those mentioned in the specification Describe how a waste and ground water can be made potable, including the need for sedimentation, filtration and chlorination b sea water can be made potable by using distillation c water used in analysis must not contain any dissolved salts
1) Students write down ways in which tap water is used. 2) Show the class a beaker (or photo) of discoloured water, with suspended fine particles and pieces of floating leaf. Students discuss which separation techniques they could use to separate water from the mixture, or to remove contaminating substances from the water. Equipment: Beaker of discoloured water, produced by mixing some soil and leaves with water.
Students use alum and filters to clean dirty water. The water will become clearer as particles form a sediment.
Equipment: Eye protection; beaker, stirring rod, scissors, plastic fizzy drinks bottle; coarse gravel, fine gravel, sharp sand; alum (aluminium potassium sulfate(VI)-12-water), spatula; dirty water, e.g. produced by mixing soil with water.
Demonstrate a simple solar still. Ask students to identify the hazards presented by the simple distillation of water and how to control the risks. Demonstrate adding silver nitrate solution to distilled water, and to water containing chloride ions, to show the effect of dissolved salts. Discuss the reasons why water used for analysis should not contain dissolved salts. Equipment: eye protection, 0.05 mol dm–3 silver nitrate solution, deionised water, sodium chloride solution, 2 × beakers. Washing up
© Pearson Education Ltd 2015. Copying permitted for registered institution only. This material is not copyright free.
bowl, beaker, cling film, small weight, salty water. Digital: Water treatment interactive
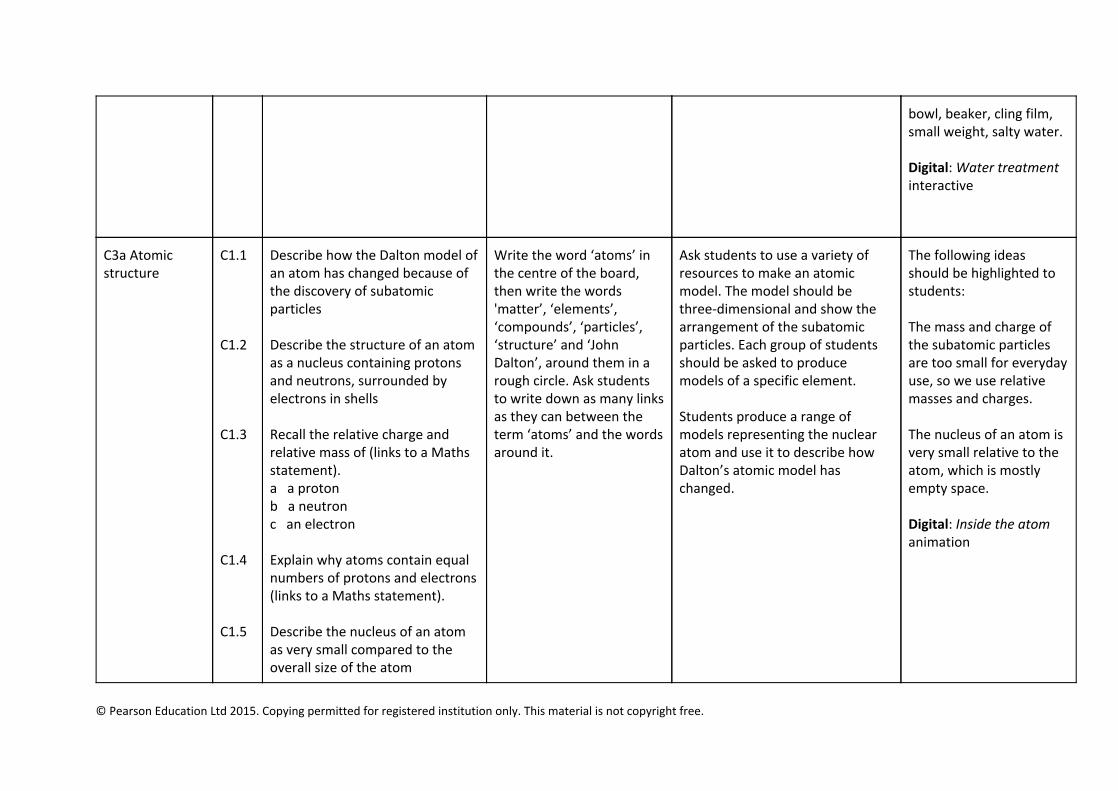
C3a Atomic structure
C1.1 C1.2 C1.3 C1.4 C1.5
Describe how the Dalton model of an atom has changed because of the discovery of subatomic particles Describe the structure of an atom as a nucleus containing protons and neutrons, surrounded by electrons in shells Recall the relative charge and relative mass of (links to a Maths statement). a a proton b a neutron c an electron Explain why atoms contain equal numbers of protons and electrons (links to a Maths statement). Describe the nucleus of an atom as very small compared to the overall size of the atom
Write the word ‘atoms’ in the centre of the board, then write the words 'matter’, ‘elements’, ‘compounds’, ‘particles’, ‘structure’ and ‘John Dalton’, around them in a rough circle. Ask students to write down as many links as they can between the term ‘atoms’ and the words around it.
Ask students to use a variety of resources to make an atomic model. The model should be three-dimensional and show the arrangement of the subatomic particles. Each group of students should be asked to produce models of a specific element. Students produce a range of models representing the nuclear atom and use it to describe how Dalton’s atomic model has changed.
The following ideas should be highlighted to students: The mass and charge of the subatomic particles are too small for everyday use, so we use relative masses and charges. The nucleus of an atom is very small relative to the atom, which is mostly empty space. Digital: Inside the atom animation
© Pearson Education Ltd 2015. Copying permitted for registered institution only. This material is not copyright free.
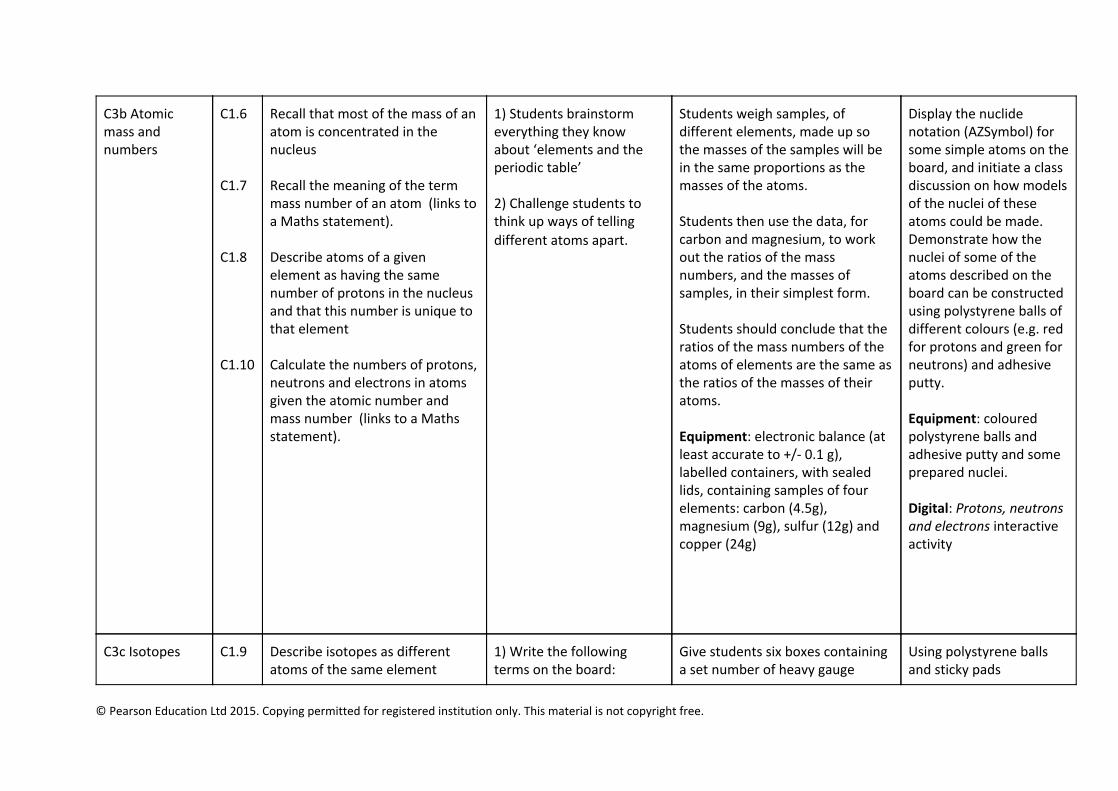
C3b Atomic mass and numbers
C1.6 C1.7 C1.8 C1.10
Recall that most of the mass of an atom is concentrated in the nucleus Recall the meaning of the term mass number of an atom (links to a Maths statement). Describe atoms of a given element as having the same number of protons in the nucleus and that this number is unique to that element Calculate the numbers of protons, neutrons and electrons in atoms given the atomic number and mass number (links to a Maths statement).
1) Students brainstorm everything they know about ‘elements and the periodic table’ 2) Challenge students to think up ways of telling different atoms apart.
Students weigh samples, of different elements, made up so the masses of the samples will be in the same proportions as the masses of the atoms. Students then use the data, for carbon and magnesium, to work out the ratios of the mass numbers, and the masses of samples, in their simplest form. Students should conclude that the ratios of the mass numbers of the atoms of elements are the same as the ratios of the masses of their atoms. Equipment: electronic balance (at least accurate to +/- 0.1 g), labelled containers, with sealed lids, containing samples of four elements: carbon (4.5g), magnesium (9g), sulfur (12g) and copper (24g)
Display the nuclide notation (AZSymbol) for some simple atoms on the board, and initiate a class discussion on how models of the nuclei of these atoms could be made. Demonstrate how the nuclei of some of the atoms described on the board can be constructed using polystyrene balls of different colours (e.g. red for protons and green for neutrons) and adhesive putty. Equipment: coloured polystyrene balls and adhesive putty and some prepared nuclei. Digital: Protons, neutrons and electrons interactive activity
C3c Isotopes C1.9
Describe isotopes as different atoms of the same element
1) Write the following terms on the board:
Give students six boxes containing a set number of heavy gauge
Using polystyrene balls and sticky pads
© Pearson Education Ltd 2015. Copying permitted for registered institution only. This material is not copyright free.
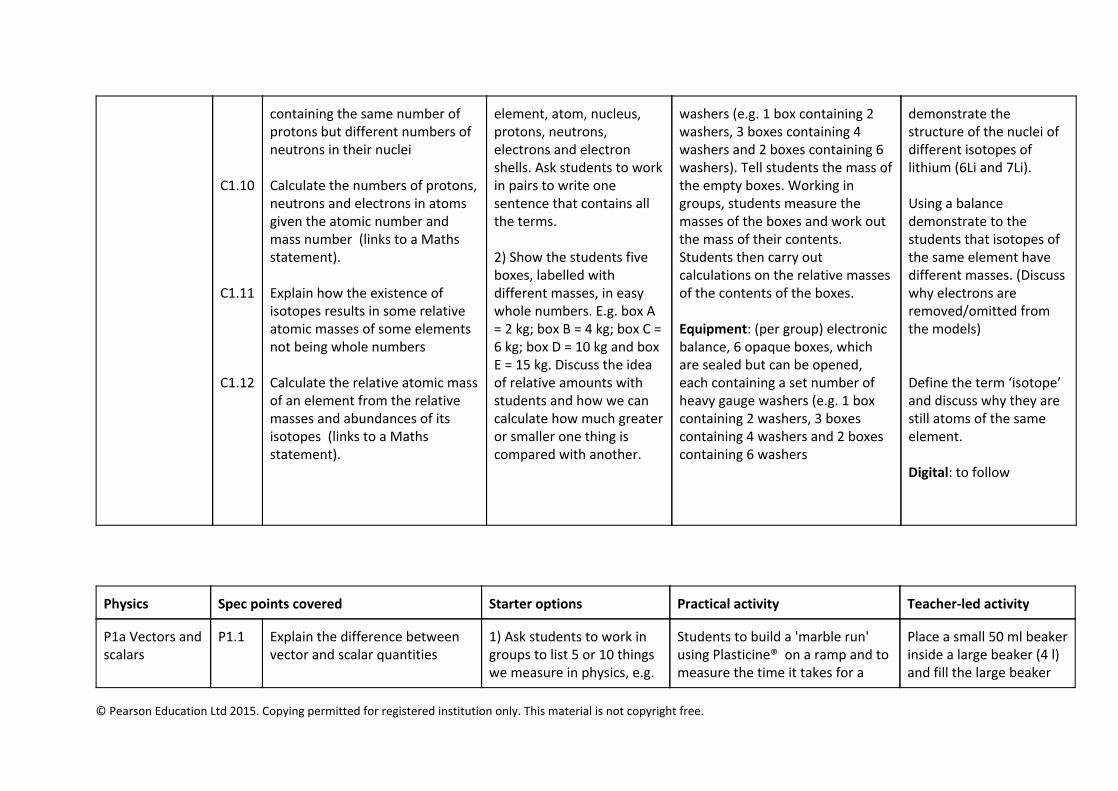
C1.10 C1.11 C1.12
containing the same number of protons but different numbers of neutrons in their nuclei Calculate the numbers of protons, neutrons and electrons in atoms given the atomic number and mass number (links to a Maths statement). Explain how the existence of isotopes results in some relative atomic masses of some elements not being whole numbers Calculate the relative atomic mass of an element from the relative masses and abundances of its isotopes (links to a Maths statement).
element, atom, nucleus, protons, neutrons, electrons and electron shells. Ask students to work in pairs to write one sentence that contains all the terms. 2) Show the students five boxes, labelled with different masses, in easy whole numbers. E.g. box A = 2 kg; box B = 4 kg; box C = 6 kg; box D = 10 kg and box E = 15 kg. Discuss the idea of relative amounts with students and how we can calculate how much greater or smaller one thing is compared with another.
washers (e.g. 1 box containing 2 washers, 3 boxes containing 4 washers and 2 boxes containing 6 washers). Tell students the mass of the empty boxes. Working in groups, students measure the masses of the boxes and work out the mass of their contents. Students then carry out calculations on the relative masses of the contents of the boxes. Equipment: (per group) electronic balance, 6 opaque boxes, which are sealed but can be opened, each containing a set number of heavy gauge washers (e.g. 1 box containing 2 washers, 3 boxes containing 4 washers and 2 boxes containing 6 washers
demonstrate the structure of the nuclei of different isotopes of lithium (6Li and 7Li). Using a balance demonstrate to the students that isotopes of the same element have different masses. (Discuss why electrons are removed/omitted from the models) Define the term ‘isotope’ and discuss why they are still atoms of the same element. Digital: to follow
Physics Spec points covered Starter options Practical activity Teacher-led activity
P1a Vectors and scalars
P1.1
Explain the difference between vector and scalar quantities
1) Ask students to work in groups to list 5 or 10 things we measure in physics, e.g.
Students to build a 'marble run' using Plasticine® on a ramp and to measure the time it takes for a
Place a small 50 ml beaker inside a large beaker (4 l) and fill the large beaker
© Pearson Education Ltd 2015. Copying permitted for registered institution only. This material is not copyright free.
P1.2 P1.3 P1.10
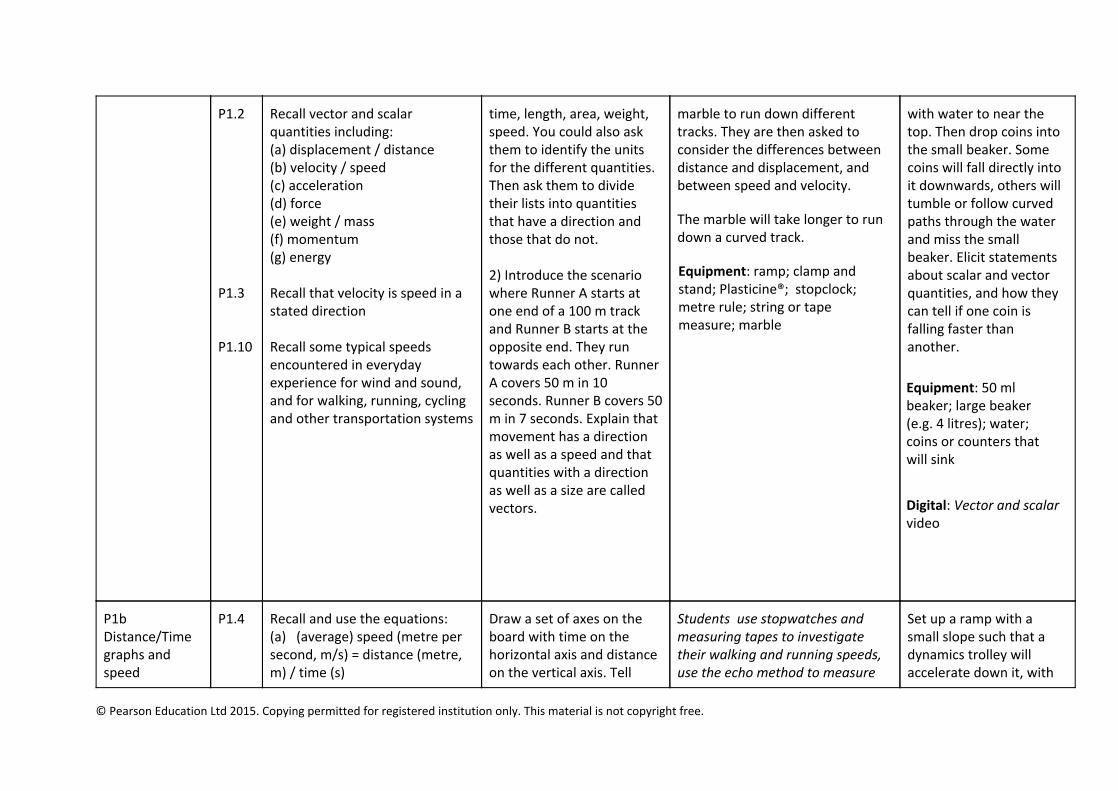
Recall vector and scalar quantities including: (a) displacement / distance (b) velocity / speed (c) acceleration (d) force (e) weight / mass (f) momentum (g) energy Recall that velocity is speed in a stated direction Recall some typical speeds encountered in everyday experience for wind and sound, and for walking, running, cycling and other transportation systems
time, length, area, weight, speed. You could also ask them to identify the units for the different quantities. Then ask them to divide their lists into quantities that have a direction and those that do not. 2) Introduce the scenario where Runner A starts at one end of a 100 m track and Runner B starts at the opposite end. They run towards each other. Runner A covers 50 m in 10 seconds. Runner B covers 50 m in 7 seconds. Explain that movement has a direction as well as a speed and that quantities with a direction as well as a size are called vectors.
marble to run down different tracks. They are then asked to consider the differences between distance and displacement, and between speed and velocity.
The marble will take longer to run down a curved track.
Equipment: ramp; clamp and stand; Plasticine®; stopclock; metre rule; string or tape measure; marble
with water to near the top. Then drop coins into the small beaker. Some coins will fall directly into it downwards, others will tumble or follow curved paths through the water and miss the small beaker. Elicit statements about scalar and vector quantities, and how they can tell if one coin is falling faster than another.
Equipment: 50 ml beaker; large beaker (e.g. 4 litres); water; coins or counters that will sink
Digital: Vector and scalar video
P1b Distance/Time graphs and speed
P1.4
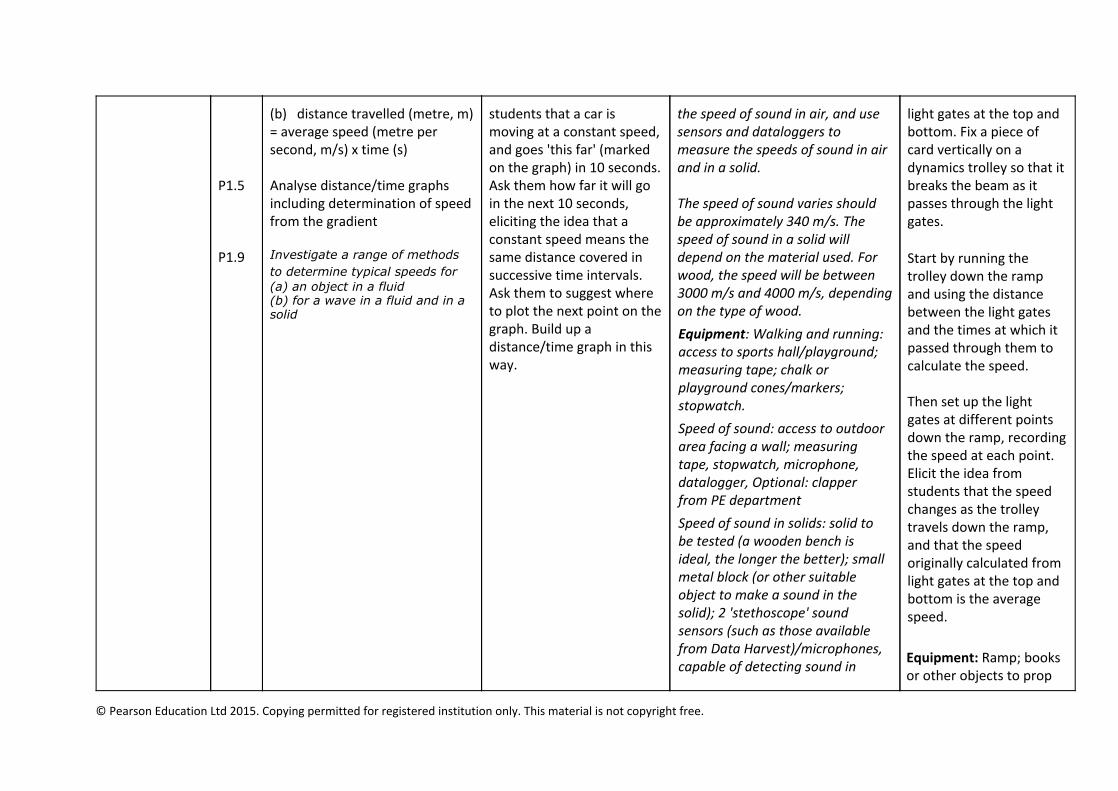
Recall and use the equations: (a) (average) speed (metre per second, m/s) = distance (metre, m) / time (s)
Draw a set of axes on the board with time on the horizontal axis and distance on the vertical axis. Tell
Students use stopwatches and measuring tapes to investigate their walking and running speeds, use the echo method to measure
Set up a ramp with a small slope such that a dynamics trolley will accelerate down it, with
© Pearson Education Ltd 2015. Copying permitted for registered institution only. This material is not copyright free.
P1.5 P1.9
(b) distance travelled (metre, m) = average speed (metre per second, m/s) x time (s) Analyse distance/time graphs including determination of speed from the gradient Investigate a range of methods to determine typical speeds for (a) an object in a fluid (b) for a wave in a fluid and in a solid
students that a car is moving at a constant speed, and goes 'this far' (marked on the graph) in 10 seconds. Ask them how far it will go in the next 10 seconds, eliciting the idea that a constant speed means the same distance covered in successive time intervals. Ask them to suggest where to plot the next point on the graph. Build up a distance/time graph in this way.
the speed of sound in air, and use sensors and dataloggers to measure the speeds of sound in air and in a solid. The speed of sound varies should be approximately 340 m/s. The speed of sound in a solid will depend on the material used. For wood, the speed will be between 3000 m/s and 4000 m/s, depending on the type of wood.
Equipment: Walking and running: access to sports hall/playground; measuring tape; chalk or playground cones/markers; stopwatch.
Speed of sound: access to outdoor area facing a wall; measuring tape, stopwatch, microphone, datalogger, Optional: clapper from PE department
Speed of sound in solids: solid to be tested (a wooden bench is ideal, the longer the better); small metal block (or other suitable object to make a sound in the solid); 2 'stethoscope' sound sensors (such as those available from Data Harvest)/microphones, capable of detecting sound in
light gates at the top and bottom. Fix a piece of card vertically on a dynamics trolley so that it breaks the beam as it passes through the light gates. Start by running the trolley down the ramp and using the distance between the light gates and the times at which it passed through them to calculate the speed. Then set up the light gates at different points down the ramp, recording the speed at each point. Elicit the idea from students that the speed changes as the trolley travels down the ramp, and that the speed originally calculated from light gates at the top and bottom is the average speed.
Equipment: Ramp; books or other objects to prop
© Pearson Education Ltd 2015. Copying permitted for registered institution only. This material is not copyright free.
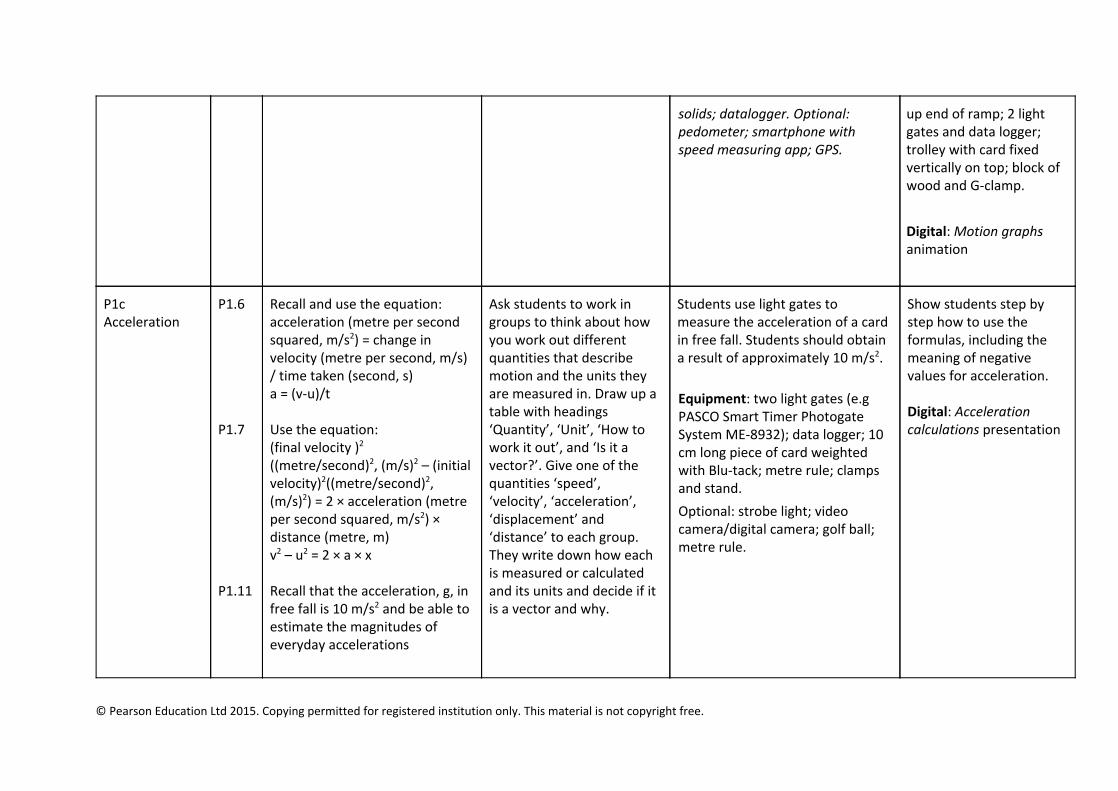
solids; datalogger. Optional: pedometer; smartphone with speed measuring app; GPS.
up end of ramp; 2 light gates and data logger; trolley with card fixed vertically on top; block of wood and G-clamp.
Digital: Motion graphs animation
P1c Acceleration
P1.6 P1.7 P1.11
Recall and use the equation: acceleration (metre per second squared, m/s2) = change in velocity (metre per second, m/s) / time taken (second, s) a = (v-u)/t Use the equation: (final velocity )2 ((metre/second)2, (m/s)2 – (initial velocity)2((metre/second)2, (m/s)2) = 2 × acceleration (metre per second squared, m/s2) × distance (metre, m) v2 – u2 = 2 × a × x Recall that the acceleration, g, in free fall is 10 m/s2 and be able to estimate the magnitudes of everyday accelerations
Ask students to work in groups to think about how you work out different quantities that describe motion and the units they are measured in. Draw up a table with headings ‘Quantity’, ‘Unit’, ‘How to work it out’, and ‘Is it a vector?’. Give one of the quantities ‘speed’, ‘velocity’, ‘acceleration’, ‘displacement’ and ‘distance’ to each group. They write down how each is measured or calculated and its units and decide if it is a vector and why.
Students use light gates to measure the acceleration of a card in free fall. Students should obtain a result of approximately 10 m/s2.
Equipment: two light gates (e.g PASCO Smart Timer Photogate System ME-8932); data logger; 10 cm long piece of card weighted with Blu-tack; metre rule; clamps and stand.
Optional: strobe light; video camera/digital camera; golf ball; metre rule.
Show students step by step how to use the formulas, including the meaning of negative values for acceleration. Digital: Acceleration calculations presentation
© Pearson Education Ltd 2015. Copying permitted for registered institution only. This material is not copyright free.
P1d Velocity/time graphs
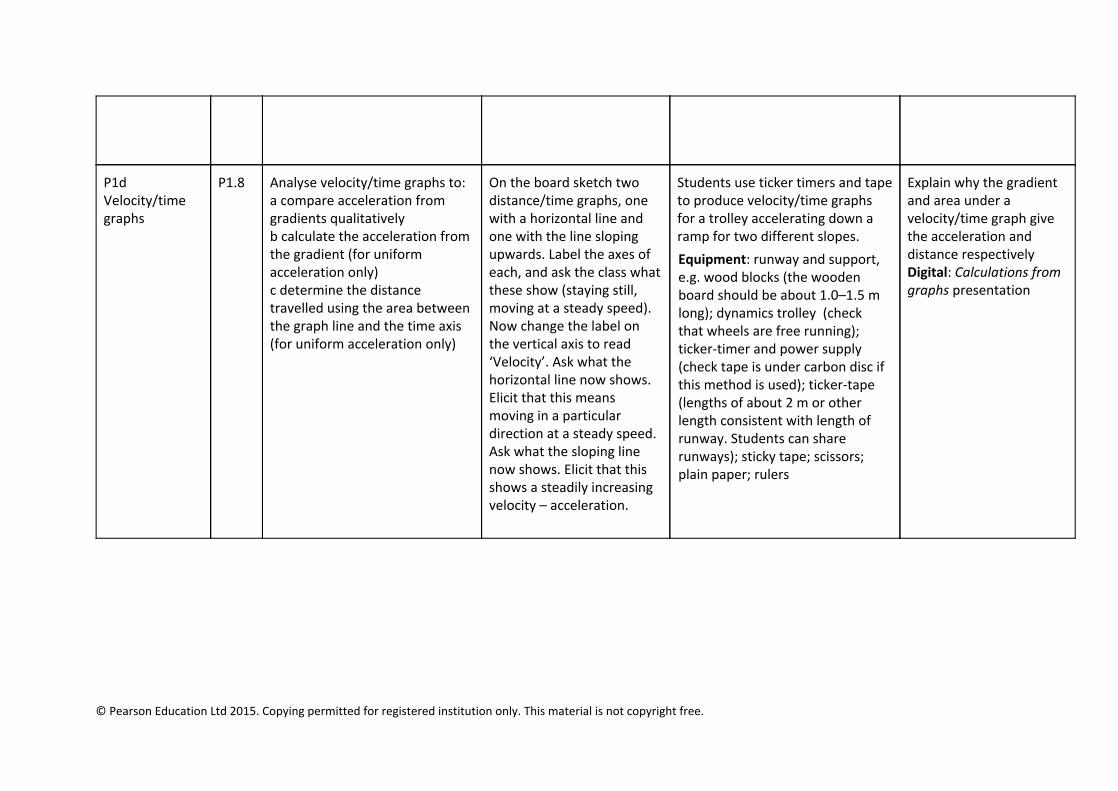
P1.8 Analyse velocity/time graphs to: a compare acceleration from gradients qualitatively b calculate the acceleration from the gradient (for uniform acceleration only) c determine the distance travelled using the area between the graph line and the time axis (for uniform acceleration only)
On the board sketch two distance/time graphs, one with a horizontal line and one with the line sloping upwards. Label the axes of each, and ask the class what these show (staying still, moving at a steady speed). Now change the label on the vertical axis to read ‘Velocity’. Ask what the horizontal line now shows. Elicit that this means moving in a particular direction at a steady speed. Ask what the sloping line now shows. Elicit that this shows a steadily increasing velocity – acceleration.
Students use ticker timers and tape to produce velocity/time graphs for a trolley accelerating down a ramp for two different slopes.
Equipment: runway and support, e.g. wood blocks (the wooden board should be about 1.0–1.5 m long); dynamics trolley (check that wheels are free running); ticker-timer and power supply (check tape is under carbon disc if this method is used); ticker-tape (lengths of about 2 m or other length consistent with length of runway. Students can share runways); sticky tape; scissors; plain paper; rulers
Explain why the gradient and area under a velocity/time graph give the acceleration and distance respectively Digital: Calculations from graphs presentation
© Pearson Education Ltd 2015. Copying permitted for registered institution only. This material is not copyright free.
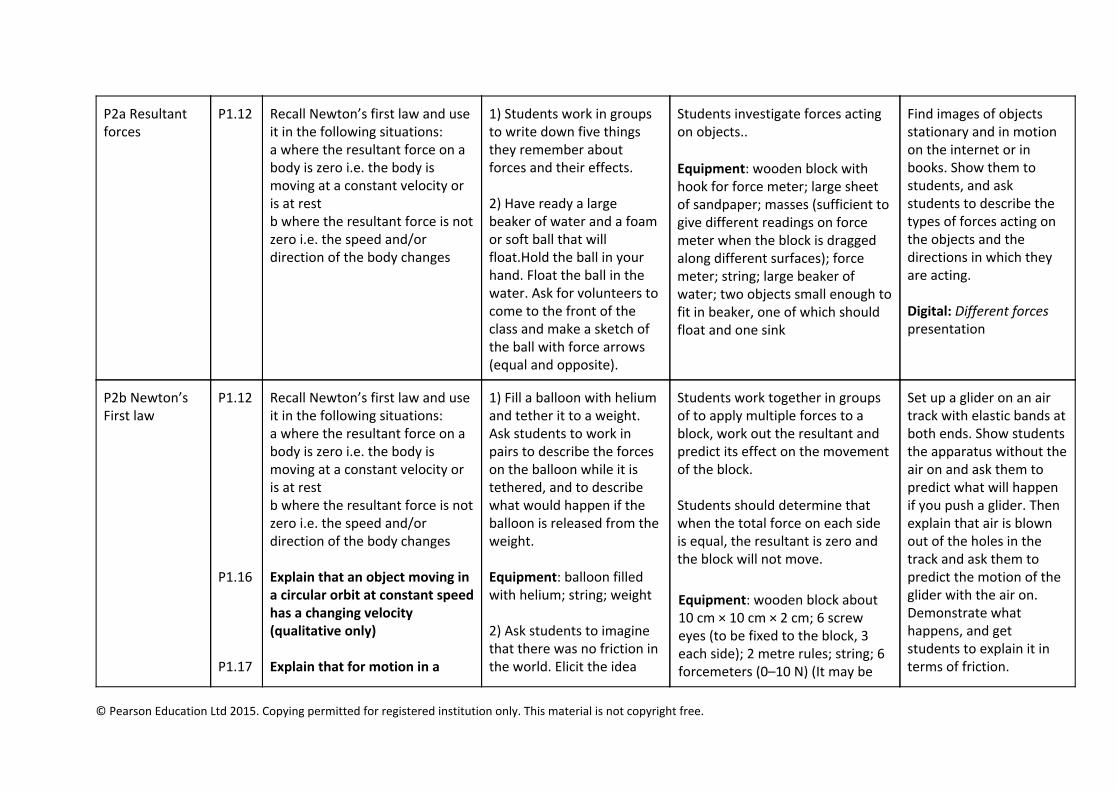
P2a Resultant forces
P1.12 Recall Newton’s first law and use it in the following situations: a where the resultant force on a body is zero i.e. the body is moving at a constant velocity or is at rest b where the resultant force is not zero i.e. the speed and/or direction of the body changes
1) Students work in groups to write down five things they remember about forces and their effects. 2) Have ready a large beaker of water and a foam or soft ball that will float.Hold the ball in your hand. Float the ball in the water. Ask for volunteers to come to the front of the class and make a sketch of the ball with force arrows (equal and opposite).
Students investigate forces acting on objects.. Equipment: wooden block with hook for force meter; large sheet of sandpaper; masses (sufficient to give different readings on force meter when the block is dragged along different surfaces); force meter; string; large beaker of water; two objects small enough to fit in beaker, one of which should float and one sink
Find images of objects stationary and in motion on the internet or in books. Show them to students, and ask students to describe the types of forces acting on the objects and the directions in which they are acting. Digital: Different forces presentation
P2b Newton’s First law
P1.12 P1.16 P1.17
Recall Newton’s first law and use it in the following situations: a where the resultant force on a body is zero i.e. the body is moving at a constant velocity or is at rest b where the resultant force is not zero i.e. the speed and/or direction of the body changes Explain that an object moving in a circular orbit at constant speed has a changing velocity (qualitative only) Explain that for motion in a
1) Fill a balloon with helium and tether it to a weight. Ask students to work in pairs to describe the forces on the balloon while it is tethered, and to describe what would happen if the balloon is released from the weight. Equipment: balloon filled with helium; string; weight 2) Ask students to imagine that there was no friction in the world. Elicit the idea
Students work together in groups of to apply multiple forces to a block, work out the resultant and predict its effect on the movement of the block. Students should determine that when the total force on each side is equal, the resultant is zero and the block will not move.
Equipment: wooden block about 10 cm × 10 cm × 2 cm; 6 screw eyes (to be fixed to the block, 3 each side); 2 metre rules; string; 6 forcemeters (0–10 N) (It may be
Set up a glider on an air track with elastic bands at both ends. Show students the apparatus without the air on and ask them to predict what will happen if you push a glider. Then explain that air is blown out of the holes in the track and ask them to predict the motion of the glider with the air on. Demonstrate what happens, and get students to explain it in terms of friction.
© Pearson Education Ltd 2015. Copying permitted for registered institution only. This material is not copyright free.
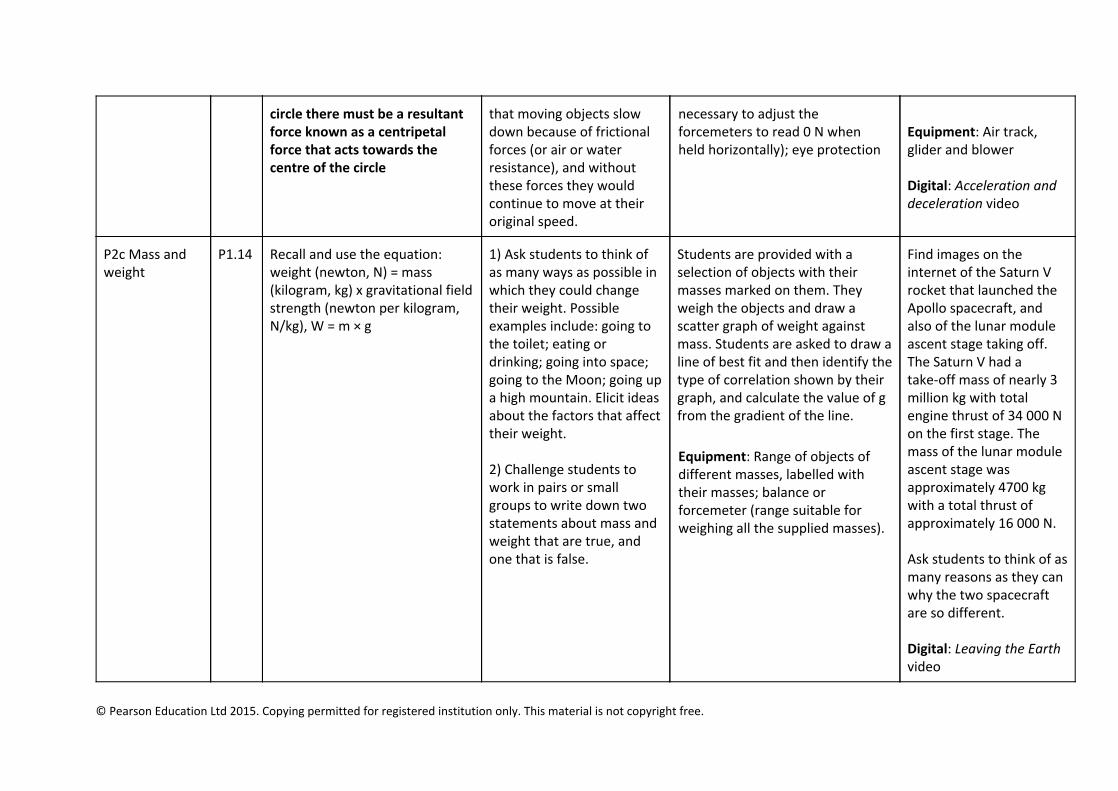
circle there must be a resultant force known as a centripetal force that acts towards the centre of the circle
that moving objects slow down because of frictional forces (or air or water resistance), and without these forces they would continue to move at their original speed.
necessary to adjust the forcemeters to read 0 N when held horizontally); eye protection
Equipment: Air track, glider and blower Digital: Acceleration and deceleration video
P2c Mass and weight
P1.14
Recall and use the equation: weight (newton, N) = mass (kilogram, kg) x gravitational field strength (newton per kilogram, N/kg), W = m × g
1) Ask students to think of as many ways as possible in which they could change their weight. Possible examples include: going to the toilet; eating or drinking; going into space; going to the Moon; going up a high mountain. Elicit ideas about the factors that affect their weight. 2) Challenge students to work in pairs or small groups to write down two statements about mass and weight that are true, and one that is false.
Students are provided with a selection of objects with their masses marked on them. They weigh the objects and draw a scatter graph of weight against mass. Students are asked to draw a line of best fit and then identify the type of correlation shown by their graph, and calculate the value of g from the gradient of the line.
Equipment: Range of objects of different masses, labelled with their masses; balance or forcemeter (range suitable for weighing all the supplied masses).
Find images on the internet of the Saturn V rocket that launched the Apollo spacecraft, and also of the lunar module ascent stage taking off. The Saturn V had a take-off mass of nearly 3 million kg with total engine thrust of 34 000 N on the first stage. The mass of the lunar module ascent stage was approximately 4700 kg with a total thrust of approximately 16 000 N. Ask students to think of as many reasons as they can why the two spacecraft are so different. Digital: Leaving the Earth video
© Pearson Education Ltd 2015. Copying permitted for registered institution only. This material is not copyright free.
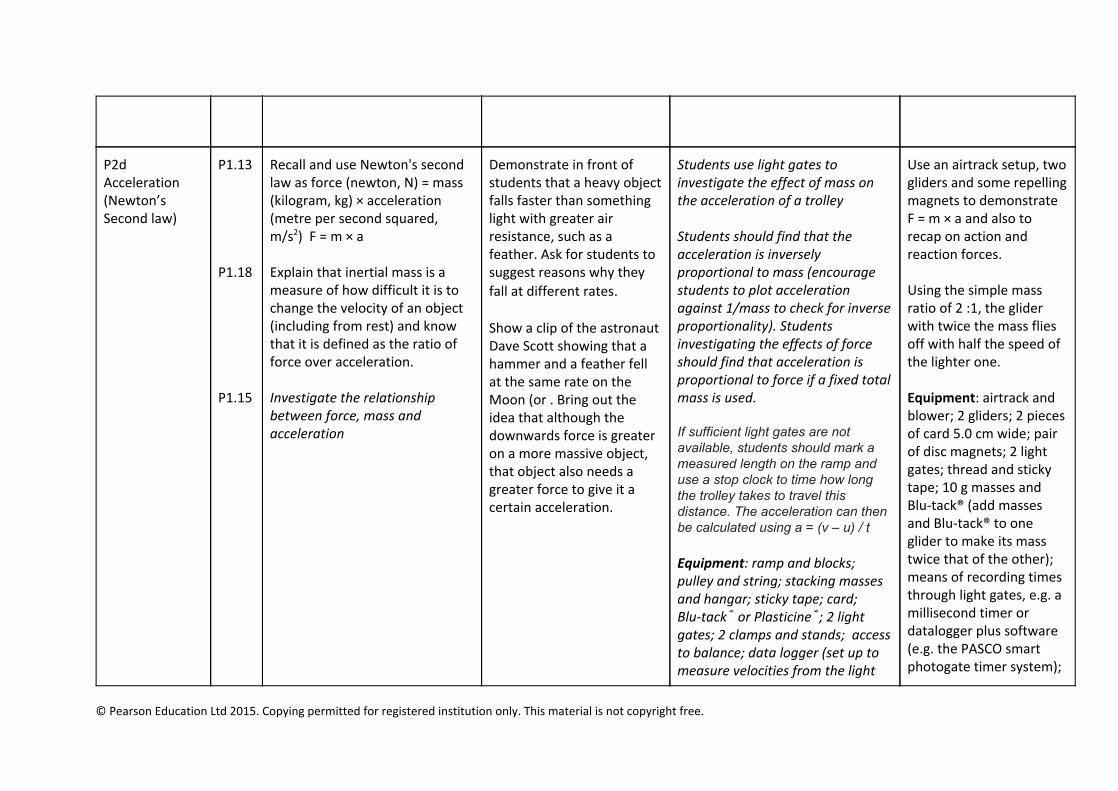
P2d Acceleration (Newton’s Second law)
P1.13 P1.18 P1.15
Recall and use Newton's second law as force (newton, N) = mass (kilogram, kg) × acceleration (metre per second squared, m/s2) F = m × a Explain that inertial mass is a measure of how difficult it is to change the velocity of an object (including from rest) and know that it is defined as the ratio of force over acceleration. Investigate the relationship between force, mass and acceleration
Demonstrate in front of students that a heavy object falls faster than something light with greater air resistance, such as a feather. Ask for students to suggest reasons why they fall at different rates. Show a clip of the astronaut Dave Scott showing that a hammer and a feather fell at the same rate on the Moon (or . Bring out the idea that although the downwards force is greater on a more massive object, that object also needs a greater force to give it a certain acceleration.
Students use light gates to investigate the effect of mass on the acceleration of a trolley Students should find that the acceleration is inversely proportional to mass (encourage students to plot acceleration against 1/mass to check for inverse proportionality). Students investigating the effects of force should find that acceleration is proportional to force if a fixed total mass is used. If sufficient light gates are not available, students should mark a measured length on the ramp and use a stop clock to time how long the trolley takes to travel this distance. The acceleration can then be calculated using a = (v – u) / t Equipment: ramp and blocks; pulley and string; stacking masses and hangar; sticky tape; card; Blu-tack® or Plasticine®; 2 light gates; 2 clamps and stands; access to balance; data logger (set up to measure velocities from the light
Use an airtrack setup, two gliders and some repelling magnets to demonstrate F = m × a and also to recap on action and reaction forces. Using the simple mass ratio of 2 :1, the glider with twice the mass flies off with half the speed of the lighter one. Equipment: airtrack and blower; 2 gliders; 2 pieces of card 5.0 cm wide; pair of disc magnets; 2 light gates; thread and sticky tape; 10 g masses and Blu-tack® (add masses and Blu-tack® to one glider to make its mass twice that of the other); means of recording times through light gates, e.g. a millisecond timer or datalogger plus software (e.g. the PASCO smart photogate timer system);
© Pearson Education Ltd 2015. Copying permitted for registered institution only. This material is not copyright free.
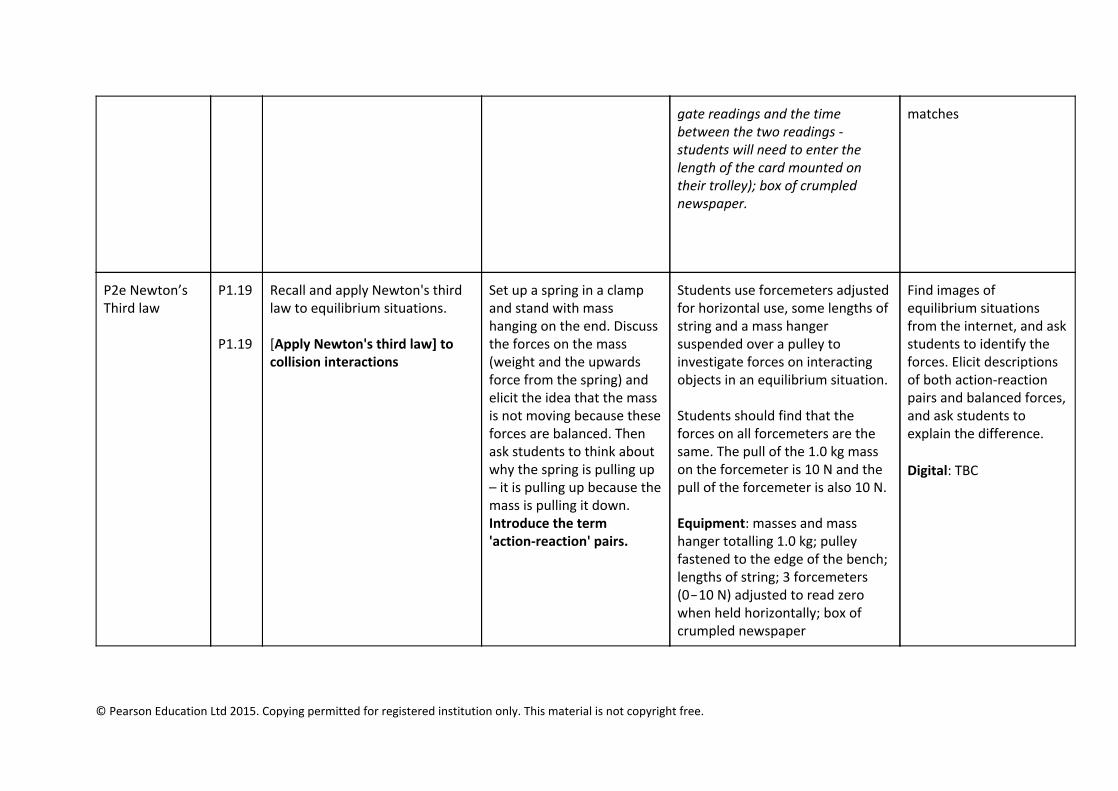
gate readings and the time between the two readings - students will need to enter the length of the card mounted on their trolley); box of crumpled newspaper.
matches
P2e Newton’s Third law
P1.19 P1.19
Recall and apply Newton's third law to equilibrium situations. [Apply Newton's third law] to collision interactions
Set up a spring in a clamp and stand with mass hanging on the end. Discuss the forces on the mass (weight and the upwards force from the spring) and elicit the idea that the mass is not moving because these forces are balanced. Then ask students to think about why the spring is pulling up – it is pulling up because the mass is pulling it down. Introduce the term 'action-reaction' pairs.
Students use forcemeters adjusted for horizontal use, some lengths of string and a mass hanger suspended over a pulley to investigate forces on interacting objects in an equilibrium situation. Students should find that the forces on all forcemeters are the same. The pull of the 1.0 kg mass on the forcemeter is 10 N and the pull of the forcemeter is also 10 N. Equipment: masses and mass hanger totalling 1.0 kg; pulley fastened to the edge of the bench; lengths of string; 3 forcemeters (0−10 N) adjusted to read zero when held horizontally; box of crumpled newspaper
Find images of equilibrium situations from the internet, and ask students to identify the forces. Elicit descriptions of both action-reaction pairs and balanced forces, and ask students to explain the difference. Digital: TBC
© Pearson Education Ltd 2015. Copying permitted for registered institution only. This material is not copyright free.
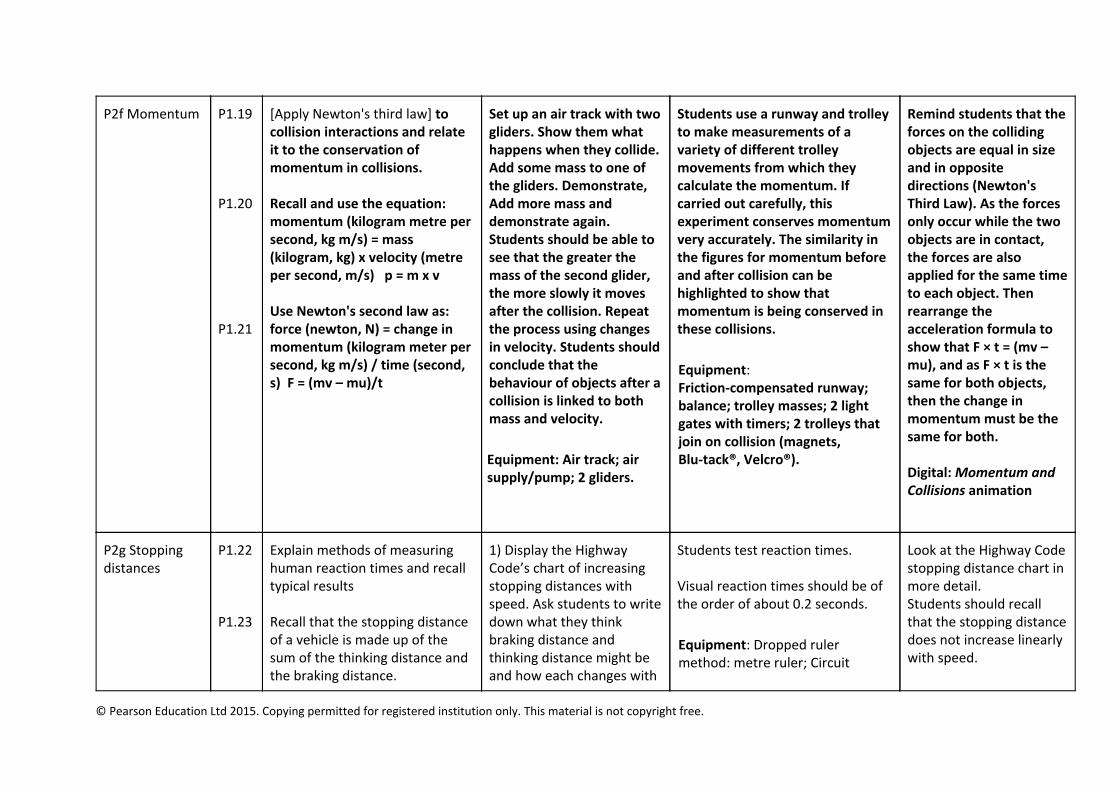
P2f Momentum P1.19 P1.20 P1.21
[Apply Newton's third law] to collision interactions and relate it to the conservation of momentum in collisions. Recall and use the equation: momentum (kilogram metre per second, kg m/s) = mass (kilogram, kg) x velocity (metre per second, m/s) p = m x v Use Newton's second law as: force (newton, N) = change in momentum (kilogram meter per second, kg m/s) / time (second, s) F = (mv – mu)/t
Set up an air track with two gliders. Show them what happens when they collide. Add some mass to one of the gliders. Demonstrate, Add more mass and demonstrate again. Students should be able to see that the greater the mass of the second glider, the more slowly it moves after the collision. Repeat the process using changes in velocity. Students should conclude that the behaviour of objects after a collision is linked to both mass and velocity.
Equipment: Air track; air supply/pump; 2 gliders.
Students use a runway and trolley to make measurements of a variety of different trolley movements from which they calculate the momentum. If carried out carefully, this experiment conserves momentum very accurately. The similarity in the figures for momentum before and after collision can be highlighted to show that momentum is being conserved in these collisions.
Equipment: Friction-compensated runway; balance; trolley masses; 2 light gates with timers; 2 trolleys that join on collision (magnets, Blu-tack®, Velcro®).
Remind students that the forces on the colliding objects are equal in size and in opposite directions (Newton's Third Law). As the forces only occur while the two objects are in contact, the forces are also applied for the same time to each object. Then rearrange the acceleration formula to show that F × t = (mv – mu), and as F × t is the same for both objects, then the change in momentum must be the same for both. Digital: Momentum and Collisions animation
P2g Stopping distances
P1.22 P1.23
Explain methods of measuring human reaction times and recall typical results Recall that the stopping distance of a vehicle is made up of the sum of the thinking distance and the braking distance.
1) Display the Highway Code’s chart of increasing stopping distances with speed. Ask students to write down what they think braking distance and thinking distance might be and how each changes with
Students test reaction times. Visual reaction times should be of the order of about 0.2 seconds.
Equipment: Dropped ruler method: metre ruler; Circuit
Look at the Highway Code stopping distance chart in more detail. Students should recall that the stopping distance does not increase linearly with speed.
© Pearson Education Ltd 2015. Copying permitted for registered institution only. This material is not copyright free.
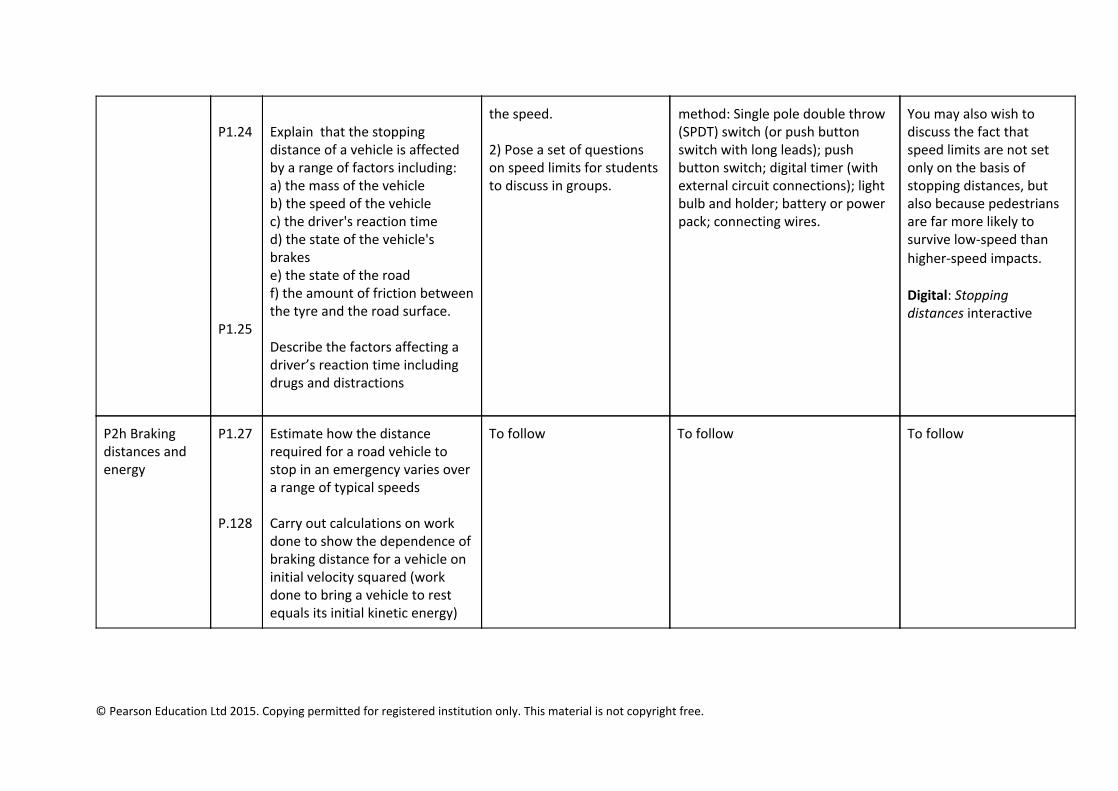
P1.24 P1.25
Explain that the stopping distance of a vehicle is affected by a range of factors including: a) the mass of the vehicle b) the speed of the vehicle c) the driver's reaction time d) the state of the vehicle's brakes e) the state of the road f) the amount of friction between the tyre and the road surface. Describe the factors affecting a driver’s reaction time including drugs and distractions
the speed. 2) Pose a set of questions on speed limits for students to discuss in groups.
method: Single pole double throw (SPDT) switch (or push button switch with long leads); push button switch; digital timer (with external circuit connections); light bulb and holder; battery or power pack; connecting wires.
You may also wish to discuss the fact that speed limits are not set only on the basis of stopping distances, but also because pedestrians are far more likely to survive low-speed than higher-speed impacts. Digital: Stopping distances interactive
P2h Braking distances and energy
P1.27 P.128
Estimate how the distance required for a road vehicle to stop in an emergency varies over a range of typical speeds Carry out calculations on work done to show the dependence of braking distance for a vehicle on initial velocity squared (work done to bring a vehicle to rest equals its initial kinetic energy)
To follow To follow To follow
© Pearson Education Ltd 2015. Copying permitted for registered institution only. This material is not copyright free.
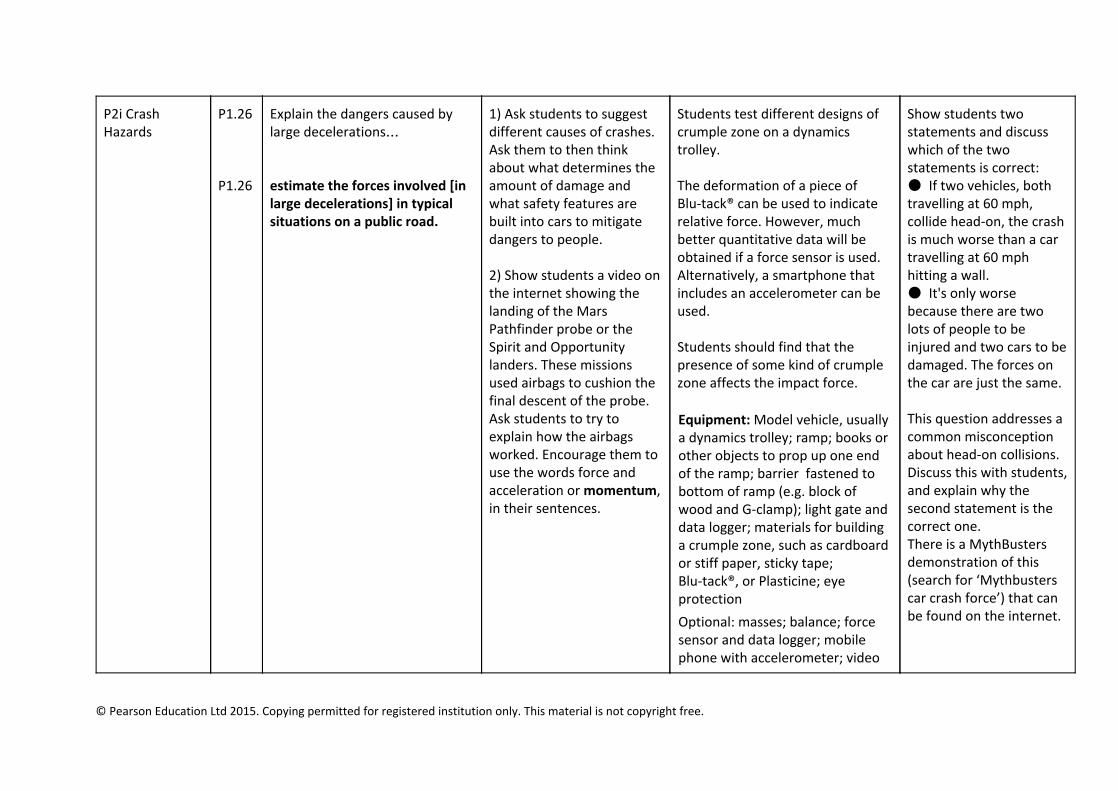
P2i Crash Hazards
P1.26 P1.26
Explain the dangers caused by large decelerations… estimate the forces involved [in large decelerations] in typical situations on a public road.
1) Ask students to suggest different causes of crashes. Ask them to then think about what determines the amount of damage and what safety features are built into cars to mitigate dangers to people. 2) Show students a video on the internet showing the landing of the Mars Pathfinder probe or the Spirit and Opportunity landers. These missions used airbags to cushion the final descent of the probe. Ask students to try to explain how the airbags worked. Encourage them to use the words force and acceleration or momentum, in their sentences.
Students test different designs of crumple zone on a dynamics trolley. The deformation of a piece of Blu-tack® can be used to indicate relative force. However, much better quantitative data will be obtained if a force sensor is used. Alternatively, a smartphone that includes an accelerometer can be used. Students should find that the presence of some kind of crumple zone affects the impact force. Equipment: Model vehicle, usually a dynamics trolley; ramp; books or other objects to prop up one end of the ramp; barrier fastened to bottom of ramp (e.g. block of wood and G-clamp); light gate and data logger; materials for building a crumple zone, such as cardboard or stiff paper, sticky tape; Blu-tack®, or Plasticine; eye protection
Optional: masses; balance; force sensor and data logger; mobile phone with accelerometer; video
Show students two statements and discuss which of the two statements is correct: ● If two vehicles, both travelling at 60 mph, collide head-on, the crash is much worse than a car travelling at 60 mph hitting a wall. ● It's only worse because there are two lots of people to be injured and two cars to be damaged. The forces on the car are just the same. This question addresses a common misconception about head-on collisions. Discuss this with students, and explain why the second statement is the correct one. There is a MythBusters demonstration of this (search for ‘Mythbusters car crash force’) that can be found on the internet.
© Pearson Education Ltd 2015. Copying permitted for registered institution only. This material is not copyright free.
camera or mobile phone with slow video playback facility
© Pearson Education Ltd 2015. Copying permitted for registered institution only. This material is not copyright free.