Embed Size (px)
Citation preview
ISSN 0001�4370, Oceanology, 2011, Vol. 51, No. 1, pp. 170–182. © Pleiades Publishing, Inc., 2011.Original Russian Text © A.A. Schreider, Al.A. Schreider, A.N. Boiko, J. Galindo�Zaldivar, A. Maldonado, E.I. Evsenko, 2011, published in Okeanologiya, 2011, Vol. 51, No. 1, pp. 175–187.
170
INTRODUCTION
The process of the Scotia Sea formation played avital role in the destruction of the continental bridgebetween South America and Antarctica. With no deepwater drilling holes available in the region of the ScotiaSea, the complex geological–geophysical interpreta�tion of the anomalous magnetic field from the view�point of the plate tectonics conception becomes ofmain value in the study of the principal stages of thisprocess.
Resulting from the geological–geophysical investi�gations carried out in the western part of the Scotia Seabetween 54°–60°S and 41°–67°W, the currently non�active West Scotia mid�oceanic ridge was discovered[1, 3, 4, 6, 7, 10, 11, 13, 36]. In the bottom relief, theridge coincides with the horst�like rise of more than500 km width with intensively eroded relief. Theheight of the crest is up to 2 km above the surface of theadjacent abyssal plains of the Yaghan Basin in thenorthwest and the Ona Basin in the southeast. Thedepth of the basins is about 3.5 km. The ridge is bor�dered by the Shackleton Fracture Zone in the west andby the southern peripherals of the North Scotia Ridgein the east.
An intensive magnetic anomaly of 200–500 nT andup to 50 km in width is observed above the ridge’s axis.In the southeast and northwest, it borders the linearmagnetic anomalies of 100–300 nT with wavelengthsof 20–40 km shifted along several transform faults byseveral tens of kilometers. Additionally, the research�
ers mentioned the extreme scarcity of data, which didnot enable them to identify the young and ancientpaleomagnetic anomalies reliably.
The linear magnetic anomalies and transformfaults in the Scotia Sea are still undetermined pre�cisely, and, being based on a limited amount of geolog�ical–geophysical data, they vary in their outlines indifferent publications. The complex geological–geo�physical study of the available materials on the anom�alous magnetic field (including the original data ofinvestigations carried out onboard the Spanish R/VGesperidas) and the reconstruction of the bottom geo�chronology in the area of the ridge and the adjacentbasins as well can significantly help in the study of thepaleogeodynamical problems. The present work isdevoted to both these objectives.
PARAMETERS OF THE ACOUSTIC BASEMENT
There are two types of the Scotia Sea bottom reliefmaps known, which are distinguished by the principlesthey are based on. The first type comprises theGEBCO maps generalizing all the known soundingprofiles along the routes of specialized research vessels(e.g., [1] et al.). The second type includes the topo�graphical maps of the bottom based on the integrationof sounding measurements and satellite altimetry data(e.g., [34] et al.).
Peculiarities of the Kinematics of the West Scotia Mid�Oceanic Ridge
A. A. Schreidera, Al. A. Schreiderb, A. N. Boikoa, J. Galindo�Zaldivarc, A. Maldonadod, and E. I. Evsenkoa
a Shirshov Institute of Oceanology, Russian Academy of Sciences, Moscow, Russiae�mail: [email protected]
b NIIgazekonomika Limited Company, Moscow, Russiac University of Granada, Granada, Spain
d Andalusian Institute for Earth Sciences, Granada, SpainReceived December 4, 2008; in final form, April 13, 2009
Abstract—The first map of the acoustic basement and a new map of the C4–C12 chrons are made for the area ofthe paleospreading West Scotia Ridge. The analysis of the constructed maps and the calculations showed that thebottom growth in the ridge axes began in the southeast in the interval of chron C12r (31.116–33.266 Ma B.P.). Inthe period of chron C11r (30.217–30.627 Ma), a hundred�kilometer northwestward jump of the spreadingaxis occurred. The maximal values of the bottom growth (about 6.3 cm/yr) were in the interval of chrons C6–C6B (18.748–22.546 Ma); then, the spreading began to fade. In the time of chron C3n.1r (3.300–4.493 Ma B.P.),the axis of the paleo�mid�oceanic ridge died. The spreading was accompanied with northeastward propagat�ing of the axes, and the propagating proper had an impulse character.
DOI: 10.1134/S0001437011010176
MARINE GEOLOGY
OCEANOLOGY Vol. 51 No. 1 2011
PECULIARITIES OF THE KINEMATICS OF THE WEST SCOTIA MID�OCEANIC 171
Satellite tracks cover the studied area in a relativelyeven manner, and this fact enables one to preparemaps with the resolution between the adjacent obser�vation tracks being 0.5 miles. The most modern ver�sion of such a map is the variant based on half�minuteaveraging of the results of the mathematical model forthe bottom relief [35, 38, 40]. However, the compari�son between the GEBCO bottom relief maps and themaps based on the satellite altimetry for the Scotia Seademonstrates their noncoincidence.
To choose the type of map for further use in thepresent work, we compared the data of the modernelectronic versions of both these types of maps at thepoints of the real sounding measurements carried outalong the profiles (Fig. 1) of the R/V Gesperidas in thewestern part of the Scotia Sea with the use of a SIM�RAD EM 12 digital sounding device. The oceano�graphic corrections for the primary observational dataderived from the sounding device were performed bythe Spanish side using specialized software developedat New Brunswick University (Great Britain) espe�cially for the specified conditions of the Scotia Sea.
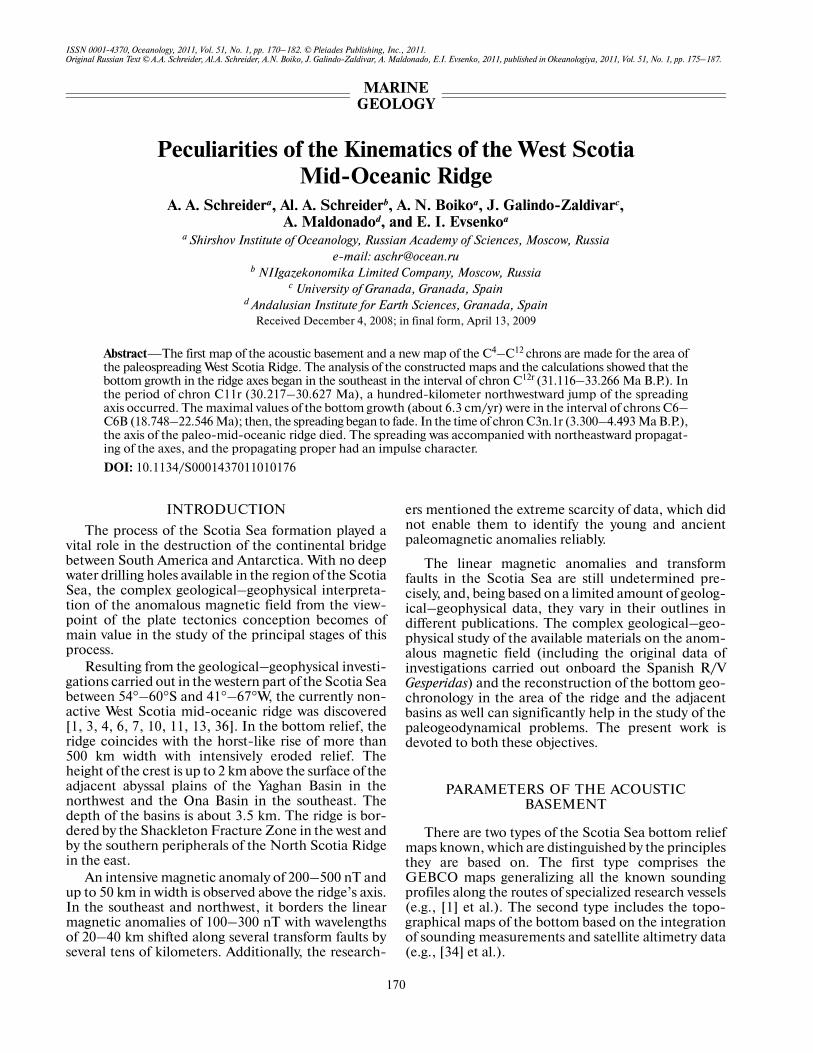
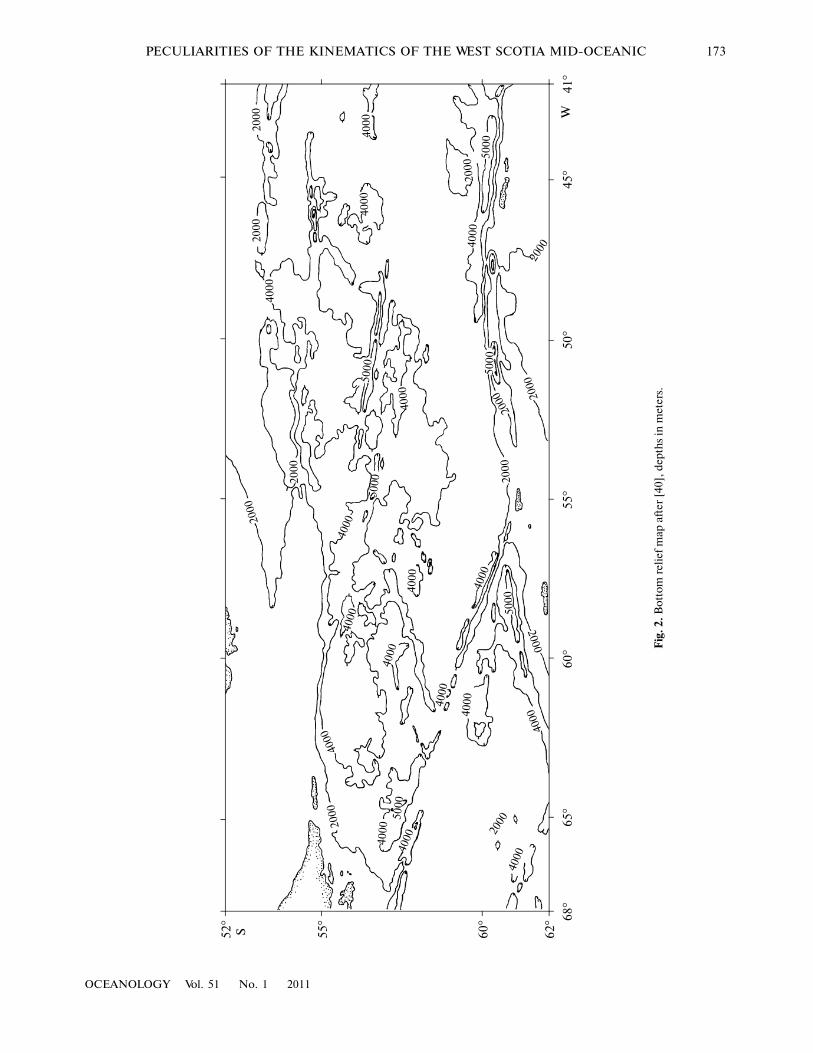
The visual comparison evidences the fact that thedata of the satellite altimetry are more close to the dataof the real sounding measurements. The statisticalprocessing of the discrepancy values between thesounding data, on the one hand, and the electronicvalues of the satellite altimetry and the electronic val�ues of the GEBCO maps, on the other hand, at thepoints of the sounding measurements evidences thesame. The mean deviation for 1032 points is 54 m bythe modulus for the altimetry data at the maximal dis�crepancy of 540 m, while the mean deviation for theGEBCO map exceeds 157 m at the maximal discrep�ancy of 1486 m. The value of the distribution medianis 30 m in the first case and more than 100 m in the sec�ond one. Hence, the data of the electronic bottommap (Fig. 2) based on the integration of the results ofthe sounding measurements and satellite altimetry(the data of the predict�relief map) reflect the bottomrelief features of the Scotia Sea more completely thanthe GEBCO�derived data do. It should be noted thatthe problem about the creation of a synthetical data�base uniting the best advances of both approaches inthe representation of the sea�bottom bathymetry isunder discussion by UNESCO. It is intended that thenew database would cover the World Ocean regionsfrom 80°N until 80°S.
The digital database for the complete sedimentthickness of the Scotia Sea [39] is part of the digitaldatabase for the World Ocean and shelf seas collectedby NOAA’s National Geophysical Data Center by theresults of studies along the profiles of uninterruptedseismic profiling archived by NOAA and by the seismicdata and isopachic maps available as part of the Inter�national Geological–Geophysical Atlases [1, 2, 16,19–21, 26].
Contour maps for the Pacific Ocean isopachs weretransferred into the digital form by Gregory Cole (Los
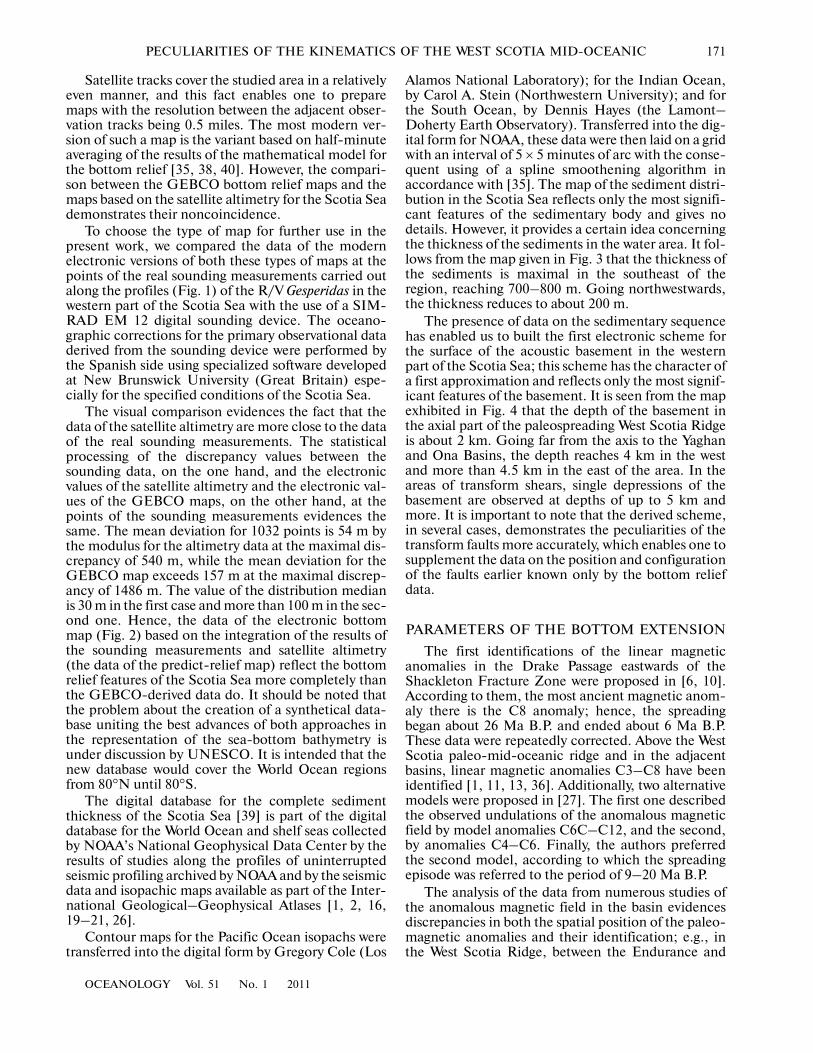
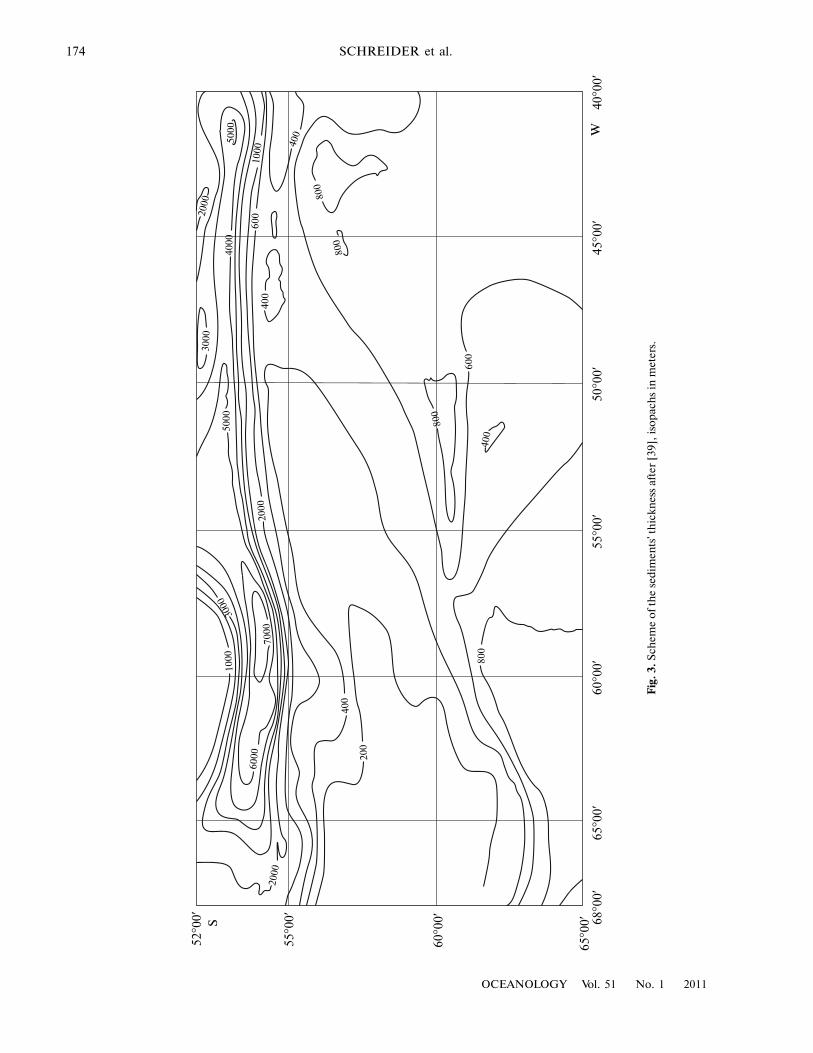
Alamos National Laboratory); for the Indian Ocean,by Carol A. Stein (Northwestern University); and forthe South Ocean, by Dennis Hayes (the Lamont–Doherty Earth Observatory). Transferred into the dig�ital form for NOAA, these data were then laid on a gridwith an interval of 5 × 5 minutes of arc with the conse�quent using of a spline smoothening algorithm inaccordance with [35]. The map of the sediment distri�bution in the Scotia Sea reflects only the most signifi�cant features of the sedimentary body and gives nodetails. However, it provides a certain idea concerningthe thickness of the sediments in the water area. It fol�lows from the map given in Fig. 3 that the thickness ofthe sediments is maximal in the southeast of theregion, reaching 700–800 m. Going northwestwards,the thickness reduces to about 200 m.
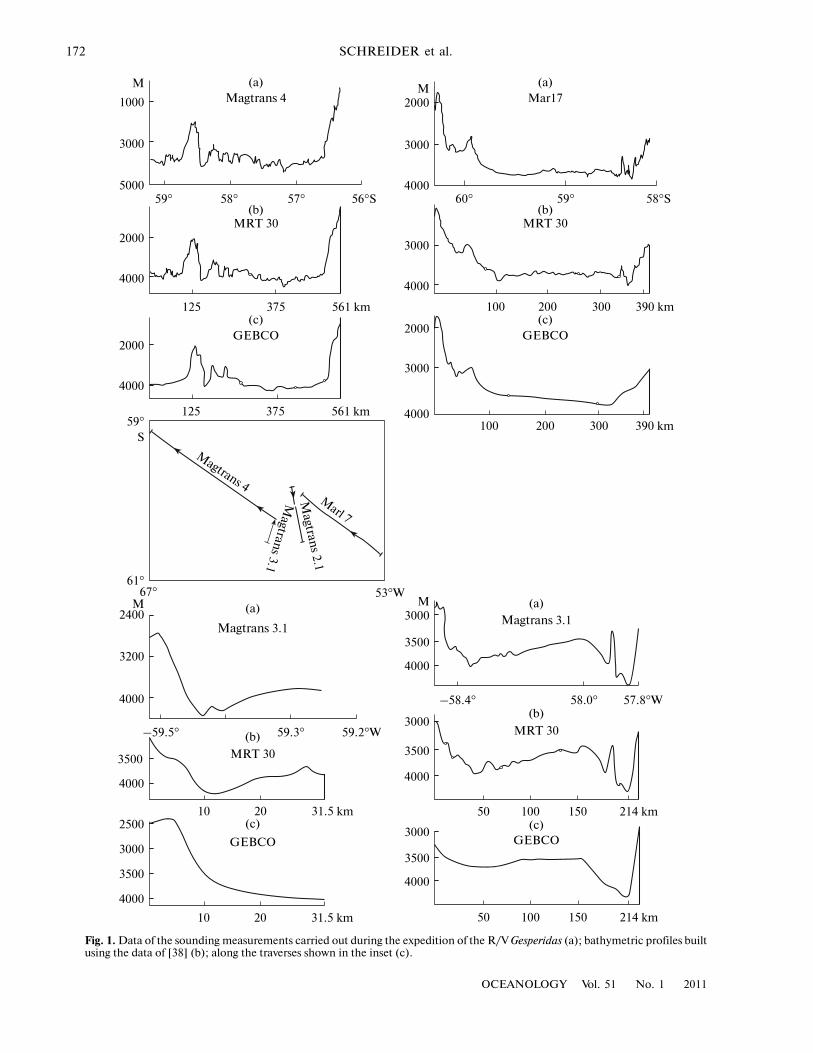
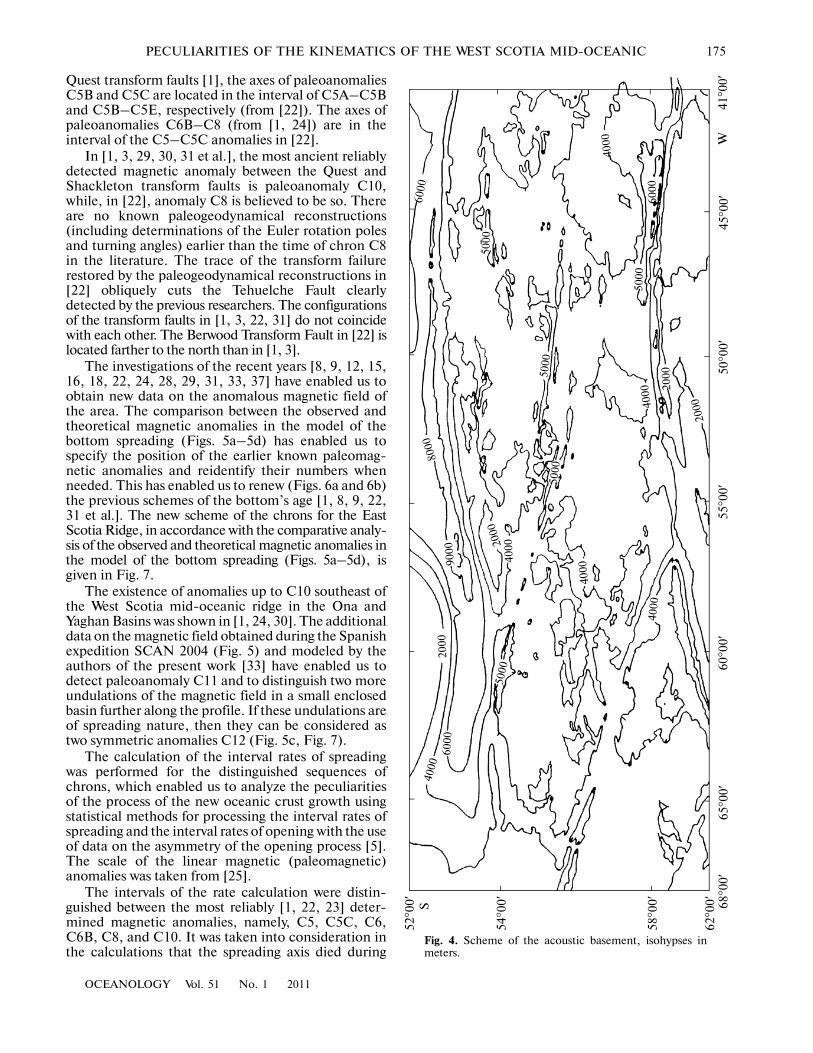
The presence of data on the sedimentary sequencehas enabled us to built the first electronic scheme forthe surface of the acoustic basement in the westernpart of the Scotia Sea; this scheme has the character ofa first approximation and reflects only the most signif�icant features of the basement. It is seen from the mapexhibited in Fig. 4 that the depth of the basement inthe axial part of the paleospreading West Scotia Ridgeis about 2 km. Going far from the axis to the Yaghanand Ona Basins, the depth reaches 4 km in the westand more than 4.5 km in the east of the area. In theareas of transform shears, single depressions of thebasement are observed at depths of up to 5 km andmore. It is important to note that the derived scheme,in several cases, demonstrates the peculiarities of thetransform faults more accurately, which enables one tosupplement the data on the position and configurationof the faults earlier known only by the bottom reliefdata.
PARAMETERS OF THE BOTTOM EXTENSION
The first identifications of the linear magneticanomalies in the Drake Passage eastwards of theShackleton Fracture Zone were proposed in [6, 10].According to them, the most ancient magnetic anom�aly there is the C8 anomaly; hence, the spreadingbegan about 26 Ma B.P. and ended about 6 Ma B.P.These data were repeatedly corrected. Above the WestScotia paleo�mid�oceanic ridge and in the adjacentbasins, linear magnetic anomalies C3–C8 have beenidentified [1, 11, 13, 36]. Additionally, two alternativemodels were proposed in [27]. The first one describedthe observed undulations of the anomalous magneticfield by model anomalies C6C–C12, and the second,by anomalies C4–C6. Finally, the authors preferredthe second model, according to which the spreadingepisode was referred to the period of 9–20 Ma B.P.
The analysis of the data from numerous studies ofthe anomalous magnetic field in the basin evidencesdiscrepancies in both the spatial position of the paleo�magnetic anomalies and their identification; e.g., inthe West Scotia Ridge, between the Endurance and
172
OCEANOLOGY Vol. 51 No. 1 2011
SCHREIDER et al.
(c)
(а)М
1000
3000
500059° 58° 57° 56°S
Magtrans 4
2000
4000
125 375 561 km
МRT 30
GEBCO
(b)
(c)
2000
4000
125 375 561 km59°
S
61°67° 53°W
Magtrans 4
Magtran
s 3.1
Magtran
s 2.1M
arl 7
М2400
3200
4000
–59.5° 59.3° 59.2°W
(а)
(b)
3500
4000
10 20 31.5 km2500
3000
3500
4000
Magtrans 3.1
МRT 30
GEBCO
10 20 31.5 km
(c)
(а)
(b)
Magtrans 3.1
МRT 30
GEBCO
–58.4° 58.0° 57.8°W
М3000
3500
4000
50 100 150 214 km
3000
3500
4000
50 100 150 214 km
3000
3500
4000
(а)
(b)
(c)
М2000
3000
400060° 59° 58°S
100 200 300 390 km
3000
4000
2000
3000
4000100 200 300 390 km
Mar17
МRT 30
GEBCO
Fig. 1. Data of the sounding measurements carried out during the expedition of the R/V Gesperidas (a); bathymetric profiles builtusing the data of [38] (b); along the traverses shown in the inset (c).
OCEANOLOGY Vol. 51 No. 1 2011
PECULIARITIES OF THE KINEMATICS OF THE WEST SCOTIA MID�OCEANIC 173
52°
S 55°
60°
62°
68°
65°
60°
55°
50°
45°
41°
W
2000
4000
2000
2000
2000
2000 20
00
2000
2000
400040
00
4000
4000
4000
4000
4000
4000
4000
4000
4000
4000
4000
2000
4000
4000
2000
5000
5000
5000
5000
5000
5000
2000
4000
2000
Fig
. 2. B
otto
m r
elie
f map
aft
er [
40],
dep
ths
in m
eter
s.
174
OCEANOLOGY Vol. 51 No. 1 2011
SCHREIDER et al.
55°00′
60°00′
65°00′ 68°00′
50°00′
45°00′
40°00′
W
2000
200
800
400
6000
1000
3000
7000
5000
4000
52°00′
S
65°00′
60°00′
55°00′20
00
2000
800
800
800
400
400
400
1000
3000
5000
600
600
Fig
. 3. S
chem
e of
th
e se
dim
ents
' th
ickn
ess
afte
r [3
9],
isop
ach
s in
met
ers.
OCEANOLOGY Vol. 51 No. 1 2011
PECULIARITIES OF THE KINEMATICS OF THE WEST SCOTIA MID�OCEANIC 175
Quest transform faults [1], the axes of paleoanomaliesC5B and C5C are located in the interval of C5A–C5Band C5B–C5E, respectively (from [22]). The axes ofpaleoanomalies C6B–C8 (from [1, 24]) are in theinterval of the C5–C5C anomalies in [22].
In [1, 3, 29, 30, 31 et al.], the most ancient reliablydetected magnetic anomaly between the Quest andShackleton transform faults is paleoanomaly C10,while, in [22], anomaly C8 is believed to be so. Thereare no known paleogeodynamical reconstructions(including determinations of the Euler rotation polesand turning angles) earlier than the time of chron C8in the literature. The trace of the transform failurerestored by the paleogeodynamical reconstructions in[22] obliquely cuts the Tehuelche Fault clearlydetected by the previous researchers. The configurationsof the transform faults in [1, 3, 22, 31] do not coincidewith each other. The Berwood Transform Fault in [22] islocated farther to the north than in [1, 3].
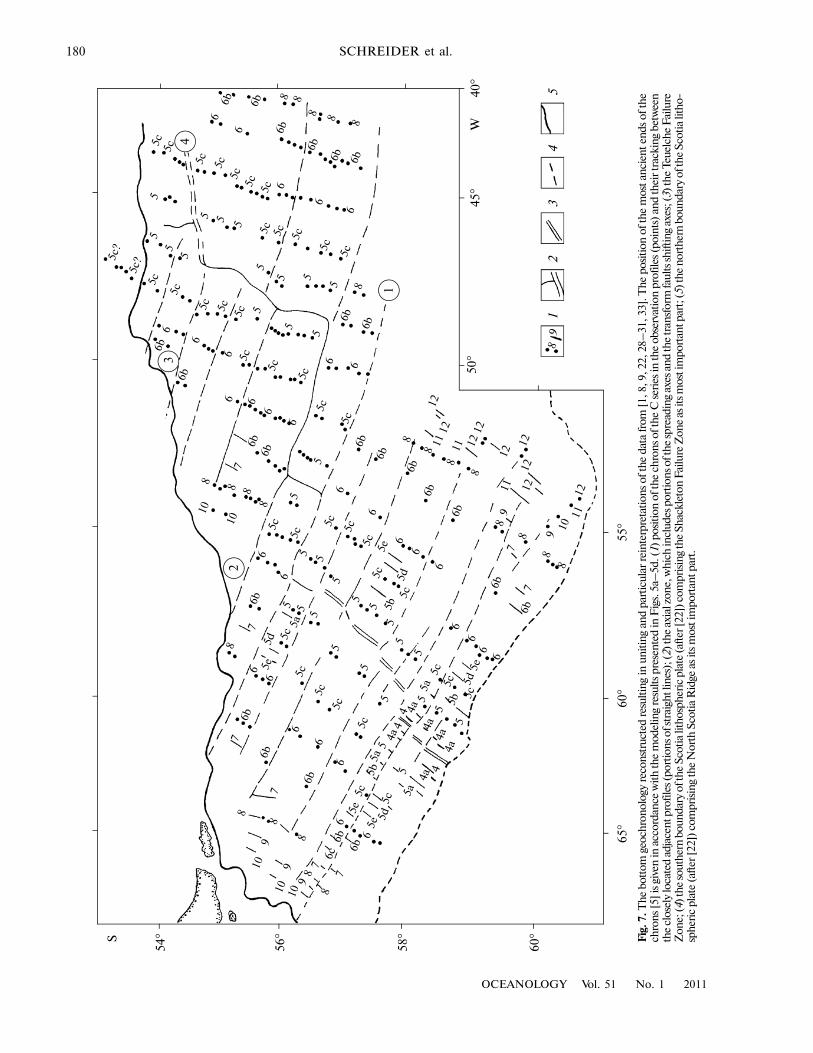
The investigations of the recent years [8, 9, 12, 15,16, 18, 22, 24, 28, 29, 31, 33, 37] have enabled us toobtain new data on the anomalous magnetic field ofthe area. The comparison between the observed andtheoretical magnetic anomalies in the model of thebottom spreading (Figs. 5a–5d) has enabled us tospecify the position of the earlier known paleomag�netic anomalies and reidentify their numbers whenneeded. This has enabled us to renew (Figs. 6a and 6b)the previous schemes of the bottom’s age [1, 8, 9, 22,31 et al.]. The new scheme of the chrons for the EastScotia Ridge, in accordance with the comparative analy�sis of the observed and theoretical magnetic anomalies inthe model of the bottom spreading (Figs. 5a–5d), isgiven in Fig. 7.
The existence of anomalies up to C10 southeast ofthe West Scotia mid�oceanic ridge in the Ona andYaghan Basins was shown in [1, 24, 30]. The additionaldata on the magnetic field obtained during the Spanishexpedition SCAN 2004 (Fig. 5) and modeled by theauthors of the present work [33] have enabled us todetect paleoanomaly C11 and to distinguish two moreundulations of the magnetic field in a small enclosedbasin further along the profile. If these undulations areof spreading nature, then they can be considered astwo symmetric anomalies C12 (Fig. 5c, Fig. 7).
The calculation of the interval rates of spreadingwas performed for the distinguished sequences ofchrons, which enabled us to analyze the peculiaritiesof the process of the new oceanic crust growth usingstatistical methods for processing the interval rates ofspreading and the interval rates of opening with the useof data on the asymmetry of the opening process [5].The scale of the linear magnetic (paleomagnetic)anomalies was taken from [25].
The intervals of the rate calculation were distin�guished between the most reliably [1, 22, 23] deter�mined magnetic anomalies, namely, C5, C5C, C6,C6B, C8, and C10. It was taken into consideration inthe calculations that the spreading axis died during
52°00′
S
54°00′
58°00′
62°00′
68°00′
65°00′
60°00′
55°00′
50°00′
45°00′
41°00′
W
2000
2000
2000
4000
4000
4000
4000
4000
5000
5000
5000
4000
6000
5000
2000
5000
8000
9000
6000
6000
Fig. 4. Scheme of the acoustic basement, isohypses inmeters.

176
OCEANOLOGY Vol. 51 No. 1 2011
SCHREIDER et al.
chron C3n.1r [23]. According to the calculations, thebottom spreading was not monotonous, the intervalrates the spreading changed from 0.9 to 2.9 cm/yr inthe northwestern flank of the ridge and from 0.8 to3.5 cm/yr in the southeastern flank. The highest ratesare noted for the chron interval of C6–C6B.
The distribution of the spreading asymmetry valuesin time demonstrates that the growth rates of thenorthwestern flank of the ridge are greater than rates ofthe southeastern one in the intervals before 22–26 andafter 16 Ma B.P., while, in the intervals of 16–22 andbefore 26 Ma B.P., the southeastern flank grew moreintensively than the northwestern one. The spread ofthe calculation values is within the limits of ±20% fromof 1 corresponding to the symmetric growing charac�ter of the new oceanic crust material.
The summation of the flank spreading rate valuesin every single spreading cell has enabled us to derivethe values of the bottom opening rates and to analyzethe distribution of the relative interval spreading rates.
According to the calculations, the values of theopening rates varied from 1.8 to 6.4 cm/yr. The rategrew beginning from the time of chron C11rC11r(30.217–30.627 Ma B.P.) and later and reached itsmaximum in the interval of chrons C6–C6B (18.748–22.564 Ma B.P.). Then, the general deceleration of theprocess of the new oceanic crust growing had begun;spreading rate had been progressively decreasing, andit had reached values of 1.8 cm/yr in the interval ofchron C5–C3An.1n (such rates are typical forultraslow spreading ridges). Soon after this, thespreading axis of the West Scotia Ridge dies in theinterval of chron C3n.1r (3.300–4.493 Ma B.P.).
nТ200
0
1
2
3
4
(а)
1'
2'
3'
4'
km2
3
4
5
6
С5
С3A
n1n
C5B
W 60°
S
58°
59°63°
nТ200
0
–200
12
34
1'2'
3'4'
С5
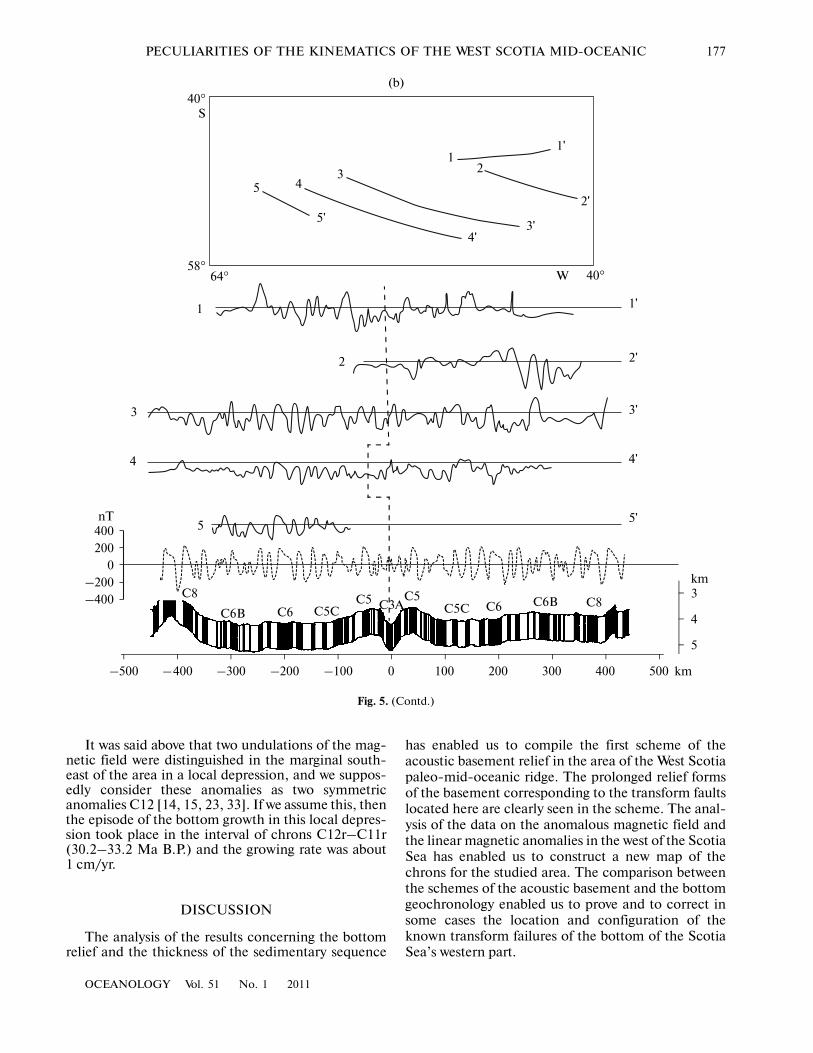
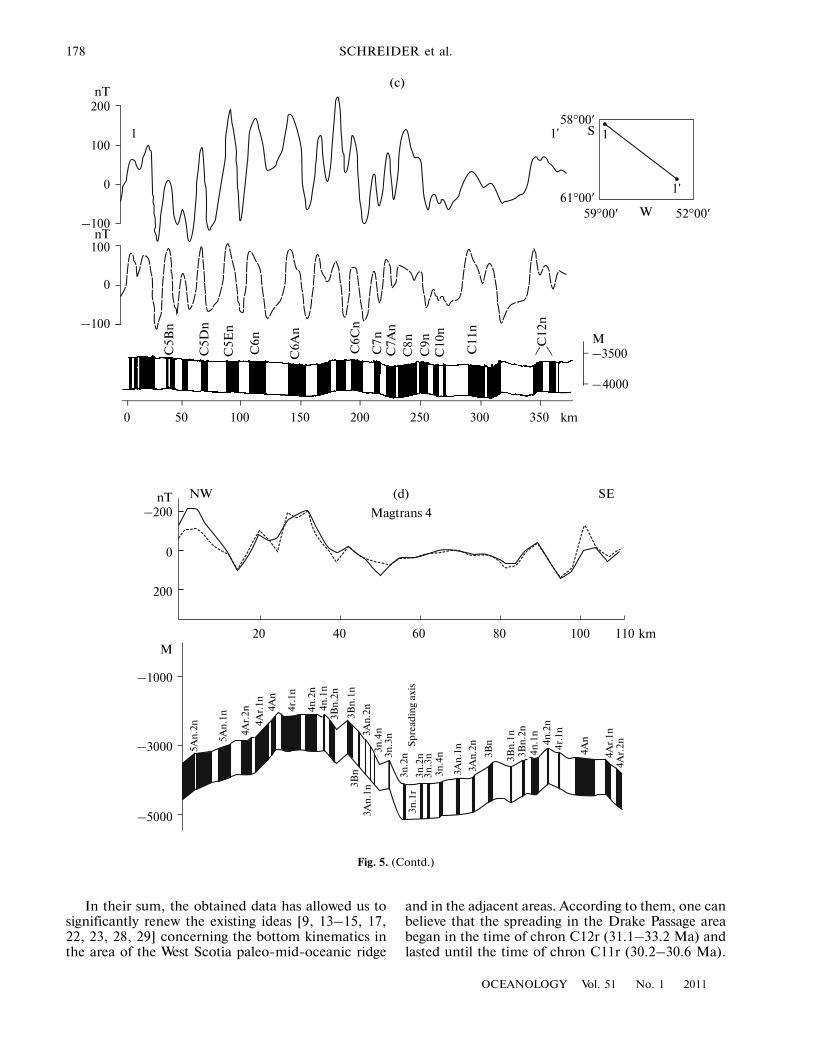
Fig. 5. Magnetic anomalies in the model of the bottom spreading observed (solid line) in various areas (a–d) of the West ScotiaRidge [22, 33] and the theoretical anomalies (dashed line). The profile numbers of the anomalous magnetic field are the same asin the corresponding insets. The location of the Magtrans 4 profile is given in the inset of Fig. 1. The upper boundary of the inver�sional magnetoactive layer coincides with the relief of the acoustic basement. The lower surface of the layer conforms to the reliefof the acoustic basement with the thickness of the layer being 0.5 km, while the magnetization is assumed to be 5 A/m. The angu�lar parameters of the magnetization vector are taken in accordance with the parameters of the field of the axisymmetric terrestrialdipole, and the parameters of the modern magnetic field correspond to those in the DGRF field of the surveyed epoch. The namesof the identified polarity chrons are given.
OCEANOLOGY Vol. 51 No. 1 2011
PECULIARITIES OF THE KINEMATICS OF THE WEST SCOTIA MID�OCEANIC 177
It was said above that two undulations of the mag�netic field were distinguished in the marginal south�east of the area in a local depression, and we suppos�edly consider these anomalies as two symmetricanomalies C12 [14, 15, 23, 33]. If we assume this, thenthe episode of the bottom growth in this local depres�sion took place in the interval of chrons C12r–C11r(30.2–33.2 Ma B.P.) and the growing rate was about1 cm/yr.
DISCUSSION
The analysis of the results concerning the bottomrelief and the thickness of the sedimentary sequence
has enabled us to compile the first scheme of theacoustic basement relief in the area of the West Scotiapaleo�mid�oceanic ridge. The prolonged relief formsof the basement corresponding to the transform faultslocated here are clearly seen in the scheme. The anal�ysis of the data on the anomalous magnetic field andthe linear magnetic anomalies in the west of the ScotiaSea has enabled us to construct a new map of thechrons for the studied area. The comparison betweenthe schemes of the acoustic basement and the bottomgeochronology enabled us to prove and to correct insome cases the location and configuration of theknown transform failures of the bottom of the ScotiaSea’s western part.
(b)40°
S
58°64° W 40°
5
4
3
2
1 1'
2'
3'
4'
5'nТ400200
0–200–400
km3
4
5
С8
C6B C6 C5CC5 C3A
–500 –400 –300 –200 –100 0 100 200 300 400 500
С8C6C5CC5 C6B
km
2'
3'4'
5'
5 43 2
11'
Fig. 5. (Contd.)
178
OCEANOLOGY Vol. 51 No. 1 2011
SCHREIDER et al.
In their sum, the obtained data has allowed us tosignificantly renew the existing ideas [9, 13–15, 17,22, 23, 28, 29] concerning the bottom kinematics inthe area of the West Scotia paleo�mid�oceanic ridge
and in the adjacent areas. According to them, one canbelieve that the spreading in the Drake Passage areabegan in the time of chron C12r (31.1–33.2 Ma) andlasted until the time of chron C11r (30.2–30.6 Ma).
nТ200
100
0
–100
(c)
1'158°00′
S
61°00′59°00′ W 52°00′
М–3500
–4000
0 50 100 150 200 250 300 350 km
C5B
n
C5D
n
C5E
n
C6n
C6A
n
C6C
n
C7n
C7A
nC
8nC
9nC
10n
C11
n
C12
n
1
1'
nТ100
0
–100
(d)NW SEnТ–200
0
200
20 40 60 80 100 110 km
–1000
–3000
–5000
Magtrans 4
5An
.2n
5An
.1n
4Ar.
2n
4Ar.
1n 4An
4r.1
n
4n.2
n4n
.1n
3Bn
.2n
3Bn
.1n
3An
.2n
3n.4
n3n
.3n
3n.2
n3n
.1r
3Bn
3An
.1n
М
Sp
read
ing
axis
3n.2
n3n
.3n
3n.4
n
3An
.1n
3An
.2n
3Bn
3Bn
.1n
3Bn
.2n
4n.1
n4n
.2n
4r.1
n
4An
4Ar.
1n4A
r.2n
Fig. 5. (Contd.)
OCEANOLOGY Vol. 51 No. 1 2011
PECULIARITIES OF THE KINEMATICS OF THE WEST SCOTIA MID�OCEANIC 179
Then, a northwestward jump of the spreading axisoccurred. Additionally, since the time of chron C11r, thebottom growth rate increased and reached its maximumin the interval of chrons C6B–C6 (19.7–23.1 Ma B.P.).After this, the spreading process became less intensiveand its rate attenuated.
The implemented analysis of the bottom geochro�nology scheme evidences the fact that the paleoanom�alies older than C8 can be distinguished in the south�western and central parts of the studied area; the pale�
oanomalies older than C5C cannot be detected in thenortheast of the area. Most probably, this fact isexplained by the impulse character of the northeast�ward propagating of the spreading axes.
In the time of C11r (30.2–30.6 Ma B.P.), thespreading occupied the space to the northeast of theShackleton Fracture Zone up to the Birdwood trans�form fault. During chron C6B (21.7–22.5 Ma B.P.),the spreading axes reached the northern part of theTehuelche Fracture. Finally, in the time of chron C5C
54°S
56°
58°
60°
64° 52° 48°W
(а)
10
8
66B
5C5
12
1
2
3
60° 56°
8
8
8
8
8
8
8
8
6 6
6
6
6
6
6
6
6
6B
6B
6B
6B6B
5C
5C
5C
5C
5C
5C
5C
5
5
55
5
5
5
5
5
55
12
8
6
6
S
54°
56°
58°52° 44° 40°W
(b)
10
8
6
6B
48°
88
6
6
6
66
6
6B
6B
6B
5C 5C
5C
5C 5C
5C
55
5
5
55
5
8
6
6
56°
6B
6B
6B5C
5C
5 5C
5C
66B
8
86B
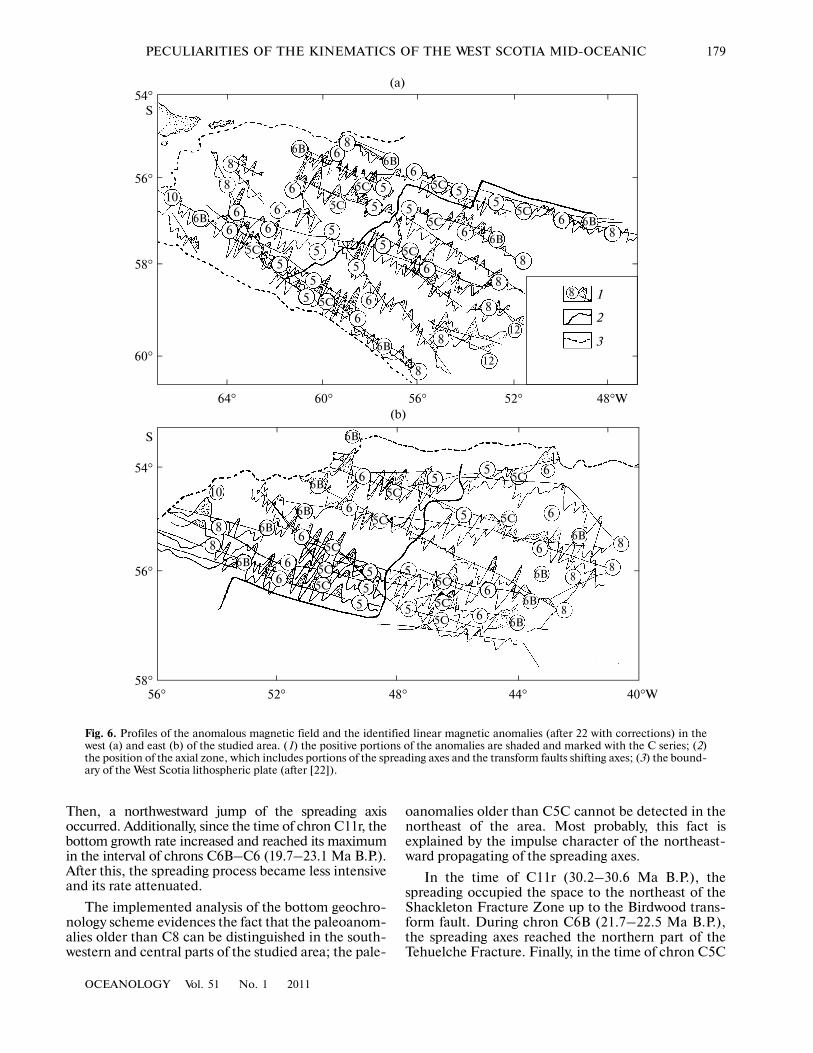
Fig. 6. Profiles of the anomalous magnetic field and the identified linear magnetic anomalies (after 22 with corrections) in thewest (a) and east (b) of the studied area. (1) the positive portions of the anomalies are shaded and marked with the C series; (2)the position of the axial zone, which includes portions of the spreading axes and the transform faults shifting axes; (3) the bound�ary of the West Scotia lithospheric plate (after [22]).
180
OCEANOLOGY Vol. 51 No. 1 2011
SCHREIDER et al.
S
54°
56°
58°
60°
65°
60°
55°
50°
45°
W40°
1
2
34
5c?
5c5
66b
8
10
7
5d
5a
5e
9
4a4
1112
5c
5c 5c5c
5c 5c5c 5c 5c
5c 5c
5c
5c
5c
5c
5c
5c?
55
5
5 5 5
5
5
5
55
555
5
5
5
5
5
5
5
5555
5
6b
6b6b
6b
6b
6b
6b6b
6b6b
6b6b
6b
6b6b
6b
6
66 6
6
6
6
6
6
6
6
6
66
6
6
66
6
6
6
6
5c
88 8 8
8
8
8
8
8
8
8
8
8
10
8 8 8
87
5d
5d
5d
5c
9
11
11
5c 5c 5c
5
12
1212
12
1212
12
6 6
5c
5c
5c 5c
5c5c
5c
5e
5c5c
5c5c
5c
5b5
5
5e5c5c
5c
5b
5a
5a
5a
6b
6b
6b
6b6b
4a4a
4a4a
4a
5e5c
5b5c
5
5
44
5
5
5
6b
6b7
7
910
811
12
6
6
66
6
6
6
8
6b
7
7
5e
7
7
88
8
8
8
6c
10
10 109
9
9
12
34
5
Fig
. 7. T
he b
otto
m g
eoch
rono
logy
rec
onst
ruct
ed r
esul
ting
in u
nitin
g an
d pa
rtic
ular
rei
nter
pret
atio
ns o
f the
dat
a fr
om [
1, 8
, 9, 2
2, 2
8–31
, 33]
. The
pos
ition
of t
he m
ost a
ncie
nt e
nds
of th
ech
rons
[5] i
s gi
ven
in a
ccor
danc
e w
ith th
e m
odel
ing
resu
lts p
rese
nted
in F
igs.
5a–
5d. (
1) p
ositi
on o
f the
chr
ons
of th
e C
ser
ies
in th
e ob
serv
atio
n pr
ofile
s (p
oint
s) a
nd th
eir t
rack
ing
betw
een
the
clos
ely
loca
ted
adja
cent
pro
files
(por
tions
of s
trai
ght l
ines
); ( 2
) the
axi
al z
one,
whi
ch in
clud
es p
ortio
ns o
f the
spre
adin
g ax
es a
nd th
e tr
ansf
orm
faul
ts sh
iftin
g ax
es; (
3) th
e Te
uelc
he F
ailu
reZ
one;
( 4) t
he so
uthe
rn b
ound
ary
of th
e Sc
otia
lith
osph
eric
pla
te (a
fter
[22]
) com
pris
ing
the
Shac
klet
on F
ailu
re Z
one
as it
s mos
t im
port
ant p
art;
(5) t
he n
orth
ern
boun
dary
of t
he S
cotia
lith
o�sp
heri
c pl
ate
(aft
er [2
2])
com
pris
ing
the
Nor
th S
cotia
Rid
ge a
s its
mos
t im
port
ant p
art.
OCEANOLOGY Vol. 51 No. 1 2011
PECULIARITIES OF THE KINEMATICS OF THE WEST SCOTIA MID�OCEANIC 181
(15.9–17.2 Ma B.P.), the spreading axes moved fur�ther northeastwards to the area of the North ScotiaRidge, and, soon after the time of chron C3n.1r(3.300–4.493 Ma B.P.), the axis of the paleo�mid�oceanic ridge died.
CONCLUSIONS
Thus, resulting from the carried out study is thefirst map for the surface of the acoustic basement inthe western part of the Scotia Sea. It helped to specifythe configuration of the transform faults in the newlymade map of the chrons for the area of the West Scotiamid�oceanic ridge. The spreading in the Drake Pas�sage area began in the time of chron C12r (31.1–33.2 Ma)and lasted until the time of chron C11r (30.2–30.6 Ma).Then, a northwestward jump of the spreading axisoccurred. Additionally, since the time of chron C11r,the bottom growth rate increased and reached its max�imum in the interval of chrons C6B–C6 (19.7–23.1 Ma B.P.). After this, the spreading processbecame less intensive and its rate attenuated.
The bottom’s growth was accompanied by thepropagating of the spreading axes, while the propagat�ing proper had an impulse character. In the time ofC11r (30.2–30.6 Ma B.P.), the spreading occupied thespace to the northeast of the Shackleton FractureZone up to areas located one hundred kilometersnorth to the Endurance Fault. In the time of chron C8(25.2–30.6 Ma B.P.), the spreading axes moved north�wards to the Birdwood transform fault.
During chron C6B (21.7–22.5 Ma B.P.), the spread�ing axes reached the northern part of the Tehuelche Frac�ture. In the time of chron C5C (15.9–17.2 Ma B.P.), thespreading axes moved further northeastwards to thearea of the North Scotia Ridge. In the time of chronC3n.1r (3.300–4.493 Ma B.P.), the axis of the paleo�mid�oceanic ridge died. The growth rates of the north�western flank of the ridge were greater than the rates ofthe southeastern one in the intervals before 22–26 andafter 16 Ma B.P., while, in the intervals of 16–22 andbefore 26 Ma B.P., the southeastern flank grew moreintensively than the northwestern one.
ACKNOWLEDGMENTS
This work was supported by the Russian Founda�tion for Basic Research (project no. 08�05�00138).
REFERENCES
1. Atlas. Geological–Geophysical Atlas of the Atlantic Ocean(GUGK, Moscow, 1990) [in Russian].
2. Atlas. Geological–Geophysical Atlas of the Atlantic Ocean(GUGK, Moscow, 2001) [in Russian].
3. A. V. Zhivago, “Morphological Structure of the Seaf�loor of the Southwestern Part of the Atlantic Ocean andthe Scotia Sea,” Trudy Inst. Okeanol. Akad. NaukSSSR 126, 137–171 (1990).
4. G. B. Udintsev, G. V. Shenke, T. Shene, et al., “Struc�ture of the Scotia Sea Bottom, West Antarctic,” Dokl.Akad. Nauk 371 (2), 243–247 (2000) [Dokl. Soil Sci.371 (2), 411–416 (2000)].
5. A. A. Schreider, Geomagnetic Studies of the IndianOcean (Nauka, Moscow, 2001) [in Russian].
6. P. Barker, “A Spreading Center in the East Scotia Sea,”Earth Planet. Sci. Lett. 15, 123–132 (1972).
7. P. Barker, “The Cenozoic Subduction History of thePacific Margin of the Antarctic Peninsula: RidgeCrest–Trench Interactions,” J. Geol. Soc. London139, 787–801 (1982).
8. P. Barker, Tectonic Framework of the East Scotia Sea.Back�Arc Basins: Tectonic and Magmatism (Plenum,New York, 1995), pp. 281–314.
9. P. Barker, “Scotia Sea Regional Tectonic Evolution:Implications for Mantle Flow and Paleocirculation,”Earth Sci. Rev. 55, 1–39 (2001).
10. P. Barker and J. Burrell, “The Opening of Drake Pas�sage,” Mar. Geol. 25, 15–34 (1997).
11. P. Barker and I. Dalziel, “Progress in Geodynamics inthe Scotia Arc Region,” Geodynamics of the EasternPacific Region, Caribbean and Scotia Arcs, Geody�namic Series 9, 137–170 (1983).
12. P. F. Barker, I. Dalziel, and B. C. Storey, “TectonicDevelopment of the Scotia Arc Region,” in The Geol�ogy of Antarctica (Science Publications, Oxford, 1991),pp. 215–248.
13. P. Barker and I. Hill, “Back�Arc Extension in theScotia Sea,” Phil. Trans. Royal Soc. London Ser. A300, 249–262 (1981).
14. F. Bohoyo, J. Galindo�Zaldivar, A. Jabaloy, et al.,“Extentional Deformation and Development of DeepBasins Associated with the Transcurrent Fault Zone ofthe Scotia–Antarctic Plate Boundary,” Geol. Soc.Lond. Spec. Publ. 290, 203–217 (2007a).
15. F. Bohoyo, J. Galindo�Zaldivar, A. Jabaloy, et al.,“Desarrollo de Cuencas Extensionales Profundas conla Zona de Falla Transcurrente del Limite de PlacasScotia–Anarctica,” Revista de la Sociedad geologicade Espana 20 (1–2), 89–103 (2007b).
16. N. Bruguier and R. Livermore, “Enhanced MagmaSupply at the Southern East Scotia Sea Ridge: Evi�dence for Mantle Flow around the Subducting Slab?,”Earth Planet. Sci. Lett. 191, 129–144 (2001).
17. S. Cande, J. La Breque, R. Larson, et al., “MagneticLineations of the Worlds Ocean Basins,” Am. Ass.Petrol. Geol. Tulsa. Okla, 1 (1989).
18. W. Cuningham, I. Dalziel, T. Lee, and L. Lawver,“Southernmost America–Antarctic Peninsula RelativePlate Motion since 84 Ma: Implications for the Tec�tonic Evolution of the Scotia Arc Region,” J. Geophys.Res. 100 (5), 8257–8266 (1995).
19. D. Divins, NGDC Total Sediment Thickness of theWorld’s Oceans and Marginal Seas, www.ngdc.noaa.gov/mgg/sedthick/sedthick.html (2008).
20. D. Divins, “Thickness of Sedimentary Cover in theEastern Pacific Ocean,” in International Geological–Geophysical Atlas of the Pacific Ocean (GUGK, Mos�cow, 2001), pp. 120, 130.
182
OCEANOLOGY Vol. 51 No. 1 2011
SCHREIDER et al.
21. D. Divins and P. Rabinowitz, “Thickness of Sedimen�tary Cover for the South Atlantic,” in InternationalGeological–Geophysical Atlas of the Atlantic Ocean(GUGK, Moscow, 1990), pp. 126–127.
22. G. Eagles, R. Livermore, D. Fairhead, and P. Morris,“Tectonic Evolution of the West Scotia Sea,” J. Geo�phys. Res. 110, 19 (2005).
23. J. Galindo�Zaldivar, F. Bohoyo, A. Maldonado, et al.,“Oceanic Spreading in the Southern Scotia Sea: NewEvidences of the Initial Stages of Opening of the DrakePassage,” XXX SCAR Abstracts (St. Petersburg, 2008),p. 67.
24. R. Geletti, E. Lodolo, A. Schreider, and A. Polonia,“Seismic Structure and Tectonics of the ShackletonFracture Zone (Drake Passage, Scotia Sea),” Mar.Geophys. Res. 26, 17–28 (2005).
25. F. Gradstein, J. Ogg, A. Smith, et al., A Geologic TimeScale 2004 (Cambridge, Camb. Univ. Press, 2006).
26. D. Hayes and J. LaBrecque, “Sediment Isopachs: Cir�cum�Antarctic to 30°S,” in Marine Geological and Geo�physical Atlas of the Circum�Antarctic to 30°S (Am.Geophys. Union, 1991), pp. 29–33.
27. I. Hill and P. Barker, “Evidence for Miocene Back�ArcSpreading in the Scotia Sea,” Geophys. J. R. Astr. Soc.63, 427–440 (1980).
28. R. Livermore, A. Cunningham, L. Vanneste, andR. Larter, “Subduction Influence on Magma Supply atthe East Scotia Ridge,” Earth Planet. Sci. Lett. 150,261–275 (1997).
29. R. Livermore, D. McAdoo, and K. Marks, “Scotia SeaTectonics from High�Resolution Satellite Gravity,”Earth Planet. Sci. Lett. 123, 255–268 (1994).
30. E. Lodolo, F. Coren, A. A. Schreider, and G. Geccone,“Geophysical Evidence of a Relict Oceanic Crust in theSouthwestern Scotia Sea,” Mar. Geophys. Res. 19,439–450 (1998).
31. E. Lodolo, F. Donda, and A. Tassone, “Western ScotiaSea Margins: Improved Constraints on the Opening ofthe Drake Passage,” J. Geophys. Res. 111, 14 (2006).
32. W. Ludwig and R. Houtz, “Isopach Map of the Sedi�ments in the Pacific Ocean Basin, Color Map withText,” Am. Assoc. Pet. Geol. Tulsa. OK, 1 (1979).
33. A. Maldonado, F. Bohoyo, J. Galindo�Zaldivar, et al.,“Early Opening of the Drake Passage Regional SeismicStratigraphy and Paleooceanographic Implications,” inThe 10th International Symposium on Antarctic EarthSciences, August 26 to September 1, 2007, Univ. Calif.,Santa Barbara (Santa Barbara, 2007), Vol. 4, Pt. 2, B�3(isaes2007.geol.ucsb.edu).
34. W. Smith and D. Sandwell, “Global Sea Floor Topog�raphy from Satellite Altimetry and Ship Depth Sound�ings,” Science 277, 1956–1962 (1997).
35. W. Smith and P. Wessel, “Gridding with ContinuousCurvature Splines in Tension,” Geophysics 55, 293�305 (1990).
36. Tectonic Map of the Scotia Arc 1:3000000 (British Ant�arctic Survey, Cambridge, 1985).
37. C. Thomas, R. Livermore, and F. Politz, “Motion ofthe Scotia Sea Plates,” Geoph. J. Int. 155, 789–804(2003).
38. www.bodc.ac.uk/products/bodc_products/gebco/39. www.ngdc.noaa.gov/mgg/sedthick/sedthick.html40. www. topex.ucsd.edu/html/mar_topo.html