Embed Size (px)
Citation preview
Perceived Usefulness, Ease of Use, and Usage of Information Technology: A ReplicationAuthor(s): Dennis A. Adams, R. Ryan Nelson, Peter A. ToddSource: MIS Quarterly, Vol. 16, No. 2 (Jun., 1992), pp. 227-247Published by: Management Information Systems Research Center, University of MinnesotaStable URL: http://www.jstor.org/stable/249577Accessed: 09/04/2010 04:31
Your use of the JSTOR archive indicates your acceptance of JSTOR's Terms and Conditions of Use, available athttp://www.jstor.org/page/info/about/policies/terms.jsp. JSTOR's Terms and Conditions of Use provides, in part, that unlessyou have obtained prior permission, you may not download an entire issue of a journal or multiple copies of articles, and youmay use content in the JSTOR archive only for your personal, non-commercial use.
Please contact the publisher regarding any further use of this work. Publisher contact information may be obtained athttp://www.jstor.org/action/showPublisher?publisherCode=misrc.
Each copy of any part of a JSTOR transmission must contain the same copyright notice that appears on the screen or printedpage of such transmission.
JSTOR is a not-for-profit service that helps scholars, researchers, and students discover, use, and build upon a wide range ofcontent in a trusted digital archive. We use information technology and tools to increase productivity and facilitate new formsof scholarship. For more information about JSTOR, please contact [email protected].
Management Information Systems Research Center, University of Minnesota is collaborating with JSTOR todigitize, preserve and extend access to MIS Quarterly.
http://www.jstor.org
Increasing Systems Usage
Perceived Usefulness, Ease of Use, and Usage of Information Technology: A Replication
By: Dennis A. Adams College of Business University of Houston Houston, Texas 77204-6282
U.S.A.
R. Ryan Nelson Mclntire School of Commerce University of Virginia Monroe Hall Charlottesville, Virginia 22903
U.S.A.
Peter A. Todd School of Business Queen's University Kingston, Ontario K7L 4N6
Canada
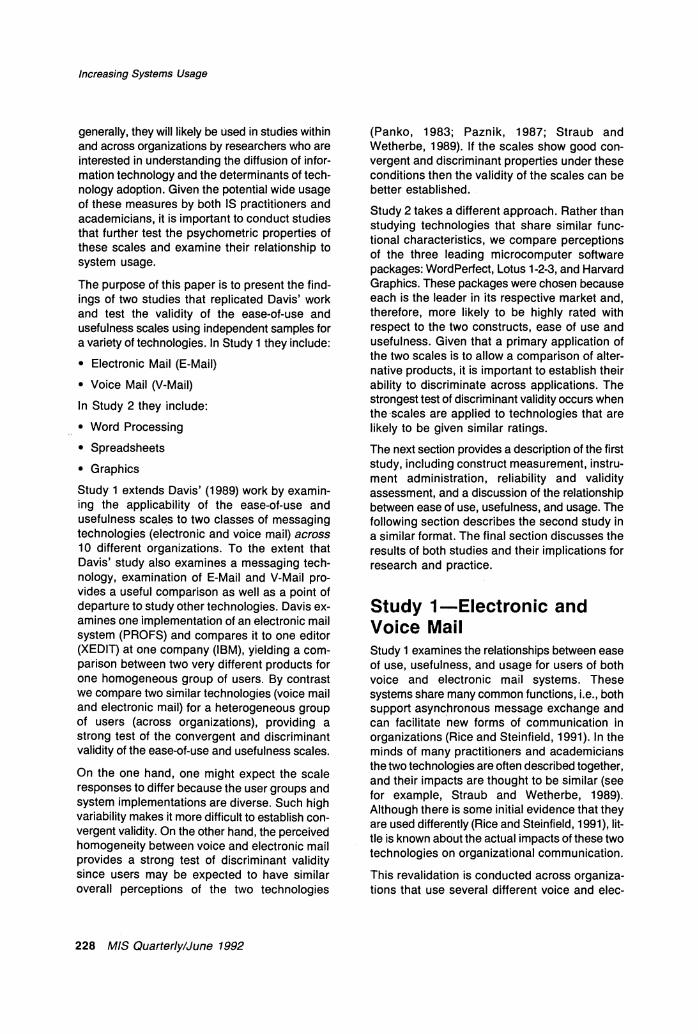
Abstract This paper presents the findings of two studies that replicate previous work by Fred Davis on the subject of perceived usefulness, ease of use, and usage of information technology. The two studies focus on evaluating the psychometric properties of the ease of use and usefulness scales, while examining the relationship between ease of use, usefulness, and system usage. Study 1 provides a strong assessment of the convergent validity of the two scales by examining heterogeneous user groups dealing with heterogeneous im- plementations of messaging technology. In ad- dition, because one might expect users to share similar perspectives about voice and electronic mail, the study also represents a strong test of discriminant validity. In this study a total of 118 respondents from 10 different organizations were surveyed for their attitudes toward two messag- ing technologies: voice and electronic mail.
Study 2 complements the approach taken in Study 1 by focusing on the ability to demonstrate discriminant validity. Three popular software ap- plications (WordPerfect, Lotus 1-2-3, and Harvard Graphics) were examined based on the expec- tation that they would all be rated highly on both scales. In this study a total of 73 users rated the three packages in terms of ease of use and usefulness.
The results of the studies demonstrate reliable and valid scales for measurement of perceived ease of use and usefulness. In addition, the paper tests the relationships between ease of use, usefulness, and usage using structural equation modelling. The results of this model are consis- tent with previous research for Study 1, sug- gesting that usefulness is an important determinant of system use. For Study 2 the results are somewhat mixed, but indicate the im- portance of both ease of use and usefulness. Dif- ferences in conditions of usage are explored to explain these findings.
Keywords: User acceptance, end-user com- puting, user measurement
ACM Categories: K.6.3, K.6.2, K.6.1, H.1.2
Introduction Recently, Fred Davis (1989) published the results of a study that developed and validated new scales for two constructs, perceived usefulness and perceived ease of use, which are hypothe- sized to be fundamental determinants of user ac- ceptance of information technology. There is a wide variety of ways in which these measures can be applied. In application settings they may be used by systems designers to obtain user feed- back on different system features or design ap- proaches, or they may be used after implemen- tation of a system to diagnose problems in user acceptance. Similarly, these scales may be used in organizations to make selections between con- tending software packages. In addition, by ex- amining ratings of different user groups for the same software, the scales might be used to deter- mine problem areas in acceptance or deficien- cies in training. These measures may also be used by research- ers interested in understanding factors that in- fluence the success of information systems. More
MIS Quarterly/June 1992 227
Increasing Systems Usage
generally, they will likely be used in studies within and across organizations by researchers who are interested in understanding the diffusion of infor- mation technology and the determinants of tech- nology adoption. Given the potential wide usage of these measures by both IS practitioners and academicians, it is important to conduct studies that further test the psychometric properties of these scales and examine their relationship to system usage.
The purpose of this paper is to present the find- ings of two studies that replicated Davis' work and test the validity of the ease-of-use and usefulness scales using independent samples for a variety of technologies. In Study 1 they include:
* Electronic Mail (E-Mail) * Voice Mail (V-Mail) In Study 2 they include:
* Word Processing * Spreadsheets * Graphics
Study 1 extends Davis' (1989) work by examin- ing the applicability of the ease-of-use and usefulness scales to two classes of messaging technologies (electronic and voice mail) across 10 different organizations. To the extent that Davis' study also examines a messaging tech- nology, examination of E-Mail and V-Mail pro- vides a useful comparison as well as a point of departure to study other technologies. Davis ex- amines one implementation of an electronic mail system (PROFS) and compares it to one editor (XEDIT) at one company (IBM), yielding a com- parison between two very different products for one homogeneous group of users. By contrast we compare two similar technologies (voice mail and electronic mail) for a heterogeneous group of users (across organizations), providing a strong test of the convergent and discriminant validity of the ease-of-use and usefulness scales.
On the one hand, one might expect the scale responses to differ because the user groups and system implementations are diverse. Such high variability makes it more difficult to establish con- vergent validity. On the other hand, the perceived homogeneity between voice and electronic mail provides a strong test of discriminant validity since users may be expected to have similar overall perceptions of the two technologies
(Panko, 1983; Paznik, 1987; Straub and Wetherbe, 1989). If the scales show good con- vergent and discriminant properties under these conditions then the validity of the scales can be better established.
Study 2 takes a different approach. Rather than studying technologies that share similar func- tional characteristics, we compare perceptions of the three leading microcomputer software packages: WordPerfect, Lotus 1-2-3, and Harvard Graphics. These packages were chosen because each is the leader in its respective market and, therefore, more likely to be highly rated with respect to the two constructs, ease of use and usefulness. Given that a primary application of the two scales is to allow a comparison of alter- native products, it is important to establish their ability to discriminate across applications. The strongest test of discriminant validity occurs when the scales are applied to technologies that are likely to be given similar ratings. The next section provides a description of the first study, including construct measurement, instru- ment administration, reliability and validity assessment, and a discussion of the relationship between ease of use, usefulness, and usage. The following section describes the second study in a similar format. The final section discusses the results of both studies and their implications for research and practice.
Study 1-Electronic and Voice Mail Study 1 examines the relationships between ease of use, usefulness, and usage for users of both voice and electronic mail systems. These systems share many common functions, i.e., both support asynchronous message exchange and can facilitate new forms of communication in organizations (Rice and Steinfield, 1991). In the minds of many practitioners and academicians the two technologies are often described together, and their impacts are thought to be similar (see for example, Straub and Wetherbe, 1989). Although there is some initial evidence that they are used differently (Rice and Steinfield, 1991), lit- tle is known about the actual impacts of these two technologies on organizational communication.
This revalidation is conducted across organiza- tions that use several different voice and elec-
228 MIS Quarterly/June 1992
Increasing Systems Usage
tronic mail products. For any given implemen- tation, there may be specific advantages or disad- vantages that do not relate to underlying characteristics of the technology but rather to implementation-specific characteristics such as training, support, user involvement, user expec- tations, or design characteristics. Ideally, we would like to separate these factors from the ef- fects of the underlying characteristics of technology. As a result, it is important that measures be applicable in cross-sectional set- tings where implementation- specific factors can cloud any assessment of a technology's underly- ing value. Such overall assessments of the value of technology, and the determinants of that value, are most likely to be of interest to researchers examining the effect of classes of information technology on multiple organizations. These cross-sectional comparisons facilitate the generalization of findings beyond that of a single system within a single organization. Such studies might be conducted to assess the value of other technologies such as executive information systems and decision support systems, or more generally to technologies such as microcom- puters. Having reliable and valid measures of the possible determinants of acceptance and use of these technologies is critical to support this form of research.
Trying to assess the validity of measurement scales for ease of use and usefulness raises a key area of concern-the ability of the scales to discriminate between alternative systems or system features in support of evaluation. To test the effectiveness of scales to discriminate, it makes sense to examine alternative technologies that share many common attributes. If the scales are sensitive enough to discriminate between highly similar technologies, it is likely that they will also work well for the evaluation of more disparate technologies.
Measuring usefulness, ease of use, and usage The measurement scales used in this study were adapted from Davis (1989). Other than changes in wording to fit the specific technologies studied in this article, no changes were made to the usefulness scale. However, two items were deleted from the ease-of-use scale. The first was item four in the Davis scale, "I would find
to be flexible to interact with." Item
four was eliminated for several reasons. First, Davis points out that the item does not correlate well with some other measures of ease of use. Also, it can be argued that flexibility actually reduces ease of use to the extent that it provides users with a greater number of decisions to make during interaction with the system (Goodwin, 1987; Silver, 1988). Furthermore, a test of Davis' ease-of-use scale found that flexibility actually had a negative item-to-scale correlation (Moore, 1989). Item five from Davis' scale, "It would be easy for me to become skillful using was also deleted because a study reported in Moore (1989) found this item to have a low cor- relation to the rest of the scale.
Usage was measured by asking respondents to record the number of messages they had sent and received on the previous working day, as well as the number they sent and received on a typical day. These two measures were highly correlated (r = .92). They differed from Davis' measures because they asked for self-reported measures of actual use rather than measures of degree of use on an ordinal scale.
Instrument administration Questionnaires were distributed in 10 organiza- tions that each use several different E-Mail and V-Mail packages. The questionnaire contained over 60 items pertaining to various user attitudes toward voice and electronic mail. The ease-of-use and usefulness items were randomly distributed among the 60 questions. In addition, the ques- tionnaire placed no special emphasis on the Davis scales. This further strengthens the test of the scales since the relationship between the scale items would be less obvious when embed- ded in a larger questionnaire. It was estimated, based on pilot tests, that the instruments would take 15 to 20 minutes to complete. The questionnaire was divided into two forms, asking the same questions about both voice and electronic mail. Respondents were asked to com- plete either one or both sections depending on their use of the two technologies. Thus, a respon- dent who used electronic mail only would com- plete only the electronic mail portion of the questionnaire, whereas a user of both tech- nologies would complete both portions. Of the 260 questionnaires distributed, 118 were re- turned, for an overall response rate of 45 percent. Within the respondent organizations, four dif-
MIS Quarterly/June 1992 229
Increasing Systems Usage
ferent E-Mail packages and three different V-Mail packages were used. Specifically, 48 used elec- tronic mail only and 68 used both technologies.1
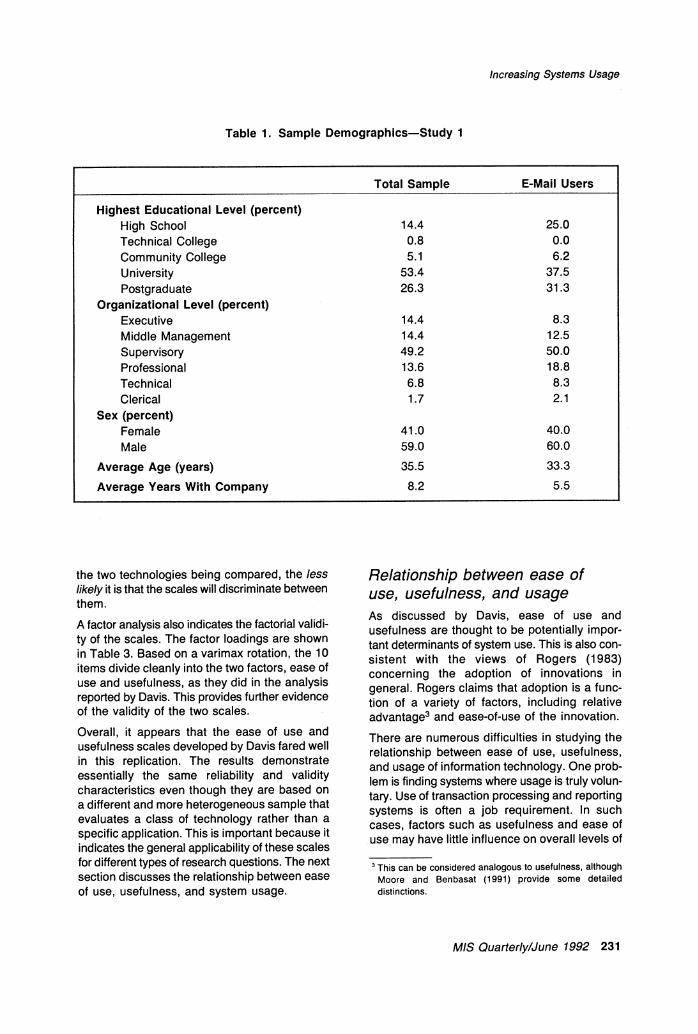
Respondents came from a variety of organiza- tional levels ranging from clerical to senior management. Seventy-eight percent of the sam- ple were either middle management, supervisory, or professional staff. The demographic profile of the sample is shown in Table 1 for the E-Mail- only users as well as E-MailN-Mail users. The two groups were approximately the same in terms of age, education, and occupational level. The E-Mail-only users had spent somewhat less time with the company than the sample as a whole. Overall, the electronic-mail-only and elec- tronic/voice-mail groups do not appear to differ in any important way. As a result, the analysis reported below is for a sample of 116 E-Mail users and 68 V-Mail users. The users sampled were quite experienced with the two technologies-they had used V- Mail for an average of 28 months and E-Mail for an average of 21 months. They averaged two hours of training on E-Mail and approximately one hour of training on V-Mail. On a seven-point scale, from "not very knowledgable" (1) to "very know- ledgable (7), the respondents rated their E-Mail knowledge as 5.5 and their V-Mail knowledge as 4.5. They sent approximately five E-mail and three V-mail messages a day and received ap- proximately seven E-mail messages and four V- mail messages per day.
Assessment of reliability and validity The usefulness and ease-of-use scales show high levels of reliability-Cronbach's alpha is 0.94 and 0.88 respectively for electronic mail and 0.93 and 0.81 respectively for voice mail. These are com- parable to the values reported by Davis (0.97, 0.86). The value for Guttman's lower bound (Gutt- man, 1945), a lower estimate of true reliability, is 0.94 for usefulness and 0.93 for ease of use in the electronic mail sample and 0.93 for usefulness and 0.81 for ease of use in the voice mail sample.
Validity was assessed using the same method as Davis (1989). First, the correlations between the
Only one respondent employed voice mail only. Another had previously used both electronic and voice mail but no longer used either. These two respondents are not included in the analysis reported here.
ease of use and usefulness items across the two technologies were examined. This is equivalent to Davis' "Multitrait, Multimethod" (MTMM) evaluations as described by Campbell and Fiske (1959).2
The trait/technology correlation matrix is shown in Table 2. Overall the scales show good con- vergent and discriminant properties. Items representing subcomponents of the same scale are all significantly (p < 0.001) and highly cor- related across both voice and electronic mail. The inter-item correlations range from 0.62 to 0.81 for electronic mail and from 0.52 to 0.80 for voice mail. This analysis confirms the reliability analysis presented above by showing strong correlations for items belonging to the same scale.
Discriminant validity assesses the degree to which the scales are differentiable from each other and the degree to which the scales can distinguish between different technologies. The closer together the technologies, the stronger the test of discrimination. To test for discriminant validity, we followed the procedure outlined by Davis and produced a count of items that had higher correlations with some non-trait, non- technology items than those within trait and technology. Such a procedure is recommended by Campbell and Fiske (1959) as one step in testing validity. For the six-item usefulness scale, 840 such comparisons were made across the two technologies. In only 19 cases (2.26 percent) did a non-trait item correlate more highly with another construct than with other elements of the construct. For ease of use, there were 36 such violations out of 384 possible comparisons (9.4 percent). While there are no specific rules for ac- ceptable levels of violation, Davis points out that his 3 percent level would be considered "excep- tionally low." Overall, this analysis indicates that scale items tend to discriminate across traits and technologies. This finding might be particularly strong if one accepts the argument that voice and electronic mail, which share many common func- tions, are in fact quite similar. The more similar
2 While the evaluation presented by Davis is useful to show the convergent and discriminate properties of his scales over different technologies, it is important to note that this is not a true MTMM analysis in which multiple traits (in this case usefulness and ease of use) are measured using different measurement techniques, or methods. In this case two traits (usefulness and ease of use) are measured using one method (Likert scale-based questionnaires) over two samples (XEDIT and electronic mail, or voice and electronic mail).
230 MIS Quarterly/June 1992
Increasing Systems Usage
Table 1. Sample Demographics-Study 1
Total Sample E-Mail Users
Highest Educational Level (percent) High School 14.4 25.0 Technical College 0.8 0.0
Community College 5.1 6.2
University 53.4 37.5
Postgraduate 26.3 31.3
Organizational Level (percent) Executive 14.4 8.3 Middle Management 14.4 12.5
Supervisory 49.2 50.0 Professional 13.6 18.8 Technical 6.8 8.3 Clerical 1.7 2.1
Sex (percent) Female 41.0 40.0 Male 59.0 60.0
Average Age (years) 35.5 33.3
Average Years With Company 8.2 5.5
the two technologies being compared, the less likely it is that the scales will discriminate between them.
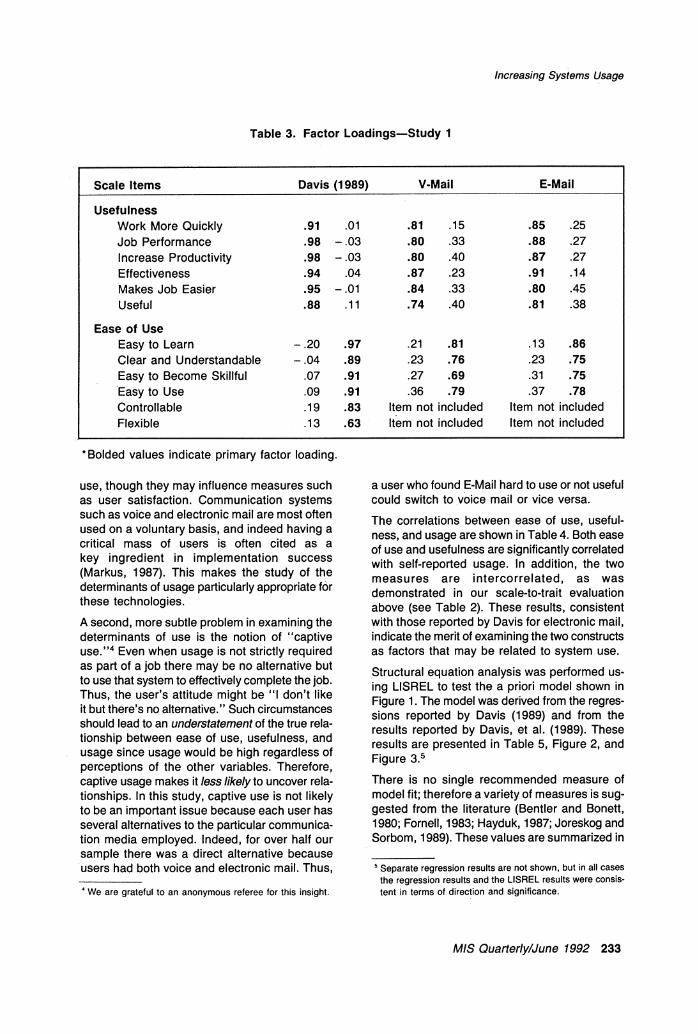
A factor analysis also indicates the factorial validi- ty of the scales. The factor loadings are shown in Table 3. Based on a varimax rotation, the 10 items divide cleanly into the two factors, ease of use and usefulness, as they did in the analysis reported by Davis. This provides further evidence of the validity of the two scales.
Overall, it appears that the ease of use and usefulness scales developed by Davis fared well in this replication. The results demonstrate essentially the same reliability and validity characteristics even though they are based on a different and more heterogeneous sample that evaluates a class of technology rather than a specific application. This is important because it indicates the general applicability of these scales for different types of research questions. The next section discusses the relationship between ease of use, usefulness, and system usage.
Relationship between ease of use, usefulness, and usage As discussed by Davis, ease of use and usefulness are thought to be potentially impor- tant determinants of system use. This is also con- sistent with the views of Rogers (1983) concerning the adoption of innovations in general. Rogers claims that adoption is a func- tion of a variety of factors, including relative advantage3 and ease-of-use of the innovation.
There are numerous difficulties in studying the relationship between ease of use, usefulness, and usage of information technology. One prob- lem is finding systems where usage is truly volun- tary. Use of transaction processing and reporting systems is often a job requirement. In such cases, factors such as usefulness and ease of use may have little influence on overall levels of
3 This can be considered analogous to usefulness, although Moore and Benbasat (1991) provide some detailed distinctions.
MIS Quarterly/June 1992 231
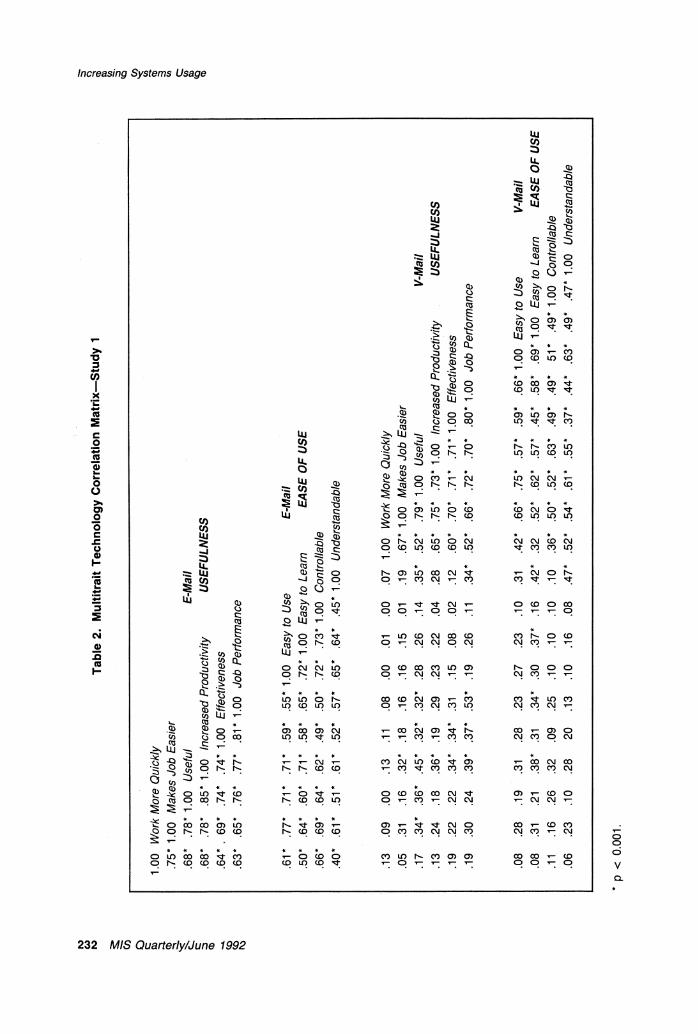
Table 2. Multitrait Technology Correlation Matrix-Study 1
1.00 Work More Quickly .75* 1.00 Makes Job Easier .68* .78*1.00 Useful E-Mail .68* .78* .85* 1.00 Increased Productivity USEFULNESS .64*. 69* .74* .74* 1.00 Effectiveness .63* .65* .76* .77* .81* 1.00 Job Performance
.61* .77* .71 .71 .59* .55* 1.00 Easy to Use E-Mail
.50* .64* .60* .71* .58* .65* .72* 1.00 Easy to Learn EASE OF USE
.66* .69* .64* .62* .49* .50* .72* .73* 1.00 Controllable
.40* .61* .51* .61* .52* 57* .5* 65* 64* .45*1.00 Understandable
.13 .09 .00 .13 .11 .08 .00 .01 .00 .07 1.00 Work More Quickly
.05 .31 .16 .32* .18 .16 .16 .15 .01 .19 .67* 1.00 Makes Job Easier
.17 .34* .36* .45* .32* .32* .28 .26 .14 .35* .52* .79*1.00 Useful V-Mail
.13 .24 .18 .36* 19 .29 .23 .22 .04 .28 .65* .75* .73* 1.00 Increased Productivity USEFULNESS
.19 .22 .22 .34* 34* .31 .15 .08 .02 .12 .60* .7 .7 * . 71* 1.00 Effectiveness
.19 .30 .24 .39* .37* .53* .19 .26 11 .34* .52* .66* .72* .70* .80* 1.00 Job Performance
.08 .28 .19 .31 .28 .23 .27 .23 .10 .31 .42* .66* .75* .57* .59* .66* 1.00 Easy to Use V-Mail
.08 .31 .21 .38* .31 .34* .30 .37* .16 .42* .32 .52* .62* .57* .45* .58* .69* 1.00 Easy to Learn EASE OF USE
.11 .16 .26 .32 09 .25 .10 .10 .10 .10 .36* .50* .52* .63* .49* .49* 51* .49* 1.00 Controllable
.06 .23 .10 .28 20 .13 .10 .16 .08 .47* .52* .54* .61* .55* .37* 44* .63* ,49* .47* 1.00 Understandable
* p < 0.001.
CA)
0 QO
C)
(0
CD I,
q3r
c0
2r
Cr,
3
)i% Cl
C,)
CD
?
Increasing Systems Usage
Table 3. Factor Loadings-Study 1
Scale Items Davis (1989) V-Mail E-Mail
Usefulness Work More Quickly .91 .01 .81 .15 .85 .25 Job Performance .98 -.03 .80 .33 .88 .27 Increase Productivity .98 -.03 .80 .40 .87 .27 Effectiveness .94 .04 .87 .23 .91 .14 Makes Job Easier .95 -.01 .84 .33 .80 .45 Useful .88 .11 .74 .40 .81 .38
Ease of Use Easy to Learn -.20 .97 .21 .81 .13 .86 Clear and Understandable -.04 .89 .23 .76 .23 .75 Easy to Become Skillful .07 .91 .27 .69 .31 .75 Easy to Use .09 .91 .36 .79 .37 .78 Controllable .19 .83 Item not included Item not included Flexible .13 .63 Item not included Item not included
*Bolded values indicate primary factor loading.
use, though they may influence measures such as user satisfaction. Communication systems such as voice and electronic mail are most often used on a voluntary basis, and indeed having a critical mass of users is often cited as a key ingredient in implementation success (Markus, 1987). This makes the study of the determinants of usage particularly appropriate for these technologies. A second, more subtle problem in examining the determinants of use is the notion of "captive use."4 Even when usage is not strictly required as part of a job there may be no alternative but to use that system to effectively complete the job. Thus, the user's attitude might be "I don't like it but there's no alternative." Such circumstances should lead to an understatement of the true rela- tionship between ease of use, usefulness, and usage since usage would be high regardless of perceptions of the other variables. Therefore, captive usage makes it less likely to uncover rela- tionships. In this study, captive use is not likely to be an important issue because each user has several alternatives to the particular communica- tion media employed. Indeed, for over half our sample there was a direct alternative because users had both voice and electronic mail. Thus,
4We are grateful to an anonymous referee for this insight.
a user who found E-Mail hard to use or not useful could switch to voice mail or vice versa.
The correlations between ease of use, useful- ness, and usage are shown in Table 4. Both ease of use and usefulness are significantly correlated with self-reported usage. In addition, the two measures are intercorrelated, as was demonstrated in our scale-to-trait evaluation above (see Table 2). These results, consistent with those reported by Davis for electronic mail, indicate the merit of examining the two constructs as factors that may be related to system use.
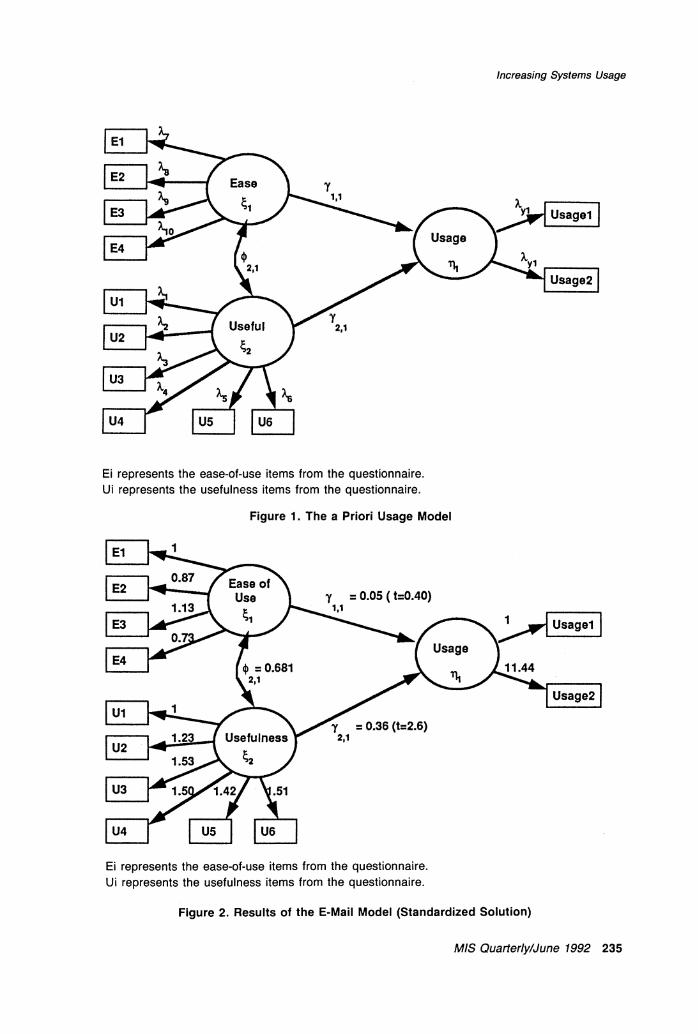
Structural equation analysis was performed us- ing LISREL to test the a priori model shown in Figure 1. The model was derived from the regres- sions reported by Davis (1989) and from the results reported by Davis, et al. (1989). These results are presented in Table 5, Figure 2, and Figure 3.5
There is no single recommended measure of model fit; therefore a variety of measures is sug- gested from the literature (Bentler and Bonett, 1980; Fornell, 1983; Hayduk, 1987; Joreskog and Sorbom, 1989). These values are summarized in
Separate regression results are not shown, but in all cases the regression results and the LISREL results were consis- tent in terms of direction and significance.
MIS Quarterly/June 1992 233
Increasing Systems Usage
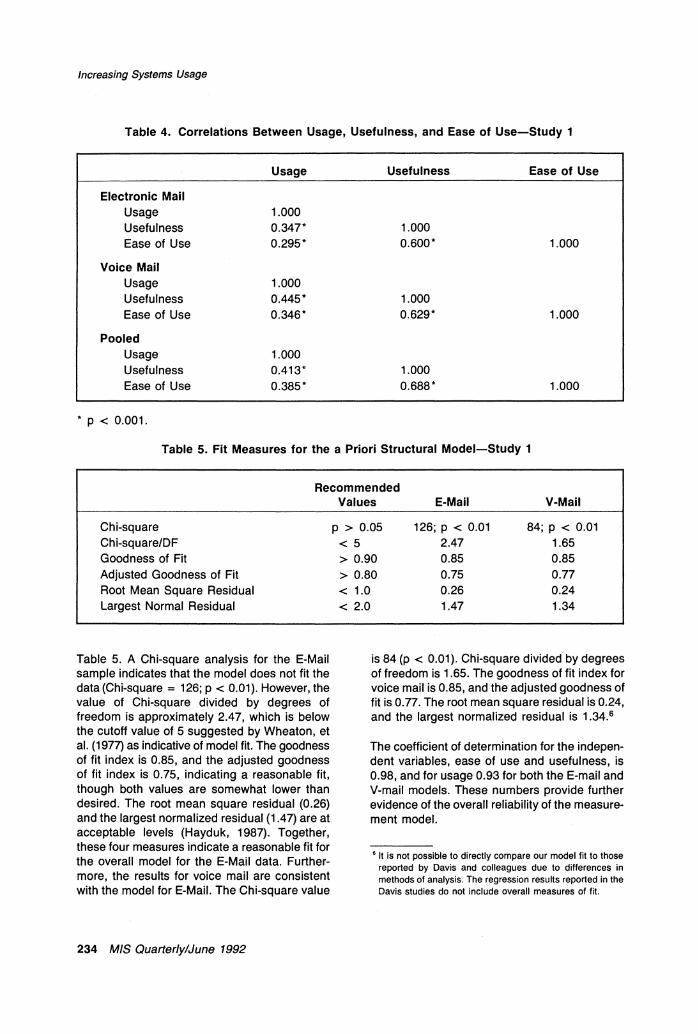
Table 4. Correlations Between Usage, Usefulness, and Ease of Use-Study 1
Usage Usefulness Ease of Use
Electronic Mail Usage 1.000 Usefulness 0.347* 1.000 Ease of Use 0.295* 0.600* 1.000
Voice Mail Usage 1.000 Usefulness 0.445* 1.000 Ease of Use 0.346* 0.629* 1.000
Pooled Usage 1.000 Usefulness 0.413* 1.000 Ease of Use 0.385* 0.688* 1.000
* p < 0.001.
Table 5. Fit Measures for the a Priori Structural Model-Study 1
Recommended Values E-Mail V-Mail
Chi-square p > 0.05 126; p < 0.01 84; p < 0.01 Chi-square/DF < 5 2.47 1.65 Goodness of Fit > 0.90 0.85 0.85 Adjusted Goodness of Fit > 0.80 0.75 0.77 Root Mean Square Residual < 1.0 0.26 0.24 Largest Normal Residual < 2.0 1.47 1.34
Table 5. A Chi-square analysis for the E-Mail sample indicates that the model does not fit the data (Chi-square = 126; p < 0.01). However, the value of Chi-square divided by degrees of freedom is approximately 2.47, which is below the cutoff value of 5 suggested by Wheaton, et al. (1977) as indicative of model fit. The goodness of fit index is 0.85, and the adjusted goodness of fit index is 0.75, indicating a reasonable fit, though both values are somewhat lower than desired. The root mean square residual (0.26) and the largest normalized residual (1.47) are at acceptable levels (Hayduk, 1987). Together, these four measures indicate a reasonable fit for the overall model for the E-Mail data. Further- more, the results for voice mail are consistent with the model for E-Mail. The Chi-square value
is 84 (p < 0.01). Chi-square divided by degrees of freedom is 1.65. The goodness of fit index for voice mail is 0.85, and the adjusted goodness of fit is 0.77. The root mean square residual is 0.24, and the largest normalized residual is 1.34.6
The coefficient of determination for the indepen- dent variables, ease of use and usefulness, is 0.98, and for usage 0.93 for both the E-mail and V-mail models. These numbers provide further evidence of the overall reliability of the measure- ment model.
6 It is not possible to directly compare our model fit to those reported by Davis and colleagues due to differences in methods of analysis. The regression results reported in the Davis studies do not include overall measures of fit.
234 MIS Quarterly/June 1992
Increasing Systems Usage
7 1I.
Ei represents the ease-of-use items from the questionnaire. Ui represents the usefulness items from the questionnaire.
Figure 1. The a Priori Usage Model
1
0.36 (t-2.6)
Ei represents the ease-of-use items from the questionnaire. Ui represents the usefulness items from the questionnaire.
Figure 2. Results of the E-Mail Model (Standardized Solution)
MIS Quarterly/June 1992 235
Increasing Systems Usage
1
y =0.13 (t= 0.75 ) 1,1
2,1
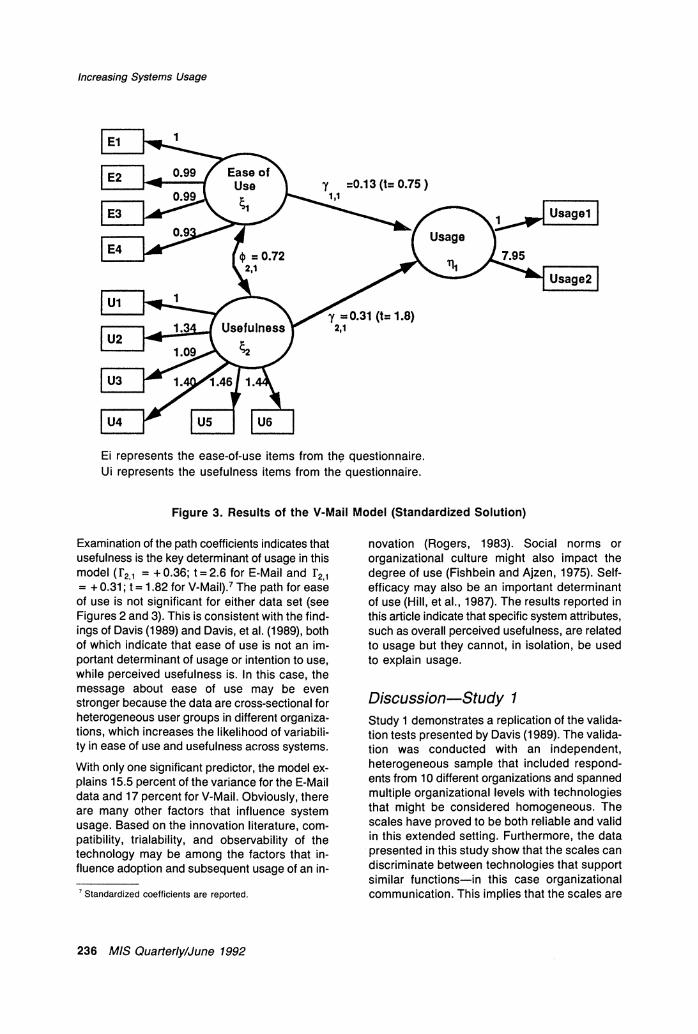
Ei represents the ease-of-use items from the questionnaire. Ui represents the usefulness items from the questionnaire.
Figure 3. Results of the V-Mail Model (Standardized Solution)
Examination of the path coefficients indicates that usefulness is the key determinant of usage in this model (r2,1 = +0.36; t =2.6 for E-Mail and r2,1 = + 0.31; t = 1.82 for V-Mail).7 The path for ease of use is not significant for either data set (see Figures 2 and 3). This is consistent with the find- ings of Davis (1989) and Davis, et al. (1989), both of which indicate that ease of use is not an im- portant determinant of usage or intention to use, while perceived usefulness is. In this case, the message about ease of use may be even stronger because the data are cross-sectional for heterogeneous user groups in different organiza- tions, which increases the likelihood of variabili- ty in ease of use and usefulness across systems. With only one significant predictor, the model ex- plains 15.5 percent of the variance for the E-Mail data and 17 percent for V-Mail. Obviously, there are many other factors that influence system usage. Based on the innovation literature, com- patibility, trialability, and observability of the technology may be among the factors that in- fluence adoption and subsequent usage of an in-
7 Standardized coefficients are reported.
novation (Rogers, 1983). Social norms or organizational culture might also impact the degree of use (Fishbein and Ajzen, 1975). Self- efficacy may also be an important determinant of use (Hill, et al., 1987). The results reported in this article indicate that specific system attributes, such as overall perceived usefulness, are related to usage but they cannot, in isolation, be used to explain usage.
Discussion-Study 1 Study 1 demonstrates a replication of the valida- tion tests presented by Davis (1989). The valida- tion was conducted with an independent, heterogeneous sample that included respond- ents from 10 different organizations and spanned multiple organizational levels with technologies that might be considered homogeneous. The scales have proved to be both reliable and valid in this extended setting. Furthermore, the data presented in this study show that the scales can discriminate between technologies that support similar functions-in this case organizational communication. This implies that the scales are
236 MIS Quarterly/June 1992
y- =0.31 (t= 1.8)
Increasing Systems Usage
sensitive enough to pick up relatively subtle dif- ferences between types of information tech- nology. These results are important to IS researchers who are attempting to assess the overall value or impact of different forms of technology, and they considerably widen the scope of application for these scales as a research tool.
The relationship of ease of use and usefulness to usage is consistent with relationships observed in previous studies. This indicates that usefulness is indeed related to usage but that ease of use is relatively less important overall in determining use. The implication of this finding might be that a heavy emphasis on ease of use, particularly at the cost of functionality, is not advisable, as was also suggested by Davis, et al. (1989). However, this claim should be qualified. While ease of use might not be important to the level of use of a system, it may influence the initial decision to adopt a system. In fact, it has been noted that ease of use is a significant determinant of inten- tion to use a computer technology (Davis, et al., 1989; Moore and Benbasat, 1991).
Study 2-WordPerfect, Lotus 1-2-3, and Harvard Graphics In this study the psychometric properties of the ease-of-use and usefulness scales are assessed by examining user ratings of WordPerfect, Lotus 1-2-3, and Harvard Graphics. The rationale for using these packages as the basis for com- parison was that each was the best-selling package of its type during the time this study was undertaken. Based upon their popularity it would be reasonable to assume that these packages would be rated relatively high in terms of both ease of use and usefulness. Comparison of packages that are expected to be similarly rated provides a strong test of discriminant validity (Bagozzi and Warshaw, 1990). Since one of the important applications of these measures is to compare different software packages, it is impor- tant to establish the ability of the scales to discriminate.
Measuring usefulness, ease of use, and usage The scales used in Study 2 were the same as those used in Study 1 except that the ease-of-
use item, "It was easy to become skillful using ," was added to the questionnaire. A
second ease-of-use question relating to recall- "It is easy to remember how to perform tasks using "-was also added. This was done because we felt that the deletion of items in Study 1 was based on other validation work that, in fact, should have been given no more, or less, weight than the initial information provid- ed by Davis (1989). The two additional items make the ease-of-use scale directly equivalent to that used by Davis.
Usage was self-reported and was measured in two ways. First, respondents were asked to rate their usage on a six-point scale ranging from not at all through daily. Second, respondents were asked how many hours they used each package in the last week. Correlations between these two measures were 0.52 for WordPerfect, 0.57 for Lotus 1-2-3, and 0.47 for Harvard Graphics. All three correlations were statistically significant at p = 0.001; however, it should be noted that these values are lower than those in Study 1.
Instrument administration The questionnaire was administered in a business school computer lab to undergraduate and MBA students. The lab is not used as an in- structional facility; that is, students who are learn- ing new software packages do not typically use the lab. Rather, it is intended to support the preparation of assignments, presentations, and papers for various courses. Thus, the users of this facility are typical of end users who are us- ing computer tools to support their day-to-day work.
Questionnaires were distributed over a one-week period, approximately three-quarters of the way through the winter term, which runs from early January to the middle of April. Respondents were asked to complete the scales for each of three packages (WordPerfect, Lotus 1-2-3, and Harvard Graphics). For each package that was evaluated by the students there was an alternative (equivalent) package available. Microsoft Word (and Word for Windows) was available as a word processing alternative. Excel was available as a spreadsheet alternative. A number of drawing packages, including Freelance, CorelDraw, and DrawPerfect, were also provided. In addition, there were a small number of Macintosh worksta-
MIS Quarterly/June 1992 237
Increasing Systems Usage
tions in the lab, each equipped with equivalent packages to support word processing, spread- sheet analysis, and presentation graphics. Thus, students always had a variety of packages to choose from, regardless of application need. It should be noted that in no case were students required to use a specific package for a course. When the students were advised to use a spread- sheet or word processing package, usage of a specific package was not required. Furthermore, in no case was the use of Harvard Graphics or any presentation graphics package mandated by a course. Rather, students used such systems in an attempt to improve the quality of their presentations and course submissions. Although there may have been competitive pressure to use computer tools to keep up with classmates in terms of production quality, such pressure would be very similar to what might be encountered in a workplace where similar personal productivity tools are employed. Other research has indicated that subjective norms may lead to pressure to use the technology available (Moore and Benbasat, 1991).
Seventy-three completed questionnaires were returned to a lab attendant. Of the 73 respondents 64 were experienced with Word- Perfect, 67 were experienced in using Lotus 1-2-3, and 54 were experienced with Harvard Graphics. Forty-eight respondents used all three packages. On average, the respondents had been using WordPerfect for 28 months, Lotus 1-2-3 for 33 months, and Harvard Graphics for 13 months.
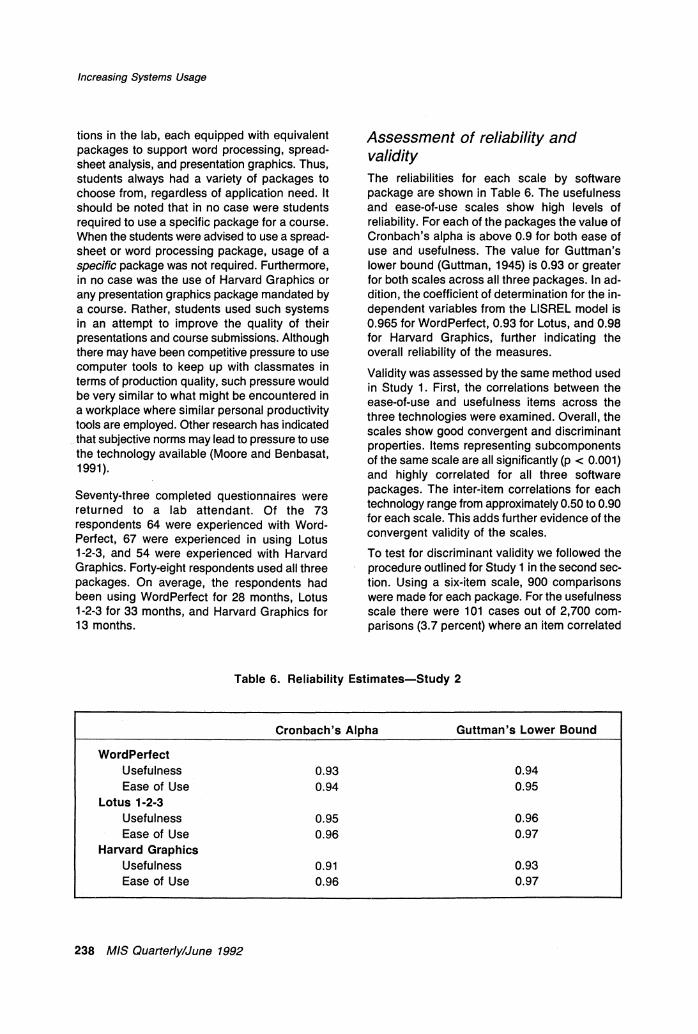
Assessment of reliability and validity The reliabilities for each scale by software package are shown in Table 6. The usefulness and ease-of-use scales show high levels of reliability. For each of the packages the value of Cronbach's alpha is above 0.9 for both ease of use and usefulness. The value for Guttman's lower bound (Guttman, 1945) is 0.93 or greater for both scales across all three packages. In ad- dition, the coefficient of determination for the in- dependent variables from the LISREL model is 0.965 for WordPerfect, 0.93 for Lotus, and 0.98 for Harvard Graphics, further indicating the overall reliability of the measures.
Validity was assessed by the same method used in Study 1. First, the correlations between the ease-of-use and usefulness items across the three technologies were examined. Overall, the scales show good convergent and discriminant properties. Items representing subcomponents of the same scale are all significantly (p < 0.001) and highly correlated for all three software packages. The inter-item correlations for each technology range from approximately 0.50 to 0.90 for each scale. This adds further evidence of the convergent validity of the scales.
To test for discriminant validity we followed the procedure outlined for Study 1 in the second sec- tion. Using a six-item scale, 900 comparisons were made for each package. For the usefulness scale there were 101 cases out of 2,700 com- parisons (3.7 percent) where an item correlated
Table 6. Reliability Estimates-Study 2
Cronbach's Alpha Guttman's Lower Bound
WordPerfect Usefulness 0.93 0.94 Ease of Use 0.94 0.95
Lotus 1-2-3 Usefulness 0.95 0.96 Ease of Use 0.96 0.97
Harvard Graphics Usefulness 0.91 0.93 Ease of Use 0.96 0.97
238 MIS Quarterly/June 1992
Increasing Systems Usage
more highly with another construct or technology than it did with other elements within the construct-technology submatrix. For ease of use, there were 16 such violations out of 2,700 possi- ble comparisons (0.5 percent). Overall, this analysis indicates that scale items discriminate well across both traits and technologies.
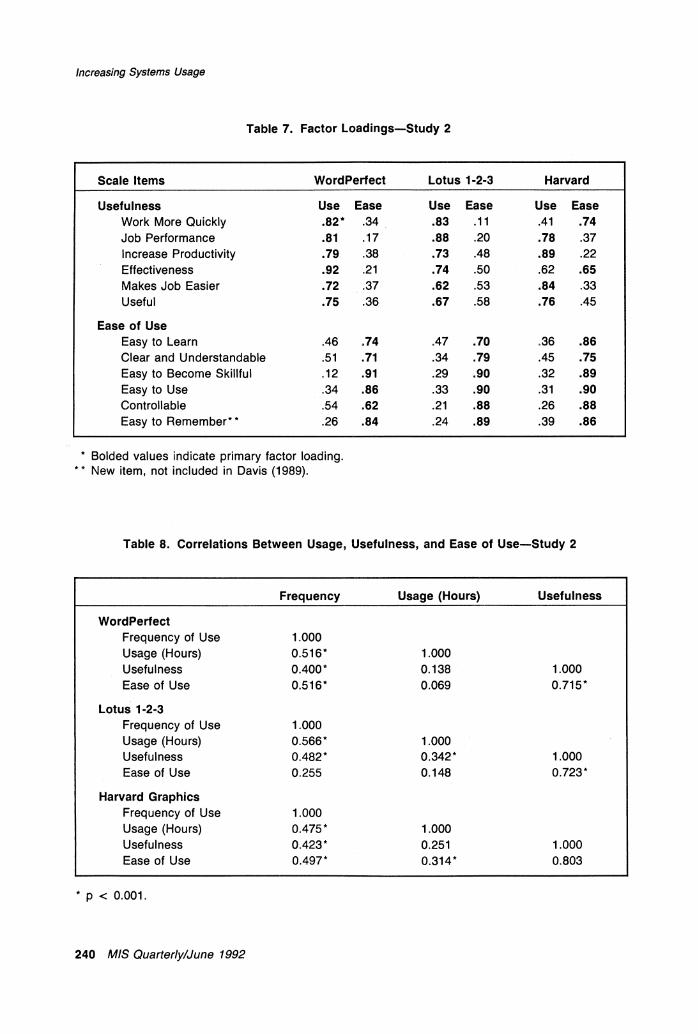
Results of a factor analysis are shown in Table 7. Based on a varimax rotation, the 10 items divide into two factors-ease of use and usefulness-for each of the three technologies. The only difficulties with the factor analyses are the results for Harvard Graphics, which show the two usefulness items, "Using Harvard Graphics makes it easier to do my work" and "... allows me to accomplish work more quickly," load with the ease-of-use scale as well as with usefulness.8 In general, these results provide further evidence of the validity of the two scales.
As was the case in Study 1, it appears that the ease-of-use and usefulness scales developed by Davis fared well in our replication. Our results demonstrate essentially the same reliability and validity characteristics. Study 2 examined three of the most popular personal computer software applications. It would seem reasonable to assert that their popularity attests to their perceived ease of use and usefulness. The fact that the scales allowed us to discriminate between the three packages clearly indicates their power as a tool in software evaluation.
Relationship between ease of use, usefulness, and usage The correlations between ease of use, useful- ness, and usage are shown in Table 8. Both ease of use and usefulness are significantly correlated with self-reported frequency of usage (p < .001). In addition, the two measures are intercorrelated.
As was the case for Study 1, structural equation analysis was performed using LISREL to test the a priori model shown in Figure 1. In general, the fit characteristics of the model are poorer for all three technologies than was the case in Study 8 It is unclear why these two questions load on both factors.
It could be that the more limited experience of the respondents with Harvard Graphics makes it more difficult for them to distinguish between ease of use and usefulness. In addition, both of these items have some aspect of "ease" in them ("easier to do work" and "work more quickly") and thus may cause confusion to some extent.
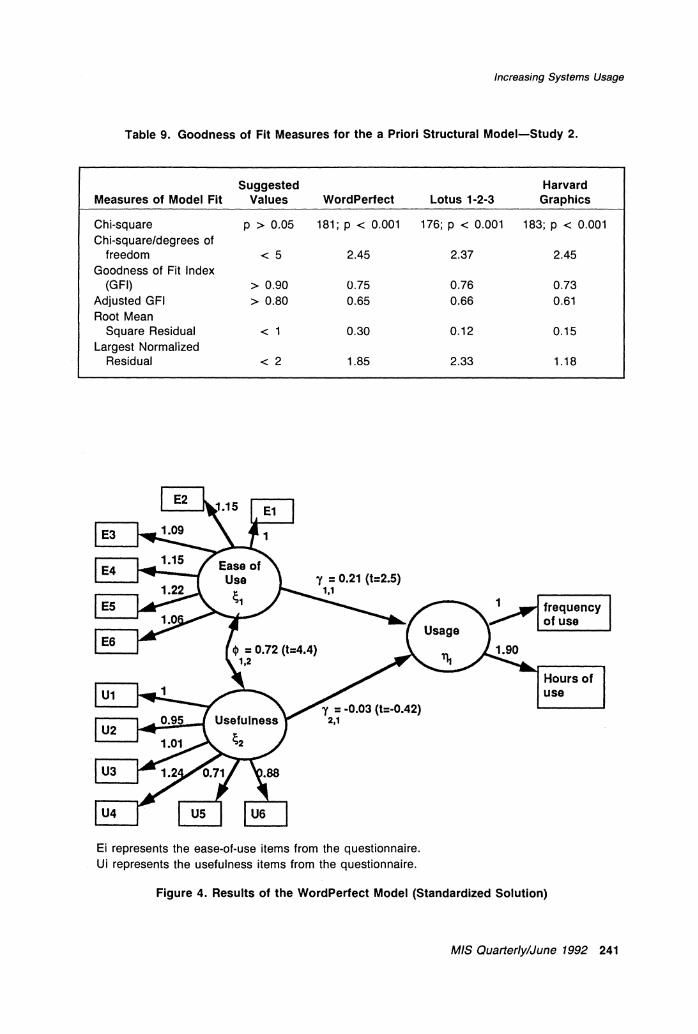
1. The various goodness of fit measures are shown in Table 9. In each case the Chi-square analysis is significant, indicating a lack of fit. However, the value of Chi-square divided by degrees of freedom is approximately 2.5 in each case, which is below the cutoff value of 5 sug- gested by Wheaton, et al. (1977) and indicates a good fit. The goodness of fit index in each case is approximately 0.75 and adjusted goodness of fit ranges from 0.66 for Lotus 1-2-3 to 0.61 for Har- vard Graphics. These values are lower than desired though comparable to others reported in the IS literature (cf. Straub, 1990). In all three cases the root mean square residual and the largest normalized residual fall within acceptable limits as suggested by Hayduk (1987). On balance, the evidence of model fit should be con- sidered equivocal at best.9
Results for the path coefficients are shown in Figures 4, 5, and 6. The results are not entirely consistent across packages, nor are they consis- tent with previous findings; thus each is ad- dressed in turn.
For WordPerfect, the path from ease of use to usage is significant (r,'1 = 0.21, t = 2.46).10 The usefulness-usage path was not significant (2, 1 = -0.03; t =-0.42). These results are not consis- tent with Study 1, which indicates that usefulness is more important overall; however, it is impor- tant to note that the coefficient of determination for the structural model in this case is only 0.04. In other words, ease of use and usefulness ex- plain only about 4 percent of the variance in usage. For Study 1 the model explains approx- imately 15 percent of the variability in usage, and ease of use is not a significant factor.
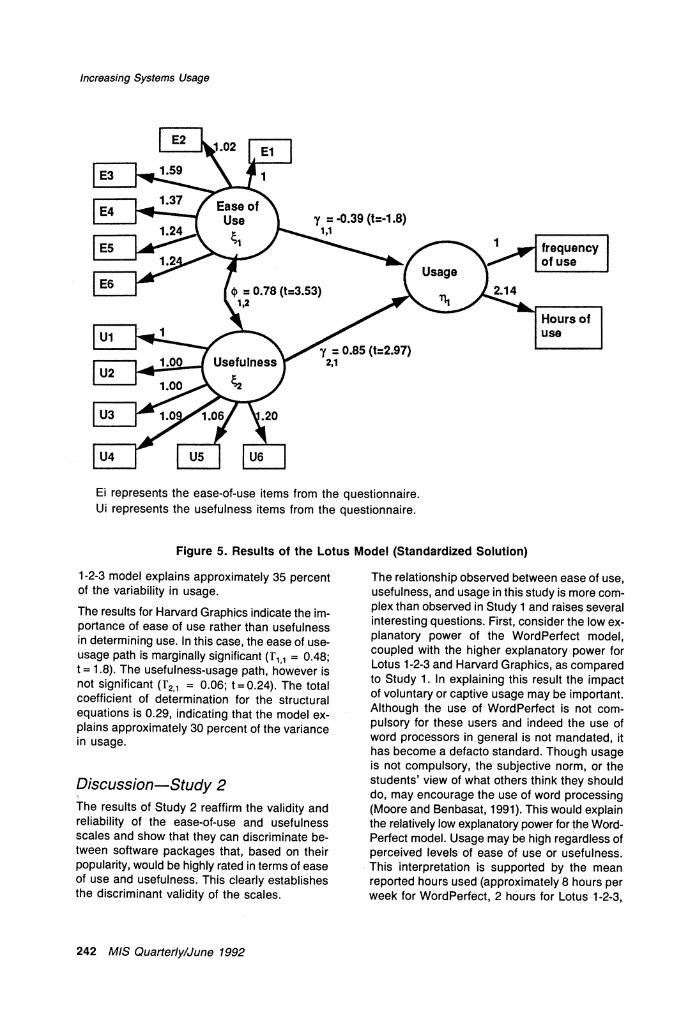
For Lotus 1-2-3 the usefulness-usage path is significant (I2,1 = 0.846; t = 2.97), and the ease of use path is marginally significant (ri, = -0.4; t=-1.8). It should be noted though that this lat- ter path indicates a negative relationship between ease of use and usage for Lotus 1-2-3. The Lotus
9 While one might attribute the absence of model fit in this case to a lack of statistical power, in a LISREL analysis the op- posite is usually true. Inadequate statistical power can result in an artificially good model fit because there is not adequate power to reject the Chi-square test (Bentler and Bonett, 1980). In our case, all Chi-squares are significant, indicating that the differences between the model and our raw data are probably not due to mere sampling fluctuation (Hayduk, 1987).
10 Standardized coefficients are reported.
MIS Quarterly/June 1992 239
Increasing Systems Usage
Table 7. Factor Loadings-Study 2
Scale Items WordPerfect Lotus 1-2-3 Harvard
Usefulness Use Ease Use Ease Use Ease Work More Quickly .82* .34 .83 .11 .41 .74 Job Performance .81 .17 .88 .20 .78 .37 Increase Productivity .79 .38 .73 .48 .89 .22 Effectiveness .92 .21 .74 .50 .62 .65 Makes Job Easier .72 .37 .62 .53 .84 .33 Useful .75 .36 .67 .58 .76 .45
Ease of Use Easy to Learn .46 .74 .47 .70 .36 .86 Clear and Understandable .51 .71 .34 .79 .45 .75 Easy to Become Skillful .12 .91 .29 .90 .32 .89 Easy to Use .34 .86 .33 .90 .31 .90 Controllable .54 .62 .21 .88 .26 .88 Easy to Remember** .26 .84 .24 .89 .39 .86
* Bolded values indicate primary factor loading. ** New item, not included in Davis (1989).
Table 8. Correlations Between Usage, Usefulness, and Ease of Use-Study 2
Frequency Usage (Hours) Usefulness
WordPerfect Frequency of Use 1.000 Usage (Hours) 0.516* 1.000 Usefulness 0.400* 0.138 1.000 Ease of Use 0.516* 0.069 0.715*
Lotus 1-2-3 Frequency of Use 1.000 Usage (Hours) 0.566* 1.000 Usefulness 0.482* 0.342* 1.000 Ease of Use 0.255 0.148 0.723*
Harvard Graphics Frequency of Use 1.000 Usage (Hours) 0.475* 1.000 Usefulness 0.423* 0.251 1.000 Ease of Use 0.497* 0.314* 0.803
* p < 0.001.
240 MIS Quarterly/June 1992
Increasing Systems Usage
Table 9. Goodness of Fit Measures for the a Priori Structural Model-Study 2.
Suggested Harvard Measures of Model Fit Values WordPerfect Lotus 1-2-3 Graphics
Chi-square p > 0.05 181; p < 0.001 176; p < 0.001 183; p < 0.001
Chi-square/degrees of freedom < 5 2.45 2.37 2.45
Goodness of Fit Index (GFI) > 0.90 0.75 0.76 0.73
Adjusted GFI > 0.80 0.65 0.66 0.61 Root Mean
Square Residual < 1 0.30 0.12 0.15
Largest Normalized Residual < 2 1.85 2.33 1.18
y = 0.21 (t=2.5) 1,1
7 = -0.03 (t=-0.42) 2,1
Ei represents the ease-of-use items from the questionnaire. Ui represents the usefulness items from the questionnaire.
Figure 4. Results of the WordPerfect Model (Standardized Solution)
MIS Quarterly/June 1992 241
Increasing Systems Usage
y =-0.39 (t=-1.8) 1,1
7 = 0.85 (t=2.97) 2,1
Ei represents the ease-of-use items from the questionnaire. Ui represents the usefulness items from the questionnaire.
Figure 5. Results of the Lotus Model (Standardized Solution)
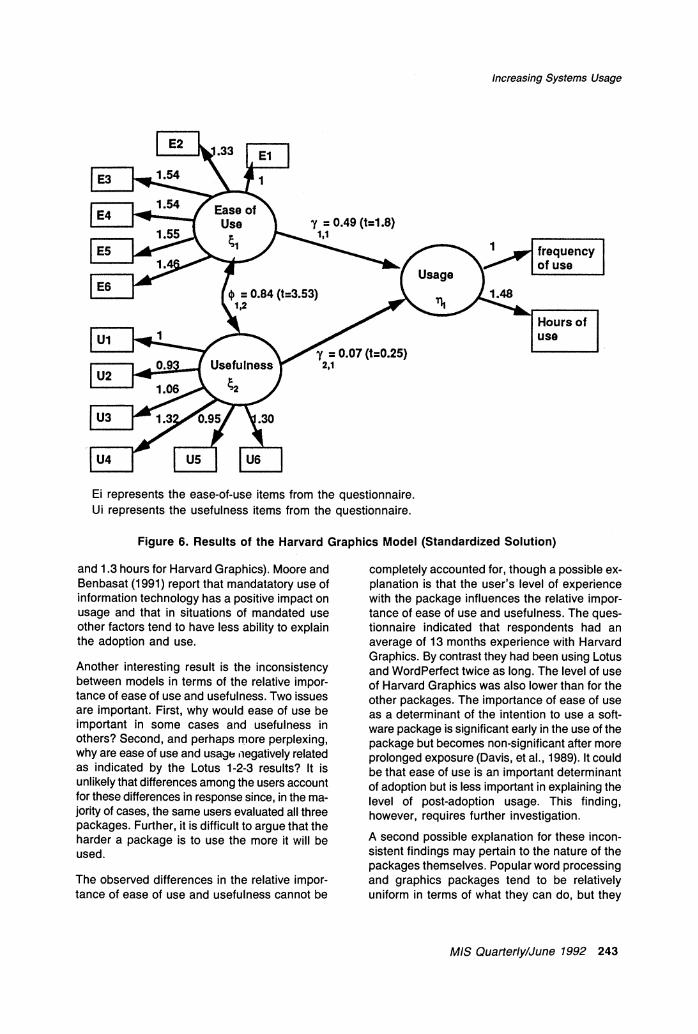
1-2-3 model explains approximately 35 percent of the variability in usage. The results for Harvard Graphics indicate the im- portance of ease of use rather than usefulness in determining use. In this case, the ease of use- usage path is marginally significant (r1, = 0.48; t= 1.8). The usefulness-usage path, however is not significant (r2, = 0.06; t=0.24). The total coefficient of determination for the structural equations is 0.29, indicating that the model ex- plains approximately 30 percent of the variance in usage.
Discussion-Study 2 The results of Study 2 reaffirm the validity and reliability of the ease-of-use and usefulness scales and show that they can discriminate be- tween software packages that, based on their popularity, would be highly rated in terms of ease of use and usefulness. This clearly establishes the discriminant validity of the scales.
The relationship observed between ease of use, usefulness, and usage in this study is more com- plex than observed in Study 1 and raises several interesting questions. First, consider the low ex- planatory power of the WordPerfect model, coupled with the higher explanatory power for Lotus 1-2-3 and Harvard Graphics, as compared to Study 1. In explaining this result the impact of voluntary or captive usage may be important. Although the use of WordPerfect is not com- pulsory for these users and indeed the use of word processors in general is not mandated, it has become a defacto standard. Though usage is not compulsory, the subjective norm, or the students' view of what others think they should do, may encourage the use of word processing (Moore and Benbasat, 1991). This would explain the relatively low explanatory power for the Word- Perfect model. Usage may be high regardless of perceived levels of ease of use or usefulness. This interpretation is supported by the mean reported hours used (approximately 8 hours per week for WordPerfect, 2 hours for Lotus 1-2-3,
242 MIS Quarterly/June 1992
Increasing Systems Usage
y = 0.49 (t=1.8) 1,1
(t=0.25)
Ei represents the ease-of-use items from the questionnaire. Ui represents the usefulness items from the questionnaire.
Figure 6. Results of the Harvard Graphics Model (Standardized Solution)
and 1.3 hours for Harvard Graphics). Moore and Benbasat (1991) report that mandatatory use of information technology has a positive impact on usage and that in situations of mandated use other factors tend to have less ability to explain the adoption and use.
Another interesting result is the inconsistency between models in terms of the relative impor- tance of ease of use and usefulness. Two issues are important. First, why would ease of use be important in some cases and usefulness in others? Second, and perhaps more perplexing, why are ease of use and usage ,negatively related as indicated by the Lotus 1-2-3 results? It is unlikely that differences among the users account for these differences in response since, in the ma- jority of cases, the same users evaluated all three packages. Further, it is difficult to argue that the harder a package is to use the more it will be used.
The observed differences in the relative impor- tance of ease of use and usefulness cannot be
completely accounted for, though a possible ex- planation is that the user's level of experience with the package influences the relative impor- tance of ease of use and usefulness. The ques- tionnaire indicated that respondents had an average of 13 months experience with Harvard Graphics. By contrast they had been using Lotus and WordPerfect twice as long. The level of use of Harvard Graphics was also lower than for the other packages. The importance of ease of use as a determinant of the intention to use a soft- ware package is significant early in the use of the package but becomes non-significant after more prolonged exposure (Davis, et al., 1989). It could be that ease of use is an important determinant of adoption but is less important in explaining the level of post-adoption usage. This finding, however, requires further investigation. A second possible explanation for these incon- sistent findings may pertain to the nature of the packages themselves. Popular word processing and graphics packages tend to be relatively uniform in terms of what they can do, but they
MIS Quarterly/June 1992 243
Increasing Systems Usage
differ significantly in how tasks are accomplished (i.e., in terms of interface). That is, differences in interfaces tend to be large, and differences in terms of function tend to be small. In such cases ease of use might be more important because it is a primary feature on which the packages can be differentiated. By contrast it might be argued that the general interface for spreadsheet packages is similar, and therefore spreadsheet packages are not differentiable in terms of ease of use.11 This hypothesis could be tested ex- perimentally by having subjects evaluate soft- ware that was designed systematically to vary in terms of ease of use and usefulness.
The negative relationship between ease of use and usage for Lotus 1-2-3 may indicate that ease of use is not a determinant of use at all, but rather that usage influences perceived ease of use. Davis, et al. (1989) argue that the importance of usefulness may imply that extra effort will be made to use a highly functional yet difficult system. While this would explain why usage may be unrelated to ease of use, it would not necessarily explain why usage might increase as perceived ease of use decreases. An alternative explanation is that users develop their attitudes about a system's ease of use through prolonged usage. This could lead to a negative ease of use- usage relationship through a number of factors.
First, if during initial encounters with a system the users find it difficult to use, they may attribute those difficulties to their own inability to grasp the system. If, as they gain experience with the system, they still encounter the same difficulties, they may begin to attribute these failings to the system rather than to themselves. Melone's (1990) discussion of the role of self-perception theory in IS research would be relevant here. Users may develop negative attitudes toward the system as they become frustrated by their dif- ficulties using the system. A second, simpler explanation is that infrequent users of a spreadsheet package would make use of relatively simple features, which are indeed easy to use. More frequent users may employ ad- ditional features, such as functions and macros, which are typically less intuitive and more difficult to use. This again might lead to more negative ratings of ease of use as usage increases.
Certainly the recent "look and feel" lawsuits would support this argument.
Third, more frequent users may have a broader general computer experience and, hence, place more demands on packages and have a broader base from which to evaluate the ease of use of a package. For example, heavy Lotus 1-2-3 users might also be experienced with other packages they believe to be superior and would base their evaluation accordingly. It would be useful to ex- amine these and other possible competing ex- planations for factors that might moderate the relationship between ease of use and usage. A clear implication of this study is that it is not possi- ble to assert a simple unidirectional relationship from ease of use to usage.
Finally, it is unclear why the overall fit of the model is not as high in this case as it was in Study 1.12 One explanation may be that the dif- ferences are attributable to weak measurements of usage. In Study 1 the two self-reported usage measures, number of messages sent and re- ceived on a typical day, and number sent and received yesterday are highly correlated (r = 0.92). In this study the correlations between the two usage measures (frequency of use and hours of use last week) range from 0.47 to 0.57. It may be simply more difficult for users to ac- curately report the amount of time they use a soft- ware package than it is to report a discrete value such as the number of messages sent and re- ceived. However, analysis of the data run with either or both of the measures yields essentially the same results in terms of model fit, path coef- ficients, and significance.
Ideally, future research will take measures of ac- tual usage; however, such an approach is often impractical because obtaining access to system- monitored usage data is often difficult. Regard- less, follow-on studies that employ actual measures of system use would be an important step in further defining the relationship between determinants such as ease of use, usefulness, and usage. In addition, studies that look at the relationship between actual and perceived levels of system usage would be of value. For exam- ple, Sproull and Kiesler (1986) provide some evidence that users tend to overstate their actual level of usage. A caveat is required for the explanations of results in Study 2. These interpretations are
'2As we noted earlier the absence of model fit is not likely to be an issue of statistical power.
244 MIS Quarterly/June 1992
Increasing Systems Usage
based on limited available data and findings in other studies (Davis, et al., 1989; Moore and Ben- basat, 1991). The inconsistent results of Study 2 in terms of the determinants of usage may be attributed to issues of statistical power. Certain- ly in the case of the small effects reported for the usefulness-usage paths for WordPerfect and Har- vard Graphics the studies did not have adequate sample size to detect significance. Post hoc power analysis indicates the power of the tests ranged from 0.9 for the usefulness-usage path in the Lotus model to a low of 0.1 for the same path in the Harvard Graphics model. It should be noted that the small effects indicated for these two models would only be significant with much larger sample sizes (n > 1000). The size of the potential effects (standardized coefficients < 0.10) brings into question their practical significance. If the path coefficient is small it is difficult to conclude that it is actually meaningful even if statistically significant. On the other hand, the marginal significance of the ease of use-usage path for Lotus and Har- vard Graphics is almost certainly due to limits of sample size. Simulations of LISREL models assuming a larger sample (n = 250) and the same covariance structure generated by this sample indicate that in both cases the paths would have been significant (p < 0.05). Note, however, that the path coefficients exhibit opposite effects with ease of use and usage, showing a negative rela- tionship for the Lotus model. Proper assessment of these issues can only be made by conducting additional studies. To examine the possible im- portance of determinants of use at different points in time, a longitudinal design should be con- sidered. This would help disentangle the direc- tional relationship between the attitudes toward a system and the behavior of using that system. It may be that user experience becomes an im- portant determinant of usage and that different factors will take on different levels of importance depending upon the user's knowledge of and ex- perience with the software package.
Concluding Comments Although the psychometric properties of the two measures developed by Davis appear to have been robust across studies and user groups, they should not be considered as the final chapter in the validation and refinement of these scales. A
true MTMM analysis, which employs an alternate method to capture the ease of use and useful- ness data, would be relevant. Neither our research, nor the work of Davis clearly shows convergent and discriminant validity in the precise manner discussed by Campbell and Fiske (1959). As indicated previously, the applica- tion of MTMM is made difficult by the absence of alternative established measures of the ease of use and usefulness constructs. Other ap- proaches to validation could incorporate the sort- ing techniques described by Moore and Benbasat (1991). Alternatively, useful assessment of validi- ty could be made by conducting laboratory ex- periments using technologies that are known to vary on the dimensions of interest.
These studies show that the relationship of these two constructs to usage is perhaps more com- plex than is typically postulated. There is no ab- solute measure of ease of use or usefulness, and user perceptions of these constructs may vary with time and experience for any given applica- tion. The differences between models in Study 2 indicate that a consistent information tech- nology effect should not be expected. It may be that a variety of factors, such as user experience, type or sophistication of system use, or other task and user characteristics may mediate the rela- tionship between ease of use and usage. As in- dicated in Study 2, usage may influence perceptions of ease of use. Future research should begin to examine some of these mediating effects to determine the extent to which ease of use and usefulness are directly related. In addi- tion, research that directly addresses the in- fluence of attitude on behavior and of behavior on attitude toward IS should be carried out. Ideal- ly studies will provide tests of competing models.
Finally, we would like to reiterate the sentiments of Davis that development of valid measures linked to user acceptance of technology is possi- ble and should be pursued. This has been em- phasized in recent research by Davis (1989) and others (Baroudi and Orlikowski, 1988; Moore and Benbasat, 1991; Straub, 1989). More studies ex- amining the fundamental properties of these measures should be undertaken. The tendency of IS researchers to become complacent or discouraged with progress in a specific area after conducting what would be considered a very limited number of studies in other domains should be challenged. We should begin to focus
MIS Quarterly/June 1992 245
Increasing Systems Usage
on replication, refinement, and development of models and measures. We believe this paper is one further step, albeit a small one, in this direction.
Acknowledgements This work was supported by an operating grant from the Natural Sciences and Engineering Research Council of Canada, the Associates Pro- gram of the Mclntire School of Commerce, the Information Systems Research Center at the University of Houston, and the Research Pro- gram at the Queen's School of Business. We are grateful to Mike Kattan and Shirley Taylor for their assistance with the data analysis. We also thank Gary Moore, Jim McKeen, Ron Rice, Shirley Taylor, and the anonymous reviewers for their helpful comments on earlier drafts of this paper.
References Bagozzi, R.P. and Warshaw, P.R. "Trying to Con-
sume," Journal of Consumer Research (17:2), September 1990, pp. 127-140.
Baroudi, J. and Orlikowski, W.J. "A Short Form Measure of User Information Satisfaction," Journal of MIS (4:4), Spring 1988, pp. 44-59.
Bentler, P. and Bonett, D. "Significance Tests and Goodness of Fit in the Analysis of Covariance Structures," Psychological Bulletin (88:3), November 1980, pp. 588-606.
Campbell, D.T. and Fiske, D.W. "Convergent and Discriminant Validation by the Multitrait- Multimethod Matrix," Psychological Bulletin (56:2), March 1959, pp. 81-105.
Davis, F.D. "Perceived Usefulness, Perceived Ease of Use, and User Acceptance of Infor- mation Technology," MIS Quarterly (13:3), September 1989, pp. 319-340.
Davis, F., Bagozzi, R., and Warshaw, P. "User Acceptance of Computer Technology: A Com- parison of Two Theoretical Models," Manage- ment Science (35:8), August 1989, pp. 982-1003.
Fishbein, M. and Ajzen, I. Belief, Attitude, Inten- tion and Behavior: An Introduction to Theory and Research, Addison-Wesley, Reading, MA, 1975.
Fornell, C. "Issues in the Application of Covariance Structure Analysis: A Comment," Journal of Consumer Research (9:3), March 1983, pp. 443-448.
Goodwin, N.C. "Functionality and Usability," Communications of the ACM (30:3), March 1987, pp. 229-233.
Guttman, L. "A Basis for Analyzing Test-Retest Reliability," Psychometrika (10:4), December 1945, pp. 255-282.
Hayduk, L.A. Structural Equation Modeling with LISREL, Johns Hopkins University Press, Baltimore, MD, 1987.
Hill, T., Smith, N.S., and Mann, M.F. "The Role of Efficacy Expectations in Predicting the Decision to Use Advanced Technologies: The Case of Computers," Journal of Applied Psychology (72:2), May 1987, pp. 307-313.
Joreskog, K.G. and Sorbom, D. LISREL 7 User's Reference Guide, Scientific Software Inc., Chicago, IL, 1989.
Markus, M.L. "Toward a Critical Mass Theory of Interactive Media: Universal Access, In- terdependence and Diffusion," Communica- tion Research (14:5), October 1987, pp. 491-511.
Melone, N.P. "A Theoretical Assessment of the User-Satisfaction Construct in Information Systems Research," Management Science (36:1), January 1990, pp. 76-91.
Moore, G.C. An Examination of the Implemen- tation of Information Technology for End Users: A Diffusion of Innovations Perspective, unpublished doctoral thesis, University of British Columbia, Vancouver, B.C., 1989.
Moore, G.C. and Benbasat, I. "An Examination of the Adoption of Information Technology by End-Users: A Diffusion of Innovations Perspective," working paper, Faculty of Management, University of Calgary, Calgary, Alberta, 1991.
Moore, G.C. and Benbasat, I. "The Development of an Instrument to Measure the Perceived Characteristics of Adopting an Information Technology Innovation," Information Systems Research (2:3), September 1991, pp. 192-222.
Panko, R. "Options in Electronic Mail," Office Administration and Automation (44:11), November 1983, pp. 50-96.
Paznik, M. "Voice Mail: Pitfalls and Promises," Administrative Management (48:3), March 1987, pp. 16-25.
Rice, R.E. and Steinfield, C. "Experiences with New Forms of Organizational Communication via Electronic Mail and Voice Messaging," in Telematics and Work, J.H. Andriessen and R. Roe (eds.), Wiley, New York, NY, 1991.
246 MIS Quarterly/June 1992
Increasing Systems Usage
Rogers, E.M. Diffusion of Innovations, Free Press, New York, NY, 1983.
Silver, M. "User Perceptions of DSS Restric- tiveness: An Experiment," Journal of MIS (5:1), Summer 1988, pp. 51-65.
Sproull, L. and Kiesler, S. "Reducing Social Con- text Cues: Electronic Mail in Organizational Communication," Management Science (32:4), April 1986, pp. 1492-1512.
Straub, D.W. "Validating Instruments in MIS Research," MIS Quarterly (13:2), June 1989, pp. 147-170.
Straub, D.W. "Effective IS Security: An Empirical Study," Information Systems Research (1:3), September 1990, pp. 255-276.
Straub, D.W. and Wetherbe, J.C. "Information Technologies for the 1990's: An Organiza- tional Impact Perspective," Communications of the ACM (32:11), November 1989, pp. 1328-1339.
Wheaton, B.B., Muthen, B., Alwin, D.F., and Summers, G.F. "Assessing Reliability and Stability in Panel Models," in Sociological Methodology 1977, D.R. Heise (ed.), Jossey- Bass, San Francisco, CA, 1977.
About the Authors Dennis A. Adams is assistant professor of deci- sion and information sciences at the University of Houston. His research interests include the use of computer-supported communication systems, the uses of information technology for competitve advantage, and the analysis and design of parallel systems. He has published ar-
ticles in journals such as Data Base, Informa- tion and Management, Journal of General Management, Information Systems Research and Interfaces.
R. Ryan Nelson is associate professor in the Mclntire School of Commerce at the University of Virginia. He received his Ph.D. in business ad- ministration from the University of Georgia in 1985 and spent five years on the faculty of the University of Houston before joining UVa. His research has been published in such journals as MIS Quarterly, Journal of Management Informa- tion Systems, Information and Management, Data Base, and Datamation. In addition, Dr. Nelson recently edited a book entitled End-User Computing: Concepts, Issues and Applications, which was published by John Wiley & Sons. His current research interests focus on IS-related training, computer-mediated communication, and the impact of information technology on multina- tional corporations.
Peter A. Todd is assistant professor of MIS in the School of Business at Queen's University. He received his Ph.D. in information systems from the University of British Columbia and has previously served on the faculty of the Universi- ty of Houston. He has published previously in Communications of the ACM, MIS Quarterly, Human-Computer Interaction, Information Systems Research and The International Jour- nal of Man/Machine Studies. His research in- terests include human-computer interaction, the impact of computer-based support systems on individuals and organizations, and behavioral decision theory.
MIS Quarterly/June 1992 247