Embed Size (px)
Citation preview
SPEDL Series
Pre-frac Reservoir Characterization from
Perforation Inflow Diagnostic (PID) Testing
“Measure Twice – Frac Once”
Robert HawkesTeam Leader, Reservoir Services
BJ Services Company Canada

SPEDL Series
SPE DISTINGUISHED LECTURER SERIES
is funded principallythrough a grant of the
SPE FOUNDATIONThe Society gratefully acknowledges
those companies that support the programby allowing their professionals
to participate as Lecturers.
And special thanks to The American Institute of Mining, Metallurgical,and Petroleum Engineers (AIME) for their contribution to the
program.
SPEDL Series
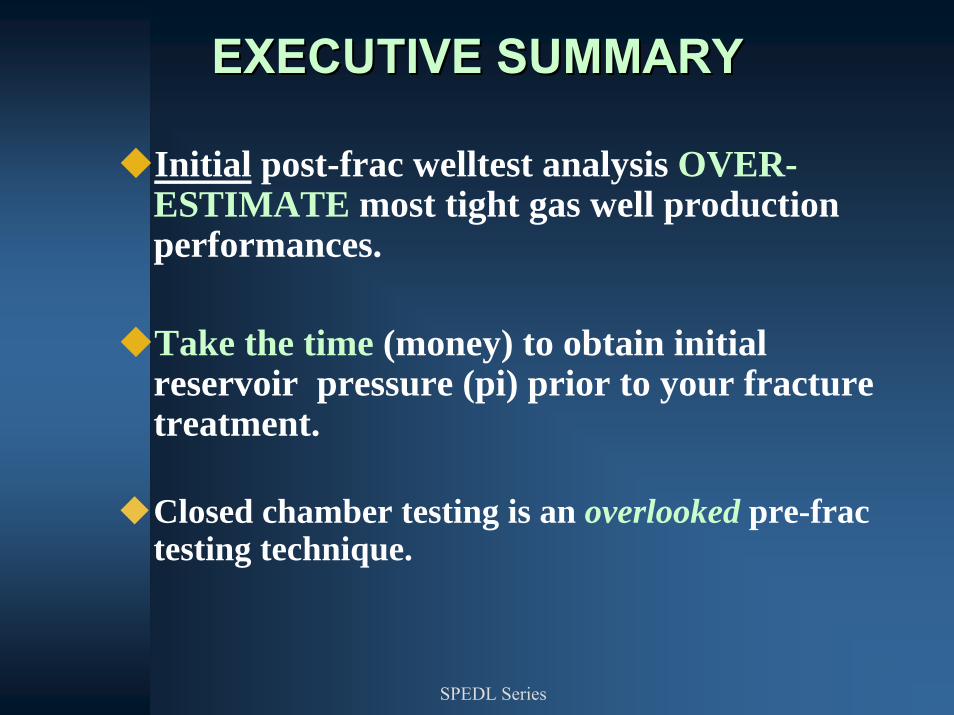
EXECUTIVE SUMMARYEXECUTIVE SUMMARY
Initial post-frac welltest analysis OVER-ESTIMATE most tight gas well production performances.
Take the time (money) to obtain initial reservoir pressure (pi) prior to your fracture treatment.
Closed chamber testing is an overlooked pre-frac testing technique.
SPEDL Series
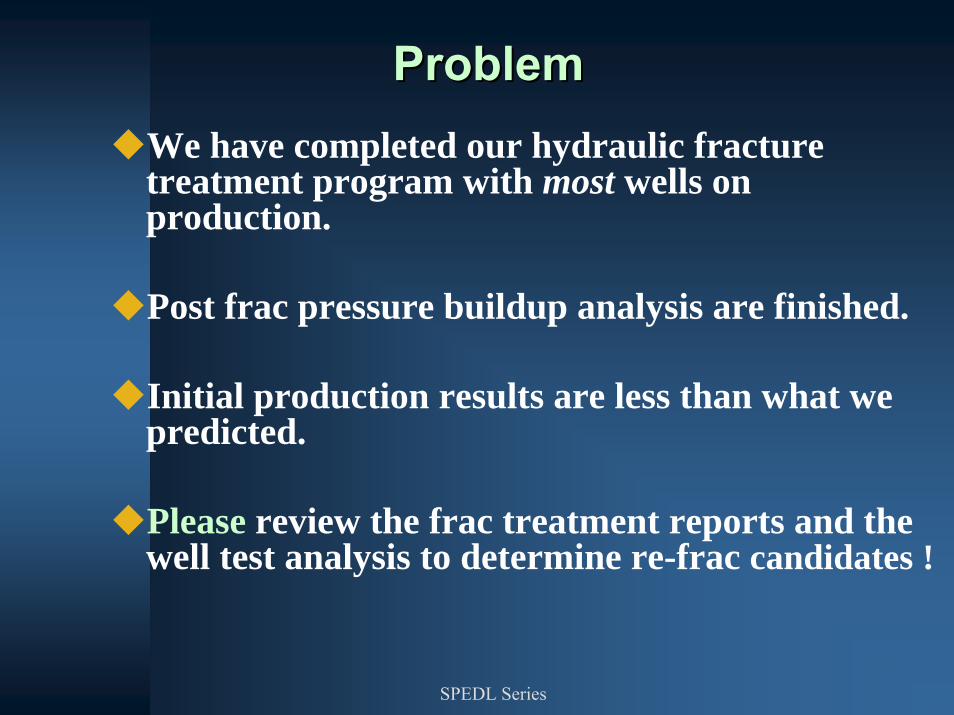
ProblemProblemWe have completed our hydraulic fracture treatment program with most wells on production.
Post frac pressure buildup analysis are finished.
Initial production results are less than what we predicted.
Please review the frac treatment reports and the well test analysis to determine re-frac candidates !
SPEDL Series
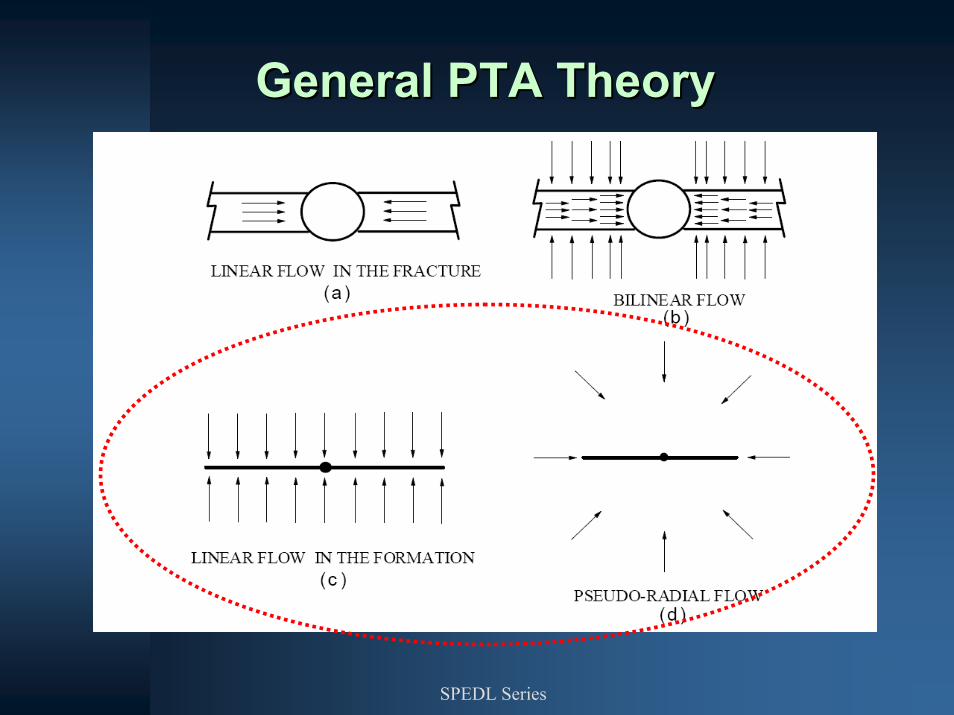
General PTA TheoryGeneral PTA Theory
SPEDL Series
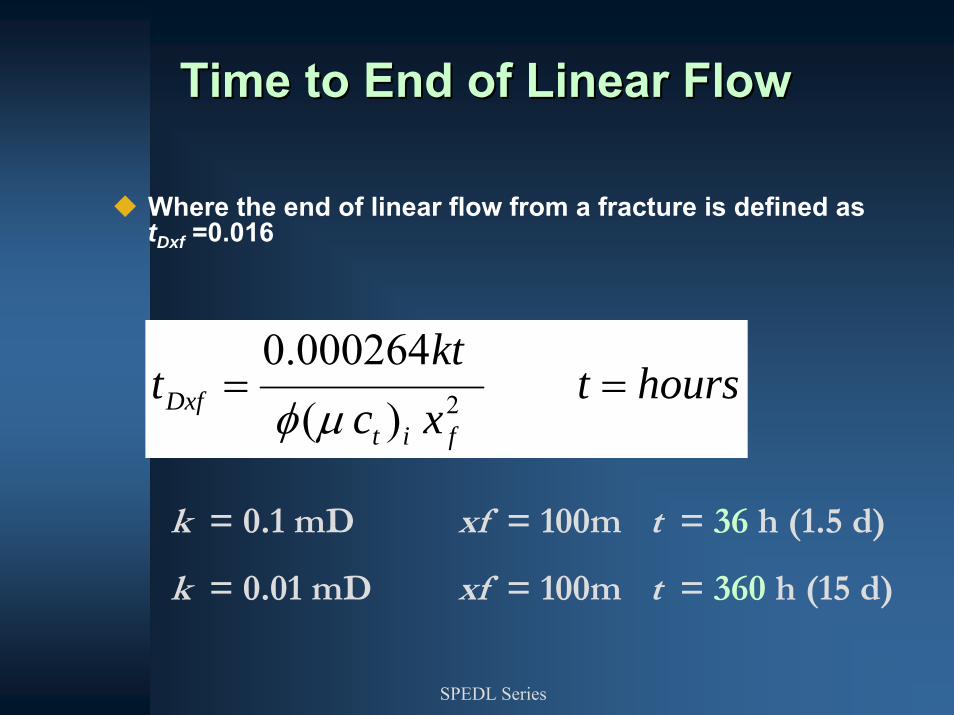
Time to End of Linear FlowTime to End of Linear Flow
Where the end of linear flow from a fracture is defined as tDxf =0.016
hourstxckt
tfit
Dxf == 2)(000264.0μφ
k = 0.1 mD xf = 100m t = 36 h (1.5 d)
k = 0.01 mD xf = 100m t = 360 h (15 d)
SPEDL Series
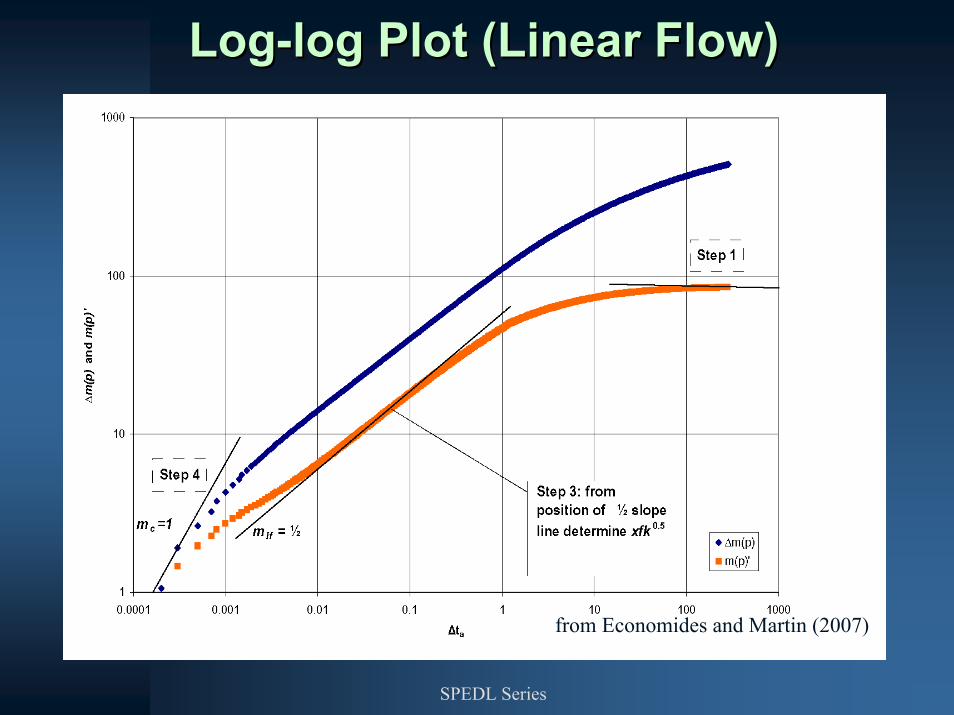
from Economides and Martin (2007)
LogLog--log Plot (Linear Flow) log Plot (Linear Flow)
SPEDL Series
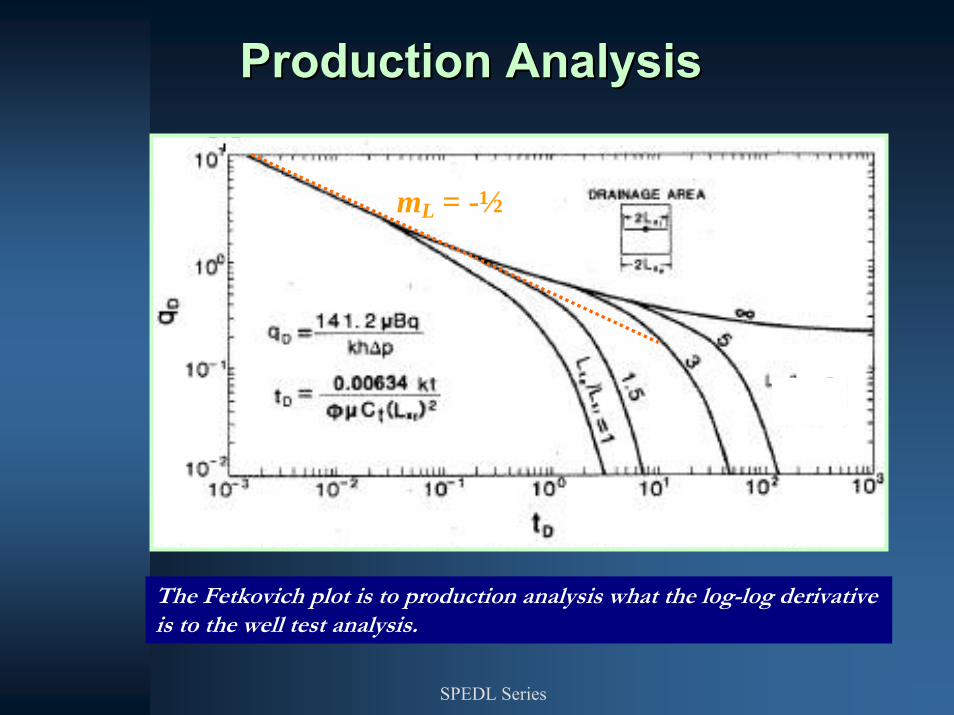
Production AnalysisProduction Analysis
The Fetkovich plot is to production analysis what the log-log derivative is to the well test analysis.
mL = -½
SPEDL Series
PostPost--frac Flow and Buildup Testfrac Flow and Buildup Test
0 5 10 15 20 25 30 35 40 45 50 55 60 65 70 75 80 85 90 95 100 105 110 115 120 125 130 135 140 145 150
Time, h
2000
3000
4000
5000
6000
7000
8000
9000
10000
11000
12000
13000
14000
15000
16000
17000
18000
19000
Pres
sure
, kPa
(a)
0
5
10
15
20
25
30
35
40
45
50
55
60
65
70
Gas R
ate, 103m
3/d
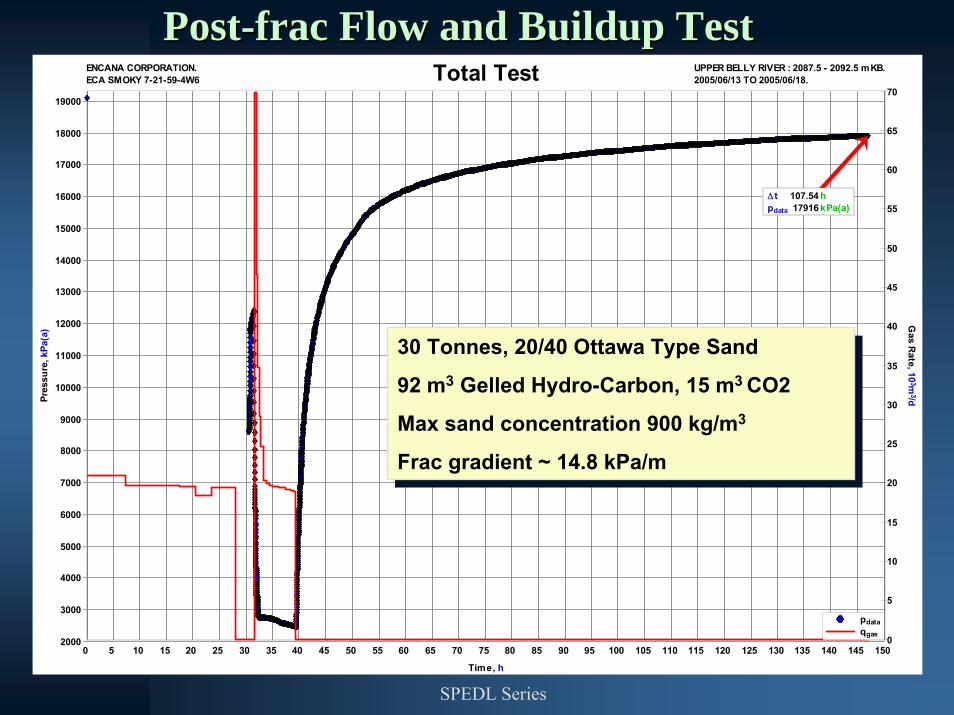
Total TestENCANA CORPORATION.ECA SMOKY 7-21-59-4W6
UPPER BELLY RIVER : 2087.5 - 2092.5 mKB.2005/06/13 TO 2005/06/18.
pdataqgas
Δ t 107.54 hpdata 17916 kPa(a)
30 Tonnes, 20/40 Ottawa Type Sand
92 m3 Gelled Hydro-Carbon, 15 m3 CO2
Max sand concentration 900 kg/m3
Frac gradient ~ 14.8 kPa/m
30 Tonnes, 20/40 Ottawa Type Sand
92 m3 Gelled Hydro-Carbon, 15 m3 CO2
Max sand concentration 900 kg/m3
Frac gradient ~ 14.8 kPa/m
SPEDL Series
10-1 1.0 101 1022 3 4 5 6 7 8 9 2 3 4 5 6 7 8 9 2 3 4 5 6 7 8 9 2 3 4 5 6 7 8 2 3 4 5 6 7 8 9
Pseudo-Time, h
1.0
101
2
3
4
56
8
2
3
4
56
8
2
3
4
56
8
Δψ
/ D
eriv
ativ
e, 1
06kP
a2/μ
Pa.s
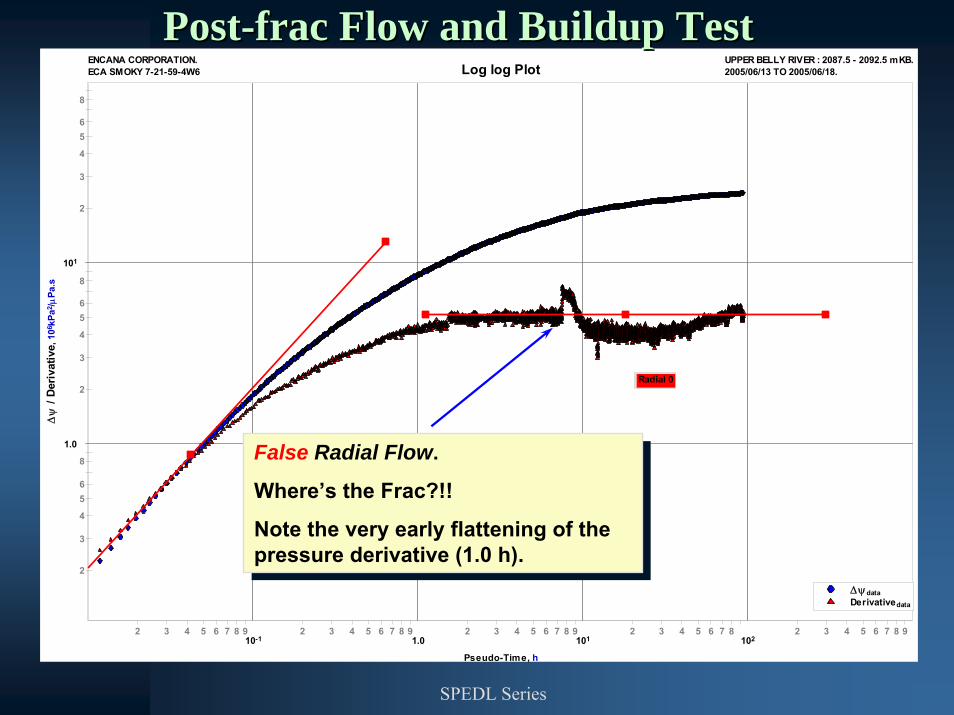
Log log PlotENCANA CORPORATION.ECA SMOKY 7-21-59-4W6
UPPER BELLY RIVER : 2087.5 - 2092.5 mKB.2005/06/13 TO 2005/06/18.
ΔψdataDerivativedata
Storage 1
Radial 0
PostPost--frac Flow and Buildup Testfrac Flow and Buildup Test
False Radial Flow.
Where’s the Frac?!!
Note the very early flattening of the pressure derivative (1.0 h).
False Radial Flow.
Where’s the Frac?!!
Note the very early flattening of the pressure derivative (1.0 h).
SPEDL Series
PostPost--frac Flow and Buildup Testfrac Flow and Buildup Test
1011021032345678923456789234567823456789
Superposition Radial Pseudo-Time (ΣΔ ta), h
0
2
4
6
8
10
12
14
16
18
20
22
24
26
28
ψ, 1
06kP
a2/μ
Pa.s
0300040005000
6000
7000
8000
9000
10000
11000
12000
13000
14000
15000
16000
17000
18000
19000
p, kPa(a)
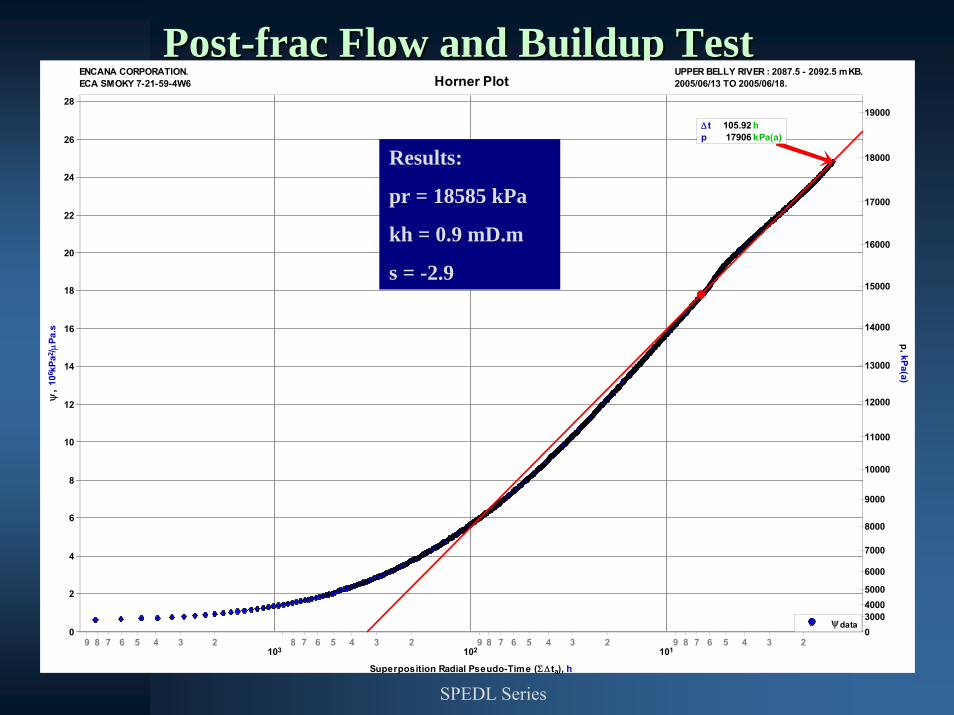
Horner PlotENCANA CORPORATION.ECA SMOKY 7-21-59-4W6
UPPER BELLY RIVER : 2087.5 - 2092.5 mKB.2005/06/13 TO 2005/06/18.
ψdata
Analysis 1p* 18583 kPa(a)kh 0.90 mD.ms' -2.865
Δ t 105.92 hp 17906 kPa(a)
Results:
pr = 18585 kPa
kh = 0.9 mD.m
s = -2.9
SPEDL Series
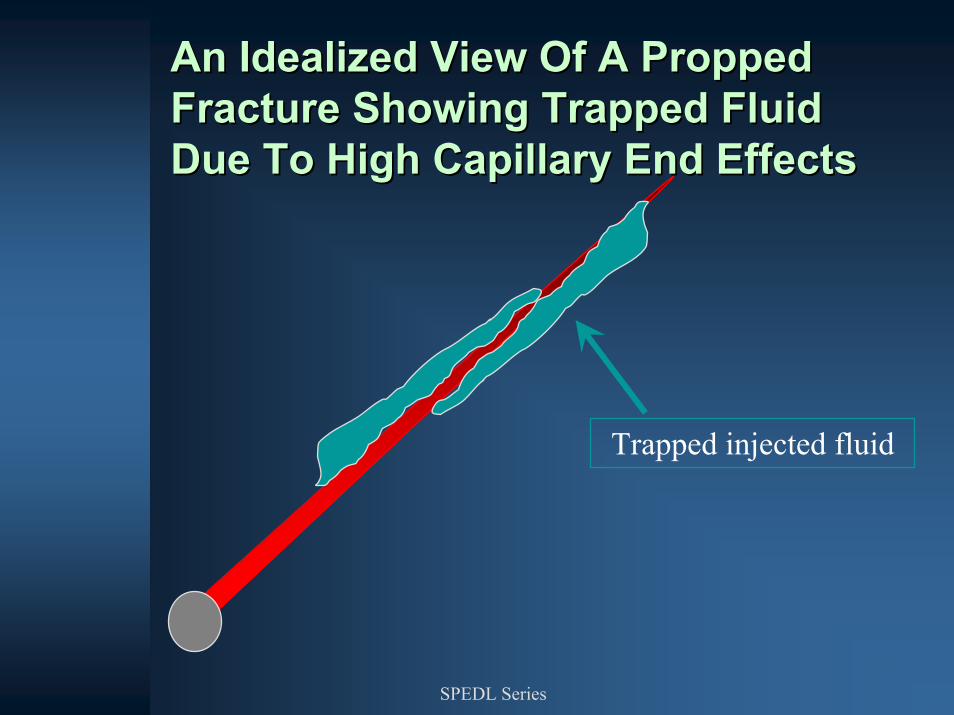
Trapped injected fluid
An Idealized View Of A Propped An Idealized View Of A Propped Fracture Showing Trapped Fluid Fracture Showing Trapped Fluid Due To High Capillary End EffectsDue To High Capillary End Effects
SPEDL Series
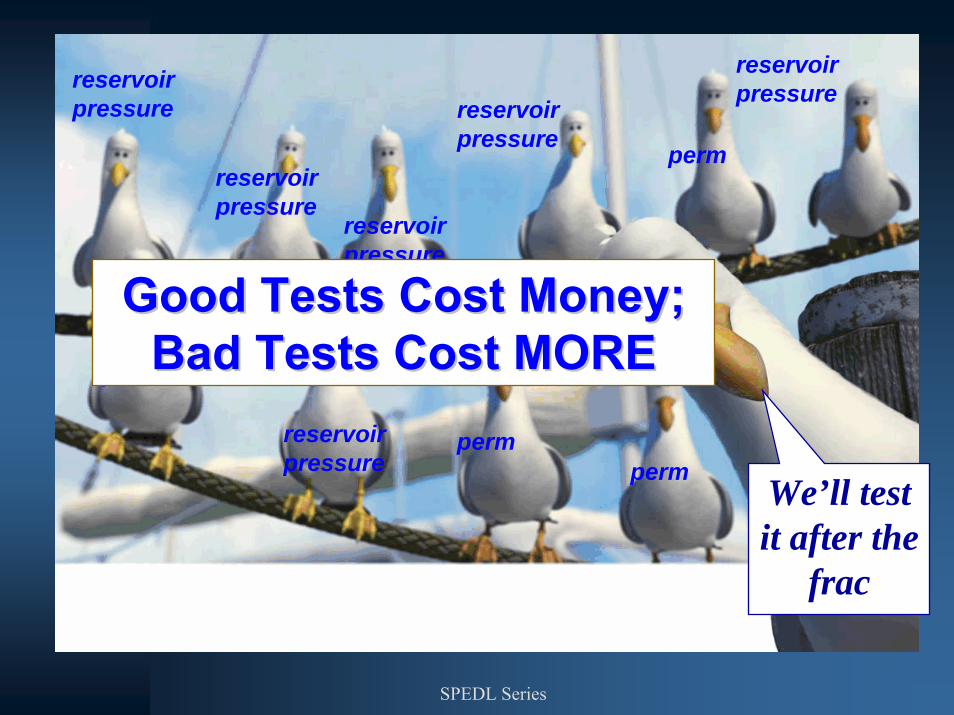
permreservoirpressure
reservoirpressure
perm
perm
perm
reservoirpressure
perm
permreservoirpressure
reservoirpressure
We’ll test it after the
frac
reservoirpressure
Good Tests Cost Money; Good Tests Cost Money; Bad Tests Cost MOREBad Tests Cost MORE
SPEDL Series
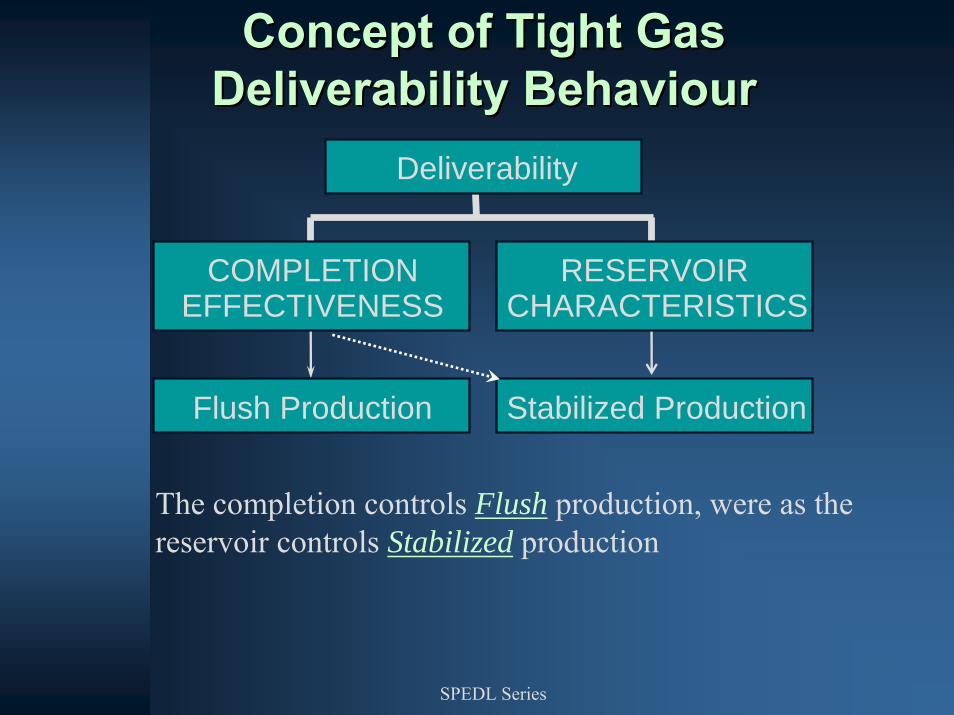
Concept of Tight Gas Concept of Tight Gas Deliverability BehaviourDeliverability Behaviour
Flush Production
COMPLETIONEFFECTIVENESS
Stabilized Production
RESERVOIRCHARACTERISTICS
Deliverability
The completion controls Flush production, were as the reservoir controls Stabilized production
SPEDL Series
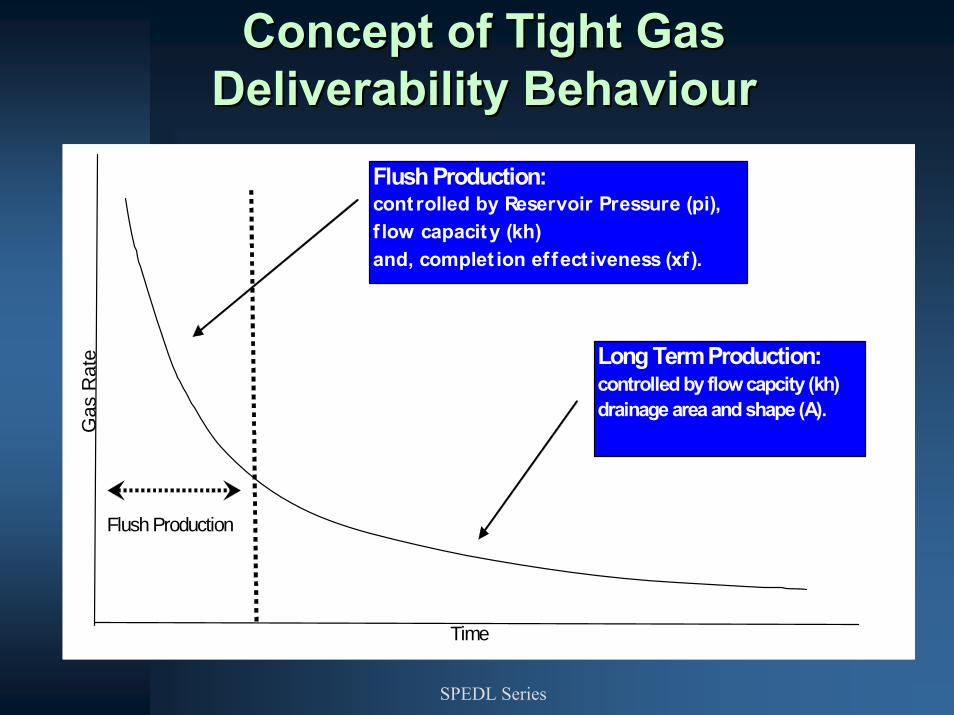
Concept of Tight Gas Concept of Tight Gas Deliverability BehaviourDeliverability Behaviour
Gas
Rat
e
Time
Flush Production
Flush Production:cont rolled by Reservoir Pressure (pi),f low capacity (kh)and, complet ion effect iveness (xf).
Long Term Production:controlled by flow capcity (kh) drainage area and shape (A).
SPEDL Series
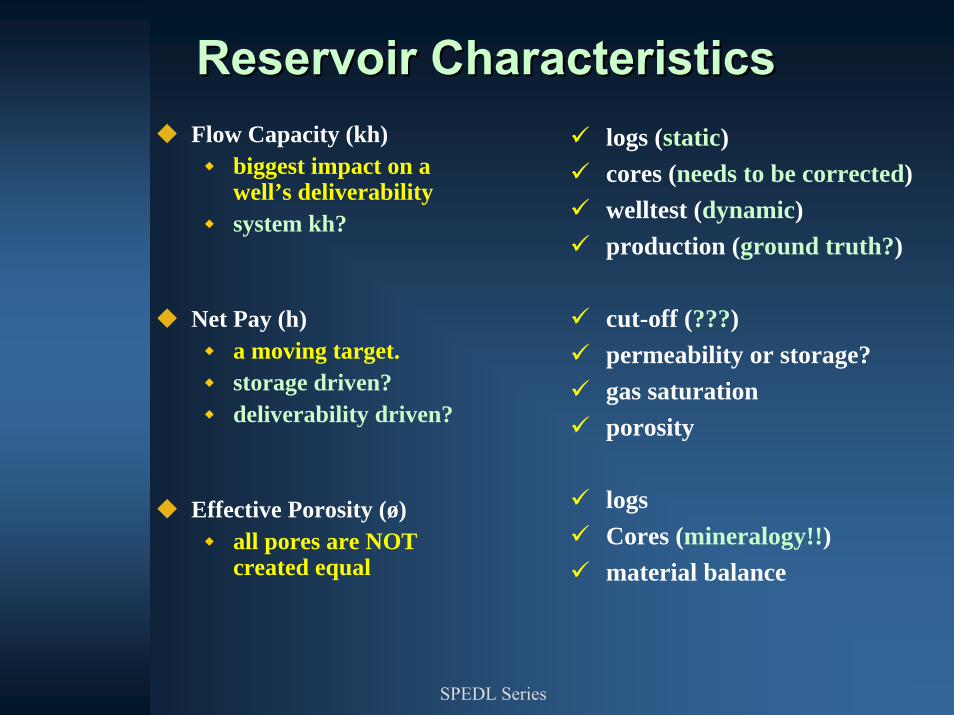
Reservoir CharacteristicsReservoir CharacteristicsFlow Capacity (kh)
biggest impact on a well’s deliverabilitysystem kh?
Net Pay (h)a moving target.storage driven?deliverability driven?
Effective Porosity (ø)all pores are NOT created equal
logs (static)cores (needs to be corrected)welltest (dynamic)production (ground truth?)
cut-off (???)permeability or storage?gas saturationporosity
logsCores (mineralogy!!)material balance
SPEDL Series
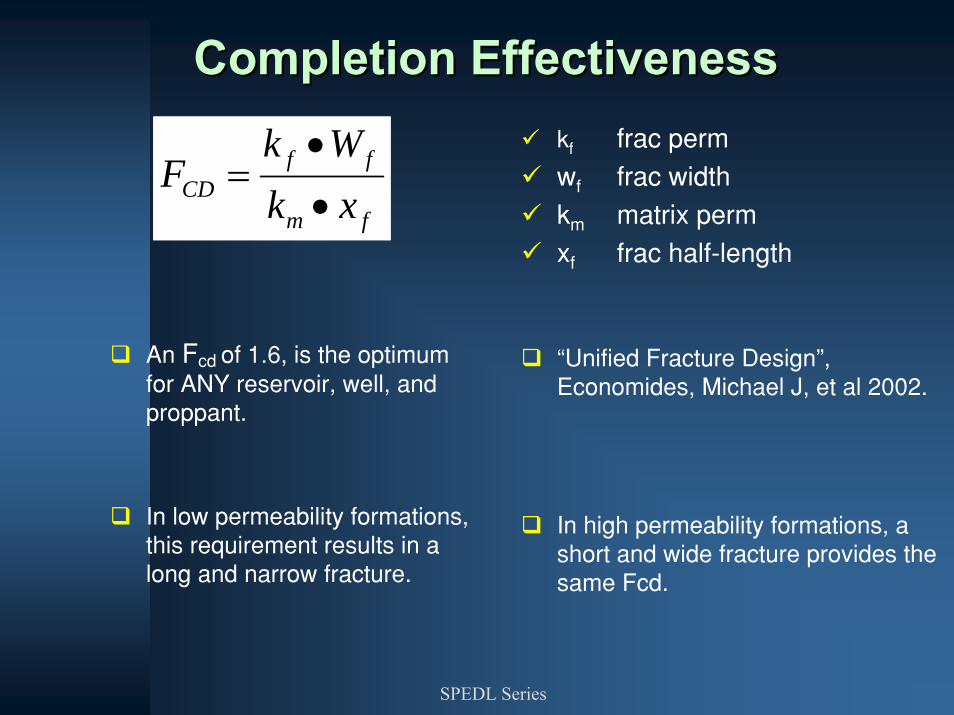
Completion EffectivenessCompletion Effectiveness
An Fcd of 1.6, is the optimum for ANY reservoir, well, and proppant.
In low permeability formations, this requirement results in a long and narrow fracture.
kf frac permwf frac widthkm matrix permxf frac half−length
ˆUnified Fracture Design˜, Economides, Michael J, et al 2002.
In high permeability formations, a short and wide fracture provides the same Fcd.
fm
ffCD xk
WkF
•
•=
SPEDL Series
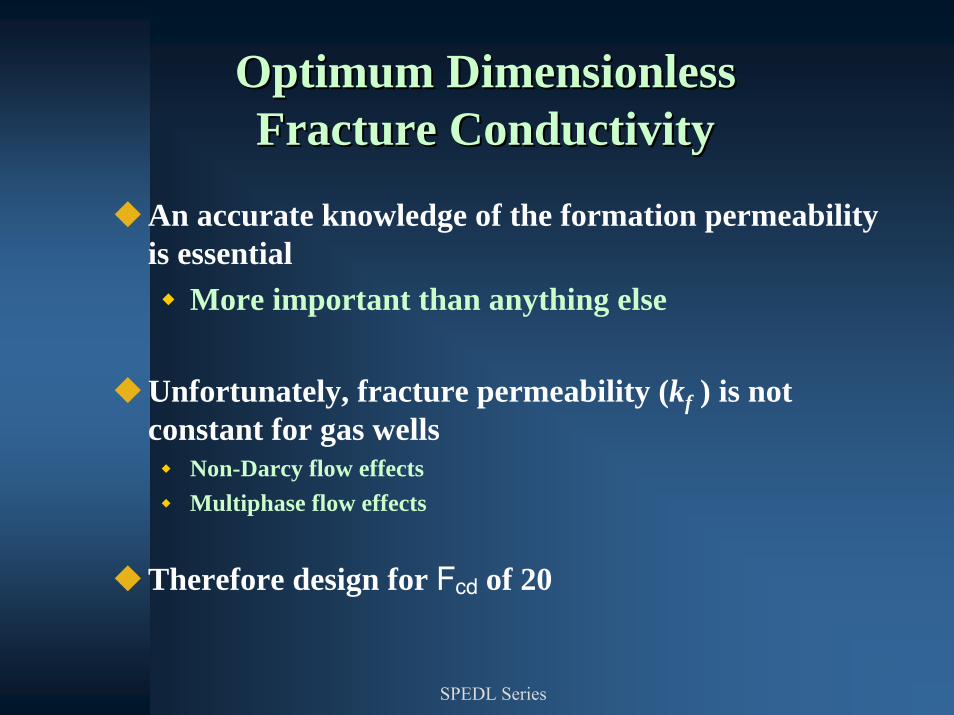
Optimum Dimensionless Optimum Dimensionless Fracture ConductivityFracture Conductivity
An accurate knowledge of the formation permeability is essential
More important than anything else
Unfortunately, fracture permeability (kf ) is not constant for gas wells
Non-Darcy flow effectsMultiphase flow effects
Therefore design for Fcd of 20
SPEDL Series
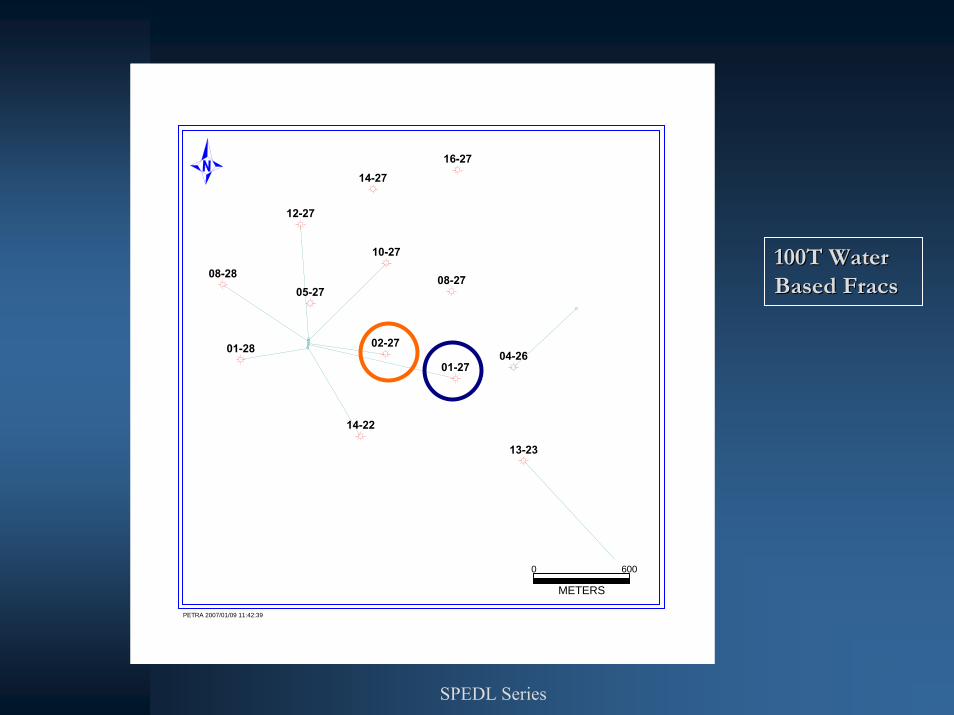
Township 078-11W6
01-28
08-2805-27
12-27
14-2716-27
10-27
08-27
04-26
13-23
01-27
02-27
14-22
METERS
0 600
PETRA 2007/01/09 11:42:39
100T Water 100T Water Based FracsBased Fracs
SPEDL Series
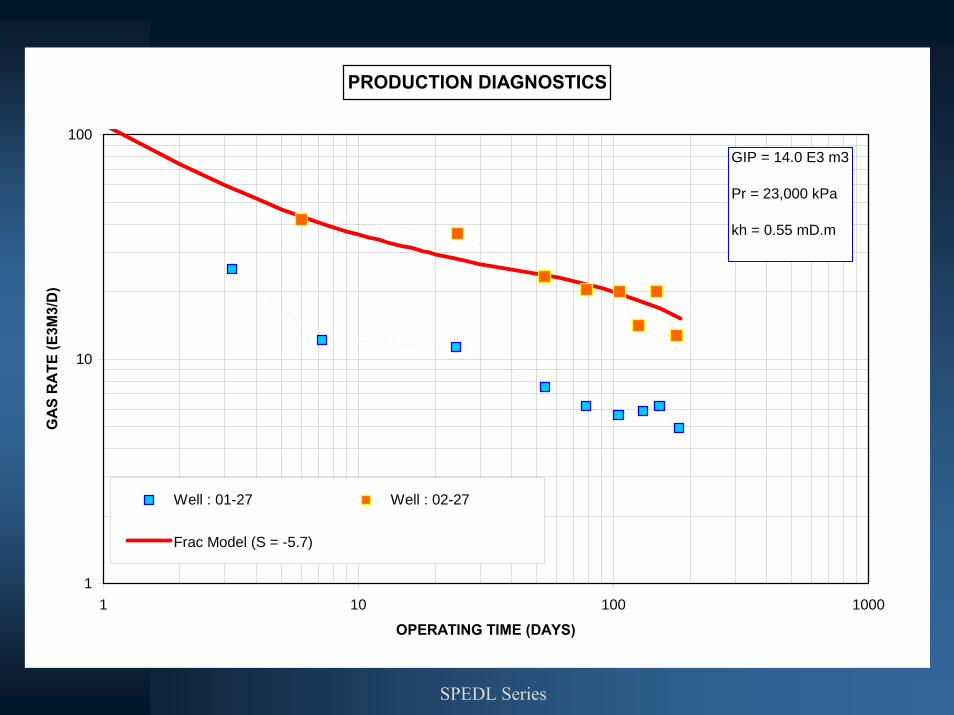
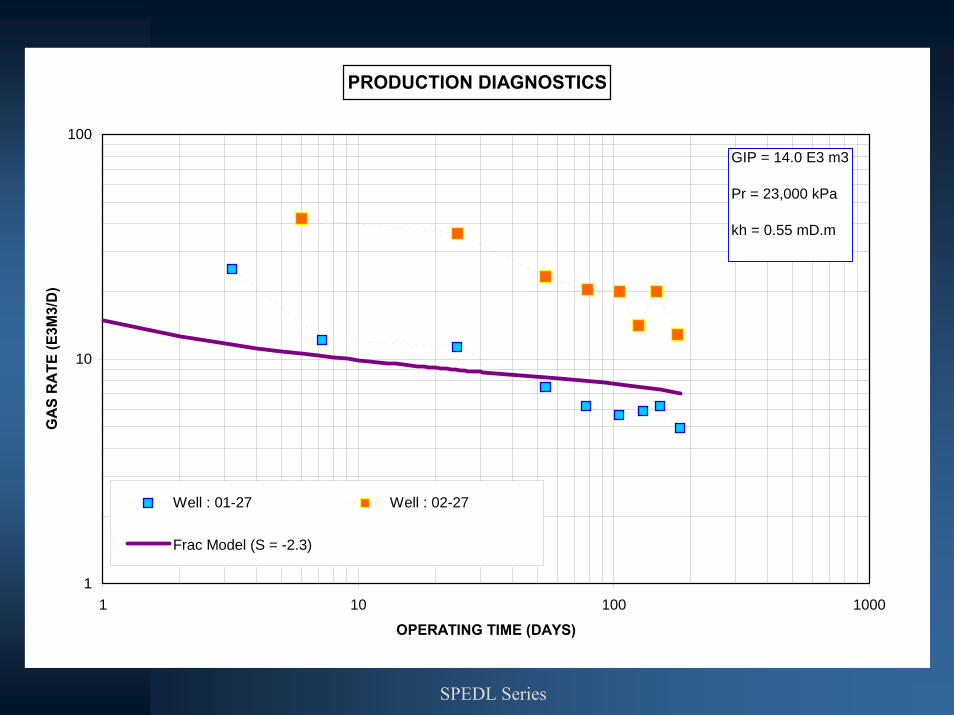
PRODUCTION DIAGNOSTICS
1
10
100
1 10 100 1000
OPERATING TIME (DAYS)
GA
S R
ATE
(E3M
3/D
)
Well : 01-27 Well : 02-27
Frac Model (S = -5.7)
GIP = 14.0 E3 m3
Pr = 23,000 kPa
kh = 0.55 mD.m
SPEDL Series
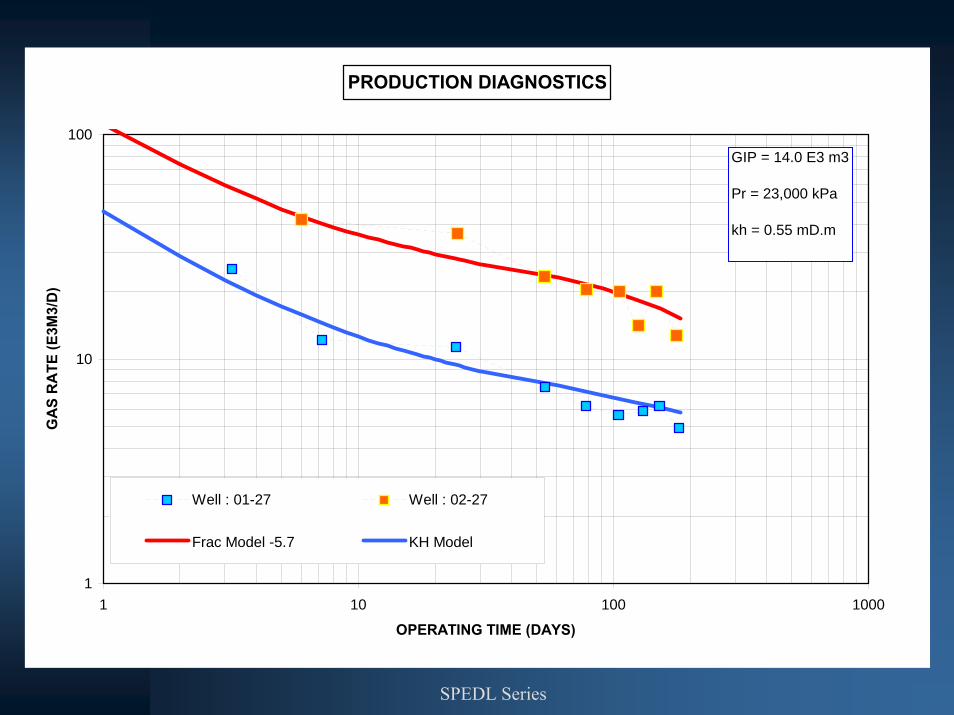
PRODUCTION DIAGNOSTICS
1
10
100
1 10 100 1000
OPERATING TIME (DAYS)
GA
S R
ATE
(E3M
3/D
)
Well : 01-27 Well : 02-27
Frac Model (S = -2.3)
GIP = 14.0 E3 m3
Pr = 23,000 kPa
kh = 0.55 mD.m
SPEDL Series
PRODUCTION DIAGNOSTICS
1
10
100
1 10 100 1000
OPERATING TIME (DAYS)
GA
S R
ATE
(E3M
3/D
)
Well : 01-27 Well : 02-27
Frac Model -5.7 KH Model
GIP = 14.0 E3 m3
Pr = 23,000 kPa
kh = 0.55 mD.m
SPEDL Series
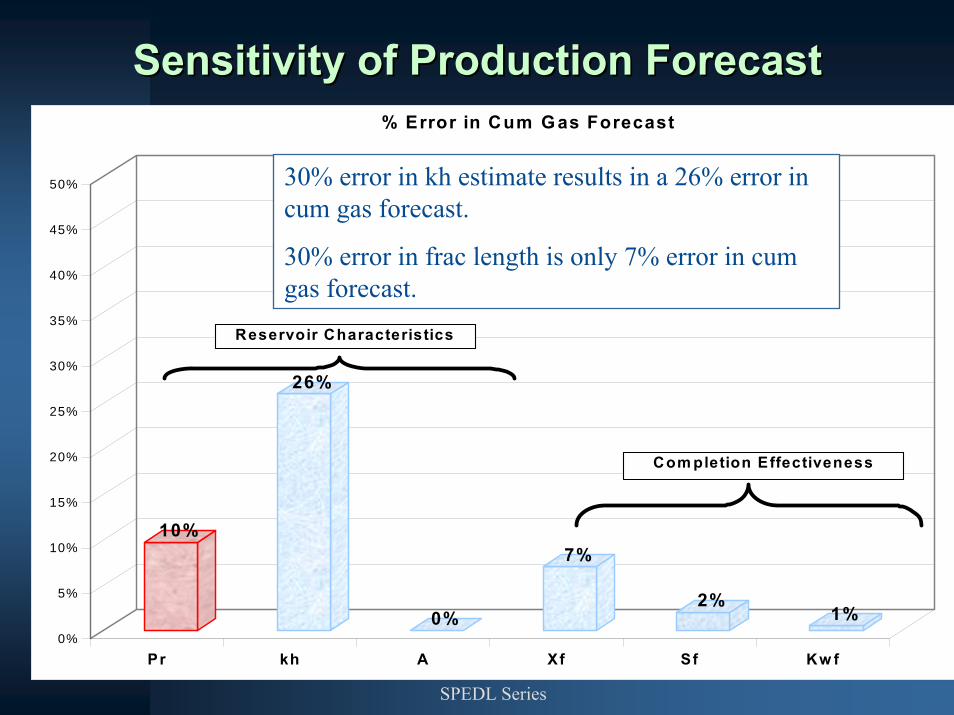
Sensitivity of Production ForecastSensitivity of Production Forecast
10%
26%
0%
7%
2%1%
0%
5%
10%
15%
20%
25%
30%
35%
40%
45%
50%
Pr kh A Xf Sf Kw f
% Error in Cum G as Forecast
30% error in param eters5% error in reservoir pressure
Com pletion Effectiveness
Reservoir Characteristics
30% error in kh estimate results in a 26% error in cum gas forecast.
30% error in frac length is only 7% error in cum gas forecast.
SPEDL Series
))()(/()
43(ln1422
wfavg
w
epmpmq
srrT
khJ −=+−
=
[ ][ ] [ ]qb
ssq
a
ba ×
++
=88
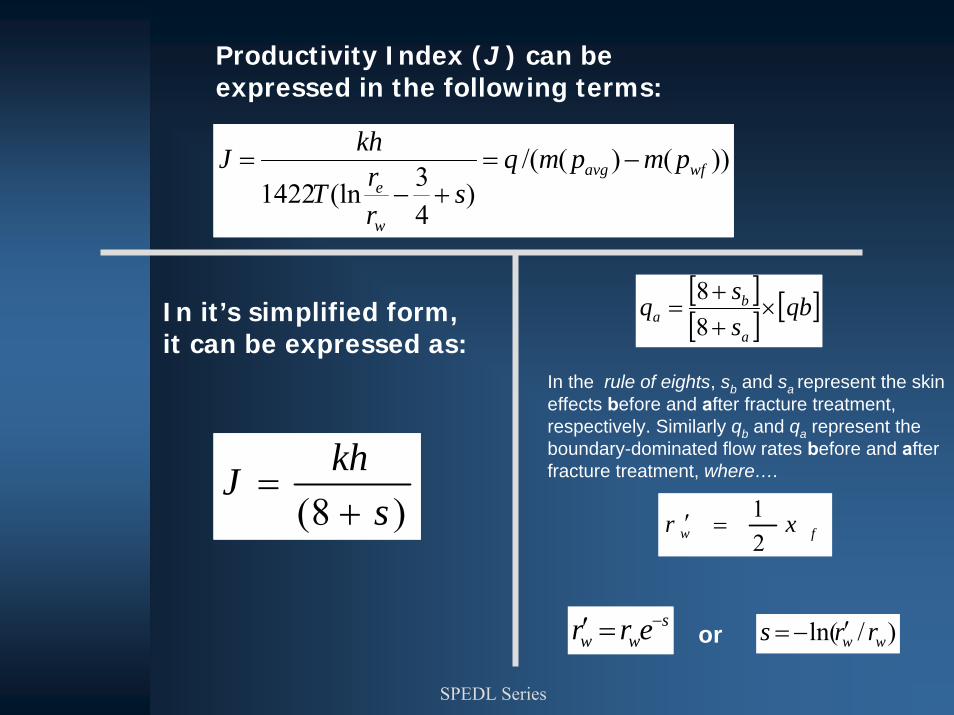
In the rule of eights, sb and sa represent the skin effects before and after fracture treatment, respectively. Similarly qb and qa represent the boundary-dominated flow rates before and after fracture treatment, where….
fw xr21
=′
sww err −=′ )/ln( ww rrs ′−=or
)8( skhJ+
=
Productivity Index (J ) can be expressed in the following terms:
In it’s simplified form, it can be expressed as:
SPEDL Series
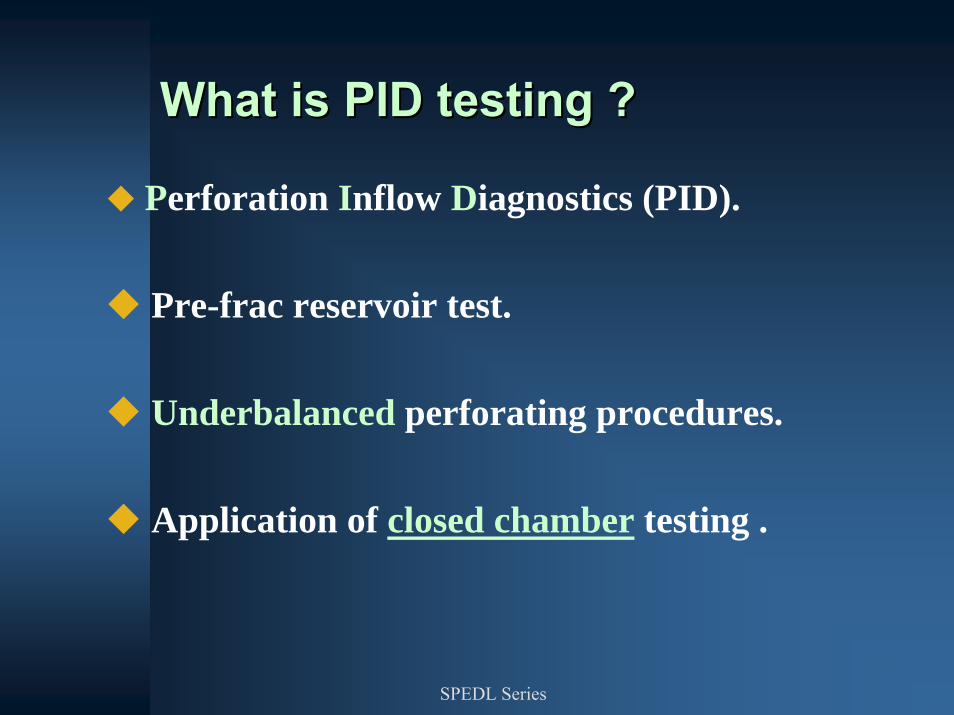
What is PID testing ?What is PID testing ?
Perforation Inflow Diagnostics (PID).
Pre-frac reservoir test.
Underbalanced perforating procedures.
Application of closed chamber testing .

SPEDL Series
3 Month Window for3 Month Window forDrilling and Completions in CanadaDrilling and Completions in Canada
December 30th
March 30th
SPEDL Series
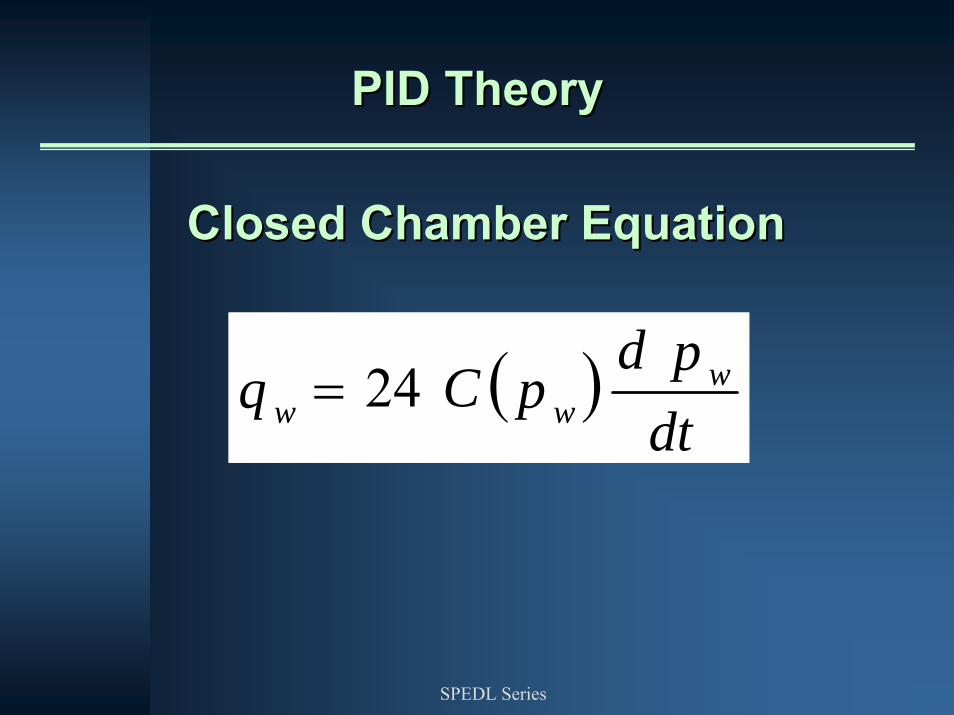
PID Theory PID Theory
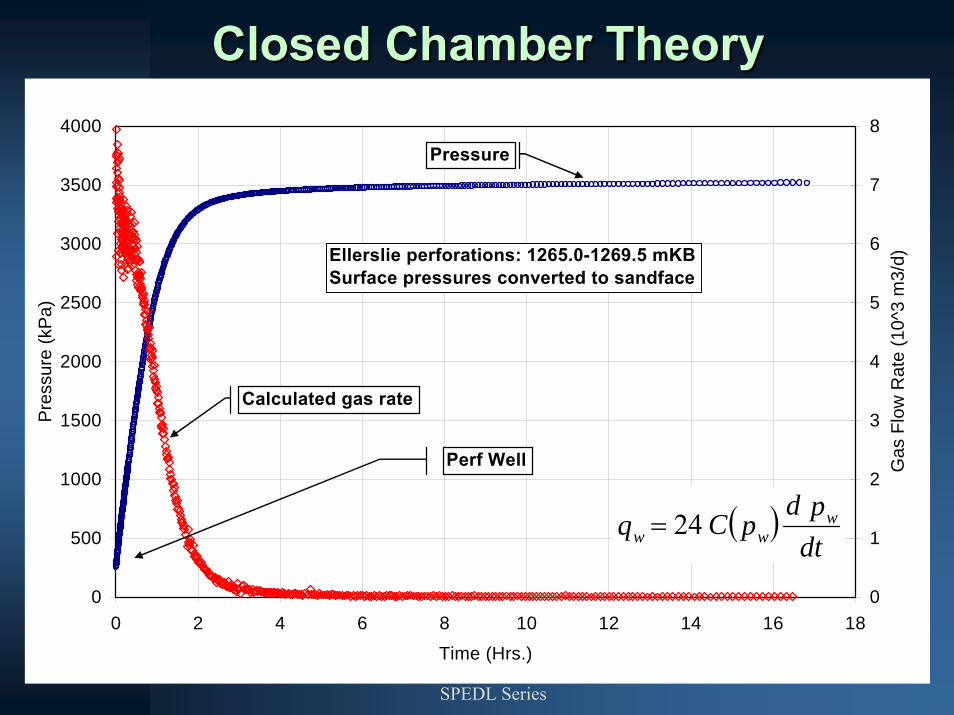
Closed Chamber EquationClosed Chamber Equation
( )dtpd
pCq www 24=
SPEDL Series
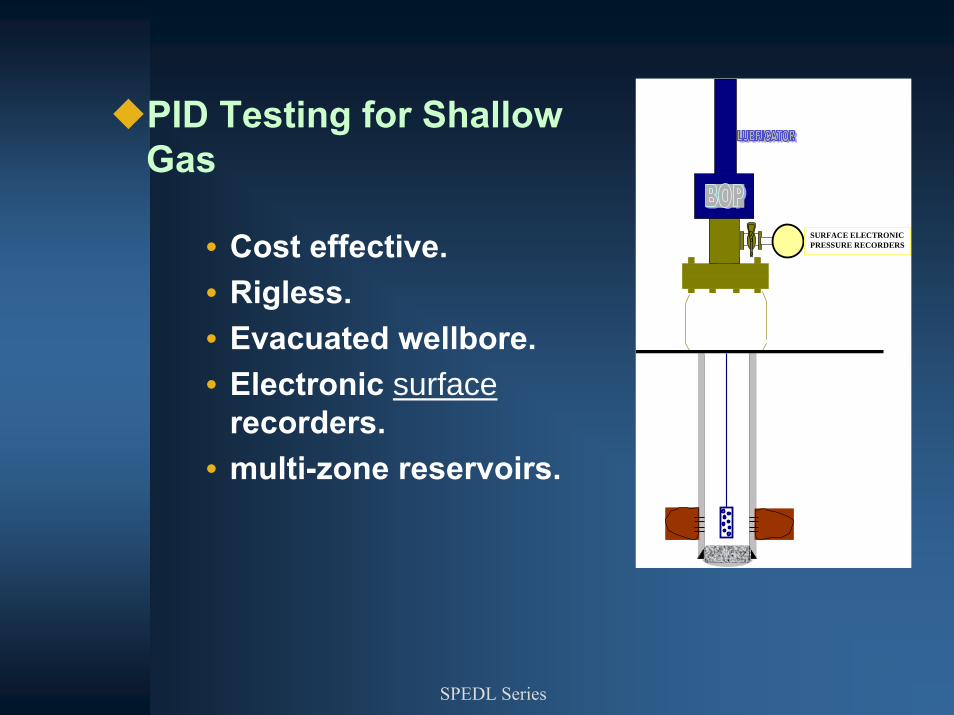
PID Testing for Shallow Gas
• Cost effective.• Rigless.• Evacuated wellbore.• Electronic surface
recorders.• multi-zone reservoirs.
SURFACE ELECTRONICPRESSURE RECORDERS
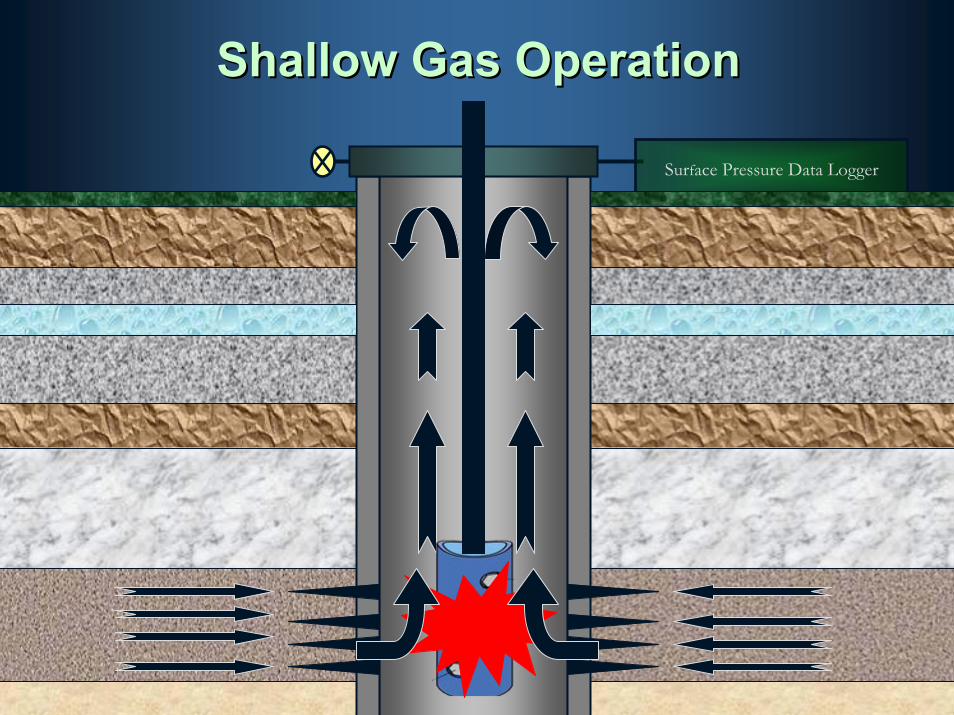
Surface Pressure Data Logger
Shallow Gas Operation Shallow Gas Operation
SPEDL Series
0
500
1000
1500
2000
2500
3000
3500
4000
0 2 4 6 8 10 12 14 16 18
Time (Hrs.)
Pre
ssur
e (k
Pa)
0
1
2
3
4
5
6
7
8
Gas
Flo
w R
ate
(10^
3 m
3/d)Ellerslie perforations: 1265.0-1269.5 mKB
Surface pressures converted to sandface
Perf Well
Calculated gas rate
Pressure
( )dtpd
pCq www 24=
Closed Chamber TheoryClosed Chamber Theory
SPEDL Series
0.0001
0.001
0.01
0.1
1
10
0.0001 0.001 0.01 0.1 1 10 100
Pseudo Time
Pseu
do P
ress
ure
and
Der
ivat
ive
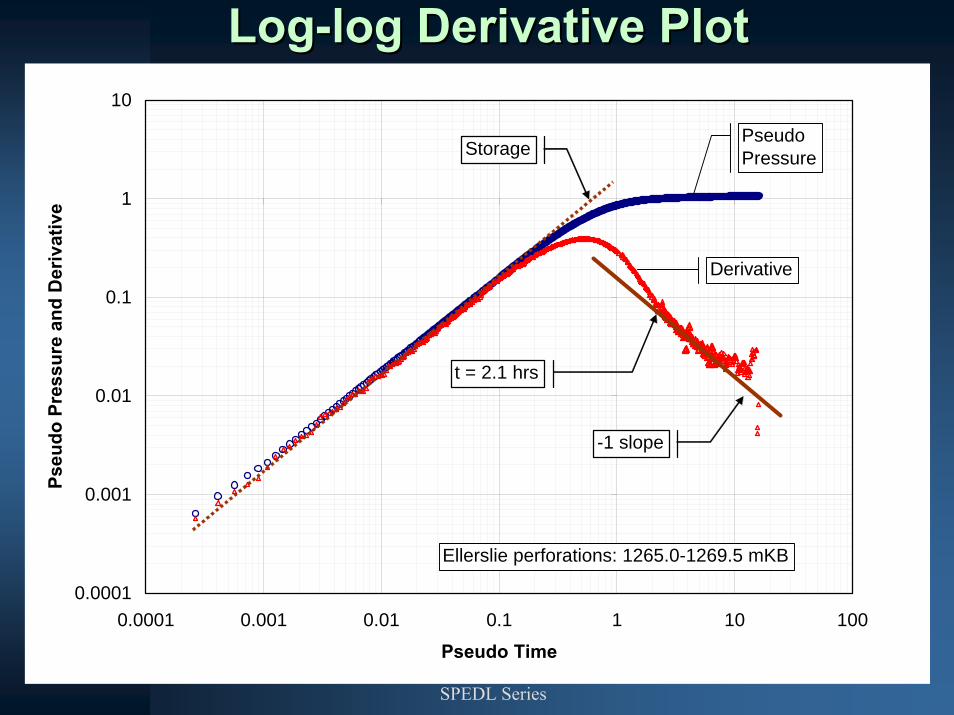
Ellerslie perforations: 1265.0-1269.5 mKB
-1 slope
StoragePseudo Pressure
Derivative
t = 2.1 hrs
LogLog--log Derivative Plotlog Derivative Plot
SPEDL Series
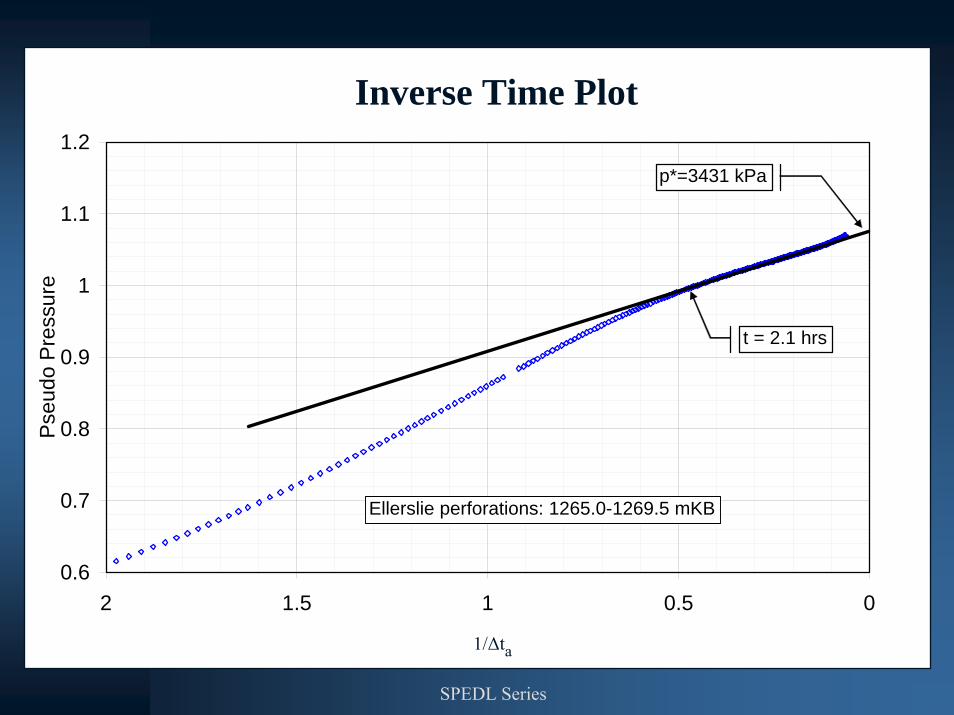
Inverse Time Plot
0.6
0.7
0.8
0.9
1
1.1
1.2
00.511.52Inverse Pseudo Time
Pse
udo
Pre
ssur
e
Ellerslie perforations: 1265.0-1269.5 mKB
p*=3431 kPa
t = 2.1 hrs
Inverse Time Plot
1/Δta
SPEDL Series
1700
1900
2100
2300
2500
2700
2900
3100
3300
3500
0.00 0.05 0.10 0.15 0.20 0.25 0.30 0.35 0.40
Rate Conv. Fn.
p(pn
) (kP
a)
S = .5S = 3S = 5.5Slope
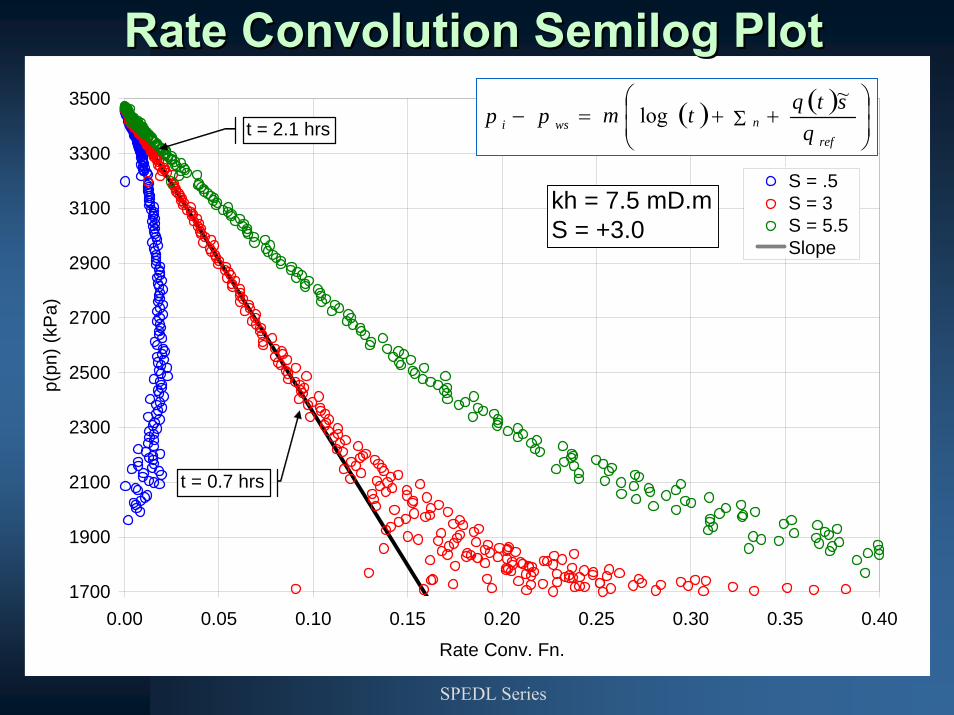
Ellerslie perforations: 1265.0-1269.5 mKB
kh = 7.5 mD.mS = +3.0
t = 2.1 hrs
t = 0.7 hrs
( ) ( )⎟⎟⎠
⎞⎜⎜⎝
⎛+Σ+=−
qstqtmpp
refnwsi
~log
Rate Convolution Semilog PlotRate Convolution Semilog Plot
SPEDL Series
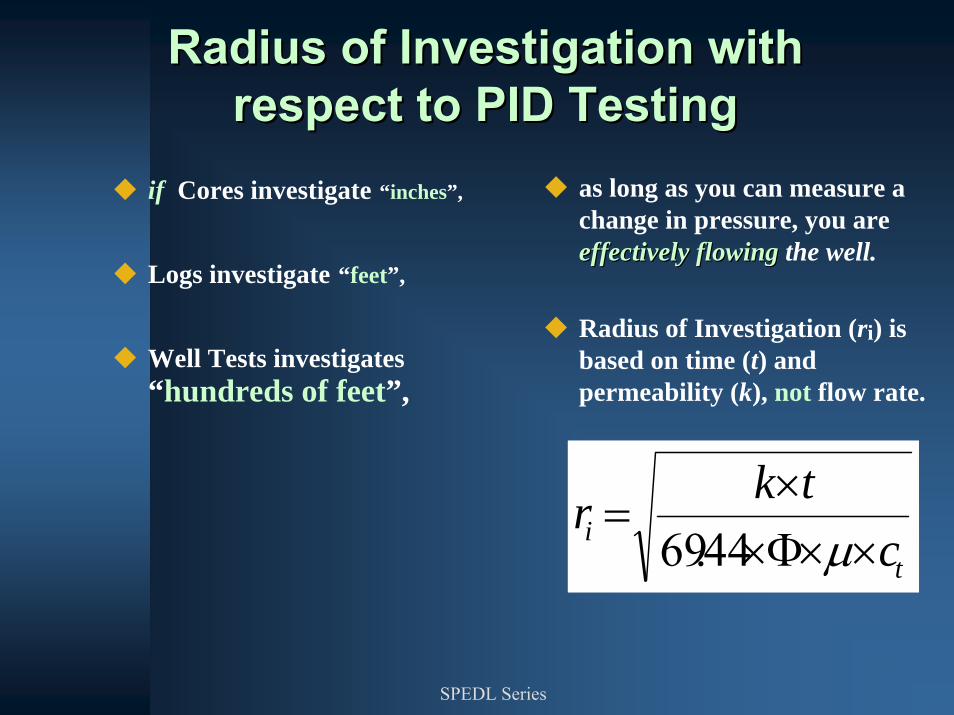
Radius of Investigation with Radius of Investigation with respect to PID Testingrespect to PID Testing
if Cores investigate “inches”,
Logs investigate “feet”,
Well Tests investigates“hundreds of feet”,
as long as you can measure a change in pressure, you areeffectivelyeffectively flowingflowing the well.
Radius of Investigation (ri) is based on time (t) and permeability (k), not flow rate.
ti c
tkr××Φ×
×=
μ44.69
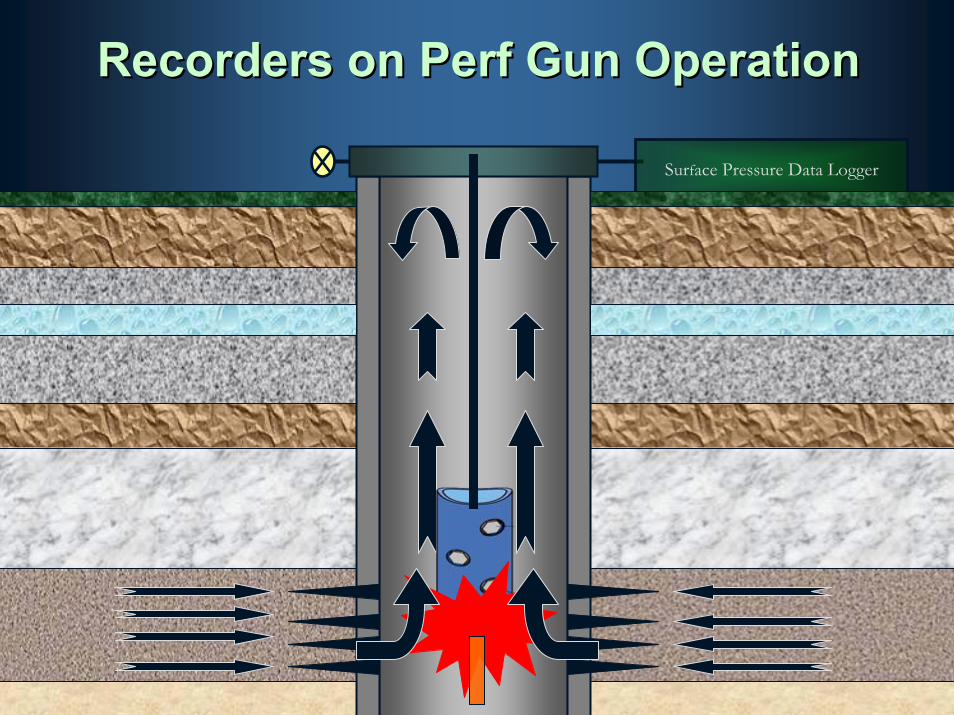
Surface Pressure Data Logger
Recorders on Recorders on PerfPerf Gun Operation Gun Operation
SPEDL Series
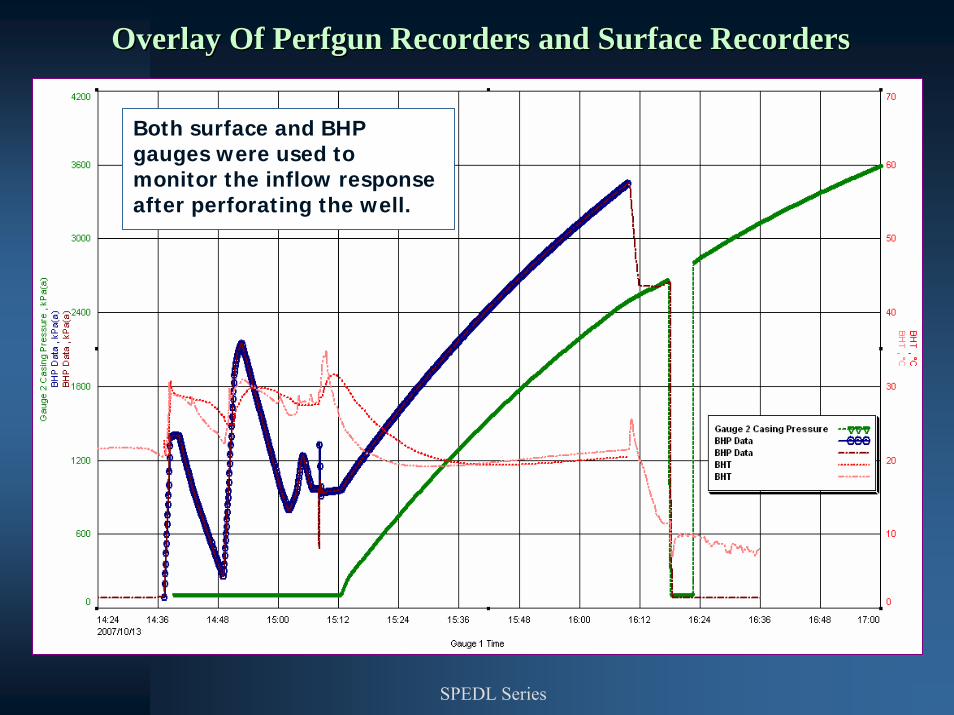
Overlay Of Overlay Of PerfgunPerfgun Recorders and Surface RecordersRecorders and Surface Recorders
Both surface and BHP gauges were used to monitor the inflow response after perforating the well.
SPEDL Series
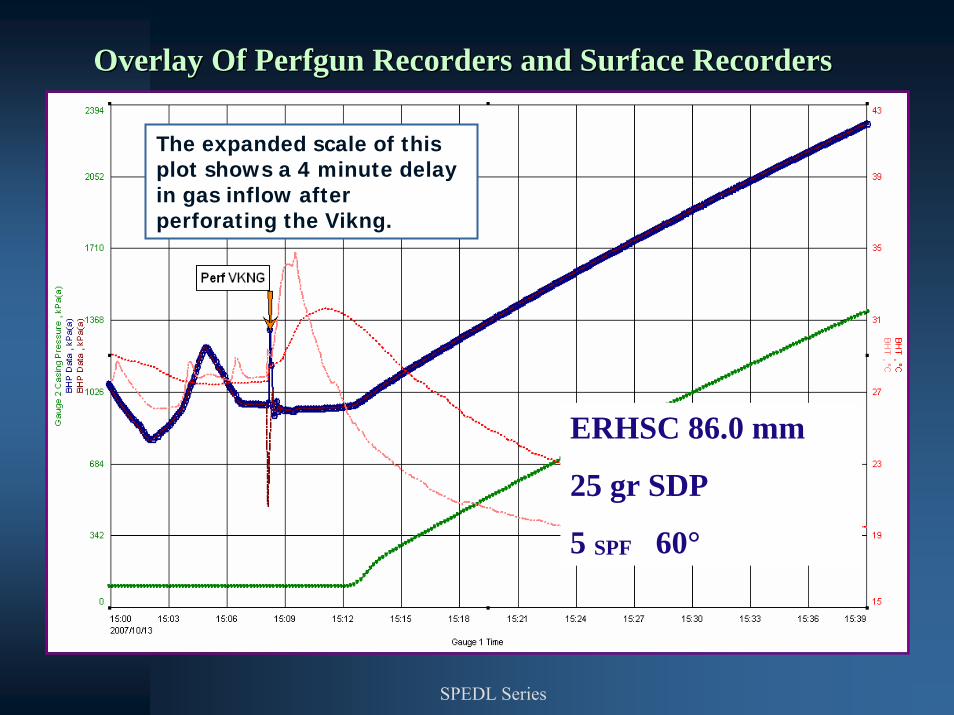
Overlay Of Overlay Of PerfgunPerfgun Recorders and Surface RecordersRecorders and Surface Recorders
The expanded scale of this plot shows a 4 minute delay in gas inflow after perforating the Vikng.
ERHSC 86.0 mm
25 gr SDP
5 SPF 60°
SPEDL Series
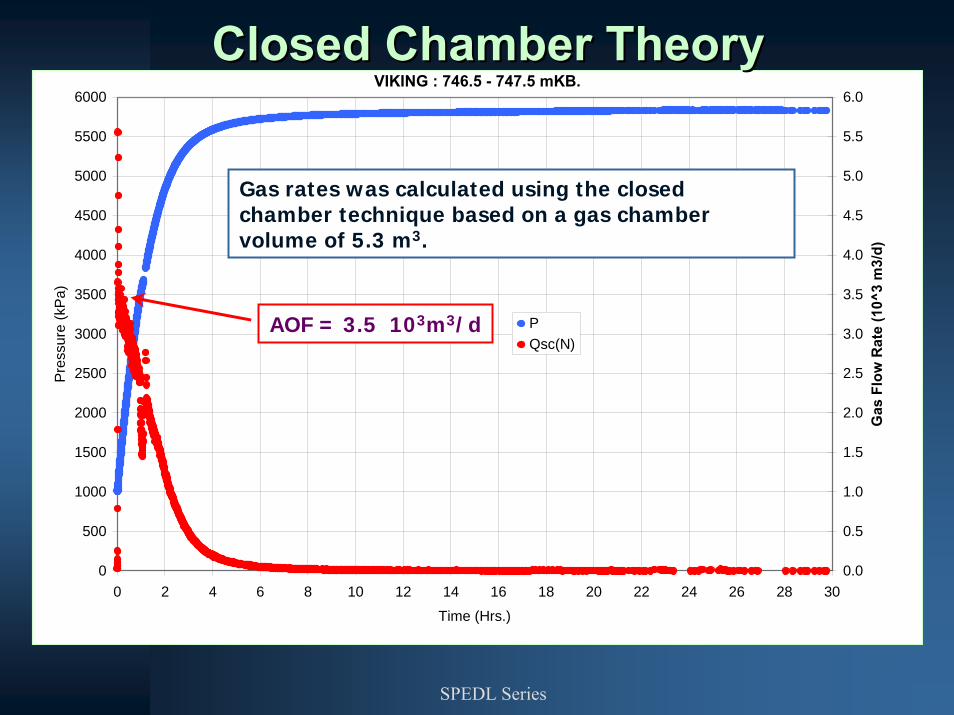
VIKING : 746.5 - 747.5 mKB.
0
500
1000
1500
2000
2500
3000
3500
4000
4500
5000
5500
6000
0 2 4 6 8 10 12 14 16 18 20 22 24 26 28 30
Time (Hrs.)
Pres
sure
(kP
a)
0.0
0.5
1.0
1.5
2.0
2.5
3.0
3.5
4.0
4.5
5.0
5.5
6.0
Gas
Flo
w R
ate
(10^
3 m
3/d)
PQsc(N)
AOF = 3.5 103m3/d
Gas rates was calculated using the closed chamber technique based on a gas chamber volume of 5.3 m3.
Closed Chamber TheoryClosed Chamber Theory
SPEDL Series
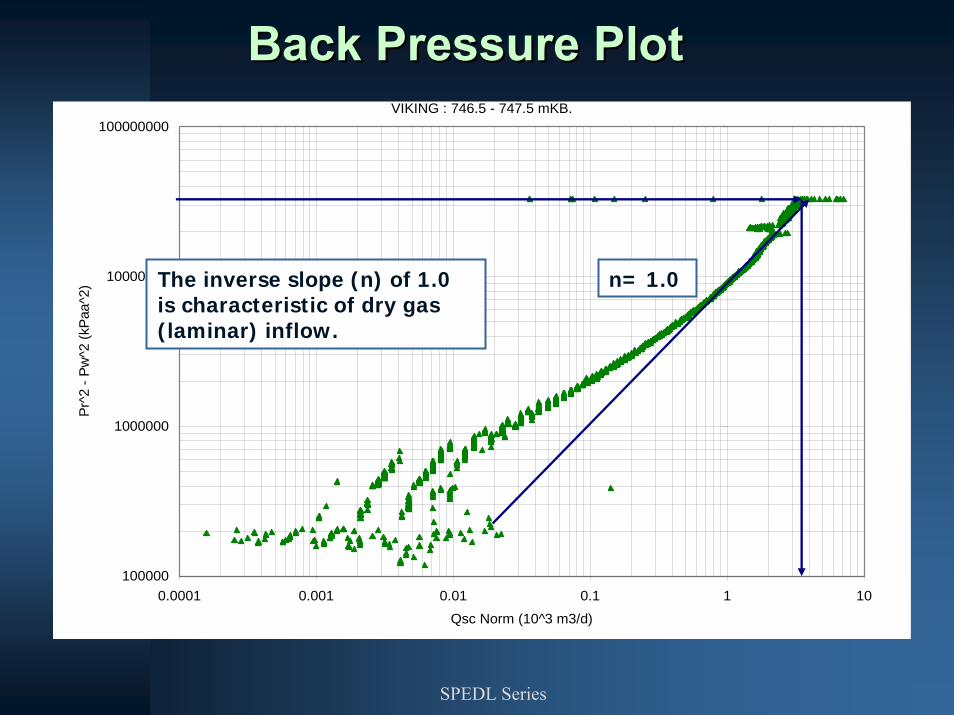
VIKING : 746.5 - 747.5 mKB.
100000
1000000
10000000
100000000
0.0001 0.001 0.01 0.1 1 10
Qsc Norm (10^3 m3/d)
Pr^2
- Pw
^2 (k
Paa
^2) The inverse slope (n) of 1.0
is characteristic of dry gas (laminar) inflow.
n= 1.0
Back Pressure PlotBack Pressure Plot
SPEDL Series
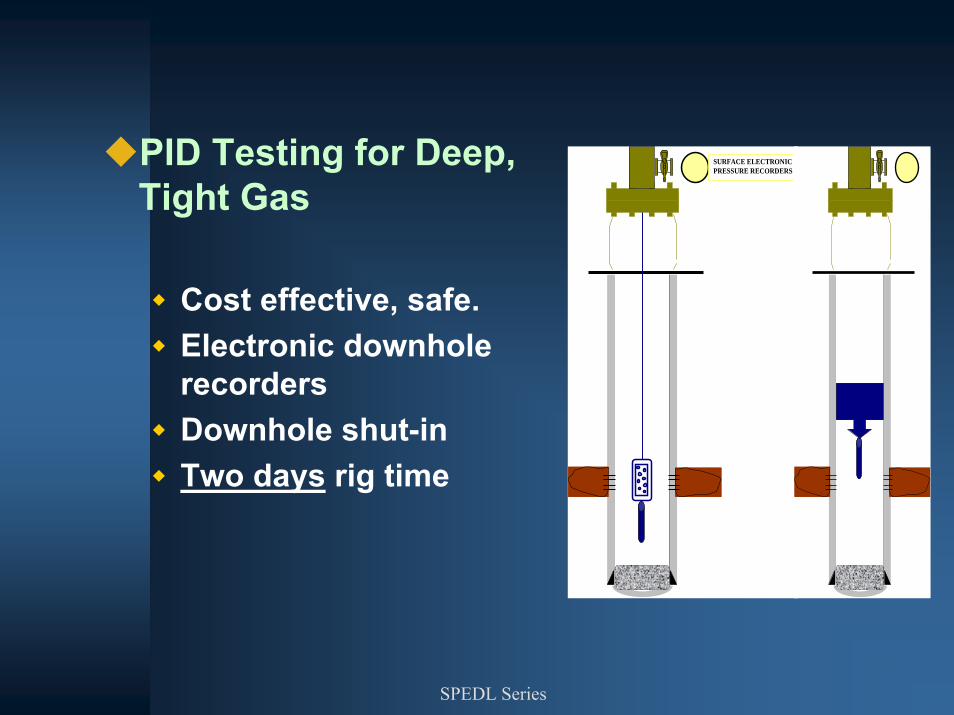
PID Testing for Deep, Tight Gas
Cost effective, safe.Electronic downhole recordersDownhole shut-inTwo days rig time
SURFACE ELECTRONICPRESSURE RECORDERS
SPEDL Series
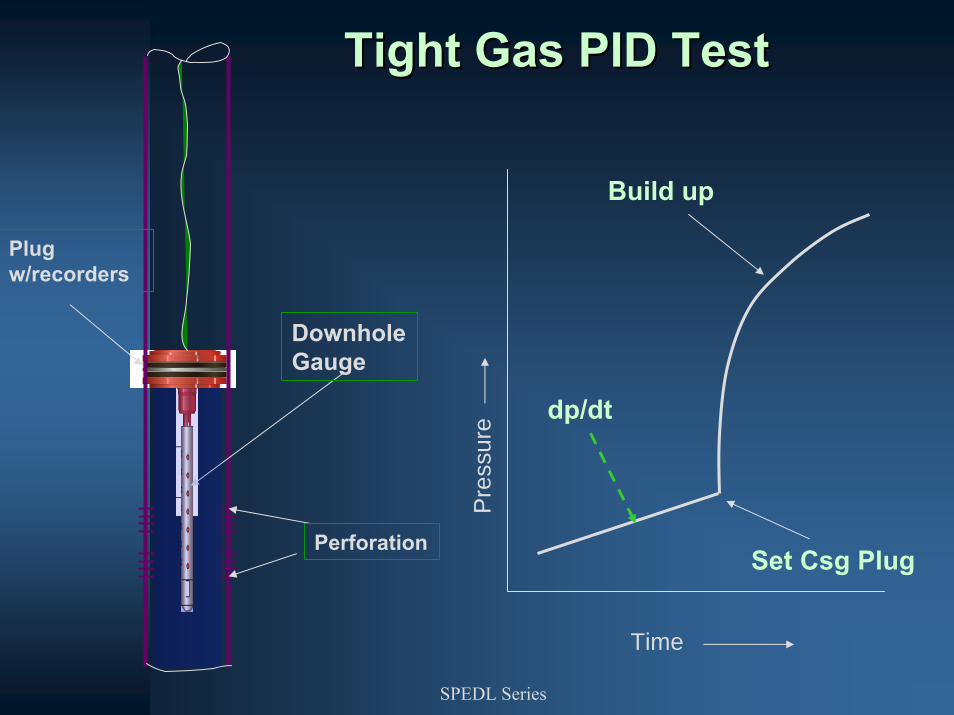
Downhole Gauge
Plug w/recorders
dp/dt
Build up
Set Csg Plug
Tight Gas PID TestTight Gas PID Test
Time
Pre
ssur
e
Perforation
SPEDL Series
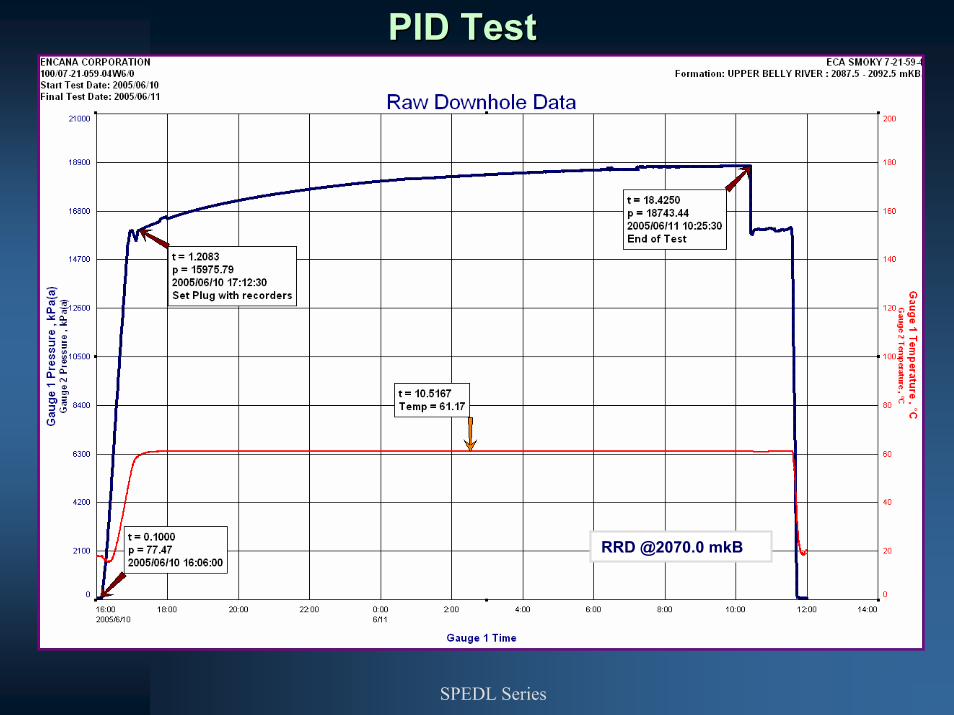
RRD @2070.0 mkB
PID TestPID Test
SPEDL Series
10-3 10-2 10-1 1.0 101 1022 3 4 5 6 7 8 2 3 4 5 6 7 8 2 3 4 5 6 7 8 2 3 4 5 6 7 8 2 3 4 5 6 7 8
Δta , h
10-2
10-1
1.0
101
2
3
45
79
2
3
45
79
2
3
45
79
Δψ
/ De
rivat
ive
, 106
kPa2
/μPa
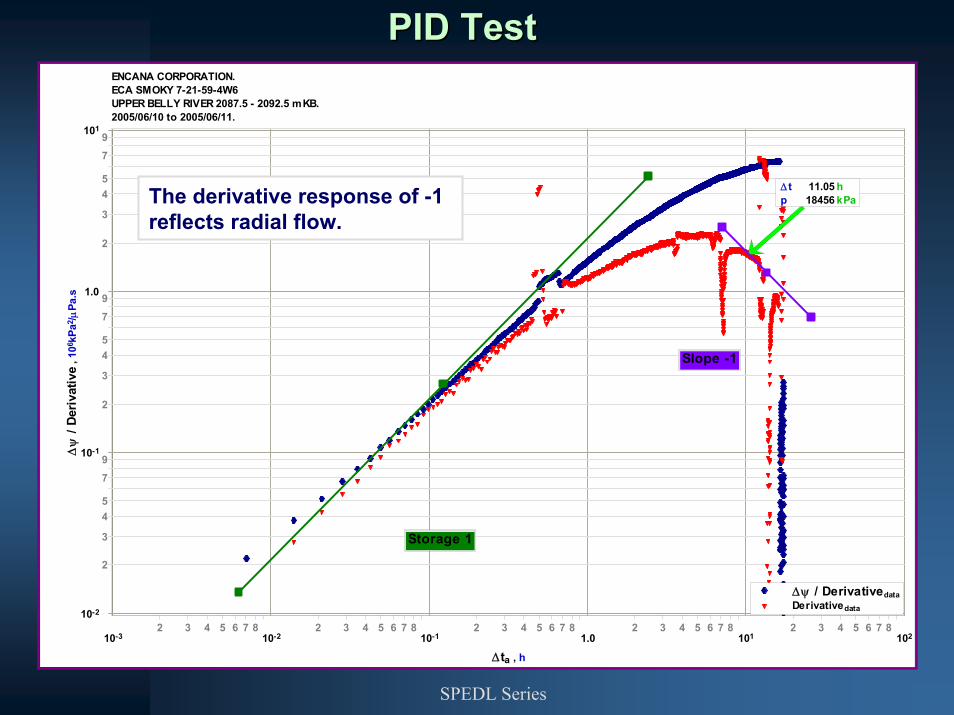
.sENCANA CORPORATION. ECA SMOKY 7-21-59-4W6 UPPER BELLY RIVER 2087.5 - 2092.5 mKB. 2005/06/10 to 2005/06/11.
Δψ / DerivativedataDerivativedata
Storage 1
Slope -1
Δ t 11.05 hp 18456 kPaThe derivative response of -1
reflects radial flow.
PID TestPID Test
SPEDL Series
0.000.020.040.060.080.100.120.140.160.180.200.220.240.260.280.300.320.340.360.380.400.420.440.460.480.500.520.540.56
1 / Δta , hr-1
20.00
20.50
21.00
21.50
22.00
22.50
23.00
23.50
24.00
24.50
25.00
25.50
26.00
26.50
27.00
27.50
28.00
28.50
29.00
ψ, 1
06kP
a2/μ
Pa.
s
15800
16000
16200
16400
16600
16800
17000
17200
17400
17600
17800
18000
18200
18400
18600
18800
19000
19200
19400
19600
p , kPa
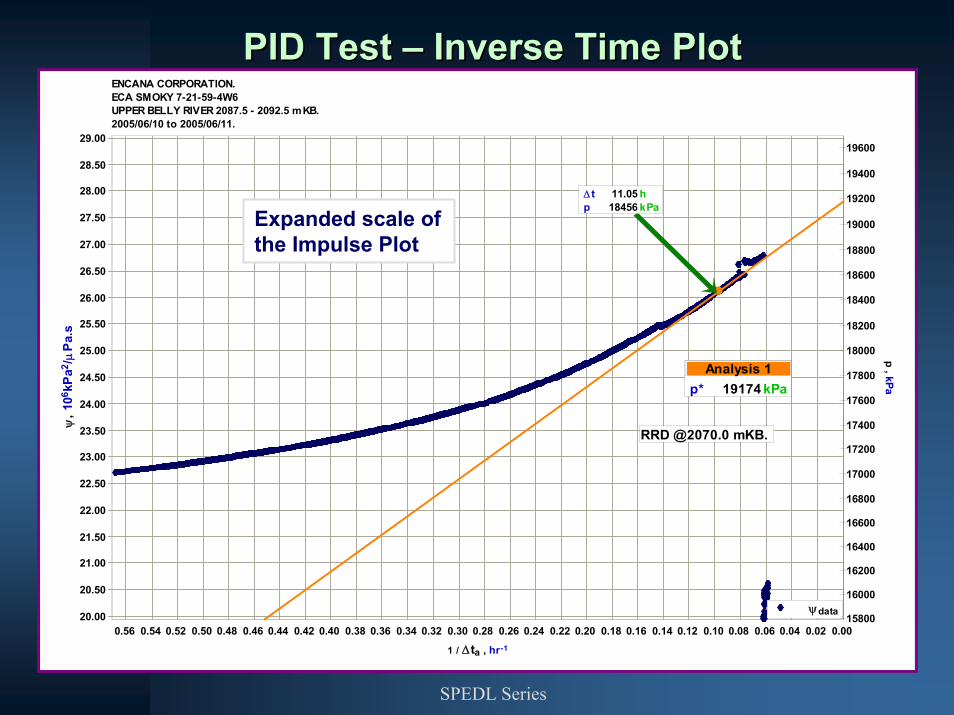
ENCANA CORPORATION. ECA SMOKY 7-21-59-4W6 UPPER BELLY RIVER 2087.5 - 2092.5 mKB. 2005/06/10 to 2005/06/11.
ψdata
Analysis 1p* 19174 kPa
Δ t 11.05 hp 18456 kPa
RRD @2070.0 mKB.
Expanded scale of the Impulse Plot
PID Test PID Test –– Inverse Time PlotInverse Time Plot
SPEDL Series
1011021032345678923456789234567823456789
Superposition Radial Pseudo-Time (ΣΔ ta), h
0
2
4
6
8
10
12
14
16
18
20
22
24
26
28
ψ, 1
06kP
a2/μ
Pa.s
0300040005000
6000
7000
8000
9000
10000
11000
12000
13000
14000
15000
16000
17000
18000
19000
p, kPa(a)
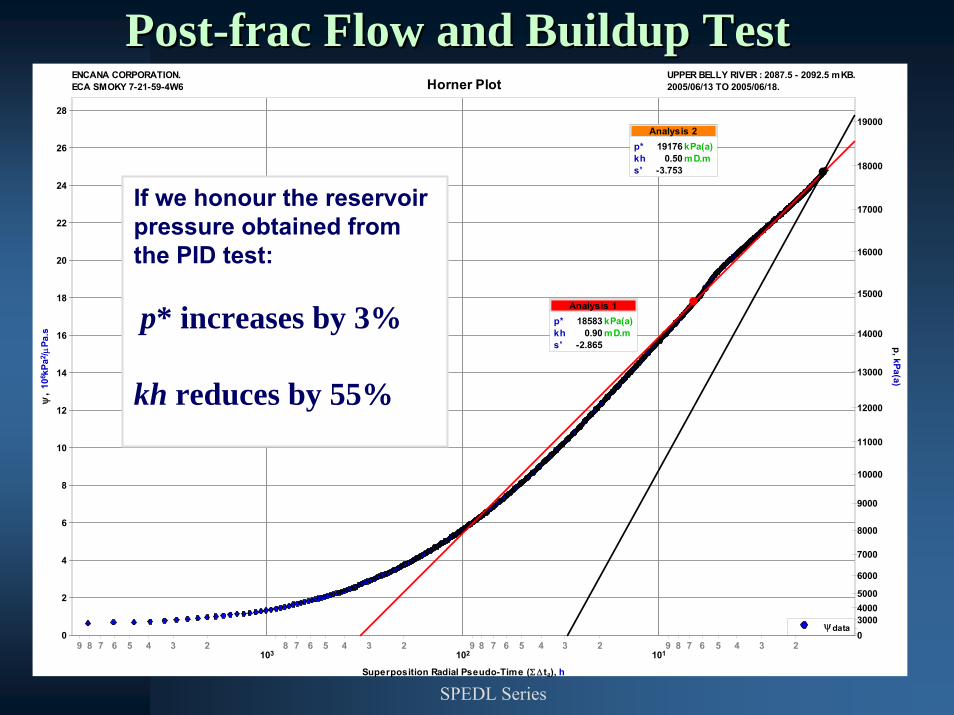
Horner PlotENCANA CORPORATION.ECA SMOKY 7-21-59-4W6
UPPER BELLY RIVER : 2087.5 - 2092.5 mKB.2005/06/13 TO 2005/06/18.
ψdata
Analysis 1p* 18583 kPa(a)kh 0.90 mD.ms' -2.865
Analysis 2p* 19176 kPa(a)kh 0.50 mD.ms' -3.753
If we honour the reservoir pressure obtained from the PID test:
p* increases by 3%
kh reduces by 55%
PostPost--frac Flow and Buildup Testfrac Flow and Buildup Test
SPEDL Series
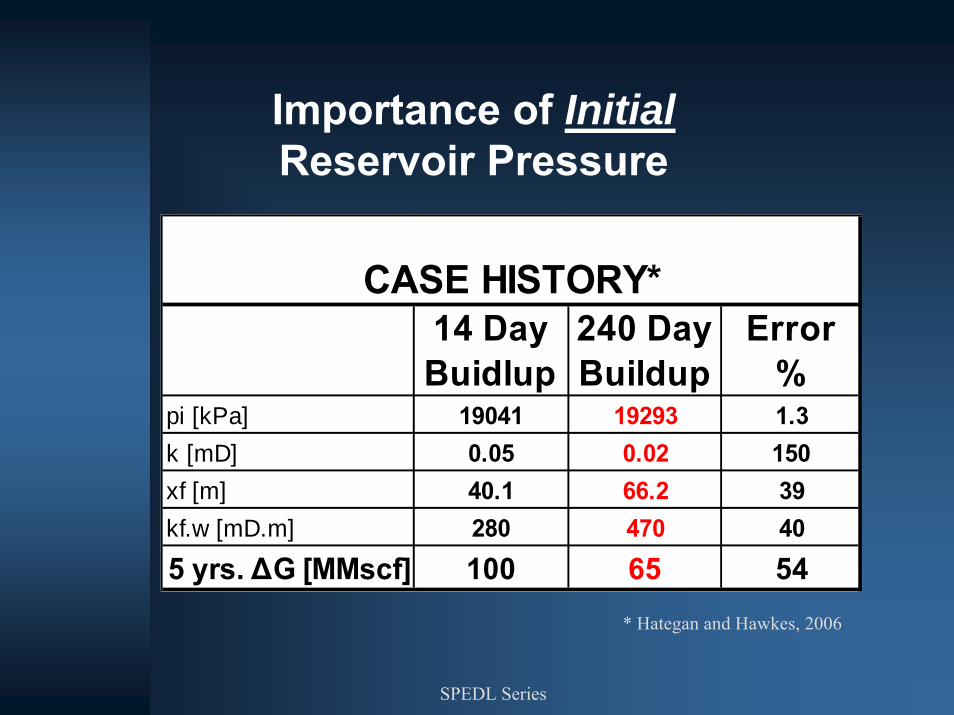
Importance of InitialReservoir Pressure
14 Day Buidlup
240 Day Buildup
Error %
pi [kPa] 19041 19293 1.3k [mD] 0.05 0.02 150xf [m] 40.1 66.2 39kf.w [mD.m] 280 470 40
5 yrs. ΔG [MMscf] 100 65 54
CASE HISTORY*
* Hategan and Hawkes, 2006
SPEDL Series
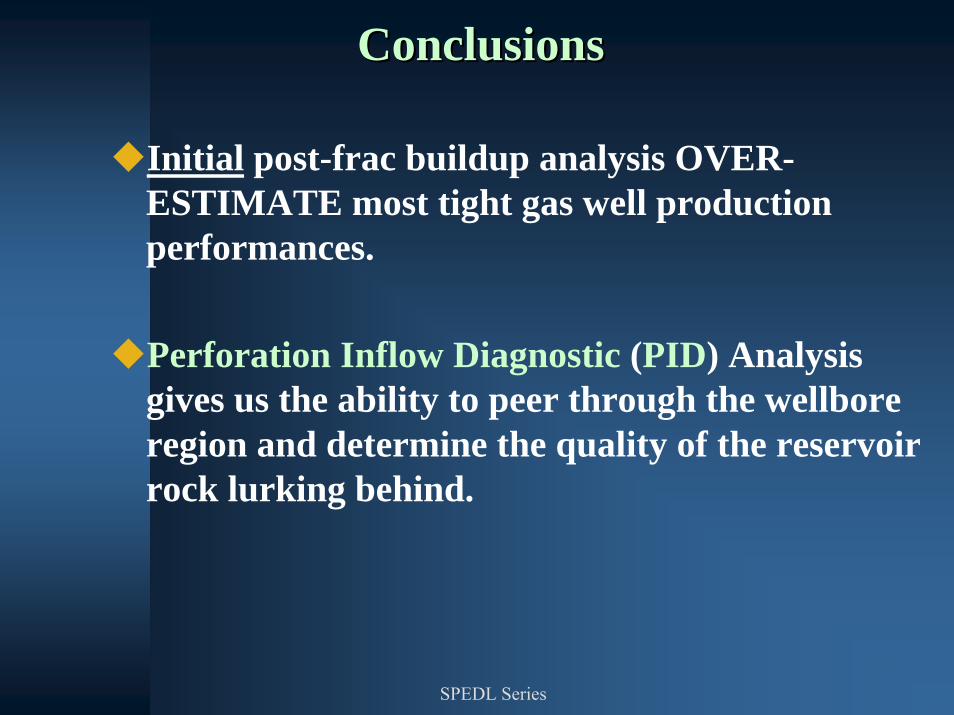
ConclusionsConclusions
Initial post-frac buildup analysis OVER-ESTIMATE most tight gas well production performances.
Perforation Inflow Diagnostic (PID) Analysis gives us the ability to peer through the wellbore region and determine the quality of the reservoir rock lurking behind.
SPEDL Series
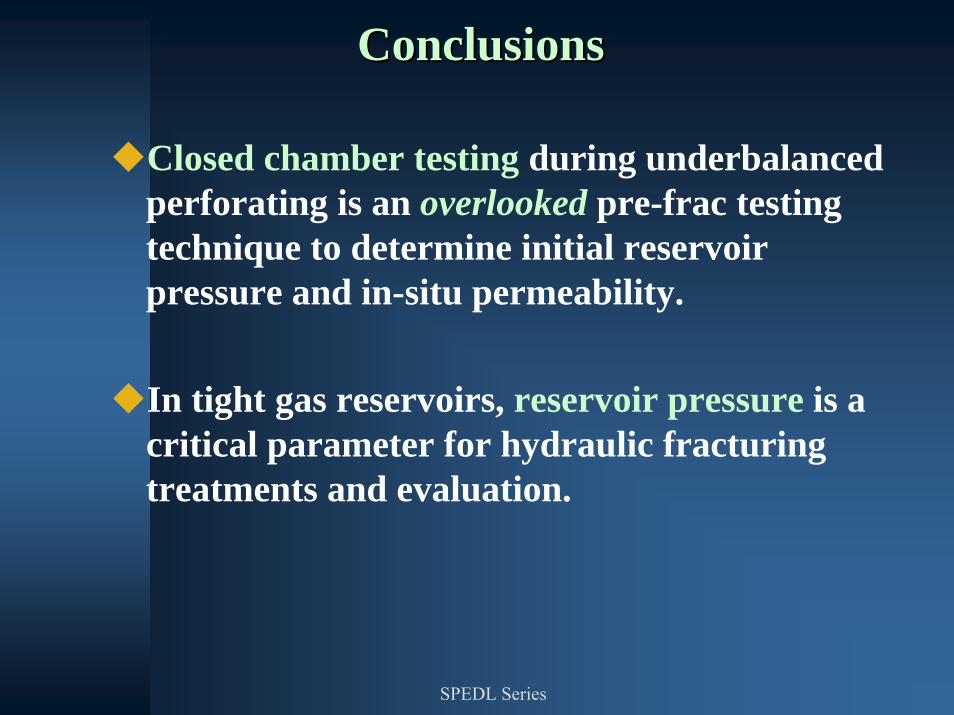
ConclusionsConclusions
Closed chamber testing during underbalanced perforating is an overlooked pre-frac testing technique to determine initial reservoir pressure and in-situ permeability.
In tight gas reservoirs, reservoir pressure is a critical parameter for hydraulic fracturing treatments and evaluation.
SPEDL Series
“It is a capital mistake to theorize before one has data. Insensibly one begins to twist facts to suit theories, instead of theories to suit facts”
Sherlock Holmes