Embed Size (px)
Citation preview
Authored by:Dirk BreitschwerdtAndreas CornetLukas MichorNicolai MüllerLionel Salmon
Advanced Industries March 2016
Performance and disruption – A perspective on the automotive supplier landscape and major technology trends


3Performance and disruption
Contents
Executive summary 5
Suppliers rebound strongly after the crisis 8
Five trends transforming the supplier industry 16
Answering tomorrow’s questions 26

5Executive summary
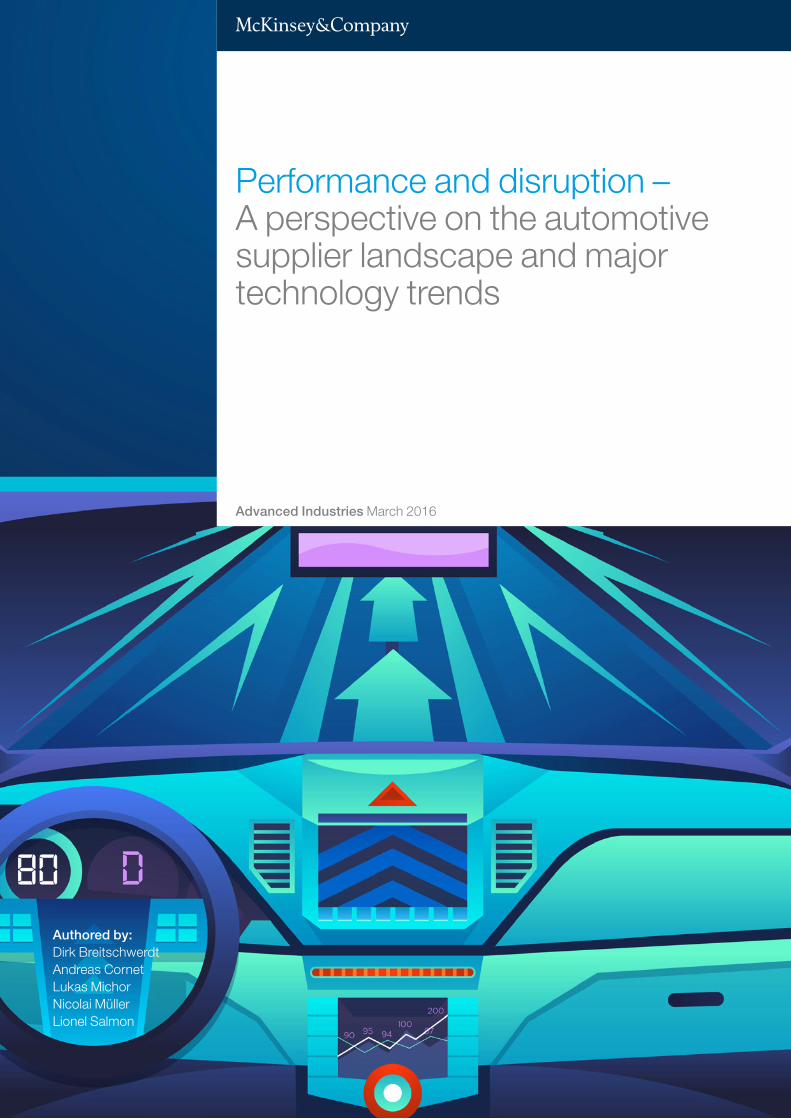
Executive summary
After rebounding strongly from the 2008 economic crisis, the automotive supplier industry continues to be a growth engine for the global economy. McKinsey research into the per-formance of the global top 100 automotive suppliers reveals that automotive suppliers have reached the highest profitability level of the last decade with average profits of almost 7 per-cent in 2013 and 2014.
The crisis significantly reshaped the supplier industry: in 2004, the top 100 companies delivered roughly 36 percent of industry revenues – a decade later, they controlled half of all sales. This high level of consolidation suggests two future industry models: mega suppliers with superior scale and reach or high-value niche players. The industry has also reshaped itself geographically, largely due to Asia’s new dominance as a car market (disregarding the recent slowdown in China), a change illustrated by the dominance of Asian companies on the current top 100 global supplier list.
The aftermath of the global economic crisis proved automotive suppliers’ ability to survive a setback and come back stronger than ever, but a number of new challenges will further test the industry’s mettle. New technologies present promising opportunities and threaten the status quo at the same time. The biggest disruptors are in the areas of vehicle electrification, in-car connectivity, autonomous driving, advanced manufacturing, and the introduction of advanced materials in the vehicle platform.
These trends will affect suppliers along seven dimensions: the battle for talent, the portfo-lio optimization challenge, the battle for new profit pools, the entrance of new players with long-term plans, the shift in successful business building, the introduction of Industry 4.0 approaches to the production process, and the race for attractive M&A targets. Company leaders will need to analyze the impact in each of these areas and integrate it into their strategic plans. Regarding talent, for example, leaders need to ask themselves if they have access to a pool of professionals who can help them take advantage of the opportunities presented by new technologies.
Automotive suppliers are on solid footing following the global economic crisis, but the future of the industry remains uncertain. As disruptive new technologies enter the vehicle prod-uct mix and innovative, resourceful attackers invade the value chain, competitive intensity will grow. This new set of challenges will require unique responses from suppliers as they maneuver across a transformed automotive landscape.
6 Acknowledgements
Acknowledgements
This study was conducted by McKinsey & Company, Inc. We wish to express our apprecia-tion and gratitude to the European Association of Automotive Suppliers (CLEPA1) and its members for their continued support and valuable contributions. In particular, we would like to thank Paul Schockmel, CEO of CLEPA, for his commitment.
The authors would like to thank the following CLEPA members for their contributions:
Klaus Bräunig (VDA) Dr. Rolf Bulander (Bosch) Axel Maschka (Valeo) Jose Morente (Delphi) Thorsten Muschal (Faurecia) Prof. Dr. Peter Pleus (Schaeffler) Andrew Reynolds Smith (GKN) Giuseppe Rosso (Magneti Marelli) Paul Schockmel (CLEPA) Dr. Reiner Spatke (JCI) Marco Stella (Anfia, Tubi Style) Roberto Vavassori (Brembo)
They also express their sincere gratitude to the entire team:
Julia Gehrig Martin Hattrup-Silberberg Thomas Kasper Mira Menz Dr. Daniel Neumann Kevin Rebbereh
1 Founded in 1959 and based in Brussels, CLEPA (Comité de liaison européen des fabricants d’équipements et de pièces automobiles) members include more than 100 of the world’s most prominent suppliers for car parts, systems, and modules along with national trade associations and European sector associations.

7Acknowledgements
8 Performance and disruption
SUPPLIERS REBOUND STRONGLY AFTER THE CRISIS1
9Suppliers rebound strongly after the crisis
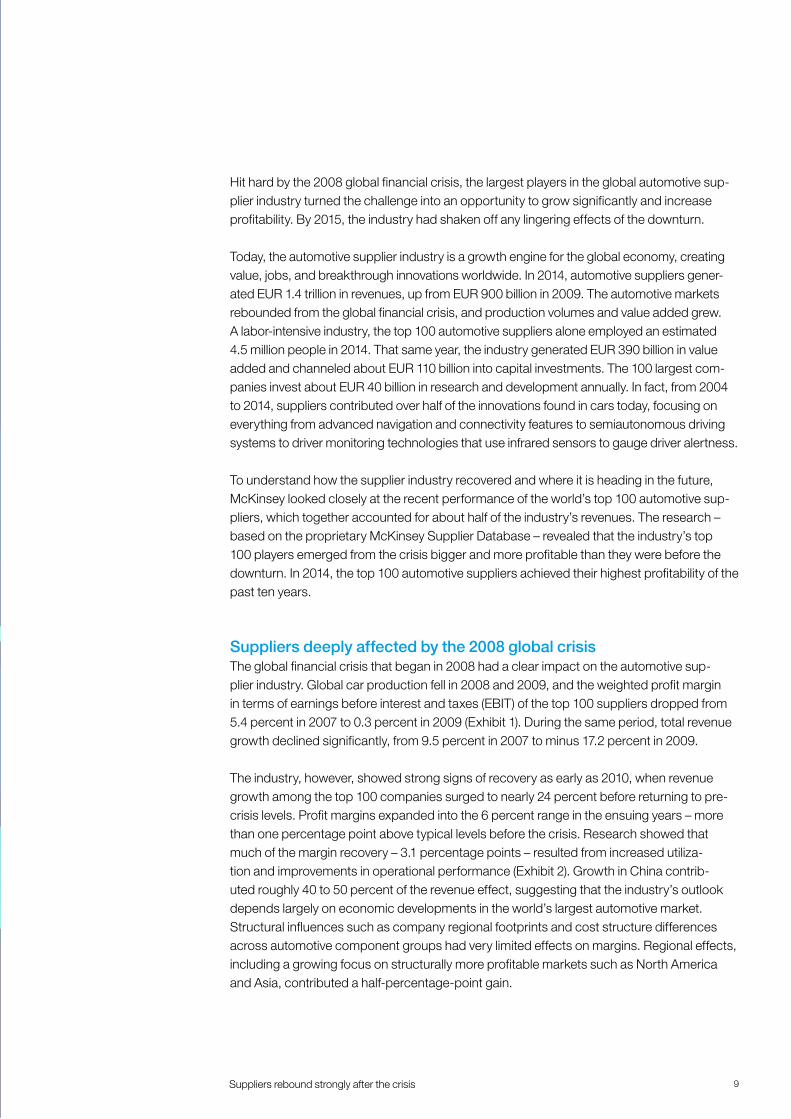
Hit hard by the 2008 global financial crisis, the largest players in the global automotive sup-plier industry turned the challenge into an opportunity to grow significantly and increase profitability. By 2015, the industry had shaken off any lingering effects of the downturn.
Today, the automotive supplier industry is a growth engine for the global economy, creating value, jobs, and breakthrough innovations worldwide. In 2014, automotive suppliers gener-ated EUR 1.4 trillion in revenues, up from EUR 900 billion in 2009. The automotive markets rebounded from the global financial crisis, and production volumes and value added grew. A labor-intensive industry, the top 100 automotive suppliers alone employed an estimated 4.5 million people in 2014. That same year, the industry generated EUR 390 billion in value added and channeled about EUR 110 billion into capital investments. The 100 largest com-panies invest about EUR 40 billion in research and development annually. In fact, from 2004 to 2014, suppliers contributed over half of the innovations found in cars today, focusing on everything from advanced navigation and connectivity features to semiautonomous driving systems to driver monitoring technologies that use infrared sensors to gauge driver alertness.
To understand how the supplier industry recovered and where it is heading in the future, McKinsey looked closely at the recent performance of the world’s top 100 automotive sup-pliers, which together accounted for about half of the industry’s revenues. The research – based on the proprietary McKinsey Supplier Database – revealed that the industry’s top 100 players emerged from the crisis bigger and more profitable than they were before the downturn. In 2014, the top 100 automotive suppliers achieved their highest profitability of the past ten years.
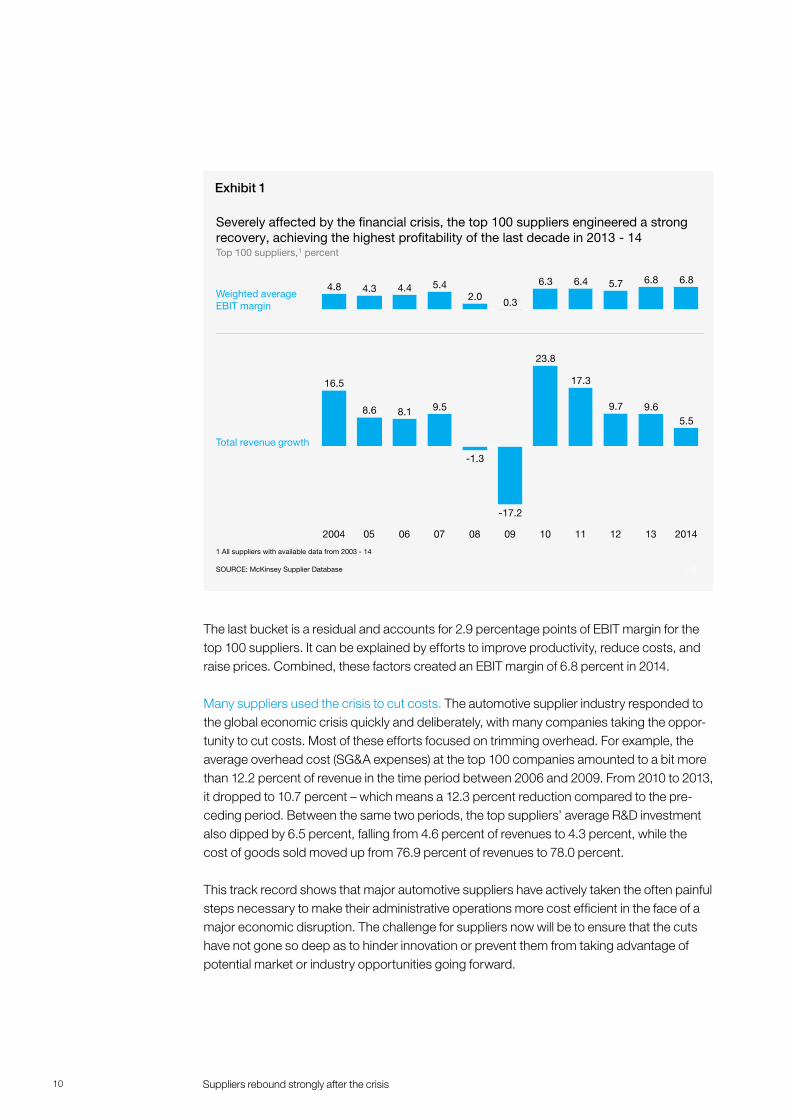
Suppliers deeply affected by the 2008 global crisisThe global financial crisis that began in 2008 had a clear impact on the automotive sup-plier industry. Global car production fell in 2008 and 2009, and the weighted profit margin in terms of earnings before interest and taxes (EBIT) of the top 100 suppliers dropped from 5.4 percent in 2007 to 0.3 percent in 2009 (Exhibit 1). During the same period, total revenue growth declined significantly, from 9.5 percent in 2007 to minus 17.2 percent in 2009.
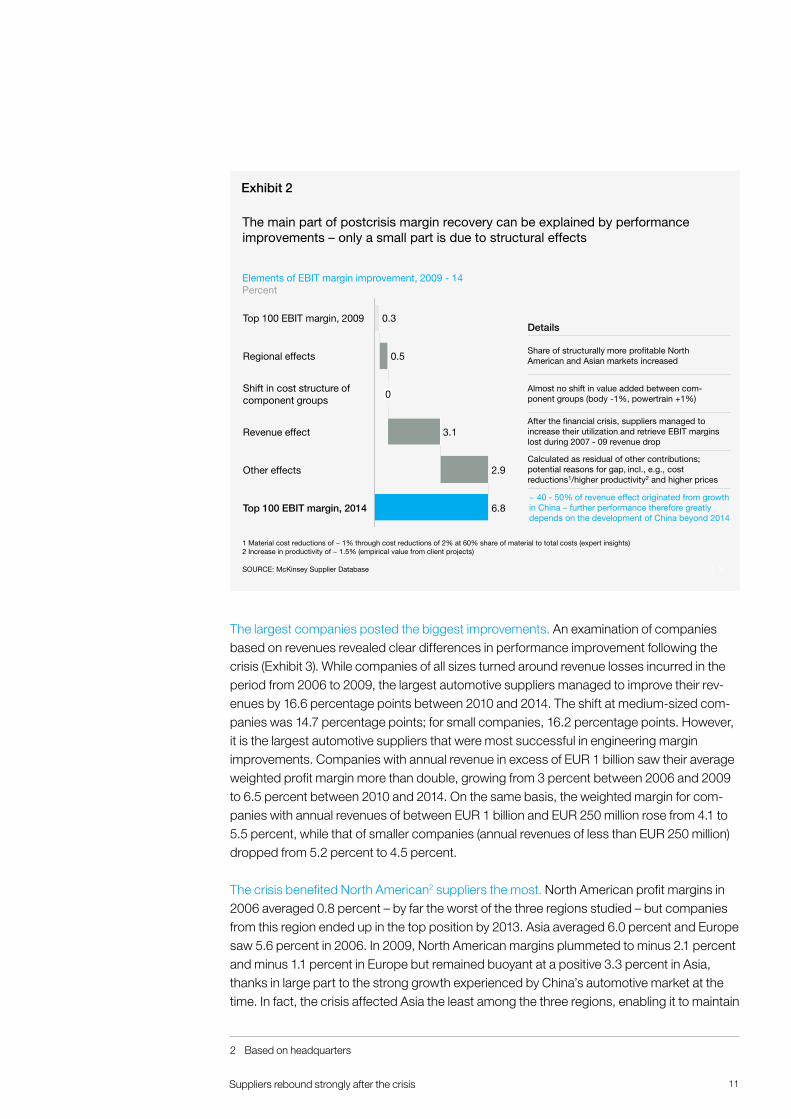
The industry, however, showed strong signs of recovery as early as 2010, when revenue growth among the top 100 companies surged to nearly 24 percent before returning to pre-crisis levels. Profit margins expanded into the 6 percent range in the ensuing years – more than one percentage point above typical levels before the crisis. Research showed that much of the margin recovery – 3.1 percentage points – resulted from increased utiliza-tion and improvements in operational performance (Exhibit 2). Growth in China contrib-uted roughly 40 to 50 percent of the revenue effect, suggesting that the industry’s outlook depends largely on economic developments in the world’s largest automotive market. Structural influences such as company regional footprints and cost structure differences across automotive component groups had very limited effects on margins. Regional effects, including a growing focus on structurally more profitable markets such as North America and Asia, contributed a half-percentage-point gain.
SUPPLIERS REBOUND STRONGLY AFTER THE CRISIS
10 Suppliers rebound strongly after the crisis
The last bucket is a residual and accounts for 2.9 percentage points of EBIT margin for the top 100 suppliers. It can be explained by efforts to improve productivity, reduce costs, and raise prices. Combined, these factors created an EBIT margin of 6.8 percent in 2014.
Many suppliers used the crisis to cut costs. The automotive supplier industry responded to the global economic crisis quickly and deliberately, with many companies taking the oppor-tunity to cut costs. Most of these efforts focused on trimming overhead. For example, the average overhead cost (SG&A expenses) at the top 100 companies amounted to a bit more than 12.2 percent of revenue in the time period between 2006 and 2009. From 2010 to 2013, it dropped to 10.7 percent – which means a 12.3 percent reduction compared to the pre-ceding period. Between the same two periods, the top suppliers’ average R&D investment also dipped by 6.5 percent, falling from 4.6 percent of revenues to 4.3 percent, while the cost of goods sold moved up from 76.9 percent of revenues to 78.0 percent.
This track record shows that major automotive suppliers have actively taken the often painful steps necessary to make their administrative operations more cost efficient in the face of a major economic disruption. The challenge for suppliers now will be to ensure that the cuts have not gone so deep as to hinder innovation or prevent them from taking advantage of potential market or industry opportunities going forward.
2|
4.36.45.4 6.34.8
0.3
6.85.74.46.8
2.0
Severely affected by the financial crisis, the top 100 suppliers engineered a strong recovery, achieving the highest profitability of the last decade in 2013 - 14Top 100 suppliers,1 percent
SOURCE: McKinsey Supplier Database
1 All suppliers with available data from 2003 - 14
16.5
9.6
052004
5.58.6 8.1
17.3
10090807 13
9.5
06
23.8
2014
9.7
-17.2
-1.3
1211
Total revenue growth
Weighted averageEBIT margin
Exhibit 1
11Suppliers rebound strongly after the crisis
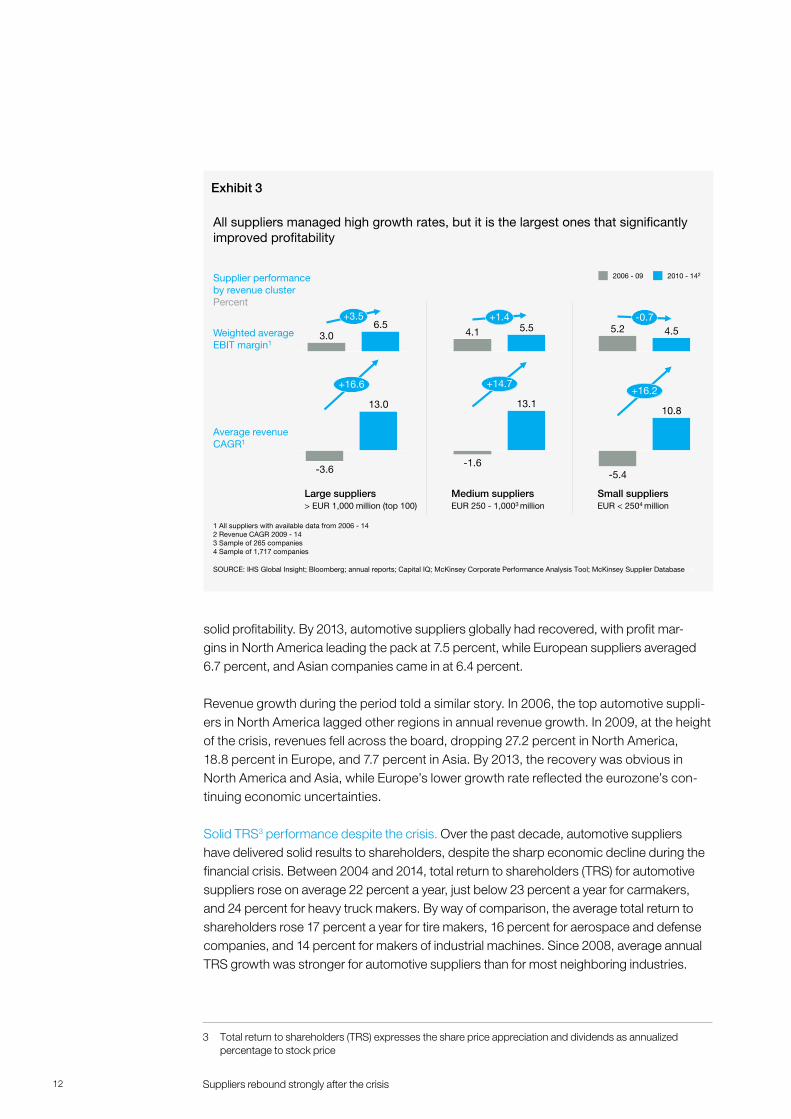
The largest companies posted the biggest improvements. An examination of companies based on revenues revealed clear differences in performance improvement following the crisis (Exhibit 3). While companies of all sizes turned around revenue losses incurred in the period from 2006 to 2009, the largest automotive suppliers managed to improve their rev-enues by 16.6 percentage points between 2010 and 2014. The shift at medium-sized com-panies was 14.7 percentage points; for small companies, 16.2 percentage points. However, it is the largest automotive suppliers that were most successful in engineering margin improvements. Companies with annual revenue in excess of EUR 1 billion saw their average weighted profit margin more than double, growing from 3 percent between 2006 and 2009 to 6.5 percent between 2010 and 2014. On the same basis, the weighted margin for com-panies with annual revenues of between EUR 1 billion and EUR 250 million rose from 4.1 to 5.5 percent, while that of smaller companies (annual revenues of less than EUR 250 million) dropped from 5.2 percent to 4.5 percent.
The crisis benefited North American2 suppliers the most. North American profit margins in 2006 averaged 0.8 percent – by far the worst of the three regions studied – but companies from this region ended up in the top position by 2013. Asia averaged 6.0 percent and Europe saw 5.6 percent in 2006. In 2009, North American margins plummeted to minus 2.1 percent and minus 1.1 percent in Europe but remained buoyant at a positive 3.3 percent in Asia, thanks in large part to the strong growth experienced by China’s automotive market at the time. In fact, the crisis affected Asia the least among the three regions, enabling it to maintain
3|
Almost no shift in value added between com-ponent groups (body -1%, powertrain +1%)
After the financial crisis, suppliers managed to increase their utilization and retrieve EBIT margins lost during 2007 - 09 revenue drop
The main part of postcrisis margin recovery can be explained by performance improvements – only a small part is due to structural effects
Elements of EBIT margin improvement, 2009 - 14Percent
Share of structurally more profitable North American and Asian markets increased
SOURCE: McKinsey Supplier Database
Details
Calculated as residual of other contributions; potential reasons for gap, incl., e.g., cost reductions1/higher productivity2 and higher prices
1 Material cost reductions of ~ 1% through cost reductions of 2% at 60% share of material to total costs (expert insights)2 Increase in productivity of ~ 1.5% (empirical value from client projects)
~ 40 - 50% of revenue effect originated from growth in China – further performance therefore greatly depends on the development of China beyond 2014
2.9
Shift in cost structure of component groups
3.1
0.3
Top 100 EBIT margin, 2014
0.5
Revenue effect
0
Regional effects
6.8
Top 100 EBIT margin, 2009
Other effects
Exhibit 2
2 Based on headquarters
12 Suppliers rebound strongly after the crisis
solid profitability. By 2013, automotive suppliers globally had recovered, with profit mar-gins in North America leading the pack at 7.5 percent, while European suppliers averaged 6.7 percent, and Asian companies came in at 6.4 percent.
Revenue growth during the period told a similar story. In 2006, the top automotive suppli-ers in North America lagged other regions in annual revenue growth. In 2009, at the height of the crisis, revenues fell across the board, dropping 27.2 percent in North America, 18.8 percent in Europe, and 7.7 percent in Asia. By 2013, the recovery was obvious in North America and Asia, while Europe’s lower growth rate reflected the eurozone’s con-tinuing economic uncertainties. Solid TRS3 performance despite the crisis. Over the past decade, automotive suppliers have delivered solid results to shareholders, despite the sharp economic decline during the financial crisis. Between 2004 and 2014, total return to shareholders (TRS) for automotive suppliers rose on average 22 percent a year, just below 23 percent a year for carmakers, and 24 percent for heavy truck makers. By way of comparison, the average total return to shareholders rose 17 percent a year for tire makers, 16 percent for aerospace and defense companies, and 14 percent for makers of industrial machines. Since 2008, average annual TRS growth was stronger for automotive suppliers than for most neighboring industries.
4|
All suppliers managed high growth rates, but it is the largest ones that significantly improved profitability
SOURCE: IHS Global Insight; Bloomberg; annual reports; Capital IQ; McKinsey Corporate Performance Analysis Tool; McKinsey Supplier Database
Weighted averageEBIT margin1
+16.6
-3.6
13.0
+14.7
13.1
-1.6
10.8
+16.2
-5.4
6.5+3.5
3.05.5
+1.4
4.1 4.55.2-0.7
Supplier performance by revenue cluster Percent
Average revenue CAGR1
2006 - 09 2010 - 142
1 All suppliers with available data from 2006 - 14 2 Revenue CAGR 2009 - 143 Sample of 265 companies 4 Sample of 1,717 companies
> EUR 1,000 million (top 100) EUR 250 - 1,0003 million EUR < 2504 millionLarge suppliers Medium suppliers Small suppliers
Exhibit 3
3 Total return to shareholders (TRS) expresses the share price appreciation and dividends as annualized percentage to stock price
13Suppliers rebound strongly after the crisis
Reshaping the industry
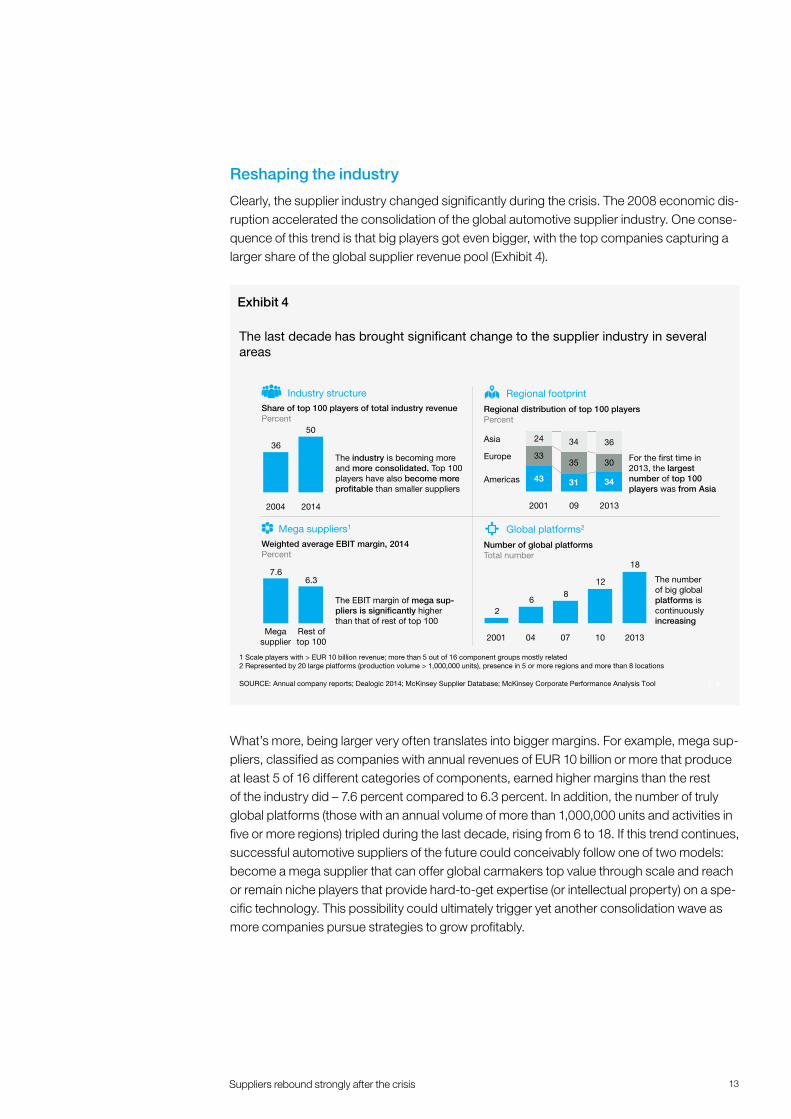
Clearly, the supplier industry changed significantly during the crisis. The 2008 economic dis-ruption accelerated the consolidation of the global automotive supplier industry. One conse-quence of this trend is that big players got even bigger, with the top companies capturing a larger share of the global supplier revenue pool (Exhibit 4).
What’s more, being larger very often translates into bigger margins. For example, mega sup-pliers, classified as companies with annual revenues of EUR 10 billion or more that produce at least 5 of 16 different categories of components, earned higher margins than the rest of the industry did – 7.6 percent compared to 6.3 percent. In addition, the number of truly global platforms (those with an annual volume of more than 1,000,000 units and activities in five or more regions) tripled during the last decade, rising from 6 to 18. If this trend continues, successful automotive suppliers of the future could conceivably follow one of two models: become a mega supplier that can offer global carmakers top value through scale and reach or remain niche players that provide hard-to-get expertise (or intellectual property) on a spe-cific technology. This possibility could ultimately trigger yet another consolidation wave as more companies pursue strategies to grow profitably.
5|
Global platforms2
Industry structure
Number of global platformsTotal number
The number of big global platforms is continuously increasing
For the first time in 2013, the largest number of top 100 players was from Asia
The industry is becoming more and more consolidated. Top 100 players have also become more profitable than smaller suppliers
The EBIT margin of mega sup-pliers is significantly higher than that of rest of top 100
Share of top 100 players of total industry revenuePercent
The last decade has brought significant change to the supplier industry in several areas
43 31 34
3335 30
24 34 36
2013
Europe
Americas
Asia
092001
7.66.3
50
36
20142004
Mega suppliers1
Weighted average EBIT margin, 2014Percent
Regional footprint
Regional distribution of top 100 playersPercent
1 Scale players with > EUR 10 billion revenue; more than 5 out of 16 component groups mostly related2 Represented by 20 large platforms (production volume > 1,000,000 units), presence in 5 or more regions and more than 8 locations
18
128
62
07 201310042001Mega
supplierRest of top 100
SOURCE: Annual company reports; Dealogic 2014; McKinsey Supplier Database; McKinsey Corporate Performance Analysis Tool
Exhibit 4
14 Suppliers rebound strongly after the crisis
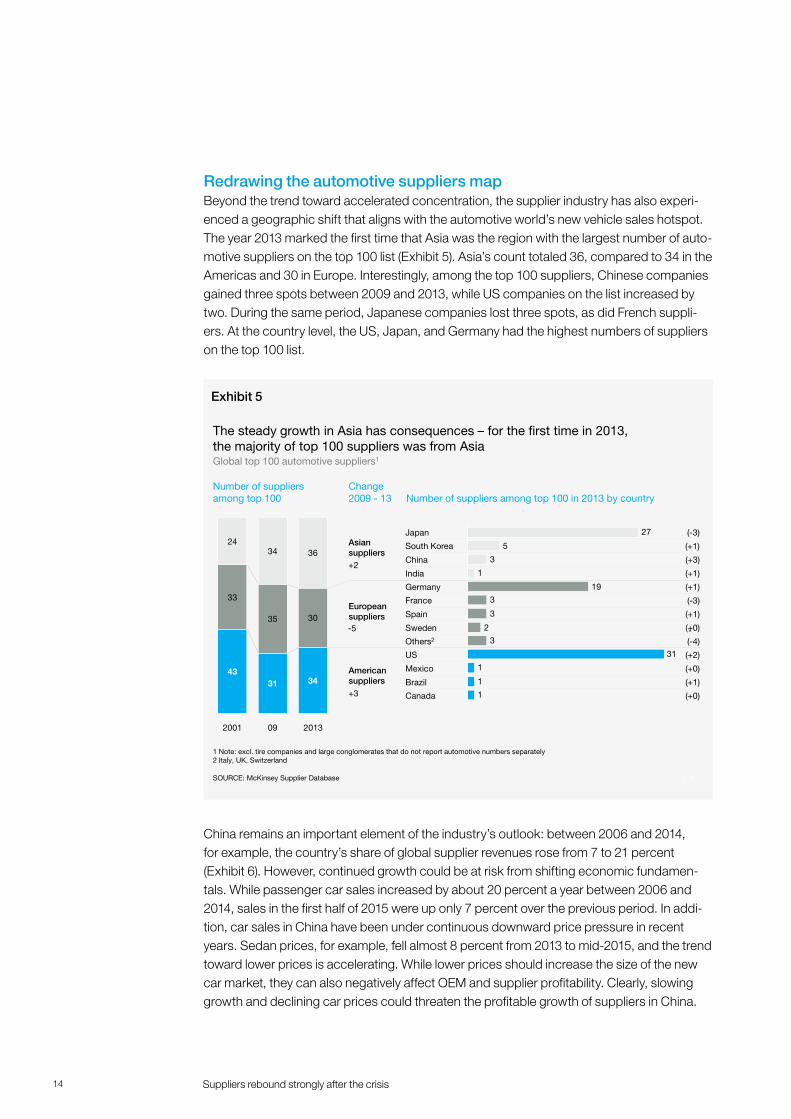
Redrawing the automotive suppliers mapBeyond the trend toward accelerated concentration, the supplier industry has also experi-enced a geographic shift that aligns with the automotive world’s new vehicle sales hotspot. The year 2013 marked the first time that Asia was the region with the largest number of auto-motive suppliers on the top 100 list (Exhibit 5). Asia’s count totaled 36, compared to 34 in the Americas and 30 in Europe. Interestingly, among the top 100 suppliers, Chinese companies gained three spots between 2009 and 2013, while US companies on the list increased by two. During the same period, Japanese companies lost three spots, as did French suppli-ers. At the country level, the US, Japan, and Germany had the highest numbers of suppliers on the top 100 list.
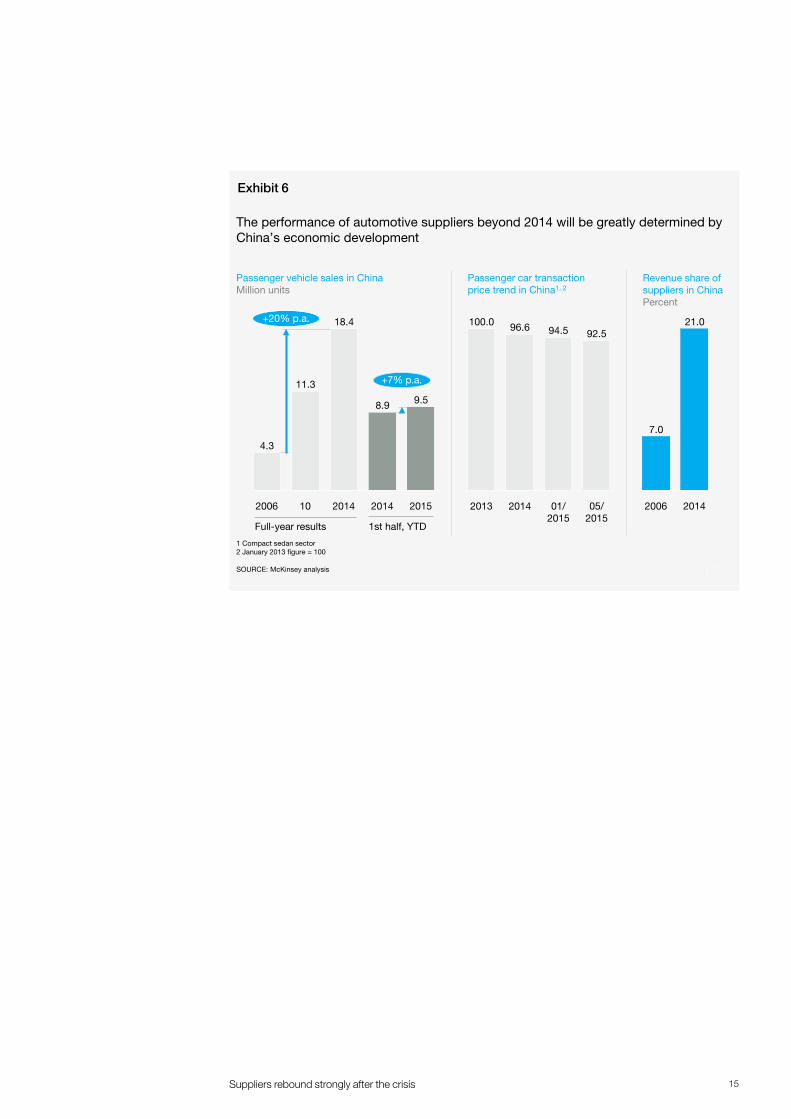
China remains an important element of the industry’s outlook: between 2006 and 2014, for example, the country’s share of global supplier revenues rose from 7 to 21 percent (Exhibit 6). However, continued growth could be at risk from shifting economic fundamen-tals. While passenger car sales increased by about 20 percent a year between 2006 and 2014, sales in the first half of 2015 were up only 7 percent over the previous period. In addi-tion, car sales in China have been under continuous downward price pressure in recent years. Sedan prices, for example, fell almost 8 percent from 2013 to mid-2015, and the trend toward lower prices is accelerating. While lower prices should increase the size of the new car market, they can also negatively affect OEM and supplier profitability. Clearly, slowing growth and declining car prices could threaten the profitable growth of suppliers in China.
6|
1
1
1
31
3
2
3
3
19
1
3
5
27
Mexico
Brazil
South Korea
Others2
Japan
India
Germany
US
France
China
Sweden
Spain
Canada
Global top 100 automotive suppliers1
Number of suppliersamong top 100
Change 2009 - 13
The steady growth in Asia has consequences – for the first time in 2013, the majority of top 100 suppliers was from Asia
4331 34
33
35 30
2434 36
2013092001
SOURCE: McKinsey Supplier Database
-5
Asian suppliers
European suppliers
American suppliers
+2
+3
Number of suppliers among top 100 in 2013 by country
(-3)
(+1)
(+3)
(+1)
(-3)
(+1)
(+0)
(-4)
(+2)
(+0)
(+0)
(+1)
(+1)
-
1 Note: excl. tire companies and large conglomerates that do not report automotive numbers separately 2 Italy, UK, Switzerland
Exhibit 5
15Suppliers rebound strongly after the crisis
7|
2006
7.0
2014
21.0
The performance of automotive suppliers beyond 2014 will be greatly determined by China’s economic development
Passenger vehicle sales in ChinaMillion units
1 Compact sedan sector2 January 2013 figure = 100
SOURCE: McKinsey analysis
05/2015
92.5
01/2015
94.5
2014
96.6
2013
100.0+20% p.a.
4.3
2014
8.9
2014
18.4
10
11.3
20152006
9.5
+7% p.a.
Passenger car transaction price trend in China1, 2
Revenue share of suppliers in ChinaPercent
Full-year results 1st half, YTD
Exhibit 6
16 Performance and disruption
FIVE TRENDS TRANSFORMING THE SUPPLIER INDUSTRY
17Five trends transforming the supplier industry
4 Including battery electric vehicles (BEV), fuel cell electric vehicles (FCEV), hybrid electric vehicles (with e-motor and opt. plug-in) (HEV/PHEV), and range extended electric vehicles (opt. plug-in) (REEV/REX)
5 Cf. McKinsey study “Boost! Transform the Power train Value Chain” (2011)
Automotive suppliers have demonstrated resiliency in the face of economic disaster, which should help prepare them for future market and industry challenges. Perhaps the greatest challenge will be the pace of change itself. Where in the past fundamental changes occurred only rarely in the automotive industry, today’s suppliers face a succession of disruptions that are redefining the automotive space. McKinsey and CLEPA have identified five key technol-ogy trends with the power to reshape the industry going forward. In addition to technology, several other major trends will also affect suppliers, such as urbanization and the growth rates of developing economies. However, this report focuses primarily on technology’s impact on the supplier industry.
1. VEHICLE ELECTRIFICATION
The stronger regulation of carbon dioxide (CO2) emissions, rising consumer awareness of the issue, and ongoing government incentive programs for electric vehicles and hybrids (EVs)4 will boost electric powertrain sales. Industry experts suggest that EVs could grow from 2 per-cent of current vehicle production to 65 percent in 2030.5 And unlike the internal combustion engine, suppliers currently provide nearly all of the EV’s powertrain, offering players a signifi-cant opportunity to participate in this growing sector.
2. IN-CAR CONNECTIVITY
Car buyers increasingly demand “Apple-like” experiences, which require OEMs to develop integrated ecosystems of embedded vehicle features and functions. The market for fully or partially integrated in-car infotainment systems could grow from 18 million units in 2015 to 50 million in 2025. This trend opens a new competitive battlefield that pits traditional auto-motive players against well-funded and innovative tech giants, requiring a new mindset that focuses on customers (not just engineering) within the industry.
“ Although the last decades already brought great innovation – just think about airbags or the Electronic Stability Program – they could still be considered the evolution of existing technologies. However, with autonomous driving and connectivity, we now face technological trends with revolutionary character.” Paul Schockmel, CLEPA
“ Electrification and in-car connectivity have been around for quite a while already, but it seems that customers are now increasingly pushing to actually go to the next horizon.” Thorsten Muschal, Faurecia
18 Five trends transforming the supplier industry
3. AUTONOMOUS DRIVING
Continued technological advances and growing societal awareness of the concept of self-driving vehicles will lead to more advanced autonomous and semiautonomous vehicle fea-tures. The increased focus is attracting new attackers from the high-tech and online industries to enter the market, and boosting merger and acquisition activity in the segment. It will also add significantly to car complexity levels. For example, analysts anticipate the lines of software code in a premium vehicle could grow from 100 million in 2015 to 300 million in 2030.
4. ADVANCED MANUFACTURING
The rise of digital factories and the Internet of Things and the use of cutting-edge robotics technologies will continue to improve current manufacturing processes and the products they deliver. Other breakthroughs include the use of sensors to enable data-driven opera-tions analytics, 3-D printing (additive manufacturing), and the new “digital factory” concept for lean manufacturing. Industry observers predict that advanced manufacturing could reduce quality costs by 10 to 20 percent by 2020.6
5. ADVANCED MATERIALS
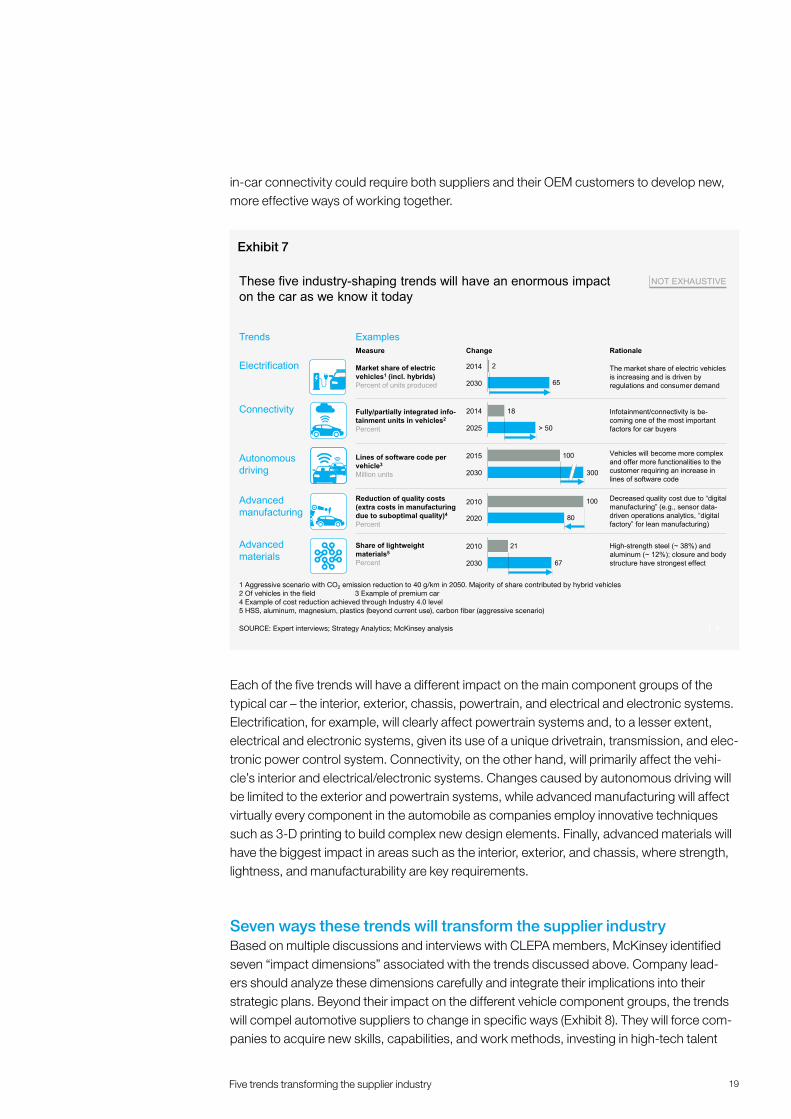
Advanced materials offer superior characteristics in terms of strength, weight, conductivity, and functionality. However, they also present a number of challenges, including availability, pricing, sustainability, and how well manufacturers can integrate them into their products and processes. Industry experts suggest that the proportion of lightweight materials used in cars could grow from 29 percent in 2010 to 67 percent in 2030.7 Exhibit 7 provides examples of the potential growth in specific areas that these five trends could deliver. While some of these examples start from small bases, such as the market share of EVs, others foreshadow massive new levels of complexity that OEMs and suppliers will have to manage. Specifically, as noted above, the anticipated tripling of lines of software code per vehicle required for autonomous driving and the growth in integrated infotainment units to provide new levels of
“ The moment when fully autonomous driving will become a reality mainly depends on regulatory issues. Technologically, all necessary sensor principles are available, however, establishing the infrastructure is crucial. Due to the complexity of the driving situations, we also foresee that autonomous driving will conquer the highway long before it can be implemented in an urban environment. In any case, the investments for testing and homologation will increase significantly.” Dr. Rolf Bulander, Bosch
6 Cf. Bauernhansl, Thomas, ten Hompel, Michael, Vogel-Heuser, Birgit (Hrsg.): Industrie 4.0 in Produktion, Automatisierung und Logistik (2014)
7 Lightweight materials include high-strength steel, aluminum, magnesium, plastics (beyond current use), glass/carbon fiber. Cf. McKinsey study “Lightweight, heavy impact. How carbon fiber and other lightweight materials will develop across industries and specifically in automotive” (2012)
19Five trends transforming the supplier industry
in-car connectivity could require both suppliers and their OEM customers to develop new, more effective ways of working together.
Each of the five trends will have a different impact on the main component groups of the typical car – the interior, exterior, chassis, powertrain, and electrical and electronic systems. Electrification, for example, will clearly affect powertrain systems and, to a lesser extent, electrical and electronic systems, given its use of a unique drivetrain, transmission, and elec-tronic power control system. Connectivity, on the other hand, will primarily affect the vehi-cle’s interior and electrical/electronic systems. Changes caused by autonomous driving will be limited to the exterior and powertrain systems, while advanced manufacturing will affect virtually every component in the automobile as companies employ innovative techniques such as 3-D printing to build complex new design elements. Finally, advanced materials will have the biggest impact in areas such as the interior, exterior, and chassis, where strength, lightness, and manufacturability are key requirements.
Seven ways these trends will transform the supplier industryBased on multiple discussions and interviews with CLEPA members, McKinsey identified seven “impact dimensions” associated with the trends discussed above. Company lead-ers should analyze these dimensions carefully and integrate their implications into their strategic plans. Beyond their impact on the different vehicle component groups, the trends will compel automotive suppliers to change in specific ways (Exhibit 8). They will force com-panies to acquire new skills, capabilities, and work methods, investing in high-tech talent
8|
These five industry-shaping trends will have an enormous impact on the car as we know it today
SOURCE: Expert interviews; Strategy Analytics; McKinsey analysis
65
2
2030
2014
2025
2014 18
> 50
100
2030 300
2015
80
1002010
2020
67
212010
2030
Change
Share of lightweight materials5
Percent
Reduction of quality costs (extra costs in manufacturing due to suboptimal quality)4
Percent
Lines of software code per vehicle3
Million units
Fully/partially integrated info-tainment units in vehicles2
Percent
Rationale
High-strength steel (~ 38%) and aluminum (~ 12%); closure and body structure have strongest effect
Decreased quality cost due to “digital manufacturing” (e.g., sensor data-driven operations analytics, “digital factory” for lean manufacturing)
Vehicles will become more complex and offer more functionalities to the customer requiring an increase in lines of software code
Infotainment/connectivity is be-coming one of the most important factors for car buyers
Measure
The market share of electric vehicles is increasing and is driven by regulations and consumer demand
Examples
NOT EXHAUSTIVE
Market share of electric vehicles1 (incl. hybrids)Percent of units produced
Trends
Connectivity
Advanced manufacturing
Advanced materials
Electrification
Autonomous driving
1 Aggressive scenario with CO2 emission reduction to 40 g/km in 2050. Majority of share contributed by hybrid vehicles 2 Of vehicles in the field 3 Example of premium car 4 Example of cost reduction achieved through Industry 4.0 level 5 HSS, aluminum, magnesium, plastics (beyond current use), carbon fiber (aggressive scenario)
Exhibit 7
20 Five trends transforming the supplier industry
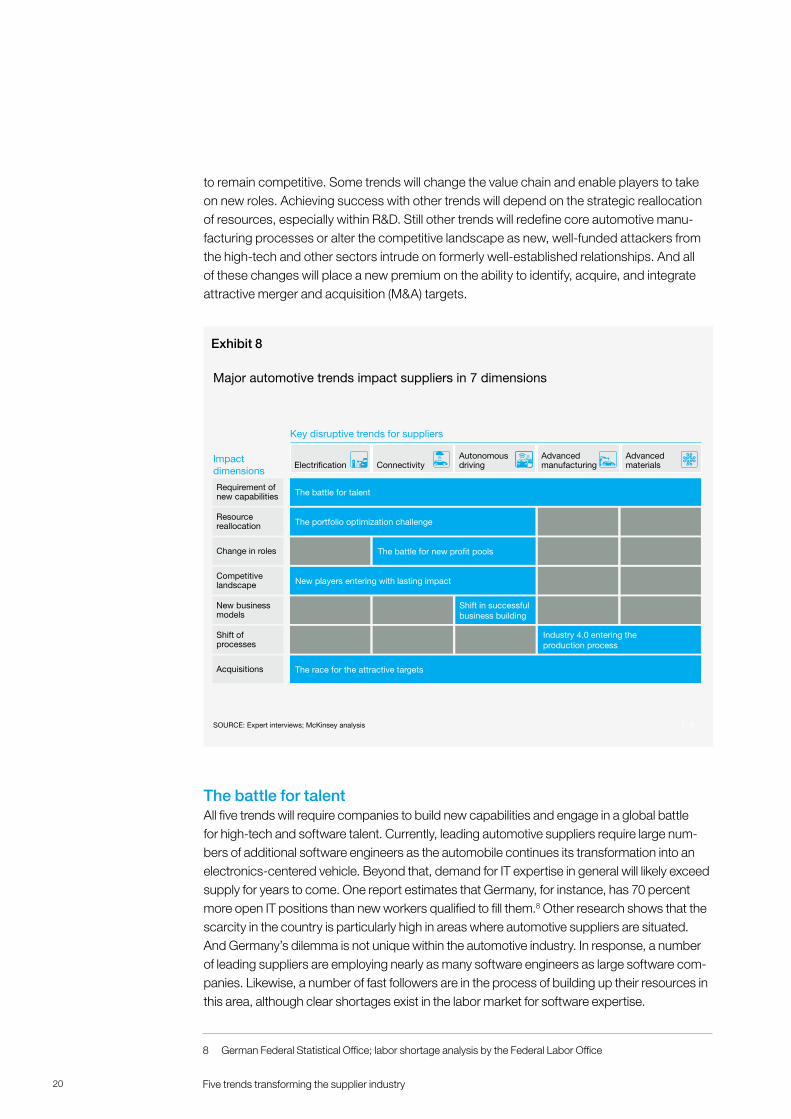
to remain competitive. Some trends will change the value chain and enable players to take on new roles. Achieving success with other trends will depend on the strategic reallocation of resources, especially within R&D. Still other trends will redefine core automotive manu-facturing processes or alter the competitive landscape as new, well-funded attackers from the high-tech and other sectors intrude on formerly well-established relationships. And all of these changes will place a new premium on the ability to identify, acquire, and integrate attractive merger and acquisition (M&A) targets.
The battle for talent All five trends will require companies to build new capabilities and engage in a global battle for high-tech and software talent. Currently, leading automotive suppliers require large num-bers of additional software engineers as the automobile continues its transformation into an electronics-centered vehicle. Beyond that, demand for IT expertise in general will likely exceed supply for years to come. One report estimates that Germany, for instance, has 70 percent more open IT positions than new workers qualified to fill them.8 Other research shows that the scarcity in the country is particularly high in areas where automotive suppliers are situated. And Germany’s dilemma is not unique within the automotive industry. In response, a number of leading suppliers are employing nearly as many software engineers as large software com-panies. Likewise, a number of fast followers are in the process of building up their resources in this area, although clear shortages exist in the labor market for software expertise.
9|
Autonomous drivingConnectivity
Advanced materialsElectrification
Advanced manufacturing
Key disruptive trends for suppliers
Major automotive trends impact suppliers in 7 dimensions
SOURCE: Expert interviews; McKinsey analysis
Impact dimensions
Resource reallocation The portfolio optimization challenge
Change in roles The battle for new profit pools
Competitive landscape New players entering with lasting impact
New business models
Shift in successful business building
Shift of processes
Industry 4.0 entering the production process
The race for the attractive targetsAcquisitions
Requirement ofnew capabilities The battle for talent
Exhibit 8
8 German Federal Statistical Office; labor shortage analysis by the Federal Labor Office
21Five trends transforming the supplier industry
The portfolio optimization challenge Initial McKinsey research shows that companies that enjoy greater levels of success actively reallocate more of their resources to where they get the highest benefit. Three of the trends – electrification, connectivity, and autonomous driving – mean that suppliers need to real-locate resources and take steps to optimize their products. Companies that reallocate also tend to spend more on disruptive and breakthrough technologies compared to their peers. For example, where low performers target nearly 70 percent of their R&D portfolio spending on incremental projects meant to maintain their current market position, high performers do almost exactly the opposite. They focus 66 percent of their R&D spending on breakthrough and disruptive technologies.9 The clear goal of these game-changing investments is to posi-tion the company advantageously in those markets. Signs that industry players are increas-ing their emphasis on resource reallocation continue to emerge as companies dispose of selected business units and increase the focus on others.
The battle for new profit pools New players such as EV manufacturer Tesla are currently attracting huge interest from the cap-ital markets. While Tesla’s sales revenue is dwarfed by that of the average top-30-listed OEM, the EV maker’s market capitalization in August 2015 was over USD 2 billion greater. A similar phenomenon is occurring among automotive suppliers, where a new maker of a vision-based driver assistance system for full and semiautonomous driving systems enjoys a higher-than-average market capitalization level despite the company’s currently negative profitability. In addition, three different groups of new players – specialists, software giants, and specialty soft-ware developers – are attempting to stake claims in critical autonomous driving control points. And technology giants are seeking to collaborate with automotive players in new alliances, positioning themselves as both competitors and potential customers with deep pockets. In response, traditional OEM suppliers are paying more attention to vehicle systems and integra-tion. What appears to be different this time is the perhaps permanent shift in the competitive landscape as big new players enter the industry and may assume unique, long-term positions.
New players entering with lasting impactThe connectivity and autonomous driving trends will necessitate a change in roles as com-panies battle for emerging profit pools. These profit pools are bubbling up around in-car connectivity and autonomous driving, for example. Suppliers will also have to move closer to end customers to gain proprietary advantages and focus on delivering integrated systems. McKinsey research shows that regarding infotainment systems, the demand for integrated systems is expanding rapidly and will make up about half of the market in 2025 as traditional systems increasingly face commoditization. Suppliers in Europe are also stepping into value chain roles typically reserved for OEMs. For example, some of these players are producing low volumes of niche vehicles that the OEMs choose not to assemble themselves.
9 High-/low-performing innovators: 1st/4th quartile of companies regarding overall performance, margins, and growth rates relative to competitors. Cf. McKinsey Global Survey results: “Managing the innovation portfolio to win” (2014)
22 Five trends transforming the supplier industry
In-car connectivity has opened another avenue for both industry incumbents and non-traditional players to make money – e.g., providing over-the-air (OTA) updates for cars in the aftermarket. Consumers are familiar with the OTA process in consumer electronics, and some advanced EV makers already employ the approach to introduce new features on a continuous basis. One key advantage of OTAs is that they save costs compared to sub-sidized updates at dealerships. While already established within the EV fleet, a reduction of the customer concerns over time can be expected to make OTAs more prevalent in the mainstream automotive market for nonelectric vehicles as well. As OTA players enter the car value chain and take over tasks once performed by dealers, opportunities for new indepen-dent aftermarket OTA revenue streams will increase. Some traditional suppliers are already investing in building these capabilities.
The nascent “pay-per-usage” mobility models offer legitimate alternatives to car owner-ship. Where consumers could choose traditional rental cars, taxis, or carpooling in the past, several new choices have emerged. For example, “e-hailing” involves the on-demand hiring of a private car via a mobile app, while shared e-hailing matches multiple customers simul-taneously with a single driver. Likewise, a car-sharing fleet operator provides on-demand, by-the-hour car rentals via a fleet of company-owned cars scattered throughout a city. Person-to-person car rentals are emerging. Enabled by a mobile platform, this model lets users rent privately owned vehicles on a per-hour or daily basis. A new form of carpooling has also become viable – “carpooling 2.0” uses technology and mobile apps to allow non-professional drivers and multiple riders to drive to work together.
One company has pursued another new automotive business model, offering drivers real-time traffic information based on data from a variety of sources that include car GPS sys-tems, smartphones, traffic cameras, and the like. It mixes in information from other sources on the weather, road construction areas, and other road-clogging events. The company views OEMs, private users, and public institutions such as city governments as potential customers. Services it will provide include help finding the best route to a destination, locat-ing available parking spots and EV charging stations, and traffic information for city planners.
“ Autonomous driving will change the OEM-supplier landscape. Only suppliers that are able to invest significant amounts in technology and testing will be able to become ‘tier-0.5’ suppliers. Furthermore, if the future automotive supplier is a system supplier, a consolidation of the market will be very likely.” Giuseppe Rosso, Magneti Marelli
“ Potential new entrants like Google or Apple will challenge the established players in the industry on what the future of mobility will look like. We need to reconsider the scope of our industry.” Roberto Vavassori, Brembo
23Five trends transforming the supplier industry
The shift in successful business buildingInfotainment and autonomous driving will also require participating companies to develop new business models. Usage-based software and services – including navigation, apps, and entertainment – could generate as much as EUR 450 to EUR 500 per vehicle by 2020, based on streaming fees, content provided by third parties, subscriber fees and tariffs, and commissions for location-based recommendations. Traditional suppliers are finding ways to become involved in these new models, either through collaboration or acquisitions. Car sharing provides another opportunity for suppliers to participate in the new mobility market. Purpose-built car-sharing vehicles will likely feature more durable, easily-to-clean interiors; plug-and-play infotainment upgrades to keep vehicles up to date; and perhaps special electronics that can communicate a vehicle’s availability and battery range (if an EV). Other options could include in-car identification and payment solutions and more accessible seat-ing arrangements.
Industry 4.0 entering the production processAdvanced manufacturing and materials trends will drive shifts in production processes as smart factories enable suppliers to increase operational efficiency. Industry 4.0 applications can conceivably deliver 30 to 50 percent reductions in machine downtime, 45 to 55 percent increases in productivity, and 20 to 50 percent reductions in time-to-market performance. One OEM uses intelligent tools to reduce door production scrap by 25 percent, and its cost of quality is 10 to 20 percent lower than a traditional plant’s. Additive manufacturing is another Industry 4.0 breakthrough that will revolutionize automotive production. One admit-tedly extreme example illustrates how 3-D printing could reduce the development cycle of a new car to about a year. It produces a car requiring only 49 parts. The crowdsourced Strati electric vehicle shows how it’s done. Designed by a 48,000-member online community, the plastic car enables significant R&D cost reductions through parts-design crowdsourcing, and its inventors claim they can quickly scale up production with only limited logistics costs.
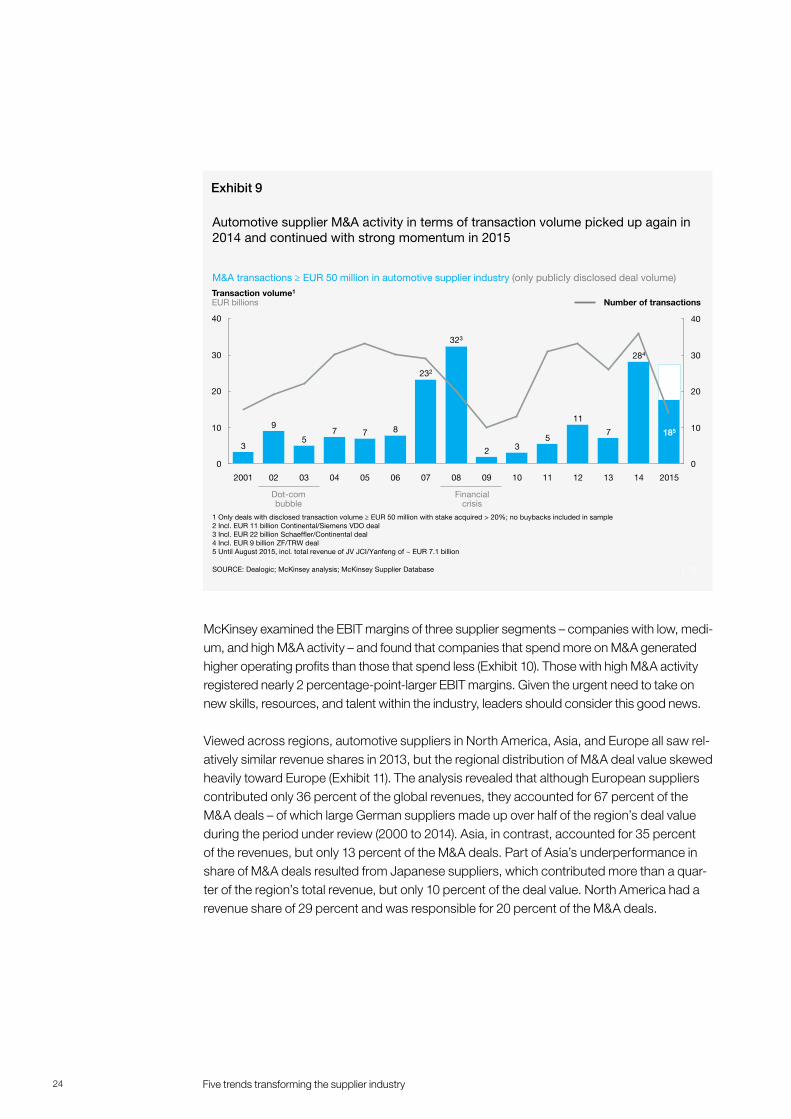
The race for attractive targetsFinally, all of these trends drive new acquisition activities as companies race to buy attrac-tive targets. Strong consolidation moves already characterize the industry, as M&A activi-ties picked up significantly in 2014 (Exhibit 9). In 1988, the number of tier-1 suppliers stood at 30,000. By 2000, only 5,600 remained, and by 2015, 2,800. This process has helped to streamline the supplier base, improving overall company capabilities and increasing the quality and value that the industry delivers.
“ For suppliers, Industry 4.0 is an opportunity, but also a challenge. It can imply a real change in the relationship between OEM and supplier since the OEM will have more transparency on the suppliers’ operations.” Marco Stella, Anfia (Tubi Style)
24 Five trends transforming the supplier industry
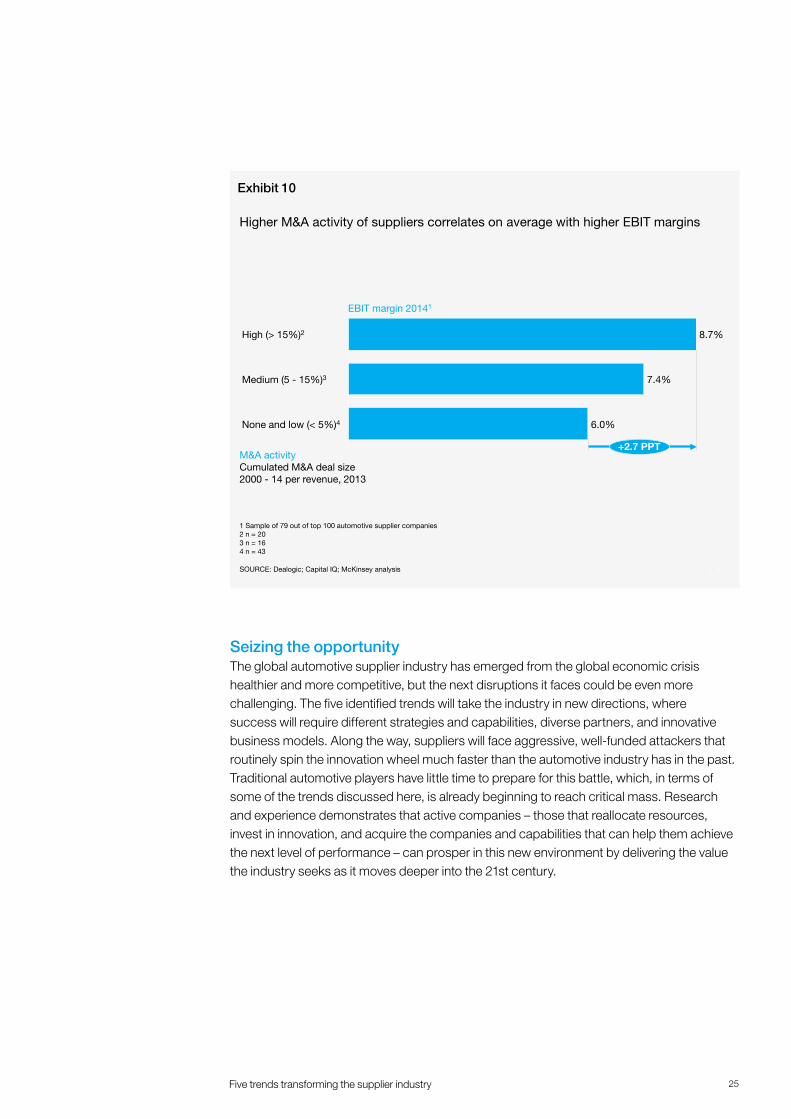
McKinsey examined the EBIT margins of three supplier segments – companies with low, medi-um, and high M&A activity – and found that companies that spend more on M&A generated higher operating profits than those that spend less (Exhibit 10). Those with high M&A activity registered nearly 2 percentage-point-larger EBIT margins. Given the urgent need to take on new skills, resources, and talent within the industry, leaders should consider this good news.
Viewed across regions, automotive suppliers in North America, Asia, and Europe all saw rel-atively similar revenue shares in 2013, but the regional distribution of M&A deal value skewed heavily toward Europe (Exhibit 11). The analysis revealed that although European suppliers contributed only 36 percent of the global revenues, they accounted for 67 percent of the M&A deals – of which large German suppliers made up over half of the region’s deal value during the period under review (2000 to 2014). Asia, in contrast, accounted for 35 percent of the revenues, but only 13 percent of the M&A deals. Part of Asia’s underperformance in share of M&A deals resulted from Japanese suppliers, which contributed more than a quar-ter of the region’s total revenue, but only 10 percent of the deal value. North America had a revenue share of 29 percent and was responsible for 20 percent of the M&A deals.
10|
Automotive supplier M&A activity in terms of transaction volume picked up again in 2014 and continued with strong momentum in 2015
SOURCE: Dealogic; McKinsey analysis; McKinsey Supplier Database
0
10
20
30
4040
20
0
10
30
05 11
5
323
232
7
0403
5
2001
11
09 10 1302
2
7
12 14
Number of transactions
2015
3
9
284
06
Transaction volume1
EUR billions
07
3
87
08
185
1 Only deals with disclosed transaction volume ≥ EUR 50 million with stake acquired > 20%; no buybacks included in sample2 Incl. EUR 11 billion Continental/Siemens VDO deal 3 Incl. EUR 22 billion Schaeffler/Continental deal4 Incl. EUR 9 billion ZF/TRW deal5 Until August 2015, incl. total revenue of JV JCI/Yanfeng of ~ EUR 7.1 billion
M&A transactions ≥ EUR 50 million in automotive supplier industry (only publicly disclosed deal volume)
Dot-com bubble
Financial crisis
Exhibit 9
25Five trends transforming the supplier industry
Seizing the opportunity The global automotive supplier industry has emerged from the global economic crisis healthier and more competitive, but the next disruptions it faces could be even more challenging. The five identified trends will take the industry in new directions, where success will require different strategies and capabilities, diverse partners, and innovative business models. Along the way, suppliers will face aggressive, well-funded attackers that routinely spin the innovation wheel much faster than the automotive industry has in the past. Traditional automotive players have little time to prepare for this battle, which, in terms of some of the trends discussed here, is already beginning to reach critical mass. Research and experience demonstrates that active companies – those that reallocate resources, invest in innovation, and acquire the companies and capabilities that can help them achieve the next level of performance – can prosper in this new environment by delivering the value the industry seeks as it moves deeper into the 21st century.
11|
M&A activityCumulated M&A deal size 2000 - 14 per revenue, 2013
Higher M&A activity of suppliers correlates on average with higher EBIT margins
SOURCE: Dealogic; Capital IQ; McKinsey analysis
8.7%
None and low (< 5%)4
7.4%
6.0%
+2.7 PPT
Medium (5 - 15%)3
High (> 15%)2
1 Sample of 79 out of top 100 automotive supplier companies 2 n = 20 3 n = 164 n = 43
EBIT margin 20141
Exhibit 10

26 Performance and disruption
ANSWERING TOMORROW’S
QUESTIONS
3
27Answering tomorrow’s questions
As the trends described here gain traction, they will have a transformative impact on the ways suppliers do business, opening new competitive frontiers and creating high levels of uncertainty. Going forward, company leaders need to prepare answers to a number of critical new questions that surround each of the seven impact dimensions these disrup-tions will likely trigger.
The battle for talent. Do you have access to the talent needed to identify relevant technolo-gies and materials and achieve strategic goals?
The portfolio optimization challenge. Are you reallocating resources in line with a clear product road map that reflects the overall strategy?
The battle for new profit pools. Do you have a strategy to deal with new entrants in the market?
New players entering with lasting impact. Do you have a clear understanding of critical control points in the changing value chain, and are you clear about the role you want to play in this value chain?
The shift in successful business building. Can your organizational design accommodate new business models? Does your organization have the mindset to move from “classic hardware” to usage-based products (e.g., navigation and entertainment)?
Industry 4.0 entering the production process. Are you prepared to drive performance with advanced manufacturing technologies?
The race for attractive targets. Do you have a dedicated M&A strategy, and where do you plan to invest in the coming decade?
Suppliers have already taken action on many of these questions. Some have acquired advanced technologies such as driver assistance software and navigation technology. Others have entered the software engineering and integration services areas to benefit from the growth of the Internet of Things or formed partnerships with high-tech players to transform the media experience for connected cars. Still others are developing new business models and introducing fully automated warehouse control systems to increase plant efficiency.
The five trends will have a unique impact on different suppliers depending on the compo-nent groups in their portfolios and their capabilities, performance, size, and regional focus. Despite real differences, suppliers can employ a generalized three-step strategy to seize opportunities:
Create transparency. Evaluate the potential effects of the most relevant disruptive trends across the seven dimensions as they affect suppliers.
Make choices. Develop a strategy to seize identified opportunities by, for example, actively looking for a complementary partner who might be a new entrant. And boost the organi-zation’s ability to mitigate risks (e.g., redesign the organization’s recruitment strategy to win the race for talent).
28 Answering tomorrow’s questions
Ensure delivery. Build implementation capabilities that address known success factors. These factors include establishing strong ownership for, and commitment to, the initia-tive’s success; allocating appropriate resources; and putting effective performance man-agement practices in place.
Following a severe economic downturn, the future for automotive suppliers remains uncertain. Disruptive new technologies are entering the vehicle product mix and innova-tive, resourceful attackers are invading the value chain. However, it would be a mistake to underestimate the supplier industry’s resilience in the face of these disruptions given its track record in emerging from the global financial crisis stronger and more profitable than ever. Nonetheless, industry leaders need to act now to position their companies to meet tomor-row’s challenges and thrive in what will soon become a transformed automotive landscape.


Advanced IndustriesMarch 2016Copyright © McKinsey & Company, Inc. Design contact: Visual Media Europewww.mckinsey.com
Authors:
Dr. Dirk Breitschwerdt is a Principal in McKinsey’s Munich office.Dr. Andreas Cornet is a Director in McKinsey’s Munich office.Dr. Lukas Michor is an Engagement Manager in McKinsey’s Vienna office.Dr. Nicolai Müller is a Director in McKinsey’s Cologne office.Lionel Salmon is an Associate Principal in McKinsey’s Paris office.
If you have any queries, please contact:
Anna PelzerPhone: +49 (89) 5594-8286E-mail: [email protected]