Embed Size (px)
Citation preview
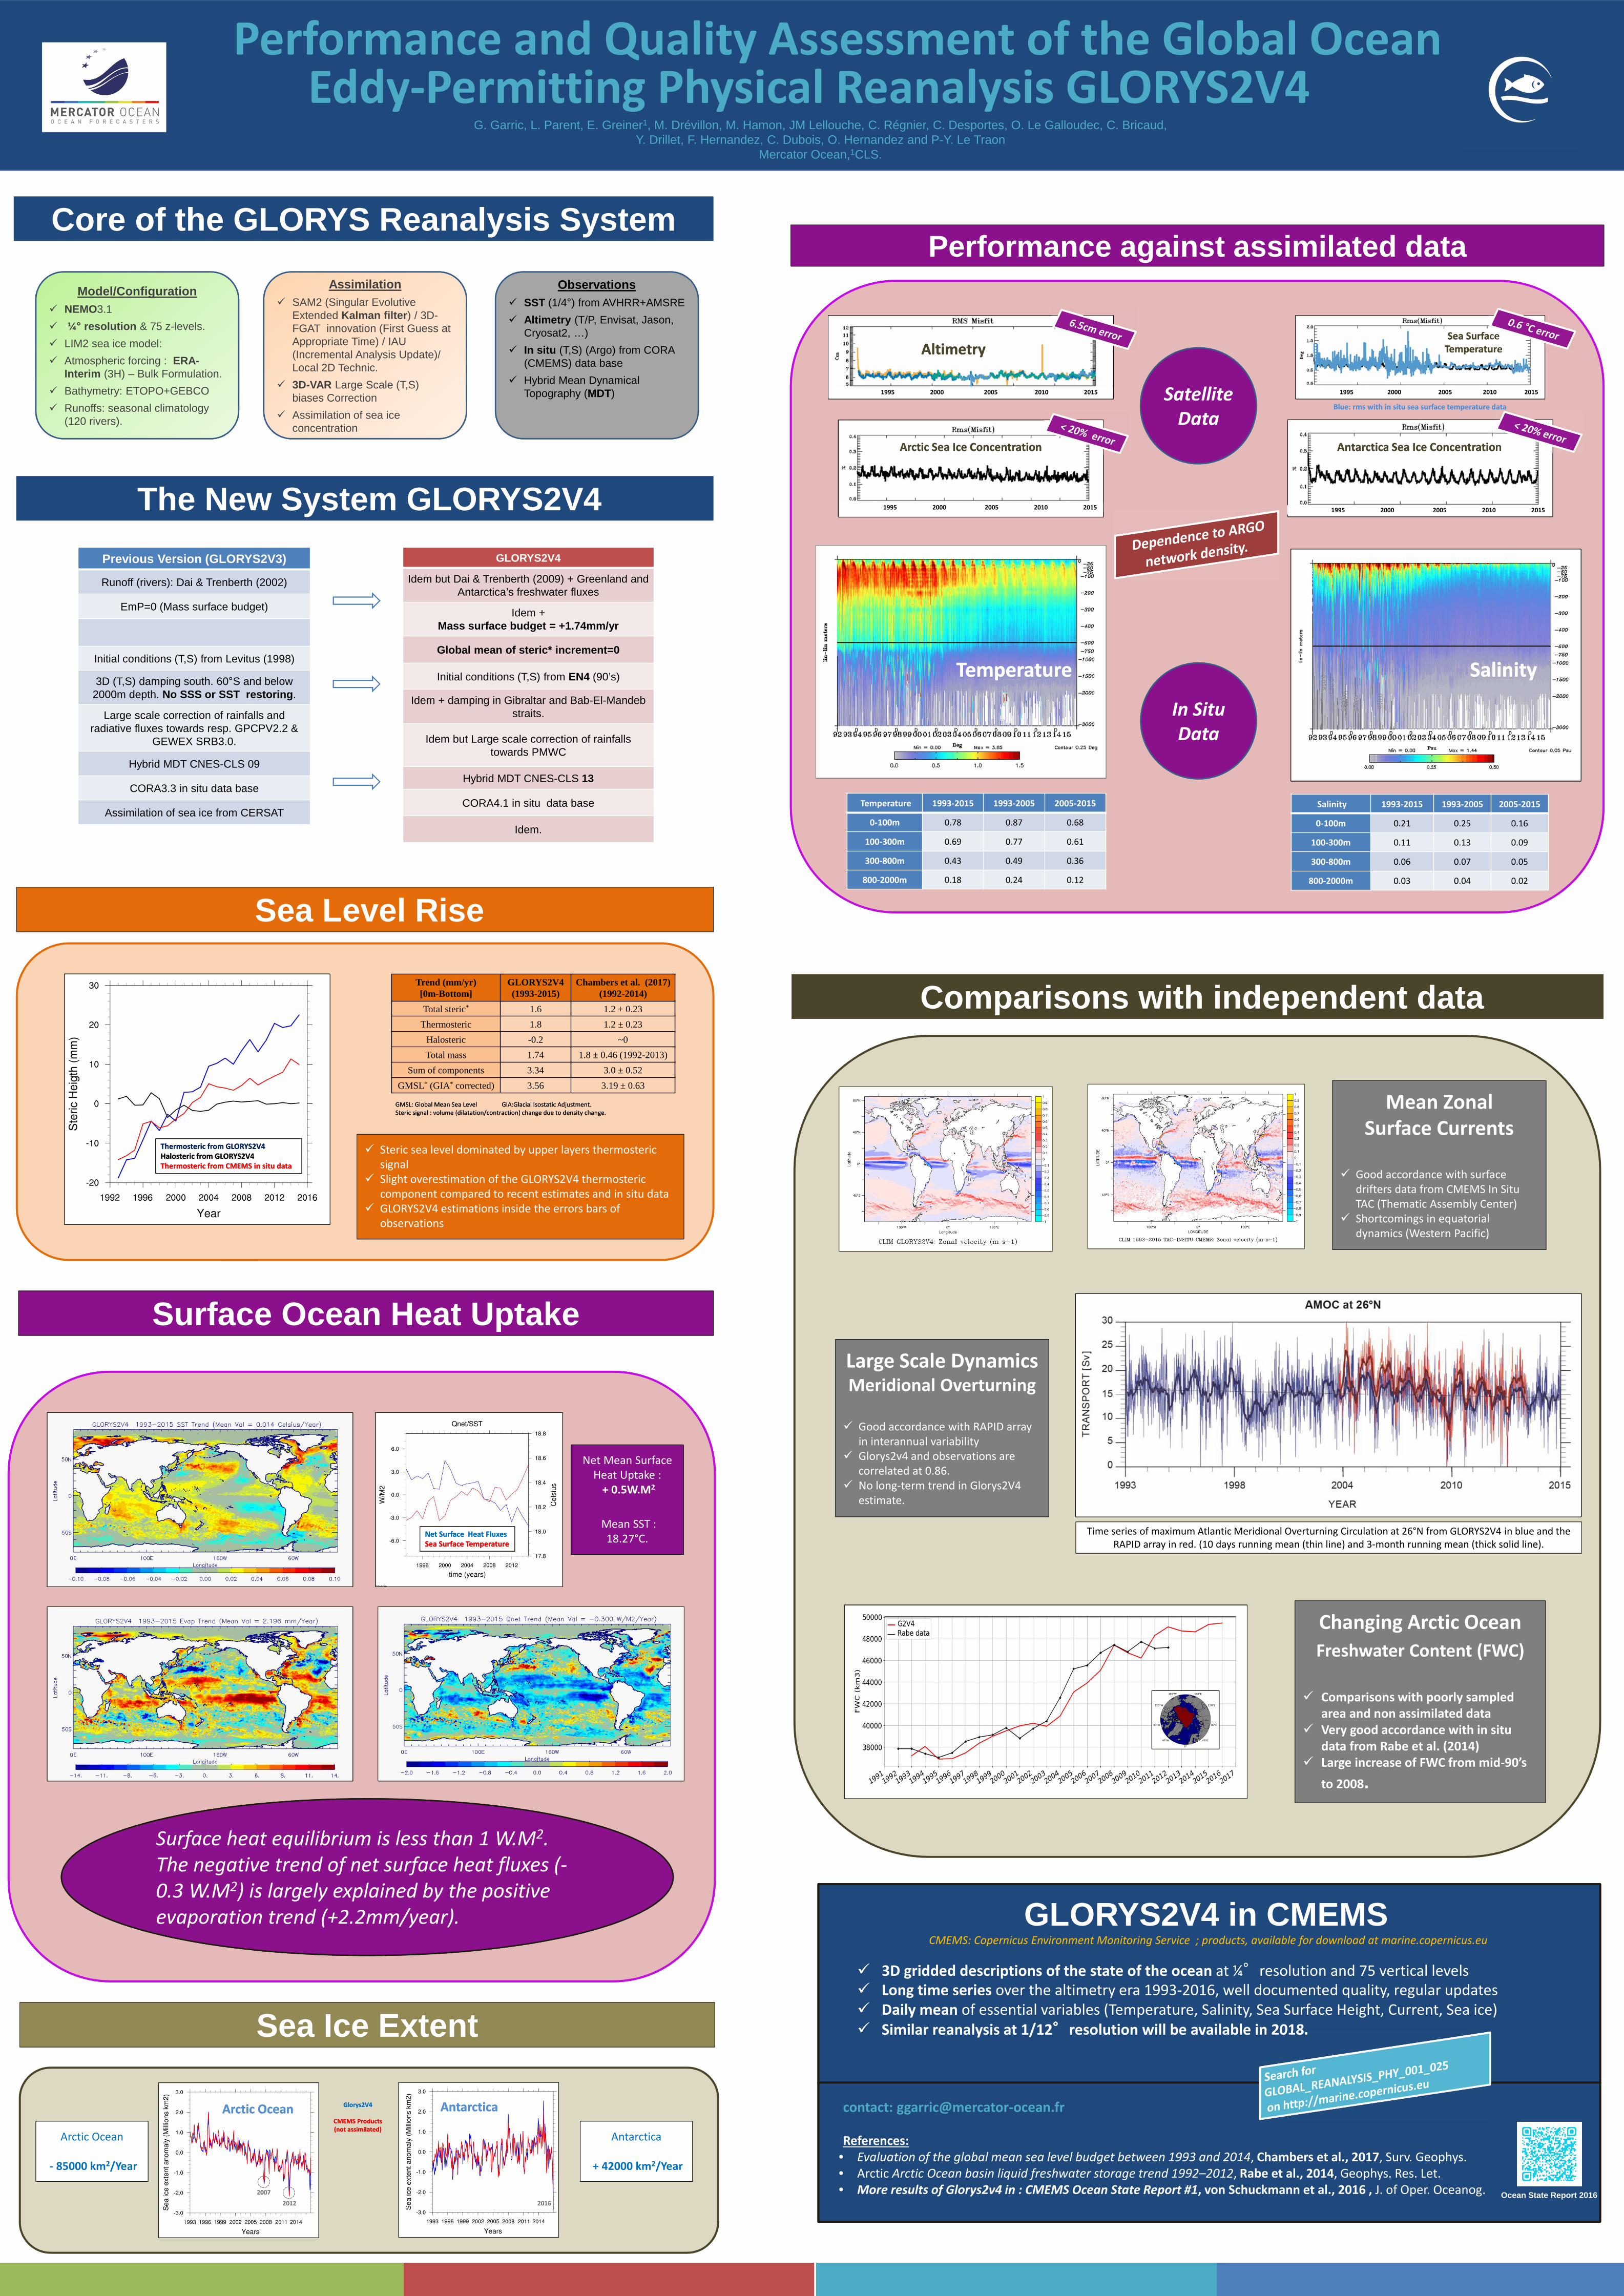
Performance against assimilated data
GLORYS2V4 in CMEMS
Surface Ocean Heat Uptake
� 3D gridded descriptions of the state of the ocean at ¼°resolution and 75 vertical levels
� Long time series over the altimetry era 1993-2016, well documented quality, regular updates
� Daily mean of essential variables (Temperature, Salinity, Sea Surface Height, Current, Sea ice)
� Similar reanalysis at 1/12°°°°resolution will be available in 2018.
Performance and Quality Assessment of the Global Ocean Eddy-Permitting Physical Reanalysis GLORYS2V4
G. Garric, L. Parent, E. Greiner1, M. Drévillon, M. Hamon, JM Lellouche, C. Régnier, C. Desportes, O. Le Galloudec, C. Bricaud, Y. Drillet, F. Hernandez, C. Dubois, O. Hernandez and P-Y. Le Traon
Mercator Ocean,1CLS.
Core of the GLORYS Reanalysis System
Sea Level Rise
Ocean State Report 2016
contact: [email protected]
References:
• Evaluation of the global mean sea level budget between 1993 and 2014, Chambers et al., 2017, Surv. Geophys.
• Arctic Arctic Ocean basin liquid freshwater storage trend 1992–2012, Rabe et al., 2014, Geophys. Res. Let.
• More results of Glorys2v4 in : CMEMS Ocean State Report #1, von Schuckmann et al., 2016 , J. of Oper. Oceanog.
CMEMS: Copernicus Environment Monitoring Service ; products, available for download at marine.copernicus.eu
Surface heat equilibrium is less than 1 W.M2.
The negative trend of net surface heat fluxes (-
0.3 W.M2) is largely explained by the positive
evaporation trend (+2.2mm/year).
Previous Version (GLORYS2V3)
Runoff (rivers): Dai & Trenberth (2002)
EmP=0 (Mass surface budget)
Initial conditions (T,S) from Levitus (1998)
3D (T,S) damping south. 60°S and below2000m depth. No SSS or SST restoring .
Large scale correction of rainfalls and radiative fluxes towards resp. GPCPV2.2 &
GEWEX SRB3.0.
Hybrid MDT CNES-CLS 09
CORA3.3 in situ data base
Assimilation of sea ice from CERSAT
GLORYS2V4
Idem but Dai & Trenberth (2009) + Greenland and Antarctica’s freshwater fluxes
Idem + Mass surface budget = +1.74mm/yr
Global mean of steric* increment=0
Initial conditions (T,S) from EN4 (90’s)
Idem + damping in Gibraltar and Bab-El-Mandebstraits.
Idem but Large scale correction of rainfallstowards PMWC
Hybrid MDT CNES-CLS 13
CORA4.1 in situ data base
Idem.
The New System GLORYS2V4
Temperature 1993-2015 1993-2005 2005-2015
0-100m 0.78 0.87 0.68
100-300m 0.69 0.77 0.61
300-800m 0.43 0.49 0.36
800-2000m 0.18 0.24 0.12
Trend (mm/yr)[0m-Bottom]
GLORYS2V4 (1993-2015)
Chambers et al. (2017) (1992-2014)
Total steric* 1.6 1.2 ± 0.23
Thermosteric 1.8 1.2 ± 0.23
Halosteric -0.2 ~0
Total mass 1.74 1.8 ± 0.46 (1992-2013)
Sum of components 3.34 3.0 ± 0.52
GMSL* (GIA* corrected) 3.56 3.19 ± 0.63
Time series of maximum Atlantic Meridional Overturning Circulation at 26°N from GLORYS2V4 in blue and the
RAPID array in red. (10 days running mean (thin line) and 3-month running mean (thick solid line).
Model/Configuration� NEMO3.1
� ¼° resolution & 75 z-levels.
� LIM2 sea ice model:
� Atmospheric forcing : ERA-Interim (3H) – Bulk Formulation.
� Bathymetry: ETOPO+GEBCO
� Runoffs: seasonal climatology(120 rivers).
Assimilation� SAM2 (Singular Evolutive
Extended Kalman filter ) / 3D-FGAT innovation (First Guess at Appropriate Time) / IAU (Incremental Analysis Update)/ Local 2D Technic.
� 3D-VAR Large Scale (T,S) biases Correction
� Assimilation of sea iceconcentration
Observations� SST (1/4°) from AVHRR+AMSRE
� Altimetry (T/P, Envisat, Jason, Cryosat2, …)
� In situ (T,S) (Argo) from CORA (CMEMS) data base
� Hybrid Mean DynamicalTopography (MDT)
TemperatureTemperature SalinitySalinity
Satellite
Data
In Situ
Data
Salinity 1993-2015 1993-2005 2005-2015
0-100m 0.21 0.25 0.16
100-300m 0.11 0.13 0.09
300-800m 0.06 0.07 0.05
800-2000m 0.03 0.04 0.02
AltimetryAltimetrySea Surface
Temperature
Sea Surface
Temperature
Arctic Sea Ice ConcentrationArctic Sea Ice Concentration Antarctica Sea Ice ConcentrationAntarctica Sea Ice Concentration
Comparisons with independent dataComparisons with independent data
� Steric sea level dominated by upper layers thermosteric
signal
� Slight overestimation of the GLORYS2V4 thermosteric
component compared to recent estimates and in situ data
� GLORYS2V4 estimations inside the errors bars of
observations
GMSL: Global Mean Sea Level GIA:Glacial Isostatic Adjustment.
Steric signal : volume (dilatation/contraction) change due to density change.
GMSL: Global Mean Sea Level GIA:Glacial Isostatic Adjustment.
Steric signal : volume (dilatation/contraction) change due to density change.
Thermosteric from GLORYS2V4
Halosteric from GLORYS2V4
Thermosteric from CMEMS in situ data
Thermosteric from GLORYS2V4
Halosteric from GLORYS2V4
Thermosteric from CMEMS in situ data
Mean Zonal
Surface Currents
� Good accordance with surface
drifters data from CMEMS In Situ
TAC (Thematic Assembly Center)
� Shortcomings in equatorial
dynamics (Western Pacific)
Large Scale Dynamics Meridional Overturning
� Good accordance with RAPID array
in interannual variability
� Glorys2v4 and observations are
correlated at 0.86.
� No long-term trend in Glorys2V4
estimate.
Changing Arctic Ocean
Freshwater Content (FWC)
� Comparisons with poorly sampled
area and non assimilated data
� Very good accordance with in situ
data from Rabe et al. (2014)
� Large increase of FWC from mid-90’s
to 2008.
Blue: rms with in situ sea surface temperature dataBlue: rms with in situ sea surface temperature data
Net Mean Surface
Heat Uptake :
+ 0.5W.M2
Mean SST :
18.27°C.Net Surface Heat Fluxes
Sea Surface Temperature
Net Surface Heat Fluxes
Sea Surface Temperature
Sea Ice Extent
Glorys2V4
CMEMS Products
(not assimilated)
Glorys2V4
CMEMS Products
(not assimilated)
Arctic OceanArctic Ocean AntarcticaAntarctica
Arctic Ocean
- 85000 km2/Year
Antarctica
+ 42000 km2/Year
20072007
20122012 20162016
1995 2000 2005 2010 2015
1995 2000 2005 2010 2015 1995 2000 2005 2010 2015
1995 2000 2005 2010 2015