Embed Size (px)
Citation preview

PERFORMANCE BENCHMARKPOSTGRESQL / MONGODB
PERFORMANCE BENCHMARKPOSTGRESQL / MONGODB
2/46
// CONTENTS
// ABOUT THIS BENCHMARK 3Introduction 3OnGres Ethics Policy 4Authors 4// EXECUTIVE SUMMARY. BENCHMARKS KEY FINDINGS 5Transactions benchmark 5OLTP Benchmark 6OLAP Benchmark 6// METHODOLOGY AND BENCHMARKS 7Introduction and objectives 7Benchmarks performed 7About the technologies involved 8Automated infrastructure 9// TRANSACTIONS BENCHMARK 12Benchmark description 12MongoDB transaction limitations 14Discussion on transaction isolation levels 14Benchmark results 17// OLTP BENCHMARK 25Benchmark description 25Initial considerations 26Benchmark results 29// OLAP BENCHMARK 38 Benchmark description 38Benchmark results 45
PERFORMANCE BENCHMARKPOSTGRESQL / MONGODB
3/46
// ABOUT THIS BENCHMARK
IntroductionBenchmarking is hard. Benchmarking databases, harder. Benchmarking databases that follow different approaches (relational vs document) is even harder. There are many reasons why this is true, widely discussed in the industry.
Notwithstanding all these difficulties, the market demands these kinds of benchmarks. Despite the different data models that MongoDB and PostgreSQL expose, many developers and organizations face a challenge when choosing between the platforms. And while they can be compared on many fronts, performance is undoubtedly one of the main differentiators — arguably the main one.
How then do you leverage an informative benchmark so that decisions can be made about the choice of a given technology, while at the same time presenting a fair arena in which the technologies compete in an apples-to-apples scenario? To fulfill these goals, this benchmark has been executed based on the following criteria:
• Transparency and reproducibility. The framework that has been programmed and used to run the benchmarks is fully automated and is published as open source. Anyone may use the same tools, and reproduce the same results. Or change parameters and configurations and derive your own. Since it is designed to run on a public cloud, it’s available to anyone. Both public and generated datasets have been used.
• Multiple benchmarks. Picking a single benchmark or benchmark type presents results only from one perspective. This benchmark includes tests on OLTP-like workloads, OLAP-like workloads, and benchmarks specific to transactions.
• Fairness. It’s hard to assess fairness, especially when one database is more “native” on a given test or benchmark technology. But both databases are quite “multi-modal” as of today: PostgreSQL supports documents with its jsonb data type, and MongoDB supports “relational” workloads with its joins ($lookup) and transaction support. Similarly, there are benchmarks that are more suited for one or the other model. The exercised features are then only those that are common across databases and/or clearly advertised as such.
• Detailed analysis. This white paper includes a detailed analysis of each result. All the tests were run with system monitoring information in parallel, to capture runtime information that may help inform the results discussion.
PERFORMANCE BENCHMARKPOSTGRESQL / MONGODB
4/46
OnGres Ethics PolicyThis benchmark was conducted by OnGres (www.ongres.com), according to OnGres Ethics Policy. EnterpriseDB (www.enterprisedb.com) sponsored the work.
The policy guarantees that the following requisites are observed:
• No technology is favored over another.
• No results are edited or omitted.
• The sponsor of the work does not intervene in the strategy, implementation or execution of the work.
• Results are verifiable by external, third parties.
• All the work is conducted with the maximum degree of professionalism and independence.
Disclaimer. OnGres is a company expert in PostgreSQL, and as such may show a higher degree of knowledge of Postgres-based systems.
AuthorsProject Director: Álvaro Hernández Tortosa [email protected]
DBAs and developers: Francis del Carmen Santiago Cermeño, Emanuel Calvo, Gerardo Herzig, Sergio Alejandro Ostapowicz, Matteo Melli, Jorge Daniel Fernández.
{fcsantiago,emanuel,saomec,gerardo.herzig,matteom,jorgedf}@ongres.com

PERFORMANCE BENCHMARKPOSTGRESQL / MONGODB
5/46
// EXECUTIVE SUMMARY: BENCHMARKS KEY FINDINGSThe goal of this benchmark project is to compare the performance of PostgreSQL and MongoDB Community Server on several different workloads, while trying to make them resemble production scenarios as much as possible. Another goal of the benchmark is to automate all the benchmark infrastructure so that results can be easily reproduced by third parties. All the software has been published as open source.
Three benchmarks have been considered:
• Transaction benchmark. A custom-developed benchmark, inspired by MongoDB Pymongo-Transactions Project, that models an airline reservation system.
• Sysbench for OLTP workloads, considering both in-memory and 2TB datasets.
• A JSON-based OLAP benchmark measuring query performance on four custom-written queries over 1 year of GitHub archive data, using jsonb in PostgreSQL.
PostgreSQL 11 was found to be faster than MongoDB 4.0 in almost every benchmark. Throughput was higher, ranging from dozens of percent points up to one and even two orders of magnitude on some benchmarks. Latency, when measured by the benchmark, was also lower on PostgreSQL.
More detailed findings for the three benchmarks can be summarized as follows in the next subsections.
Transactions benchmark • MongoDB without using transactions runs on the equivalent of READ UNCOMMITTED
isolation mode. This allows phenomena like non-consistent reads, skipped documents on a query or reading data that is not durable to happen. Avoiding these inconsistencies puts significant burden on the application developer.
• MongoDB with transactions offers SERIALIZABLE isolation guarantees. PostgreSQL has been tested both with READ COMMITTED and SERIALIZABLE isolation levels. MongoDB was found to be one order of magnitude (4x-15x) slower than PostgreSQL on READ COMMITTED; or 4-14x slower compared to PostgreSQL on SERIALIZABLE –when comparing exactly the same level of isolation guarantees provided. PostgreSQL SERIALIZABLE is a bit slower than READ COMMITTED, but not by much. PostgreSQL processes more than 20 thousand transactions per second when MongoDB doesn’t reach 2 thousand.

PERFORMANCE BENCHMARKPOSTGRESQL / MONGODB
6/46
• PostgreSQL latencies are under 50ms for the 99% percentile, and as low as less than 1 millisecond. Under all concurrency levels, half of the transactions (median) take less than 10ms. MongoDB latencies are significantly higher: median latency is 5-20 times higher than that of PostgreSQL; and 99 percentile is 7-17 times worse. MongoDB minimum median latency is 5ms in the best case (without concurrency) and spikes to hundreds of milliseconds on several scenarios.
OLTP Benchmark • PostgreSQL performance depends heavily on the number of concurrent users
(connections). When tuned for the optimal number of connections, it performs very well, but performance drops if it is overwhelmed with connections. PgBouncer or some other similar connection pooler is recommended. In this case, PostgreSQL performance is stable close to the maximum performance. This is a recommended pattern in production.
• For the XL test (2TB database, doesn’t fit in memory), PostgreSQL outperforms MongoDB in every scenario. If PgBouncer is used, it is between 25x-40x times faster.
• For the in-memory test (4GB database, fits in memory), PostgreSQL outperforms MongoDB by a factor of 2-3x. This applies both to XFS and ZFS filesystems.
If PostgreSQL is run without PgBouncer, then it is only faster than MongoDB when used under the optimal number of concurrent users, but this is not recommended. When that number grows, it becomes slower by a factor of 3-4x.
OLAP BenchmarkA 200M records dataset of JSON documents was loaded in MongoDB natively and in PostgreSQL using the jsonb datatype. Appropriate indexes where created on both databases.
Four queries were run. PostgreSQL was found to be between 35-53% faster on three of the four queries, and 22% slower on the other query.
Future work here may involve re-running the benchmark again with TB-sized datasets typical of OLAP/BI workloads. And also a new test where the JSON data would be transformed into a normalized, relational schema using plain SQL (no jsonb) in PostgreSQL. Based on previous existing work, this could lead to significantly faster queries on PostgreSQL, and would model more closely the reality, where a proper relational schema would be designed. See detailed OLAP conclusions for more information.

PERFORMANCE BENCHMARKPOSTGRESQL / MONGODB
7/46
// METHODOLOGY AND BENCHMARKS
Introduction and objectivesThis project was designed to do a performance comparison between PostgreSQL 11.1 and MongoDB 4.0. The main goal is to analyze their capabilities and performance in the same data design, with different active dataset sizes and also, testing the performance of transactions.
Databases aren’t excluded from any of the inherent complexities of running comparisons, especially when engines are scoped for different purposes or systems or have different sets of features and driver availability.
Both MongoDB and PostgreSQL have different engines and concepts as languages, making both systems completely different, yet sometimes they are used for the same purpose but to take advantage of their specific features.
The results of general tools such as YCSB and Sysbench might need to be considered with some reservations as drivers work differently and report and behave differently. Otherwise, all the tool configurations were replicated to all tests, done programmatically and verified and validated through several runs.
Certain configurations, code and techniques may be improved upon by other experts. While the results may be challenged, they were validated by peers and repeated tests that drive the numbers shown in this report. We welcome this and hope that our open source approcach will facilitate it.
Benchmarks performedThere were three main types of benchmarks performed:
• Transactions benchmark. Test the new MongoDB 4.0 capabilities in running multi-document ACID transactions, measuring performance and latency.
• OLTP. Query performance and latency, on in-memory and bigger (2TB) datasets, for small operations from a varying degree of concurrent users.
• OLAP. Performance (duration) of 4 long-running queries over a large dataset.
Both MongoDB and PostgreSQL were used in single-node configuration, with replication and journaling active. MongoDB sharding was not used as transactions across shards are not supported on 4.0. It is left as a future benchmark to compare performance between

PERFORMANCE BENCHMARKPOSTGRESQL / MONGODB
8/46
sharding on MongoDB and PostgreSQL sharding solutions, including transaction support once it is available for MongoDB shards.
About the technologies involved
PostgreSQL 11PostgreSQL is a powerful, open-source object-relational database system that uses and extends the SQL language combined with many features that safely store and scale the most complicated data workloads. PostgreSQL originated in 1986 as part of the POSTGRES project at the University of California at Berkeley and now has more than 30 years of active development on the core platform.
PostgreSQL has earned a strong reputation for its proven architecture, reliability, data integrity, robust feature set and extensibility. The software has the dedication of the open-source community for its consistency in delivering performant and innovative solutions. PostgreSQL runs on all major operating systems, has been ACID-compliant since 2001 and has powerful add-ons such as the popular PostGIS geospatial database extender. It is no surprise that PostgreSQL has become the open-source relational database of choice for many people and organizations.
It is transactional by default (and it does not support read uncommitted isolation). It supports a wide variety of data types, including jsonb (a binary format of json), which is used in one of the benchmarks for using OLAP queries imitating MongoDB.
For datasets in memory, it is possible to access in-memory columnar data stores in Postgres through Cstore, as a mechanism to speed up aggregations in memory. It is not included in the vanilla distribution, and is not used in this benchmark. But as with many other pluggable extensions it can be attached to the Postgres instance with very few steps.
MongoDB 4.0MongoDB Community Server1 version 4.0 was used for all the benchmarks.
MongoDB is a Document Store database which allows you to store data in flexible, JSON-like documents, meaning fields can vary from document to document and data structure can be changed over time.
1 MongoDB Enterprise Subscription agreement expressly prohibits “publicly disseminate per-formance information or analysis including, without limitation benchmarking test results” (see https://www.mongodb.com/subscription-and-services-agreement-february-2014 § 3.3.f)
PERFORMANCE BENCHMARKPOSTGRESQL / MONGODB
9/46
One of the strongest features is that the document model maps to the objects in your application code, making data easy to work with.
Version 4.0 has new aggregation capabilities and transaction support, which enriches the analytics and allows multi document consistency.
MongoDB is a distributed database at its core, so high availability, horizontal scaling and geographic distribution are built in and easy to use. It is worth mentioning that the engine tested in the current document is WiredTiger, which is the default. MongoDB supports pluggable engines, and there is an engine available in the enterprise version for in-memory datasets.
Cloud provider: Amazon Web Services (AWS)For running the benchmarks, AWS was chosen since it is considered the most popular among the cloud providers. For choosing the resources for the benchmarks, only stable instance types have been chosen (mid- to high-end tier machines).
For isolating the impact of the client, all the tests have been driven under a client/server infrastructure, allowing it to isolate the database from any noise coming from the client.
Automated infrastructureBy design, all benchmarks have been designed to be run automatically and programmatically. The modern pattern IaC (“Infrastructure As Code”) was used. The goal is to make all tests easily reproducible by third parties. All the code used is published as open source and resides in two repositories:
• Benchmark platform: code to automate running all the benchmarks: https://gitlab.com/ongresinc/benchplatform
• Transactions benchmark: https://gitlab.com/ongresinc/txbenchmark
The automated infrastructure has been coded in Terraform, with a side-by-side equal infrastructure setup for all the engines. Setting this up from scratch only requires placing an .env file in the root directory at the repository and running the make setup command for deploying the reproducible benchmarks.
Load and Run phases have been automated, so all the snapshots are fully reproducible in code. Also, the results can be found and explored in the S3 endpoint, organized by target and benchmark id (uuid).

PERFORMANCE BENCHMARKPOSTGRESQL / MONGODB
10/46
All the benchmarks used the following instance type:
Client Specs
Model vCPU* Mem (GiB) Storage (GiB)
Dedicated EBSBandwidth
(Mbps)
Network Performance
(Gbps)c5.xlarge 4 8 EBS-Only Up to 3,500 Up to 10
Clients do not have attached volumes.
Datanode Specs
Model vCPU* Mem (GiB) Storage (GiB)
Dedicated EBS Bandwidth
(Mbps)
Network Performance
(Gbps)m5.4xlarge 16 64 EBS-only 3,500 Up to 10
Data volume: io1, with number of reserved IOPS depending on the test.
All m5 instances have the following specs:
• Up to 3.1 GHz Intel Xeon Platinum Processor
• Intel AVX†, Intel AVX2†, Intel Turbo
• EBS Optimized
• Enhanced Networking†
MongoDB configurationThe only configuration that has been set up is the data directory, which is to be used in an isolated volume (/opt/data). In general, MongoDB does not require or benefit from significant tuning.
PERFORMANCE BENCHMARKPOSTGRESQL / MONGODB
11/46
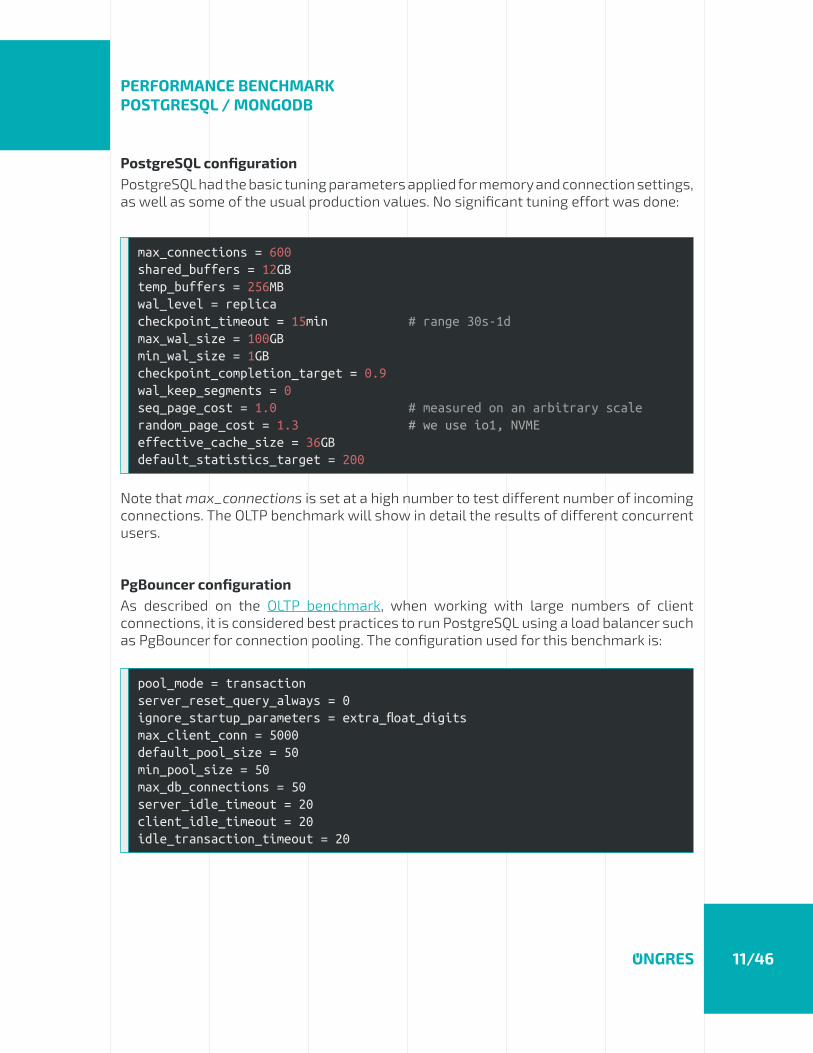
PostgreSQL configurationPostgreSQL had the basic tuning parameters applied for memory and connection settings, as well as some of the usual production values. No significant tuning effort was done:
max_connections = 600shared_buffers = 12GB temp_buffers = 256MBwal_level = replica checkpoint_timeout = 15min # range 30s-1dmax_wal_size = 100GBmin_wal_size = 1GBcheckpoint_completion_target = 0.9wal_keep_segments = 0seq_page_cost = 1.0 # measured on an arbitrary scalerandom_page_cost = 1.3 # we use io1, NVMEeffective_cache_size = 36GBdefault_statistics_target = 200
Note that max_connections is set at a high number to test different number of incoming connections. The OLTP benchmark will show in detail the results of different concurrent users.
PgBouncer configurationAs described on the OLTP benchmark, when working with large numbers of client connections, it is considered best practices to run PostgreSQL using a load balancer such as PgBouncer for connection pooling. The configuration used for this benchmark is:
pool_mode = transactionserver_reset_query_always = 0ignore_startup_parameters = extra_float_digitsmax_client_conn = 5000default_pool_size = 50min_pool_size = 50max_db_connections = 50server_idle_timeout = 20client_idle_timeout = 20idle_transaction_timeout = 20
PERFORMANCE BENCHMARKPOSTGRESQL / MONGODB
12/46
// TRANSACTIONS BENCHMARKMongoDB announced support for multi-document ACID transactions as one of the main features for version 4.0, if not the main one. The goal of this benchmark is to compare an ACID transactional system by default, PostgreSQL, with MongoDB 4.0 using equivalent levels of transaction isolation.
Benchmark descriptionGiven that MongoDB’s support for transactions is quite recent, there are no benchmarks ready to exercise this capability. Since sysbench industry standard benchmark was used for the OLTP benchmark, a first attempt was made to modify the code of the sysbench benchmark to add transactions support to it. The effort was not successful, however probably due to limitations in the driver used by this benchmark.
To support this analysis, a new benchmark was created from scratch, and it’s published as open source: https://gitlab.com/ongresinc/txbenchmark. It has been developed in Java with a plan to elaborate on a test/benchmark already proposed by MongoDB. In particular, it was modeled on a similar scenario to the one proposed in Introduction to MongoDB Transactions in Python, which led to the creation of the pymongo-transactions software.
The benchmark simulates users buying airline tickets, and generating the appropriate records. Instead of fully synthetic data, some real data2 was used based on the one available on the LSV site (Laboratoire Spécification et Vérification; aircrafts and airlines database). This makes the benchmark more likely to represent real-world scenarios.
It uses the most popular Java drivers for MongoDB and PostgreSQL: mongo-java- driver and PgJDBC, respectively. The code for the actual tests lives in two files, MongoFlightBenchmark.java and PostgresFlightBenchmark.java. Both databases are generated using custom scripts, and the static data (flight schedules and airplane information) is preloaded automatically, before tests are run.
The user transaction is designed to be simple, but to mimick as closely as possible a real-world case where a user is buying an airplane ticket. It is also designed to span multiple documents in order to exercise MongoDB 4.0’s new transactions features. The transaction is composed of the following commands, to be executed in order, all within a single transaction:
2 The original benchmark generated very simple data. In particular, the flight number was hard-coded to a constant value and the seats assigned were purely random.
For the benchmark that was developed, a separate table (or collection in MongoDB) was used to load real data from the LSV site containing flight data, and another one with plane data. Data is still very small (15K rows for the flight schedules, and 200 rows for the planes data).

PERFORMANCE BENCHMARKPOSTGRESQL / MONGODB
13/46
1. Select a random schedule from the table/collection. Join this (INNER JOIN in PostgreSQL, $lookup with MongoDB) with the aircraft data to obtain the capacity (seats) of the aircraft serving that schedule.
2. Insert into a seats table a user id (random), the schedule relevant data and the date (randomly generated).
3. Insert into a payments table a reference to the seats table (user id) and the payment amount (a multiple of the duration of the flight).
4. Upsert (INSERT ... ON CONFLICT DO UPDATE ... for PostgreSQL) the corresponding entry in the audit table that contains schedule, date and number of seats occupied (needs to be incremented by one).
The date assigned to the seating entry is a fixed day so there were frequent conflicts on concurrent transactions trying to update the entry in the audit table for the same (schedule, date) pair. This is expected and allows the benchmark to also exercise transaction aborts on high isolation scenarios, as well as concurrency and locking management. It has been verified that benchmark costs are not dominated by contention in this area. Appropriate indexes are created on PostgreSQL and MongoDB to optimize search on the lookup tables.
The benchmark has been performed on a client-server architecture (the Java-based benchmark tool as the client and the server being either PostgreSQL or MongoDB). Both on the same cloud AZ (Availability Zone). The filesystem used was XFS in both cases, with default options. MongoDB needs replica set to be enabled, even if running on a single node, as it is required for transactions.
The benchmark reports on three main data sets:
• Throughput (transactions per second). Tests were time-bounded (5 minutes).
• Transaction retries, converted later to % over total transactions.
• Percentiles (latency) of the transactions.

PERFORMANCE BENCHMARKPOSTGRESQL / MONGODB
14/46
MongoDB transaction limitationsMongoDB transaction support has several operational limitations that are well documented. The most relevant ones are:
• Transactions should run for shorter than 1 minute. While this time can be extended via configuration, it is recommended not to do so. Long transactions have not been exercised as part of the benchmark, but this could have been done with the developed software3.
• The oplog for the transaction cannot be larger than 16MB. That means that the transaction will fail if it inserts, modifies or deletes a lot of documents, and that changed information — formatted as an oplog, which is more verbose than the original changes — exceeds 16M.
• Write conflicts. MongoDB transactions are run in such a way that it may be frequent that two concurrent transactions experience write conflicts. When this happens, MongoDB will abort one of them. The user must retry the rolled-back transaction. This effect was found to be more frequent on MongoDB than PostgreSQL running at an equivalent isolation level (SERIALIZABLE). This is listed here as a limitation, because it puts burden on the user and lowers performance.
• Transactions are not yet available on sharded clusters4. This is not relevant on this benchmark.
Discussion on transaction isolation levelsThe “I” of ACID specifies the isolation level. Classical single-node isolation levels are well documented. The choice of a given isolation level has, however, a profound impact, both in terms of performance and, more importantly, on the data guarantees that the database will provide to the application.
MongoDB without transactions operates on an equivalent READ UNCOMMITTED isolation level. This isolation level is very weak and — apart from the obvious effects, like single-documents operations only, non-serializable operations — may cause significant undesirable behaviors, like:
• Inconsistent reads. The data you read is not “frozen” and may contain the results of concurrent operations as part of the result set.
3 The software supports a parameter –booking-sleep that makes the transaction sleep for some amount of seconds. It was set to 0 for the benchmark results shown here.
4 MongoDB announced support for transactions over sharded clusters for the upcoming MongoDB 4.2.

PERFORMANCE BENCHMARKPOSTGRESQL / MONGODB
15/46
• Skipped documents. A document being updated may not show as part of the query result, when it should.
• Reads of data that will later be deleted from the database.
Note that these effects may happen even on single-node configurations. With transactions, however, MongoDB does provide the equivalent of SERIALIZABLE isolation level, the strictest single-node isolation level. This is not always the most desirable level, as it reduces performance and produces potential transaction rollbacks that need to be re-executed. It would be desirable to implement other intermediate isolation levels. Performance characteristics of this isolation level, in comparison with PostgreSQL, are the primary concern of this benchmark.
The following table describes the isolation levels, their potential associated data phenomena, and which ones are supported by each database:
MongoDB Postgres Isolation levelDirty reads
Lost updates
Non-repeatable reads
Phan-toms
without transactions
Read Uncommitted
Read Committed
Repeatable Read
transactions Serializable
Red cells denote possible data effects under the given isolation level. Green cells denote protection from the data effects at this isolation level. On the left side of the table, white cells indicate supported isolation levels, and black indicates unsupported ones.
MongoDB is exposed to all of the possible undesirable data phenomena unless it is run with transactions, in which case it is protected against all of them. PostgreSQL offers more granular choice to the user, with three isolation levels directly implemented.
PERFORMANCE BENCHMARKPOSTGRESQL / MONGODB
16/46
MongoDB emphasizes heavily that data modeling is required. And certainly these effects can be avoided by denormalizing all the data and using the data modeling to embed all related data into the “parent” document. Since single-document operations are ACID atomic even when not using transactions, this is free from the phenomena described. However, this limits the choice of data modeling options if those phenomena want to be avoided, and comes with its own disadvantages (data duplication, more storage and I/O required, less flexibility to query related data, etc). In summary, MongoDB users can choose between the following options:
• Run multi-document operations without transactions. This exposes these operations to the effects already described, like inconsistent reads, or interleaving operations.
• Use the embed data modeling pattern everywhere, and leverage the fact that single-document transactions are ACID. This may lead to other disadvantages like data duplication.
• Use transactions, and leverage the strong guarantees provided by a SERIALIZABLE isolation level. This comes with some performance degradation, as it will be shown on the benchmark results.
PERFORMANCE BENCHMARKPOSTGRESQL / MONGODB
17/46
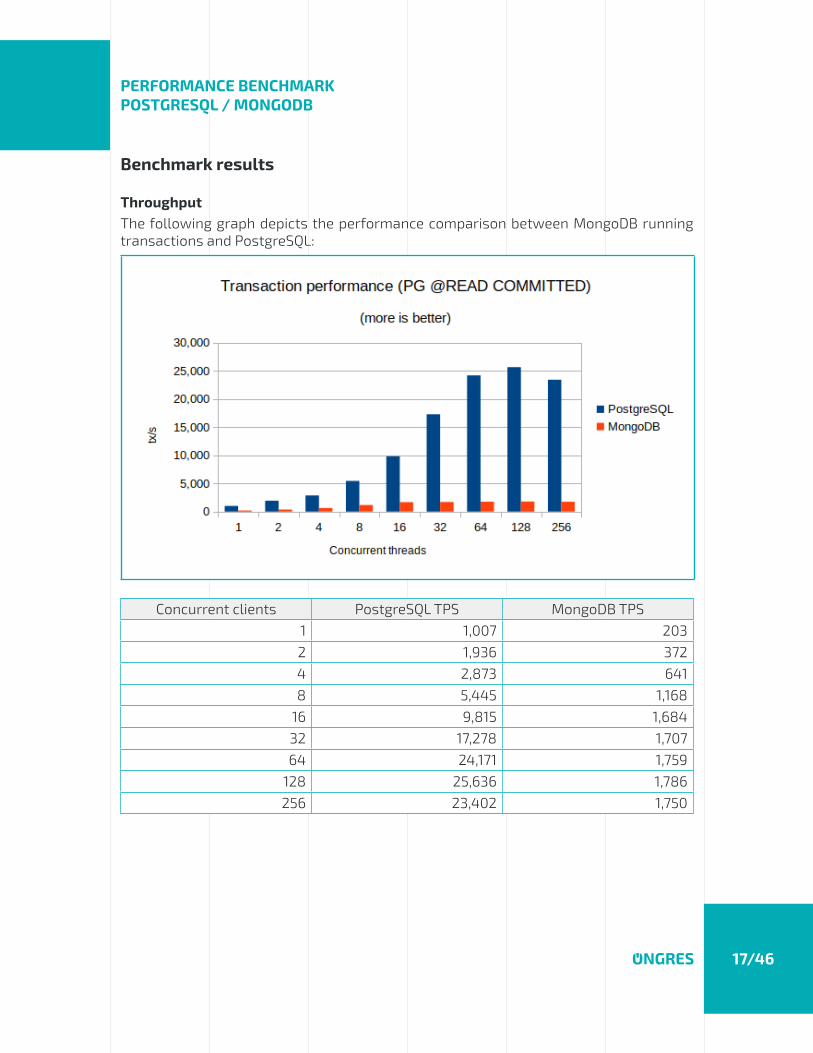
Benchmark results
ThroughputThe following graph depicts the performance comparison between MongoDB running transactions and PostgreSQL:
Concurrent clients PostgreSQL TPS MongoDB TPS1 1,007 2032 1,936 3724 2,873 6418 5,445 1,168
16 9,815 1,68432 17,278 1,70764 24,171 1,759
128 25,636 1,786256 23,402 1,750
PERFORMANCE BENCHMARKPOSTGRESQL / MONGODB
18/46
There are several relevant conclusions:
• PostgreSQL is one order of magnitude faster than MongoDB under any level of concurrency (between 4 and 15 times faster).
• The server has 16 CPUs, and it can be seen that the performance maxes out around 128 concurrent threads, in both cases. There is always more room for concurrency than the number of CPUs, while there is I/O or memory wait. But at higher levels of concurrency th e performance drops, and latency increases notably (as will be shown later). This is why a connection pooler for PostgreSQL is a good practice5. Note than in any case PostgreSQL is still more than one order of magnitude faster than MongoDB.
It could be argued that MongoDB is providing here higher isolation guarantees than PostgreSQL, which is running on READ COMMITTED isolation mode. This is true; but READ COMMITTED is the most used isolation level in PostgreSQL, and provides enough guarantees against undesirable phenomena on many situations, including this benchmark’s transaction.
5 There is a deeper discussion about the necessity for connection pooling for PostgreSQL in the OLTP Benchmark section.

PERFORMANCE BENCHMARKPOSTGRESQL / MONGODB
19/46
However, the benchmark has been also repeated for PostgreSQL running on a directly comparable isolation mode, SERIALIZABLE:
Concurrent clients PostgreSQL TPS MongoDB TPS1 993 2032 1,880 3724 2,992 6418 5,472 1,168
16 9,923 1,68432 17,915 1,70764 24,173 1,759
128 23,200 1,786256 20,994 1,750
The results do not differ significantly from the previous benchmark (PostgreSQL is still 4-14x faster). It can be seen that PostgreSQL performs on SERIALIZABLE isolation mode slower than on READ COMMITTED mode, which is expected since it provides higher guarantees. But how can this be more precisely explained?
PERFORMANCE BENCHMARKPOSTGRESQL / MONGODB
20/46
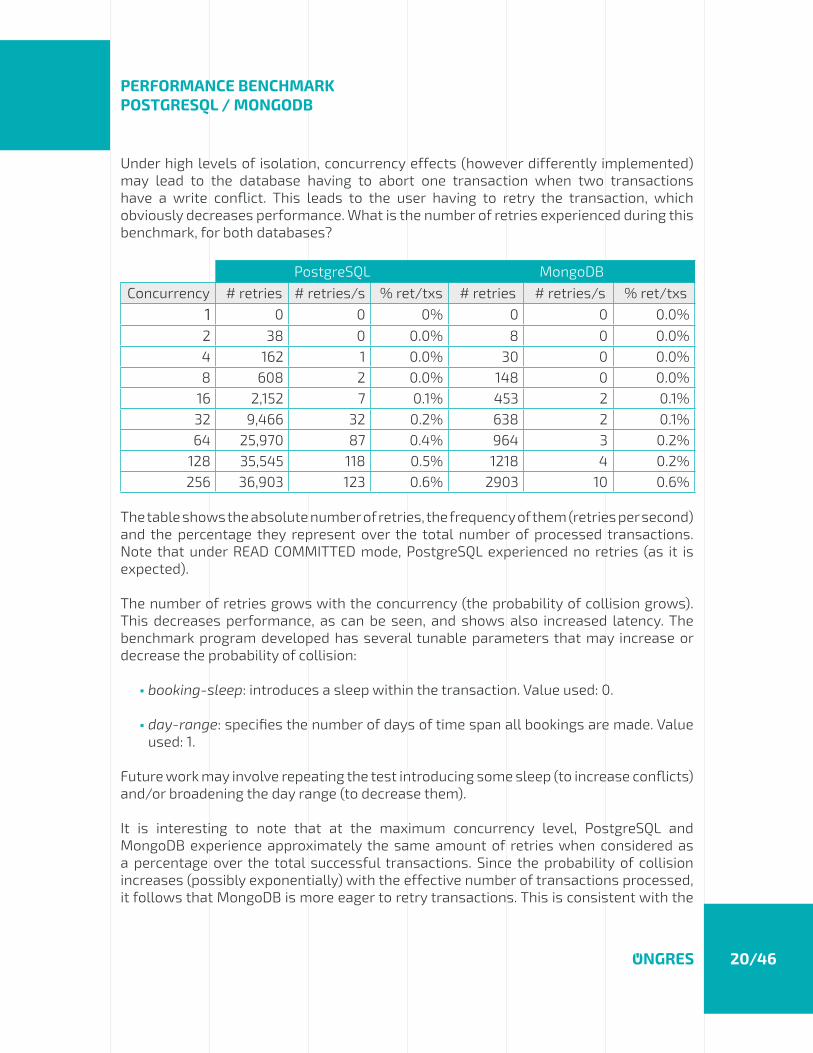
Under high levels of isolation, concurrency effects (however differently implemented) may lead to the database having to abort one transaction when two transactions have a write conflict. This leads to the user having to retry the transaction, which obviously decreases performance. What is the number of retries experienced during this benchmark, for both databases?
PostgreSQL MongoDBConcurrency # retries # retries/s % ret/txs # retries # retries/s % ret/txs
1 0 0 0% 0 0 0.0%2 38 0 0.0% 8 0 0.0%4 162 1 0.0% 30 0 0.0%8 608 2 0.0% 148 0 0.0%
16 2,152 7 0.1% 453 2 0.1%32 9,466 32 0.2% 638 2 0.1%64 25,970 87 0.4% 964 3 0.2%
128 35,545 118 0.5% 1218 4 0.2%256 36,903 123 0.6% 2903 10 0.6%
The table shows the absolute number of retries, the frequency of them (retries per second) and the percentage they represent over the total number of processed transactions. Note that under READ COMMITTED mode, PostgreSQL experienced no retries (as it is expected).
The number of retries grows with the concurrency (the probability of collision grows). This decreases performance, as can be seen, and shows also increased latency. The benchmark program developed has several tunable parameters that may increase or decrease the probability of collision:
• booking-sleep: introduces a sleep within the transaction. Value used: 0.
• day-range: specifies the number of days of time span all bookings are made. Value used: 1.
Future work may involve repeating the test introducing some sleep (to increase conflicts) and/or broadening the day range (to decrease them).
It is interesting to note that at the maximum concurrency level, PostgreSQL and MongoDB experience approximately the same amount of retries when considered as a percentage over the total successful transactions. Since the probability of collision increases (possibly exponentially) with the effective number of transactions processed, it follows that MongoDB is more eager to retry transactions. This is consistent with the

PERFORMANCE BENCHMARKPOSTGRESQL / MONGODB
21/46
expectation set on MongoDB’s documentation about transactions and locking, which states that “by default, transactions waits up to 5 milliseconds to acquire locks required by the operations in the transaction. If the transaction cannot acquire its required locks within the 5 milliseconds, the transaction aborts”. This behavior can be changed by setting the maxTransactionLockRequestTimeoutMillis parameter.
LatencyOther than raw throughput, what is the user-perceived latency of the transactional operations for this benchmark? If used for an OLTP application which is sensitive to latency (like most e-commerce6 and many other applications), the user-perceived latency will be a sum of the database latency and the application and network layer latencies. If multi-document transactions are required (like in an airplane reservation systems, simulated by this benchmark); and/or when high levels of isolation other than READ UNCOMMITTED are required, what are the observed latencies on both databases?
6 A usually quoted number is that every 100ms of latency cost Amazon 1% in sales.
PERFORMANCE BENCHMARKPOSTGRESQL / MONGODB
22/46
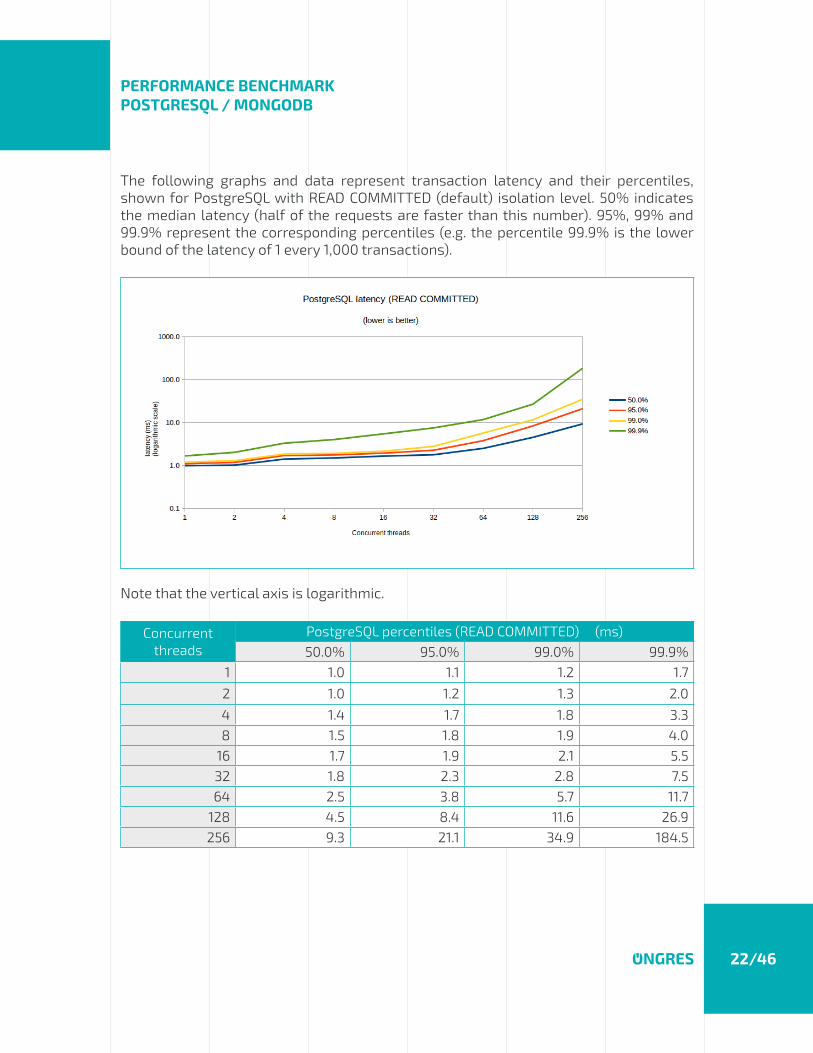
The following graphs and data represent transaction latency and their percentiles, shown for PostgreSQL with READ COMMITTED (default) isolation level. 50% indicates the median latency (half of the requests are faster than this number). 95%, 99% and 99.9% represent the corresponding percentiles (e.g. the percentile 99.9% is the lower bound of the latency of 1 every 1,000 transactions).
Note that the vertical axis is logarithmic.
Concurrent threads
PostgreSQL percentiles (READ COMMITTED) (ms)50.0% 95.0% 99.0% 99.9%
1 1.0 1.1 1.2 1.7
2 1.0 1.2 1.3 2.0
4 1.4 1.7 1.8 3.38 1.5 1.8 1.9 4.0
16 1.7 1.9 2.1 5.532 1.8 2.3 2.8 7.564 2.5 3.8 5.7 11.7
128 4.5 8.4 11.6 26.9256 9.3 21.1 34.9 184.5
PERFORMANCE BENCHMARKPOSTGRESQL / MONGODB
23/46
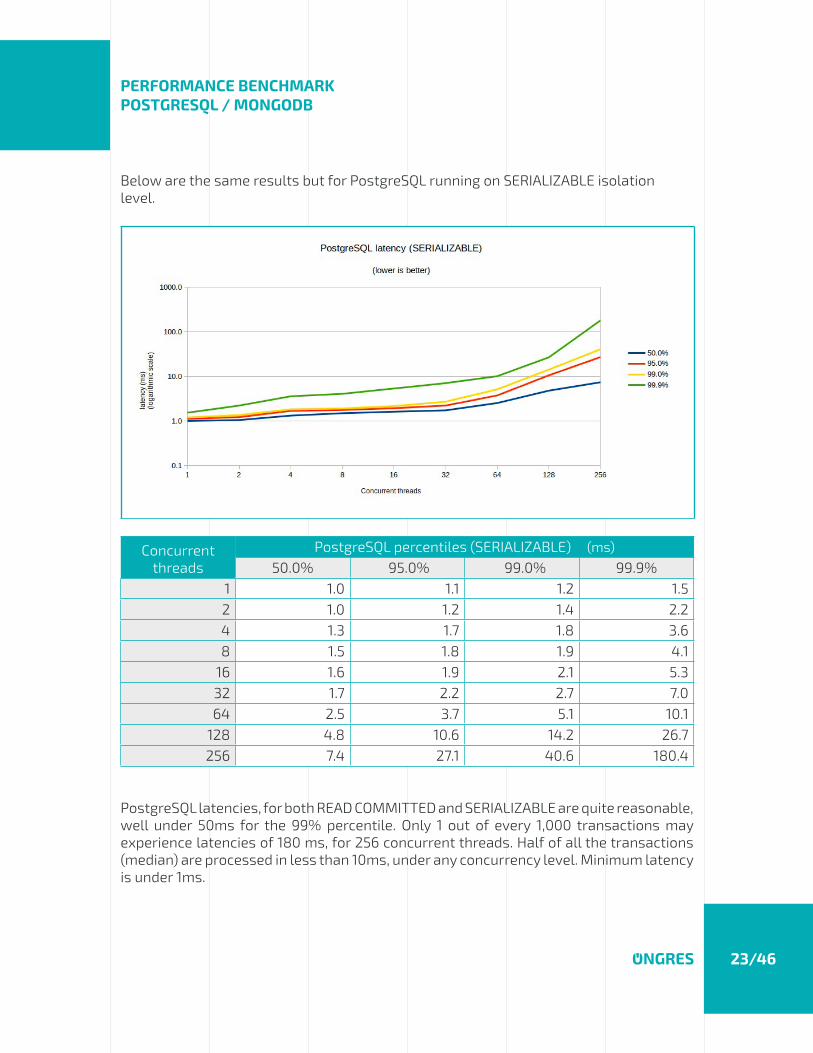
Below are the same results but for PostgreSQL running on SERIALIZABLE isolationlevel.
Concurrent threads
PostgreSQL percentiles (SERIALIZABLE) (ms)50.0% 95.0% 99.0% 99.9%
1 1.0 1.1 1.2 1.52 1.0 1.2 1.4 2.24 1.3 1.7 1.8 3.68 1.5 1.8 1.9 4.1
16 1.6 1.9 2.1 5.332 1.7 2.2 2.7 7.064 2.5 3.7 5.1 10.1
128 4.8 10.6 14.2 26.7256 7.4 27.1 40.6 180.4
PostgreSQL latencies, for both READ COMMITTED and SERIALIZABLE are quite reasonable, well under 50ms for the 99% percentile. Only 1 out of every 1,000 transactions may experience latencies of 180 ms, for 256 concurrent threads. Half of all the transactions (median) are processed in less than 10ms, under any concurrency level. Minimum latency is under 1ms.

PERFORMANCE BENCHMARKPOSTGRESQL / MONGODB
24/46
As expected, SERIALIZABLE incurs in higher latencies, in general, but it is not very significant.
Now let’s look at the latency results for MongoDB:
Concurrent threads
MongoDB percentiles (ms)50.0% 95.0% 99.0% 99.9%
1 4.7 8.3 8.9 9.62 5.2 8.9 9.6 12.54 5.9 11.4 14.2 15.48 6.6 12.0 14.8 16.7
16 9.3 15.9 17.6 23.232 17.6 33.8 42.2 53.564 34.1 66.1 84.4 109.1
128 68.7 131.6 170.9 228.6256 143.7 278.9 377.5 505.4
MongoDB latencies are significantly worse than PostgreSQL’s. MongoDB’s median latency is 5-20 times higher than that of PostgreSQL; and 99 percentile is 7-17 times worse. MongoDB minimum median latency is 5ms in the best case (without concurrency) while spikes to more than 100ms for 256 concurrent threads (while PostgreSQL is keeping the median latency below 10ms). 99 percentile spikes to more than quarter a second with 256 concurrent threads, and only stays below 100ms for 64 concurrent threads or less.
PERFORMANCE BENCHMARKPOSTGRESQL / MONGODB
25/46
// OLTP BENCHMARK
Benchmark descriptionThe goal of this benchmark is to compare both databases under an OLTP (Online Transaction Processing) scenario. In OLTP, a high number of operations, though small in nature (typically single-row queries supported by an index, or single-row change operations) are typically performed by a potentially large number of concurrent users. It is, arguably, the most sought-after use case for MongoDB and one of the most commonly used ones for PostgreSQL too.
To perform this benchmark the well-known sysbench tool was used. Sysbench is a scriptable multi-threaded benchmark tool based on LuaJIT, extensible via LUA scripts. It was originally developed to perform system benchmarks, and included support for MySQL initially. It now has native PostgreSQL, and there is a sysbench-mongodb-lua script that wraps and makes it work under MongoDB. It could be argued that the quality of the Lua driver for both systems may differ. However, the benchmark runs were reliable and consistent, and hence this benchmark, one of the few that are relevant in terms of the data model and that support both databases7, was used.
Benchmarks conducted with this tool do not exploit transaction capabilities in MongoDB. They also do not perform complex queries that would arguably work better on relational schemas. Sysbench creates a schema with an user-defined number of tables/collections (created with the sbtest* prefix). It also creates the correspondent indexes on their ID columns. The document or row structure has an id, k (integer), c (slightly bigger text), pad (text). Note that this test do not use transactions in MongoDB (and consequently run effectively) under READ UNCOMMITTED isolation, whereas PostgreSQL runs under its default isolation level, READ COMMITTED.
Several different tests have been performed, comprising several different dimensions to analyze:
• Dataset size (small dataset, 2-4GB, fitting in memory, called “FIT”; and larger dataset, around 2TB, obviously not fitting in memory, called “XL”).
7 Future work may involve writing one OLTP benchmark from scratch that would support both databases. It could be based on a real use-case (like the Social Data Reference Architecture, a MongoDB application used for performance regression testing), but exploiting the real capabi-lities of each database, as if the program was designed specifically for each of the databases. It would be a fair benchmark in the sense that the same operations and data are used, but possi-bly internal representation and data modeling changes, being adapted to the best patterns and capabilities of each database.

PERFORMANCE BENCHMARKPOSTGRESQL / MONGODB
26/46
Both FIT and XL in the automated platform used SSD backed storage, with 1000 and 5000 guaranteed IOPS (io1) respectively. This has been done this way to simulate real-world scenarios that are cost-sensitive to storage costs.
• Filesystem (XFS or ZFS8).
• Read/write work split. To scenarios considered: 95/5 and 50/50 (reads to writes).
• Several different number of connections to the database, to simulate different levels of concurrency.
In total, many dozens to hundreds of tests have been run, all automatically, including result collection, thanks to the developed automated platform for benchmarking, as part of this project.
Initial considerations
Dataset sizes on-diskAfter the dataload phase of the sysbench benchmark, MongoDB and PostgreSQL sizes for the two datasets are:
Engine XFS ZFSMongoDB FIT 2.5 GB 1.9 GBPostgreSQL FIT 6.1 GB 4.5 GBMongoDB XL 2.0 TB 1.8 TBPostgreSQL XL 2.5 TB 2.1 TB
There are two quick conclusions here: PostgreSQL requires more disk space than MongoDB for the same data set; and ZFS offers good compression, even on MongoDB.
PostgreSQL number of connections and connection poolingPostgreSQL architecture is based on a process model, where a new process is run per every new connection. Since one process is served at a time by a maximum of one CPU core, the theoretical maximum number of connections of a PostgreSQL database is equal to the number of cores, assuming the connections are fully utilizing the CPU cores due
8 The ZFS filesystem was used in a simple configuration, with compression enabled, but no read nor write cache configured, that would have leveraged the ephemeral NVMe disks available on the instances. This is left for a future benchmark. The main reason for this is that the path of the ephe-meral disks on spot instances seems to change over time, making test automation much harder.

PERFORMANCE BENCHMARKPOSTGRESQL / MONGODB
27/46
to high activity. For this benchmark, using m5.4xlarge instances with 16 CPUs, this would mean a maximum number of 16 connections.
In reality, that number of connections is typically a multiple of the cores. Despite having all the cores using a CPU, they are oftentimes waiting on I/O (which databases do a lot) or even other interrupts. This allows the OS, by using the time-sharing mechanism, to swap out and in other processes that can use the CPU while others are waiting. On top of that, if a given connection is not fully utilizing the session (i.e., instead of continuously executing queries it is waiting on the application to perform other tasks, for example), even more concurrent connections may be thrown to the database.
On this presentation, OnGres proposed a formula to estimate the optimal number of connections to a PostgreSQL database, based on the above factors:
where the % of utilization is close to 100% if the connection is just opened, queries executed non-interactively and connection released, and most typically a 50-75%; and the scale factor is a factor dependent on the effective I/O and other waits, and is typically anywhere between 2-8 (smaller on systems with better I/O, like NVMe).
For this benchmark, let’s assume the utilization factor is high (90%; the benchmark is continuously executing queries), so the optimal performance is achieved, probably, according to this formula, somewhere between 27 and 53 connections.
Why is this relevant, anyway? It turns out this determines the optimal performance. For the sysbench benchmark, and measured in increments of 50, it was experimentally determined that 50 connections was the optimally performing number of connections (which matches the expectation from the previous formula).
So operating on a higher number of connections may lower performance. How much? It depends on the workload, but for some patterns, it may be significant. There are two main factors that contribute to this effect:
• OS scheduling overhead and cache trashing. The former is only noticeable when the number of connections is very high, probably in the order of thousands. But it can be measured indirectly through context switches, for example.
PERFORMANCE BENCHMARKPOSTGRESQL / MONGODB
28/46
Cache trashing occurs by the way in which PostgreSQL works with the shared buffers area. This area is where all buffer data is read/written by the processes, and follows a LRU algorithm. If this area is scarce (compared to the whole data set), many processes may end up on contention to it, paging in and out data that might be still required by other processes. In other words: this cache area is shared by fewer processes at a time, avoiding as much as possible ill effects of one process into another one.
• Local per-process catalog cache. Each PostgreSQL process caches some catalog table information. This amounts a few MB of RAM (7-10 MB) per process. If the number of connections is configured in the thousands, this quickly adds up to dozens of hundreds of GB of RAM, plus all the rest of the memory required for database operation.
So for PostgreSQL it is very important to properly tune the number of connections, and keep it close to the ideal operating point. Initial measurements for the sysbench benchmark have shown that PostgreSQL performance can degrade up to one order of magnitude when the number of client connections grows to a large multiple of the optimal range.
Does this mean that PostgreSQL cannot handle more concurrent users? Absolutely not. The key is to use connection pooling. The standard way of accomplishing this is to use a PostgreSQL connection pooler like PgBouncer. A connection pooler can maintain a lower number of connections to the database (operating on a number of connections close to the optimal range) and will either queue excess transactions (but still accept them; this is called session mode) or multiplex them (called transaction mode) to create the net effect of many more available connections to the database. Contrary to conventional wisdom, this does not increase latency over a higher number of direct connections to PostgreSQL: While some user connections have some added latency due to waiting, the significantly faster processing of the in-flight queries compensates for this. Overall, using a connection pooler has the following effects on direct connections to PostgreSQL:
• Keep PostgreSQL operating close to the optimal range across almost any number of incoming connections, effectively smoothing out performance variations.
• Keep query latencies within reasonable bounds, not growing exponentially when the number of connections is very high.
• Alleviate memory pressure due to local process cache.
• Obviously, allow for any number of concurrent connections, making it almost transparent to the user that there is an optimal number of connections from the connection pooler to the database.

PERFORMANCE BENCHMARKPOSTGRESQL / MONGODB
29/46
One of the goals is to simulate benchmark conditions that are close to that of production environments. It is explained here, and a well-known anti-pattern to run PostgreSQL without connection pooling. Hence the results presented for the OLTP benchmark either include a PgBouncer in front of PostgreSQL or, if raw results are presented, they are so under the number of connections (determined to be 50) where PostgreSQL operates optimally, since that would be the setting used in production, with a connection pooler in front. Obviously, PostgreSQL and MongoDB are always compared with the same number of concurrent connections.
And what about MongoDB? Is its performance changing with the number of connections? This is not necessary due to MongoDB’s architecture, which uses a lighter weight threading model. On top of that, MongoDB client driver includes an automatic connection pool. Hence, it is not necessary to use an explicit connection pool in front of MongoDB, and the results are more stable across a different number of connection users.
Benchmark resultsEach benchmark has been run five times for each configuration (test type, file system, load option and number of connections), averaging the results for the three intermediate values.

PERFORMANCE BENCHMARKPOSTGRESQL / MONGODB
30/46
Fit in memory (few GB dataset)The benchmark was performed on both XFS and ZFS filesystems. For the 50 connections result, comparing PostgreSQL and MongoDB, the observed performance is the following:
XFS ZFS95/5 50/50 95/5 50/50
PostgreSQL 2,603 2,569 2,424 2,301MongoDB 929 924 909 730ratio (speedup) 2.8 2.8 2.7 3.2
This result may come as a surprise. It may have been expected MongoDB to outperform PostgreSQL, as MongoDB it is well-known to perform well on OLTP operations when data fits in memory and accesses are indexed. But PostgreSQL is 2.7-3.2 times faster, depending on the test and read/write workload. There are two possible reasons:
• The operations performed by sysbench are not just reading or inserting a single record. But more resemble a closer-to-reality scenario where few bits of data need to be processed on more than one table/collection. Note that despite the fact that sysbench combines more than one operation, it does not uses transactions (just grouped operations).
PERFORMANCE BENCHMARKPOSTGRESQL / MONGODB
31/46
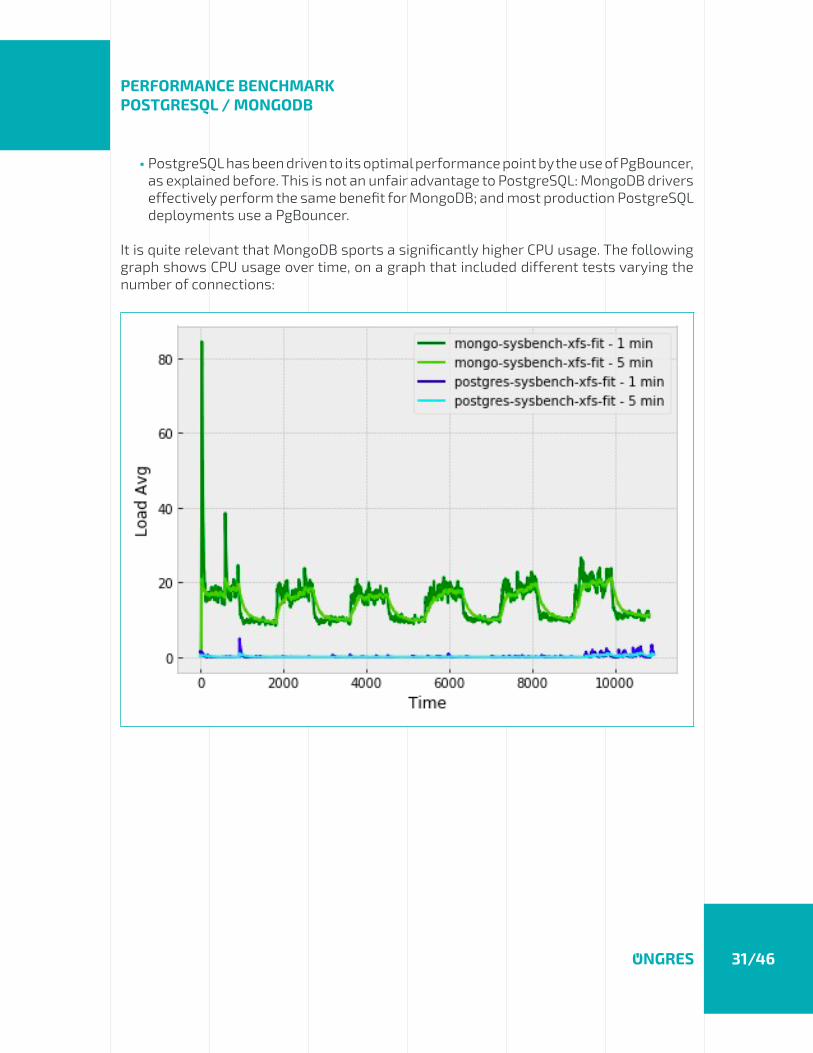
• PostgreSQL has been driven to its optimal performance point by the use of PgBouncer, as explained before. This is not an unfair advantage to PostgreSQL: MongoDB drivers effectively perform the same benefit for MongoDB; and most production PostgreSQL deployments use a PgBouncer.
It is quite relevant that MongoDB sports a significantly higher CPU usage. The following graph shows CPU usage over time, on a graph that included different tests varying the number of connections:
PERFORMANCE BENCHMARKPOSTGRESQL / MONGODB
32/46
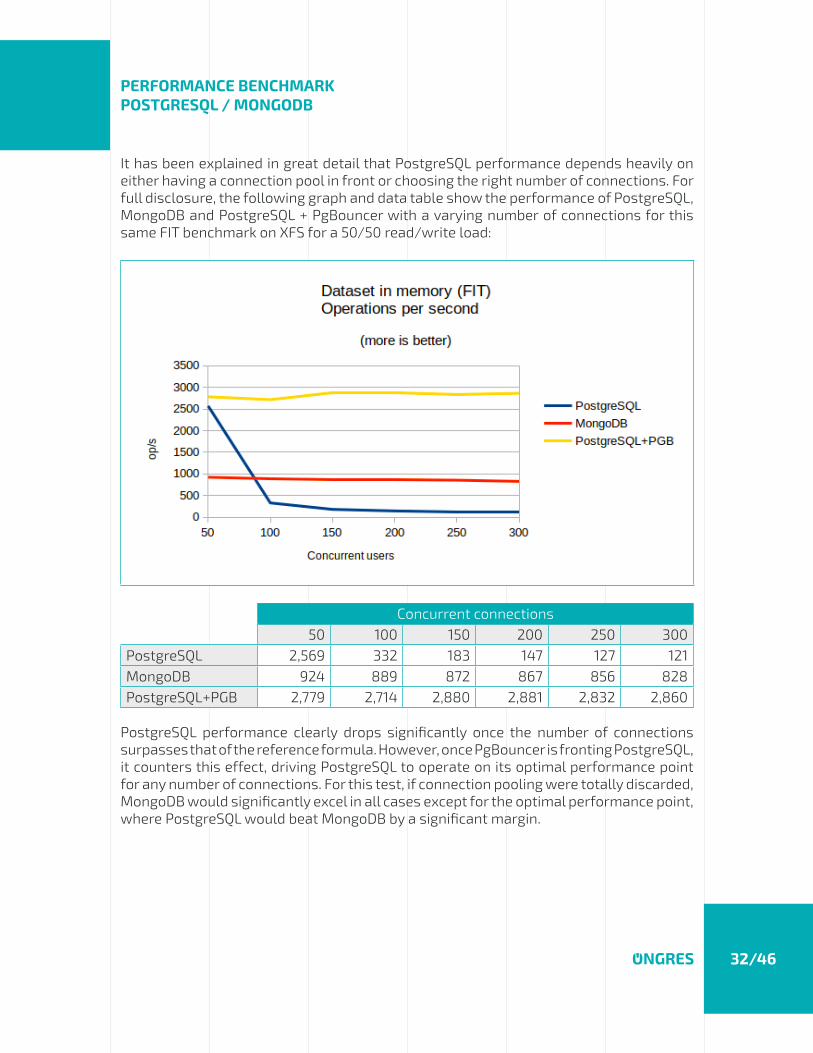
It has been explained in great detail that PostgreSQL performance depends heavily on either having a connection pool in front or choosing the right number of connections. For full disclosure, the following graph and data table show the performance of PostgreSQL, MongoDB and PostgreSQL + PgBouncer with a varying number of connections for this same FIT benchmark on XFS for a 50/50 read/write load:
Concurrent connections50 100 150 200 250 300
PostgreSQL 2,569 332 183 147 127 121MongoDB 924 889 872 867 856 828PostgreSQL+PGB 2,779 2,714 2,880 2,881 2,832 2,860
PostgreSQL performance clearly drops significantly once the number of connections surpasses that of the reference formula. However, once PgBouncer is fronting PostgreSQL, it counters this effect, driving PostgreSQL to operate on its optimal performance point for any number of connections. For this test, if connection pooling were totally discarded, MongoDB would significantly excel in all cases except for the optimal performance point, where PostgreSQL would beat MongoDB by a significant margin.
PERFORMANCE BENCHMARKPOSTGRESQL / MONGODB
33/46
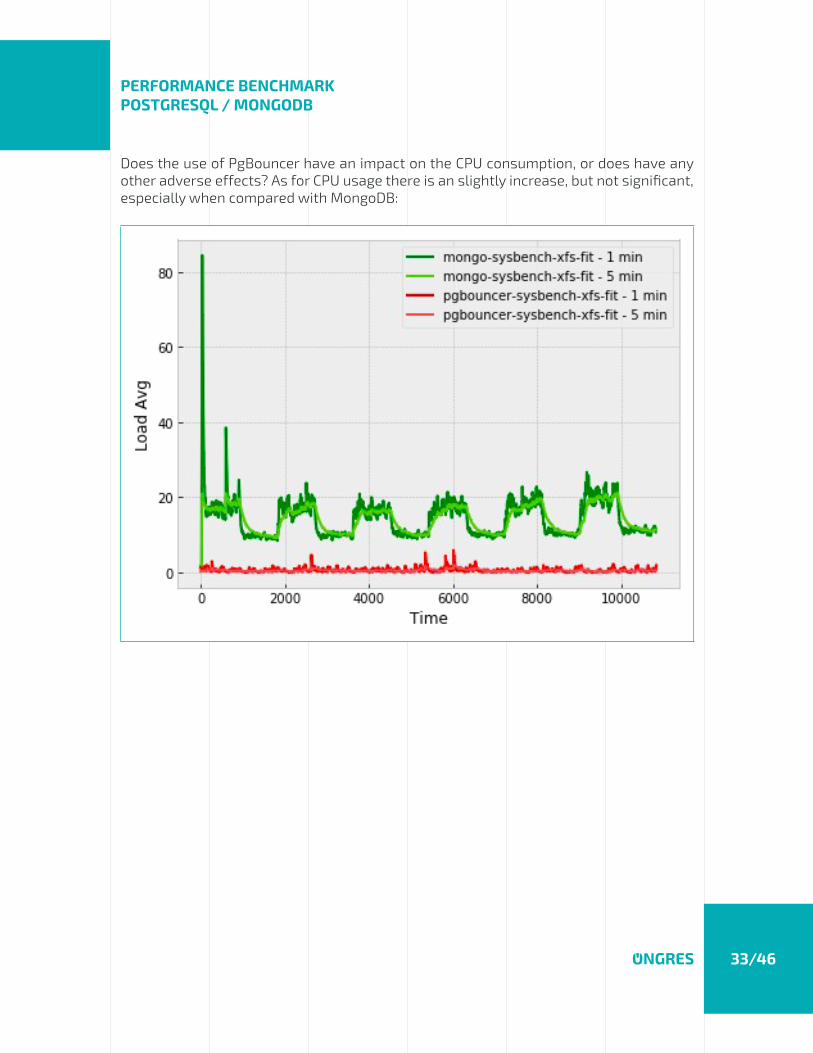
Does the use of PgBouncer have an impact on the CPU consumption, or does have any other adverse effects? As for CPU usage there is an slightly increase, but not significant, especially when compared with MongoDB:

PERFORMANCE BENCHMARKPOSTGRESQL / MONGODB
34/46
MongoDB on ZFSWatching the performance test’s evolution over time, it was brought to our attention sudden drops in MongoDB performance, especially when doing the 50/50 test, that are hard to perceive once averaged as a final result. They look like:
MongoDB is represented by the grey bars. The others are not relevant for this analysis. As it can be seen, there are some periodic drops in performance, close to 0 (the Y axis is operations per second), that could be due to some more or less periodic stall, or stop-the-world flush to disk.
PERFORMANCE BENCHMARKPOSTGRESQL / MONGODB
35/46
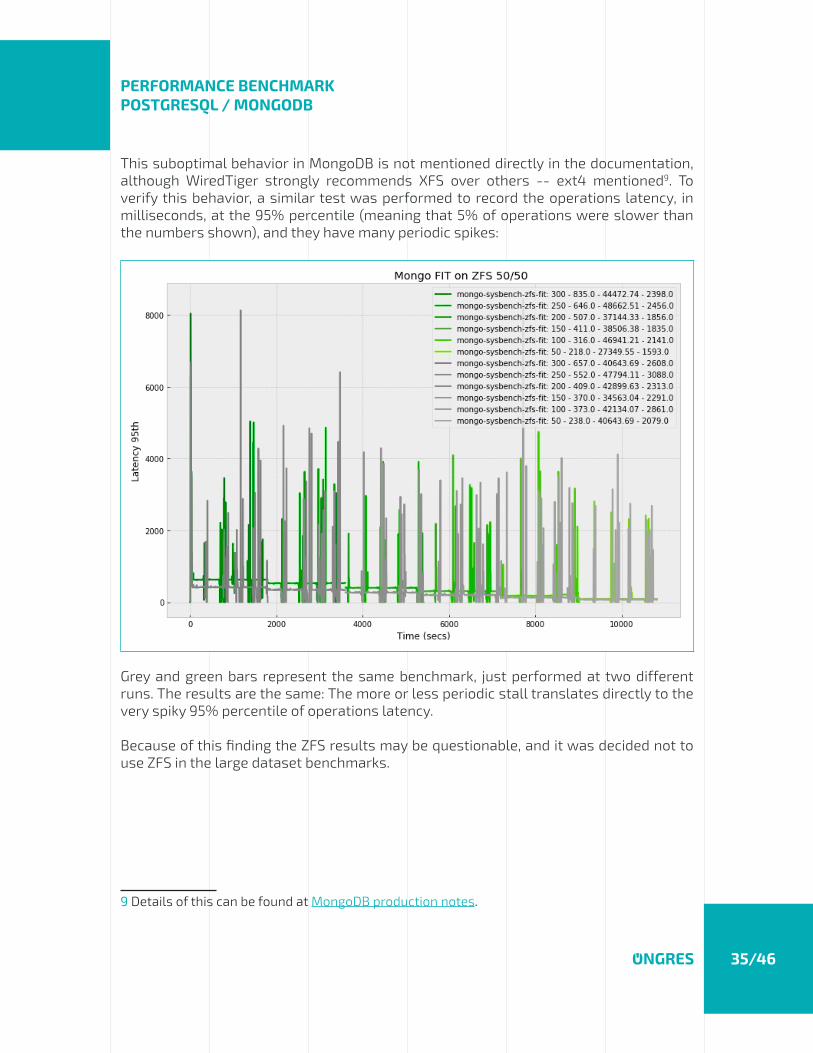
This suboptimal behavior in MongoDB is not mentioned directly in the documentation, although WiredTiger strongly recommends XFS over others -- ext4 mentioned9. To verify this behavior, a similar test was performed to record the operations latency, in milliseconds, at the 95% percentile (meaning that 5% of operations were slower than the numbers shown), and they have many periodic spikes:
Grey and green bars represent the same benchmark, just performed at two different runs. The results are the same: The more or less periodic stall translates directly to the very spiky 95% percentile of operations latency.
Because of this finding the ZFS results may be questionable, and it was decided not to use ZFS in the large dataset benchmarks.
9 Details of this can be found at MongoDB production notes.

PERFORMANCE BENCHMARKPOSTGRESQL / MONGODB
36/46
Dataset exceeds available memory (2 TB dataset)This test was only performed in XFS, after the experienced issues with MongoDB on ZFS. On the PostgreSQL side, it also performed better with 50 connections, as it was for the in-memory test. For this number of connections, comparing PostgreSQL and MongoDB, the observed performance is the following:
95/5 50/50
PostgreSQL 2,433 2,211MongoDB 96 51ratio (speedup) 25.3 43.4
As can be seen, PostgreSQL remains much faster than MongoDB. But the difference significantly widened: from 2-3x to 25-40 times faster.

PERFORMANCE BENCHMARKPOSTGRESQL / MONGODB
37/46
What is the effect here of the number of connections on PostgreSQL?
Concurrent connections50 100 150 200 250 300
PostgreSQL 2,433 334 191 138 116 123
MongoDB 96 81 82 86 96 48
PostgreSQL+PGB 2,709 2,686 2,707 2,670 2,827 2,839
The following conclusions may be derived from the results:
• PostgreSQL performance is very similar irrespective of the dataset size. This means that buffering algorithms are very good, and are able to keep the relevant dataset in memory.
• MongoDB performance degrades significantly when data does not fit in memory.
• For this benchmark, PostgreSQL is faster than MongoDB even when it is operating far from its optimal regime (at higher number of connections).
PERFORMANCE BENCHMARKPOSTGRESQL / MONGODB
38/46
// OLAP BENCHMARK
Benchmark descriptionOLAP stands for Online Analytical Processing and is typically used for reporting, business intelligence and data mining. This benchmark aims to provide a performance comparison between MongoDB and PostgreSQL for simple reporting scenarios involving data produced by OLTP workloads.
Data used consists of JSON documents from the GitHub Archive. This JSON data is imported into both MongoDB and PostgreSQL (using the jsonb datatype). To import the data, a set of scripts were developed into an automated platform that will repeat the test several times on different data sizes, from scratch, in a clean and controlled environment. All the source code, automation and test details are the same as for the OLTP Benchmark (including instance sizes and characteristics: Instance was a m5.4xlarge, with 16CPU and 62G RAM).
GitHub Archive is a project to record the public GitHub timeline, archive it and make it easily accessible for further analysis. GitHub Archive provides 20+ event types, which range from new commits and fork events, to opening new tickets, commenting, and adding members to a project. GitHub Archive files are served over HTTP. This dataset was used as it provides significant advantages:
• No need to generate the JSON data.
• Free and Public info and access.
• Real user info to develop, analyze with aggregation and run OLAP queries.
• Enough info volume size to populate a database and run meaningful queries.
Each archive contains JSON encoded events as reported by the GitHub API. Raw data can be downloaded and processed - e.g. write a custom aggregation script and import it into a database, as was done here.
The list of events and JSON keys are pretty extensive, see Schema.js and Event Types to dive deep into JSON document and GitHub API. It is relevant about the JSON data that:
• The content of the “payload” field is different for each event type and may be updated by GitHub at any point.
• The content of the “other” field is a JSON string which contains all other data provided by GitHub.

PERFORMANCE BENCHMARKPOSTGRESQL / MONGODB
39/46
The dataset used for the OLAP benchmark imported from the GitHub Archive within the data range from 2015-01-01 to 2015-12-31 (1 year range time), representing 212,222,001 (212M) records.
Query scope and projectionWith all this background about GitHub Archive, we wrote 4 queries to run the OLAP Benchmark, as shown below:
• Query A: Return repositories ordered by most opened issues.
• Query B: Return git event type ordered by quantity (most frequent first).
• Query C: Return the top 10 most active actors.
• Query D: Return repositories that have more than two comments and a specific event type, ordered by average comments descending.
As a best practice, we have picked queries that fairly accurately represent real use-case scenarios where the database is asked for relevant BI (Business Intelligence) information.
The following are the actual code used to perform these queries in the tested systems.
PERFORMANCE BENCHMARKPOSTGRESQL / MONGODB
40/46
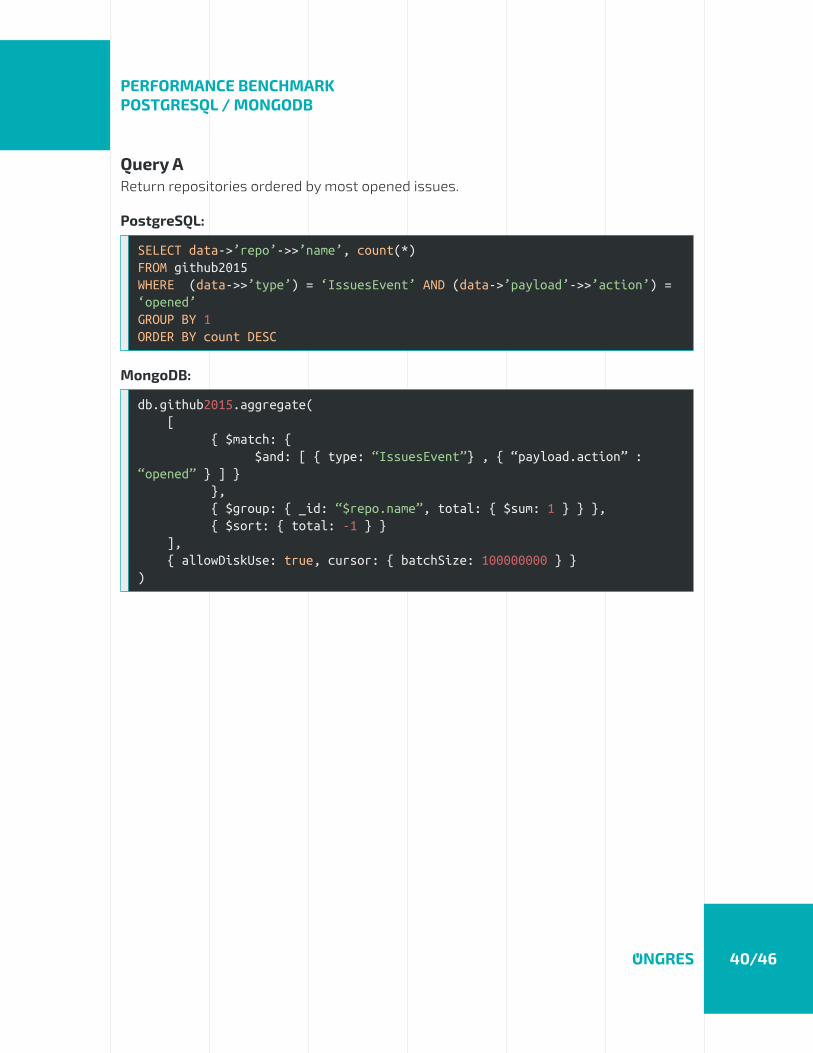
Query AReturn repositories ordered by most opened issues.
PostgreSQL:
SELECT data->’repo’->>’name’, count(*)FROM github2015WHERE (data->>’type’) = ‘IssuesEvent’ AND (data->’payload’->>’action’) = ‘opened’GROUP BY 1ORDER BY count DESC
MongoDB:
db.github2015.aggregate( [ { $match: { $and: [ { type: “IssuesEvent”} , { “payload.action” : “opened” } ] } }, { $group: { _id: “$repo.name”, total: { $sum: 1 } } }, { $sort: { total: -1 } } ], { allowDiskUse: true, cursor: { batchSize: 100000000 } })

PERFORMANCE BENCHMARKPOSTGRESQL / MONGODB
41/46
Query BReturn git event type ordered by quantity (most frequent first)
PostgreSQL:
SELECT data->>’type’, count(*)FROM github2015GROUP BY 1ORDER BY count DESC
MongoDB:
db.github2015.aggregate( [ { $group: { _id: “$type”, total: { $sum: 1 } } }, { $sort: { total: -1 } } ], { allowDiskUse: true, cursor: { batchSize: 100000000 } })

PERFORMANCE BENCHMARKPOSTGRESQL / MONGODB
42/46
Query CReturn the top 10 most active actors
PostgreSQL:
SELECT data->’actor’->>’login’ as actor, count(*)FROM github2015GROUP BY actorORDER BY count DESCLIMIT 10
MongoDB:
db.github2015.aggregate([ { $group: { _id: “$actor.login”, events: { $sum: 1 } } }, { $sort: { events: -1 } }, { $limit: 10 } ], { allowDiskUse: true, cursor: { batchSize: 100000000 } })
PERFORMANCE BENCHMARKPOSTGRESQL / MONGODB
43/46
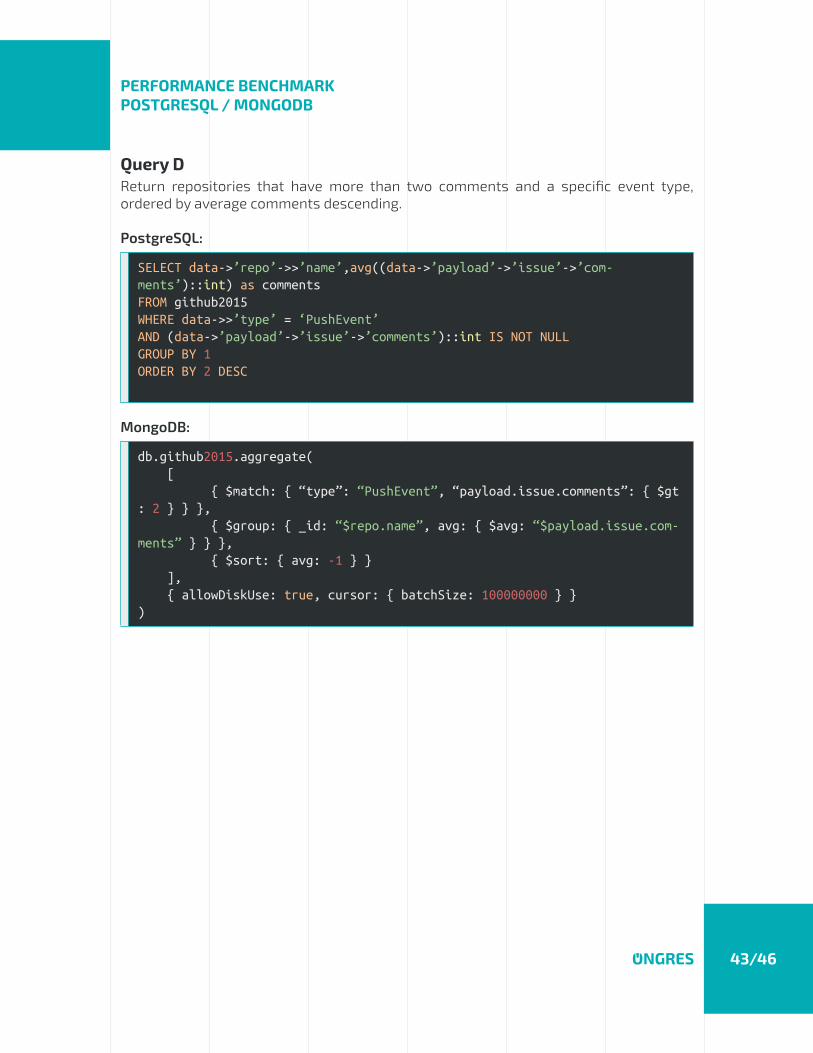
Query DReturn repositories that have more than two comments and a specific event type, ordered by average comments descending.
PostgreSQL:
SELECT data->’repo’->>’name’,avg((data->’payload’->’issue’->’com-ments’)::int) as commentsFROM github2015WHERE data->>’type’ = ‘PushEvent’AND (data->’payload’->’issue’->’comments’)::int IS NOT NULLGROUP BY 1ORDER BY 2 DESC
MongoDB:
db.github2015.aggregate( [ { $match: { “type”: “PushEvent”, “payload.issue.comments”: { $gt : 2 } } }, { $group: { _id: “$repo.name”, avg: { $avg: “$payload.issue.com-ments” } } }, { $sort: { avg: -1 } } ], { allowDiskUse: true, cursor: { batchSize: 100000000 } })

PERFORMANCE BENCHMARKPOSTGRESQL / MONGODB
44/46
PostgreSQL specificsPostgres is tuned with 1GB work_mem and 12GB shared_buffers. The dataset ended up in around 340G of used disk space.
For the set of queries in this benchmark, the following indexes were created:
CREATE INDEX ON github2015 ((data->’repo’->>’name’));CREATE INDEX ON github2015 ((data->’payload’->>’action’));CREATE INDEX ON github2015 ((data->>’type’));CREATE INDEX ON github2015 ((data->’actor’->>’login’));CREATE INDEX ON github2015 ((data->’payload’->’issue’->’comments’))
The queries used in the current benchmark are located at the corresponding script in the benchmarking platform here.
MongoDB specificsDisk space required for the dataset was 206GB. Note that MongoDB’s (WiredTiger’s) compression reduced significantly disk space requirements as compared to PostgreSQL (340GB).
Equivalently to PostgreSQL, the following indexes were created:
db.github2015.createIndex( {type:1} )db.github2015.createIndex( {“repo.name”:1} )db.github2015.createIndex( {“payload.action”:1} )db.github2015.createIndex( {“actor.login”:1} )db.github2015.createIndex( {“payload.issue.comments”:1} )
Benchmark queries can be found in the platform repository.

PERFORMANCE BENCHMARKPOSTGRESQL / MONGODB
45/46
Benchmark resultsThe queries are run several times and averaged. Total query execution time is measured in seconds. Lower is better. The results for the given dataset (212M records) are the following:
Queries PostgreSQL MongoDB % speedup(S-F)/S
Query A 1h 28m 15s 1h 8m 44s 22.11%Query B 41m 03s 1h 13m 3s 43.80%Query C 48m 37s 1h 14m 25s 34.66%Query D 1h 07m 23s 2h 23m 44s 53.12%
As per the results above, it can be seen that PostgreSQL outperforms MongoDB by a 35-50% on three queries and is only slower on the first query, by a 22%.
For this test, the whole 2015 year data was used. When testing in incremental stages, with a few months of data, MongoDB outperformed PostgreSQL in all queries when the dataset was small enough to fit in memory (a few GB). This is not a surprising result, but not one very realistic in production environments, where OLAP data would weigh in the order of dozens of Tbs or even more. If, however, your dataset fits in RAM, consider using MongoDB for faster performance. Conversely, when dataset is bigger than RAM, PostgreSQL performance advantage grows as the dataset becomes bigger.
A typical BI (Business Intelligence) application would include lookup tables (typically small) that would need to be joined with the main table (which as has been explained for the transactions benchmark is slow on MongoDB) or they would need to be de-normalized into the main table (adding change performance on the OLTP operations and disk space). It is expected that PostgreSQL would have been performed even better than MongoDB in this case. Moreover if a BI tool is used that speaks SQL (as most of the ecosystem is), like Tableau, MicroStrategy or Qlik, it would require to use MongoDB’s BI Connector. But this product is not open source, and its license explicitly prohibits to publish benchmark results.
Based on this discussion, a series of possible future additional benchmarks are proposed to analyze other vectors for this OLAP benchmark:
• Consider using ZFS with compression enabled for PostgreSQL. This could reduce the disk space used by PostgreSQL and do a more fair comparison in terms of required I/O. It is expected that PostgreSQL would perform better. MongoDB would probably not (WiredTiger already has compression).
PERFORMANCE BENCHMARKPOSTGRESQL / MONGODB
46/46
• Transform jsonb queries in PostgreSQL to a set of normalized relational tables. Similarly to what (www.torodb.com) does automatically, jsonb-based queries may be turned with a set of views or materialized views into relational tables, well-normalized. Then, queries may be rewritten in “plain SQL”, by doing specific joins based on the resulting schema. It is expected that in this case queries would run significantly faster, up to 1-3 orders of magnitude faster, in PostgreSQL than in MongoDB. For a more detailed explanation, see this post from ToroDB with detailed benchmark data10.
• Repeat the current benchmark with a several TB-sized dataset. If it would repeat the observed trend, PostgreSQL performance advantage should widen.
10 The benefits of transforming JSON data into a relational schema may be quite significant, especially for OLAP type of queries. This normalization process benefits in several ways:
• Only a percentage of the “collection” is scanned to satisfy a given query, whereas the whole collection is scanned if data is in JSON format. Let’s assume a query is doing an aggrega-te on some fields on a deeply nested sub-document. On a relational schema this deeply nested sub-document would map to a separate table, which represents a small percentage of the whole data. On the relational model, only this smaller table would be scanned for the query, leading to potentially much more efficient queries.
• As an added benefit to the previous one, if these derived tables (representing a nested sub-document) are not present on all rows of the original JSON data, then these tables’ cardinality will be also lower than the original number of rows in the JSON data. Leading to even faster queries –scanning less to much less rows of data.
• Storage and I/O savings: the keys are frequently repeated. Once factored into the schema, a percentage of the storage and I/O is saved.