Embed Size (px)
Citation preview
- 1 -
Performance of Dynamic Load BalancingAlgorithms for Unstructured Mesh
Calculations
Roy D. Williams
Concurrent Supercomputing Facility
California Institute of Technology
Pasadena, California
Abstract
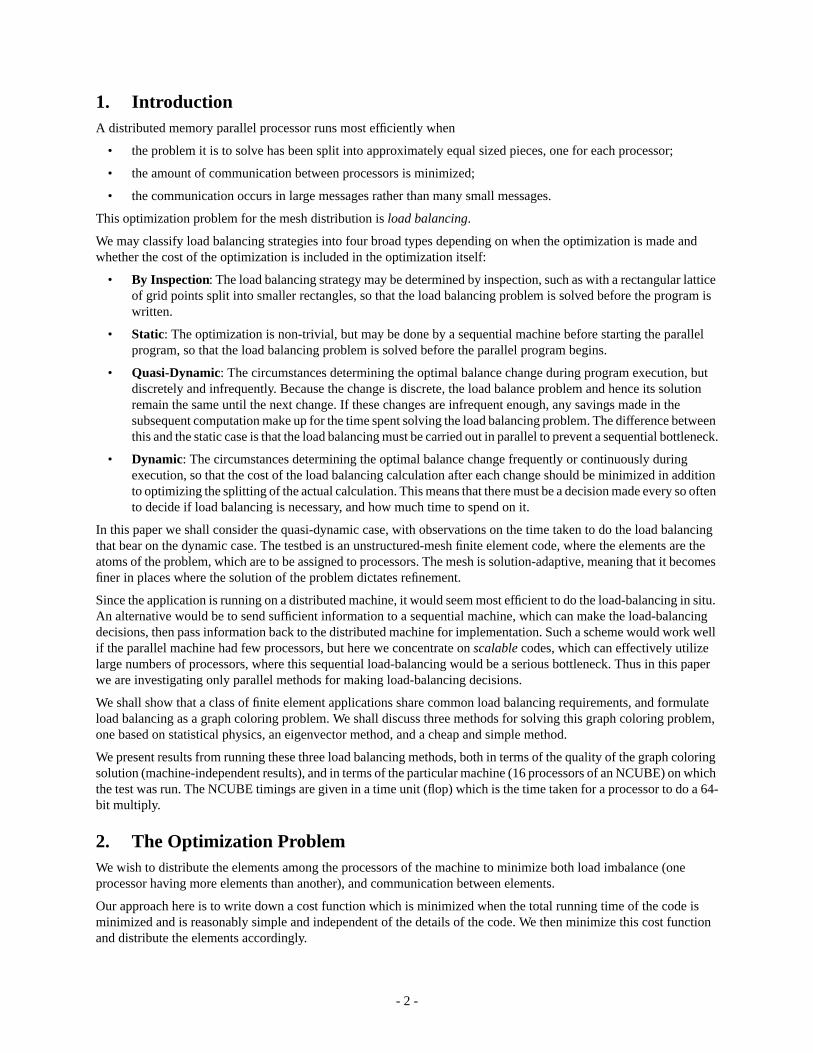
If a finite element mesh has a sufficiently regular structure, it is easy to decide in advance how todistribute the mesh among the processors of a distributed-memory parallel processor, but if the meshis unstructured, the problem becomes much more difficult. The distribution should be made so thateach processor has approximately equal work to do, and such that communication overhead isminimized.
If the mesh is solution-adaptive, i.e. the mesh and hence the load balancing problem changediscretely during execution of the code, then it is most efficient to decide the optimal meshdistribution in parallel. In this paper three parallel algorithms, Orthogonal Recursive Bisection(ORB), Eigenvector Recursive Bisection (ERB) and a simple parallelization of Simulated Annealing(SA) have been implemented for load balancing a dynamic unstructured triangular mesh on 16processors of an NCUBE machine.
The test problem is a solution-adaptive Laplace solver, with an initial mesh of 280 elements, refinedin seven stages to 5772 elements. We present execution times for the solver resulting from the meshdistributions using the three algorithms, as well as results on imbalance, communication traffic andelement migration.
The load balancing itself is fastest with ORB, but a very long run of SA produces a saving of 21%in the execution time of the Laplace solver. ERB is only a little slower than ORB, yet produces amesh distribution whose execution time is 15% faster than ORB.
C3P 913 June 1990
- 2 -
1. IntroductionA distributed memory parallel processor runs most efficiently when
• the problem it is to solve has been split into approximately equal sized pieces, one for each processor;
• the amount of communication between processors is minimized;
• the communication occurs in large messages rather than many small messages.
This optimization problem for the mesh distribution isload balancing.
We may classify load balancing strategies into four broad types depending on when the optimization is made andwhether the cost of the optimization is included in the optimization itself:
• By Inspection: The load balancing strategy may be determined by inspection, such as with a rectangular latticeof grid points split into smaller rectangles, so that the load balancing problem is solved before the program iswritten.
• Static: The optimization is non-trivial, but may be done by a sequential machine before starting the parallelprogram, so that the load balancing problem is solved before the parallel program begins.
• Quasi-Dynamic: The circumstances determining the optimal balance change during program execution, butdiscretely and infrequently. Because the change is discrete, the load balance problem and hence its solutionremain the same until the next change. If these changes are infrequent enough, any savings made in thesubsequent computation make up for the time spent solving the load balancing problem. The difference betweenthis and the static case is that the load balancing must be carried out in parallel to prevent a sequential bottleneck.
• Dynamic: The circumstances determining the optimal balance change frequently or continuously duringexecution, so that the cost of the load balancing calculation after each change should be minimized in additionto optimizing the splitting of the actual calculation. This means that there must be a decision made every so oftento decide if load balancing is necessary, and how much time to spend on it.
In this paper we shall consider the quasi-dynamic case, with observations on the time taken to do the load balancingthat bear on the dynamic case. The testbed is an unstructured-mesh finite element code, where the elements are theatoms of the problem, which are to be assigned to processors. The mesh is solution-adaptive, meaning that it becomesfiner in places where the solution of the problem dictates refinement.
Since the application is running on a distributed machine, it would seem most efficient to do the load-balancing in situ.An alternative would be to send sufficient information to a sequential machine, which can make the load-balancingdecisions, then pass information back to the distributed machine for implementation. Such a scheme would work wellif the parallel machine had few processors, but here we concentrate onscalable codes, which can effectively utilizelarge numbers of processors, where this sequential load-balancing would be a serious bottleneck. Thus in this paperwe are investigating only parallel methods for making load-balancing decisions.
We shall show that a class of finite element applications share common load balancing requirements, and formulateload balancing as a graph coloring problem. We shall discuss three methods for solving this graph coloring problem,one based on statistical physics, an eigenvector method, and a cheap and simple method.
We present results from running these three load balancing methods, both in terms of the quality of the graph coloringsolution (machine-independent results), and in terms of the particular machine (16 processors of an NCUBE) on whichthe test was run. The NCUBE timings are given in a time unit (flop) which is the time taken for a processor to do a 64-bit multiply.
2. The Optimization ProblemWe wish to distribute the elements among the processors of the machine to minimize both load imbalance (oneprocessor having more elements than another), and communication between elements.
Our approach here is to write down a cost function which is minimized when the total running time of the code isminimized and is reasonably simple and independent of the details of the code. We then minimize this cost functionand distribute the elements accordingly.
- 3 -
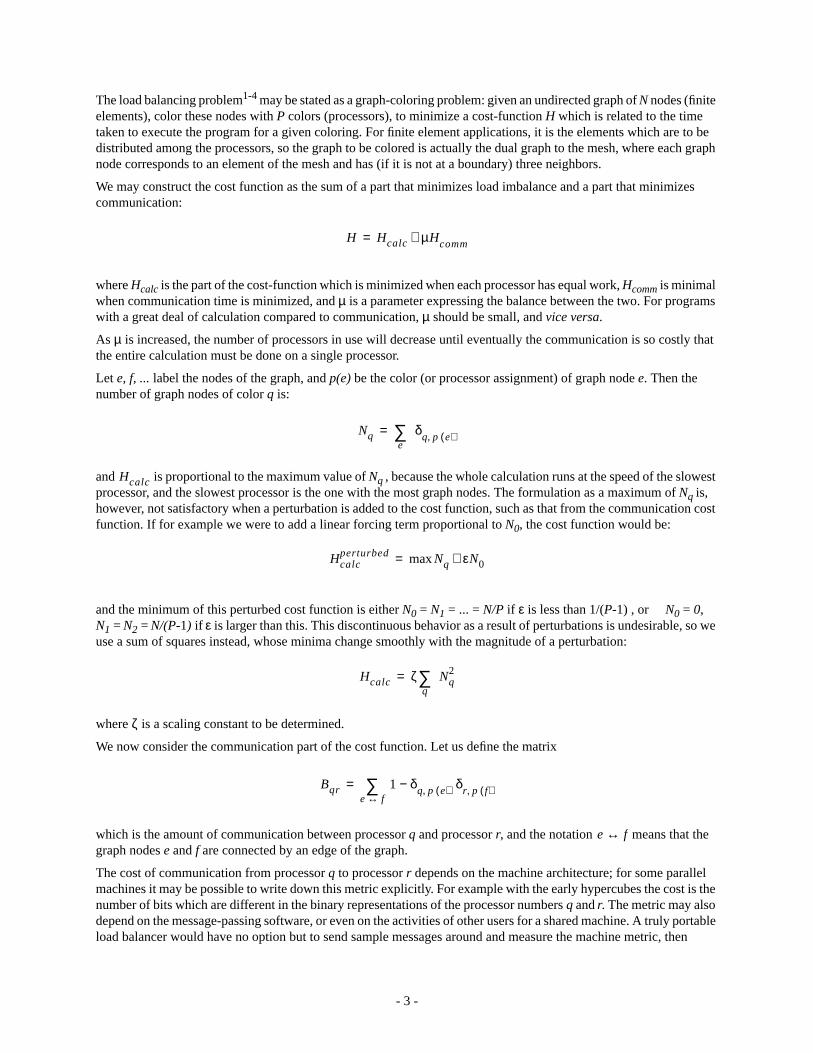
The load balancing problem1-4 may be stated as a graph-coloring problem: given an undirected graph ofN nodes (finiteelements), color these nodes withP colors (processors), to minimize a cost-functionH which is related to the timetaken to execute the program for a given coloring. For finite element applications, it is the elements which are to bedistributed among the processors, so the graph to be colored is actually the dual graph to the mesh, where each graphnode corresponds to an element of the mesh and has (if it is not at a boundary) three neighbors.
We may construct the cost function as the sum of a part that minimizes load imbalance and a part that minimizescommunication:
where Hcalc is the part of the cost-function which is minimized when each processor has equal work,Hcomm is minimalwhen communication time is minimized, andµ is a parameter expressing the balance between the two. For programswith a great deal of calculation compared to communication,µ should be small, andvice versa.
As µ is increased, the number of processors in use will decrease until eventually the communication is so costly thatthe entire calculation must be done on a single processor.
Let e, f, ... label the nodes of the graph, andp(e) be the color (or processor assignment) of graph nodee. Then thenumber of graph nodes of colorq is:
and is proportional to the maximum value ofNq , because the whole calculation runs at the speed of the slowestprocessor, and the slowest processor is the one with the most graph nodes. The formulation as a maximum ofNq is,however, not satisfactory when a perturbation is added to the cost function, such as that from the communication costfunction. If for example we were to add a linear forcing term proportional toN0, the cost function would be:
and the minimum of this perturbed cost function is eitherN0 = N1 = ... =N/P if ε is less than 1/(P-1) , or N0 = 0,N1 = N2 = N/(P-1) if ε is larger than this. This discontinuous behavior as a result of perturbations is undesirable, so weuse a sum of squares instead, whose minima change smoothly with the magnitude of a perturbation:
whereζ is a scaling constant to be determined.
We now consider the communication part of the cost function. Let us define the matrix
which is the amount of communication between processorq and processorr, and the notation means that thegraph nodese andf are connected by an edge of the graph.
The cost of communication from processor q to processor r depends on the machine architecture; for some parallelmachines it may be possible to write down this metric explicitly. For example with the early hypercubes the cost is thenumber of bits which are different in the binary representations of the processor numbers q andr. The metric may alsodepend on the message-passing software, or even on the activities of other users for a shared machine. A truly portableload balancer would have no option but to send sample messages around and measure the machine metric, then
H Hcalc µHcomm+=
Nq δq p e( ),e∑=
Hcalc
Hcalcperturbed maxNq εN0+=
Hcalc ζ Nq2
q∑=
Bqr 1 δ− q p e( ), δr p f( ),e f↔∑=
e f↔

- 4 -
distribute the graph appropriately. In this paper, however, we shall avoid the question of the machine metric by simplyassuming that all pairs of processors are equally far apart, except of course a processor may communicate with itselfat no cost.
The cost of sending the quantity Bqr of data also depends on the programming: the cost will be much less if it is possiblefor theBqr messages to be bundled together and sent as one, rather than sent separately. The problem is latency: thecost to send a message in any distributed system is the sum of an initial fixed price and a price proportional to the sizeof the message. This is also the case for the pricing of telephone calls, freight shipping, mail service and many otherexamples from the everyday world. If the message is large enough, we may ignore latency: for the NCUBE used inSec. 9 of this paper, latency may be ignored if the message is longer than a hundred bytes or so. In the tests of Sec. 9,most of the messages are indeed long enough to neglect latency, though there is certainly further work needed on loadbalancing in the presence of this important effect.
The result of this discussion is that we shall assume that the cost of communicating the quantityBqr of data isproportional toBqr, unlessq = r, in which case the cost is zero.
We shall now make the assumption that the total communication cost is the sum of the individual communicationsbetween processors:
whereε is a constant to be determined. Notice that any parallelism in communication is ignored. Substituting theexpression forBqr, the expression for the load balance cost function simplifies to
The assumptions made to derive this cost function are significant. The most serious deviation from reality is neglectingthe parallelism of communication, so that a minimum of this cost function may have grossly unbalancedcommunication loads. This turns out not to be the case, however, because when the mesh is equally balanced, there isa lower limit to the amount of boundary, analogous to a bubble having minimal surface area for fixed volume; if wethen minimize the sum of surface areas for a set of bubbles of equal volumes, each surface must be minimized andequal.
We may now choose the scaling constantsζ andε. A convenient choice is such that the optimalHcalc andHcomm havecontributions of size about 1 from each processor; the form of the scaling constantε is because the surface area of acompact shape ind dimensions varies as thed-1 power of the size, while volume varies as thed power. The final formfor H is
whered is the dimensionality of the mesh from which the graph came.
3. Modeling the Cost FunctionWe may construct a simple approximation to the load balance cost function in the limitN >> P >> 1. We shallconcentrate on a single processor, and suppose it has a proportionα of its correct shareof elements, so that whenα =1 it has its proper shareN/P of the elements. Let us assume that the otherP-1 processors have equal shares of theremaining elements. Let us callα thefilling fraction.
In one dimension, the boundary cost associated with the special processor is 2 forα>0 and 0 forα = 0. In twodimensions, if we assume that the boundary is minimized for the given number of elements, then the boundary cost is
Hcomm ε Bqrq r≠∑=
H ζ Nq2
q∑ εµ 1 δ− p e( ) p f( ),
e f↔∑+=
HP2
N2Nq
2
q∑ µ P
N( )
d 1−d
1 δ− p e( ) p f( ),e f↔∑+=

- 5 -
proportional toα1/2. For a perfect hexagonal lattice, the scaled boundary cost is(6α)1/2. We may then write the costfunction in terms ofα:
The two-dimensionalH is plotted in Fig. 1 for various values ofµ. Whenµ is sufficiently large, the minimum value of
H corresponds toα=0, so that the processor has no elements, which is because communication has become tooexpensive to profitably use the processor. For smallerµ, there are two local minima, one atα=0, and one nearα=1,separated by a barrier. The significance of this barrier is related to physical ideas of nucleation in supersaturated fluids:very small droplets of fluid are dominated by surface energy, and tend to get smaller and disappear back into solution,even if large bubbles are energetically favored, because the small bubble cannot ‘jump the energy barrier’ to theenergetically favored large bubble.
4. Algorithms for Load BalancingThis paper presents performance evaluation of three load balancing algorithms, all of which run in parallel. With amassively parallel machine, it would not be possible to load balance the mesh sequentially. This is because (1) therewould be a serious sequential bottleneck, (2) there would not be enough memory in a host machine to store the entiredistributed mesh, and (3) the large cost incurred in communicating the entire mesh.
The three methods are:
• SA - Simulated Annealing: We directly minimize the above cost function by a process analogous to slowphysical cooling.
• ORB - Orthogonal Recursive Bisection: A simple method which cuts the graph into two by a vertical cut, thencuts each half into two by a horizontal cut, then each quarter is cut vertically, and so on.
• ERB - Eigenvector Recursive Bisection: This method also cuts the graph in two then each half into two, and soon, but the cutting is done using an eigenvector of a matrix with the same sparsity structure as the adjacency
H 1 1 α−( ) 2 µ 6α+ +=
H 1 1 α−( ) 2 2µ 1 δα 0,−( )+ += dimension = 1
dimension = 2
Figure 1: Cost function variation with filling fraction in two dimensions, forµ = 0 (bottom curve) to 0.6 (upper curve) insteps of 0.1.
H = 1
H = 2
α = 0 α = 2α = 1

- 6 -
matrix of the graph. The method is an approximation to a computational neural net.
5. Simulated AnnealingSimulated annealing5,6,7 is a very general optimization method which stochastically simulates the slow cooling of aphysical system. The idea is that there is a cost functionH (in physical terms a Hamiltonian) which associates a costwith a state of the system, a ‘temperature’T, and various ways to change the state of the system. The algorithm worksby iteratively proposing changes and either accepting or rejecting each change. Having proposed a change we mayevaluate the changeδH in H. The proposed change may be accepted or rejected by theMetropolis criterion; if the costfunction decreases (δH < 0) the change is accepted unconditionally, otherwise it is accepted but only with probabilityexp(-δH / T). A crucial requirement for the proposed changes isreachability: that there be a sufficient variety ofchanges that there is a sequence of changes so that any system state may be reached from any other.
When the temperature is zero, changes are accepted only ifH decreases, an algorithm also known as thegreedyalgorithm or hill-climbing. The system soon reaches a state in which none of the proposed changes can decrease thecost function, but this is usually a poor optimum. In real life we might be trying to achieve the highest point of amountain range by simply walking upwards; we soon arrive at the peak of a small foothill and can go no further.
On the contrary, if the temperature is very large, all changes are accepted, and we simply move at random ignoring thecost function. Because of the reachability property of the set of changes, we explore all states of the system, includingthe global optimum.
Simulated annealing consists of running the accept/reject algorithm between the temperature extremes. We proposemany changes, starting at a high temperature and exploring the state space, and gradually decreasing the temperatureto zero while hopefully settling on the global optimum. It can be shown that if the temperature decreases sufficientlyslowly (the inverse of the logarithm of the time), then the probability of being in a global optimum tends to certainty7.
Figure 2 shows simulated annealing applied to the load balancing cost function in one dimension. The graph to be
colored is a periodically connected linear array of 200 nodes, to be colored with four colors. The initial configuration,at the bottom of the figure, is the left 100 nodes colored white, two domains of 50 each in mid grays, and with no nodescolored in the darkest gray. We know that the global optimum is 50 nodes of each color, with all the nodes of the samecolor consecutive.
At each iteration of the annealing, a random node is chosen, and its color changed to a random color. This proposedmove is accepted if the Metropolis criterion is accepted. At the end of the annealing, at the top of the figure, a good
Figure 2: Simulated annealing of a ring graph of size 200, with the four graph colors shown by gray shades. The time historyof the annealing runs vertically, with the maximum temperature and the starting configuration at the bottom; zerotemperature and the final optimum at the top. The basic move is to change the color of a graph node to a random color.
zerotemperature
hightemperature
Random
- 7 -
balance is achieved, with each color having equal numbers of nodes, but there are 14 places where the color changes(communication cost = 14), rather than the minimum four.
5.1 Heuristics
In choosing the change to be made to the state of the system, there may be intuitive or heuristic reasons to choose achange which tends to reduce the cost function. For our example of load balancing, we know that the optimal coloringof the graph has equal sized compact ‘globules’; if we were to restrict the new color of a node to be the color of oneof its two neighbors, then the boundaries between colors move without creating new domains.
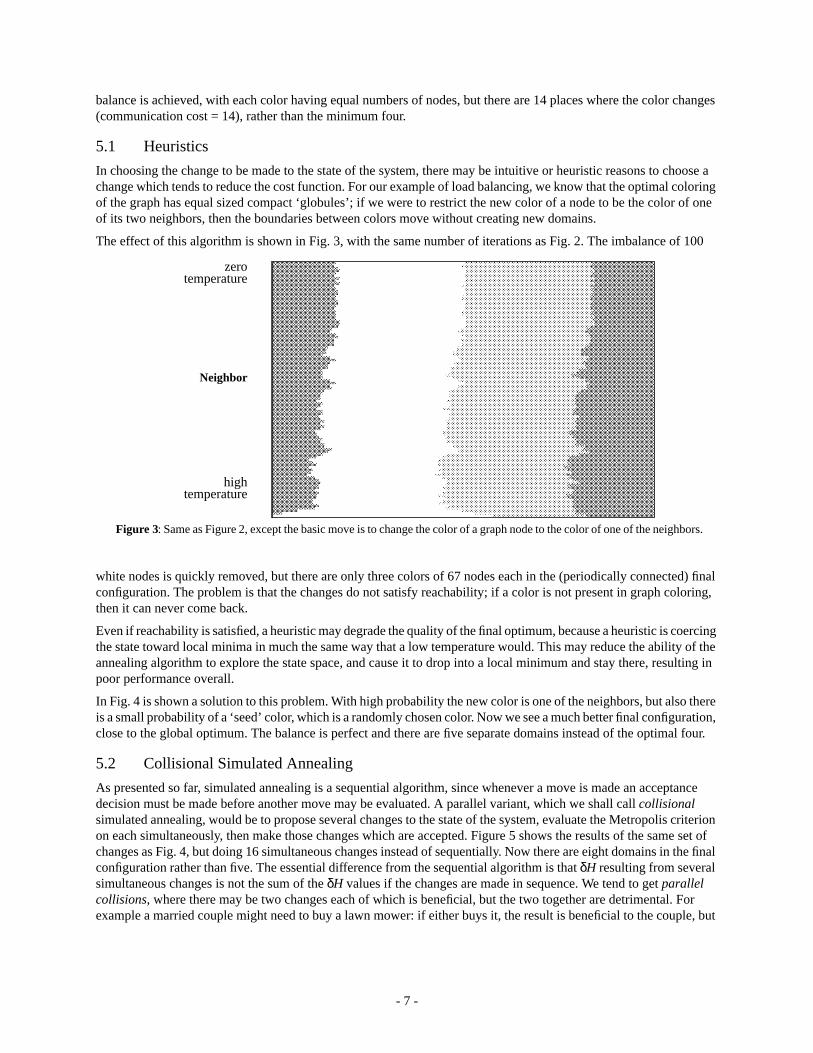
The effect of this algorithm is shown in Fig. 3, with the same number of iterations as Fig. 2. The imbalance of 100
white nodes is quickly removed, but there are only three colors of 67 nodes each in the (periodically connected) finalconfiguration. The problem is that the changes do not satisfy reachability; if a color is not present in graph coloring,then it can never come back.
Even if reachability is satisfied, a heuristic may degrade the quality of the final optimum, because a heuristic is coercingthe state toward local minima in much the same way that a low temperature would. This may reduce the ability of theannealing algorithm to explore the state space, and cause it to drop into a local minimum and stay there, resulting inpoor performance overall.
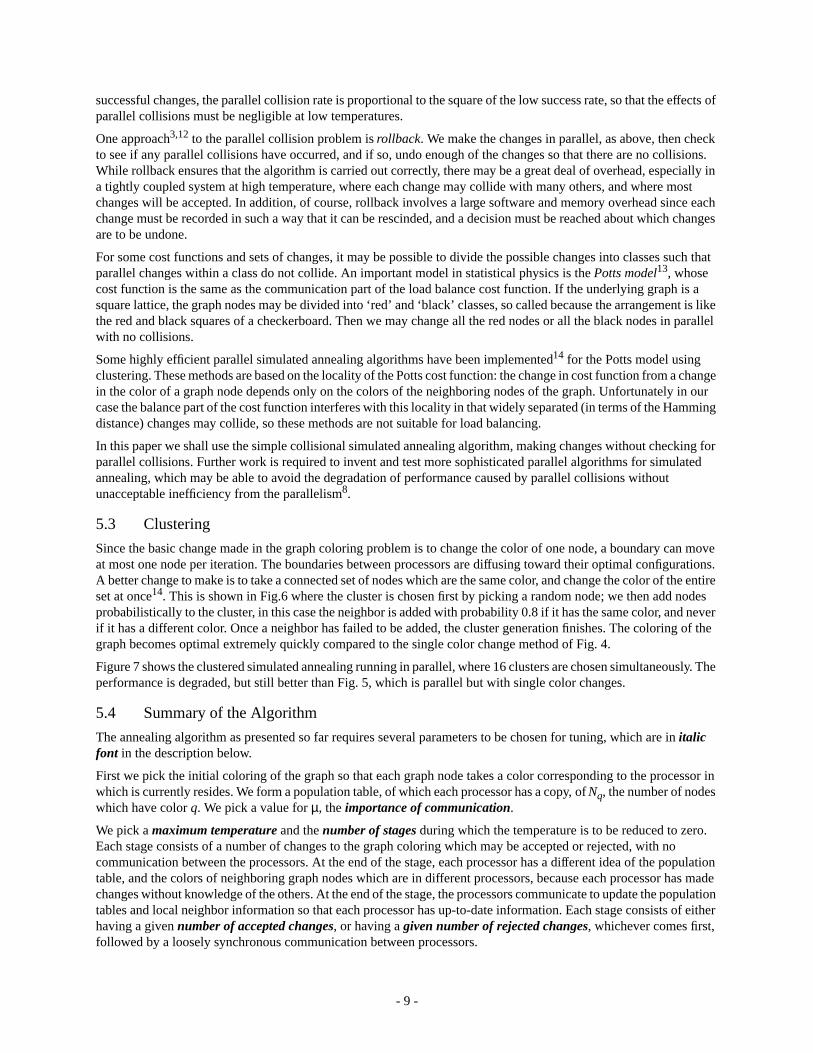
In Fig. 4 is shown a solution to this problem. With high probability the new color is one of the neighbors, but also thereis a small probability of a ‘seed’ color, which is a randomly chosen color. Now we see a much better final configuration,close to the global optimum. The balance is perfect and there are five separate domains instead of the optimal four.
5.2 Collisional Simulated Annealing
As presented so far, simulated annealing is a sequential algorithm, since whenever a move is made an acceptancedecision must be made before another move may be evaluated. A parallel variant, which we shall callcollisionalsimulated annealing, would be to propose several changes to the state of the system, evaluate the Metropolis criterionon each simultaneously, then make those changes which are accepted. Figure 5 shows the results of the same set ofchanges as Fig. 4, but doing 16 simultaneous changes instead of sequentially. Now there are eight domains in the finalconfiguration rather than five. The essential difference from the sequential algorithm is thatδH resulting from severalsimultaneous changes is not the sum of theδH values if the changes are made in sequence. We tend to getparallelcollisions, where there may be two changes each of which is beneficial, but the two together are detrimental. Forexample a married couple might need to buy a lawn mower: if either buys it, the result is beneficial to the couple, but
Figure 3: Same as Figure 2, except the basic move is to change the color of a graph node to the color of one of the neighbors.
zerotemperature
hightemperature
Neighbor

- 8 -
if both simultaneously buy lawn mowers, the result is detrimental because they only need one.
Figure 6 shows how parallel collisions can adversely affect the load balancing process. At left two processors share asmall mesh, shown by the two colors, with a sawtooth division between them. There are 7 edges with different colorson each side. In the middle are shown the separate views of the situation by each processor, and each processordiscovers that by changing the color of the teeth of the sawtooth it can reduce the boundary from 7 to 4. On the rightis shown the result of these simultaneous changes; the boundary has increased to 15, instead of the 4 that would resultif only one processor went ahead.
The problem with this parallel variant is of course that we are no longer doing the correct algorithm, since eachprocessor is making changes without consulting the others. As noted in Refs 8-11, we have an algorithm which ishighly parallel, but not particularly efficient. We should note that when the temperature is close to zero, the successrate of changes (ratio of accepted to proposed changes) falls to zero: since a parallel collision depends on two
Figure 4: Same as Figure 2, except the basic move is to change the color of a graph node to the color of one ofthe neighbors with large probability, and to a random color with small probability.
zerotemperature
hightemperature
99% Neighbor1% Random
Figure 5: Same as Figure 4, except the optimization is being carried out in parallel by 16 processors. Note thefuzzy edges of the domains caused by parallel collisions.
zerotemperature
hightemperature
Parallel99%Neighbor
1% Seed
- 9 -
successful changes, the parallel collision rate is proportional to the square of the low success rate, so that the effects ofparallel collisions must be negligible at low temperatures.
One approach3,12 to the parallel collision problem isrollback. We make the changes in parallel, as above, then checkto see if any parallel collisions have occurred, and if so, undo enough of the changes so that there are no collisions.While rollback ensures that the algorithm is carried out correctly, there may be a great deal of overhead, especially ina tightly coupled system at high temperature, where each change may collide with many others, and where mostchanges will be accepted. In addition, of course, rollback involves a large software and memory overhead since eachchange must be recorded in such a way that it can be rescinded, and a decision must be reached about which changesare to be undone.
For some cost functions and sets of changes, it may be possible to divide the possible changes into classes such thatparallel changes within a class do not collide. An important model in statistical physics is thePotts model13, whosecost function is the same as the communication part of the load balance cost function. If the underlying graph is asquare lattice, the graph nodes may be divided into ‘red’ and ‘black’ classes, so called because the arrangement is likethe red and black squares of a checkerboard. Then we may change all the red nodes or all the black nodes in parallelwith no collisions.
Some highly efficient parallel simulated annealing algorithms have been implemented14 for the Potts model usingclustering. These methods are based on the locality of the Potts cost function: the change in cost function from a changein the color of a graph node depends only on the colors of the neighboring nodes of the graph. Unfortunately in ourcase the balance part of the cost function interferes with this locality in that widely separated (in terms of the Hammingdistance) changes may collide, so these methods are not suitable for load balancing.
In this paper we shall use the simple collisional simulated annealing algorithm, making changes without checking forparallel collisions. Further work is required to invent and test more sophisticated parallel algorithms for simulatedannealing, which may be able to avoid the degradation of performance caused by parallel collisions withoutunacceptable inefficiency from the parallelism8.
5.3 Clustering
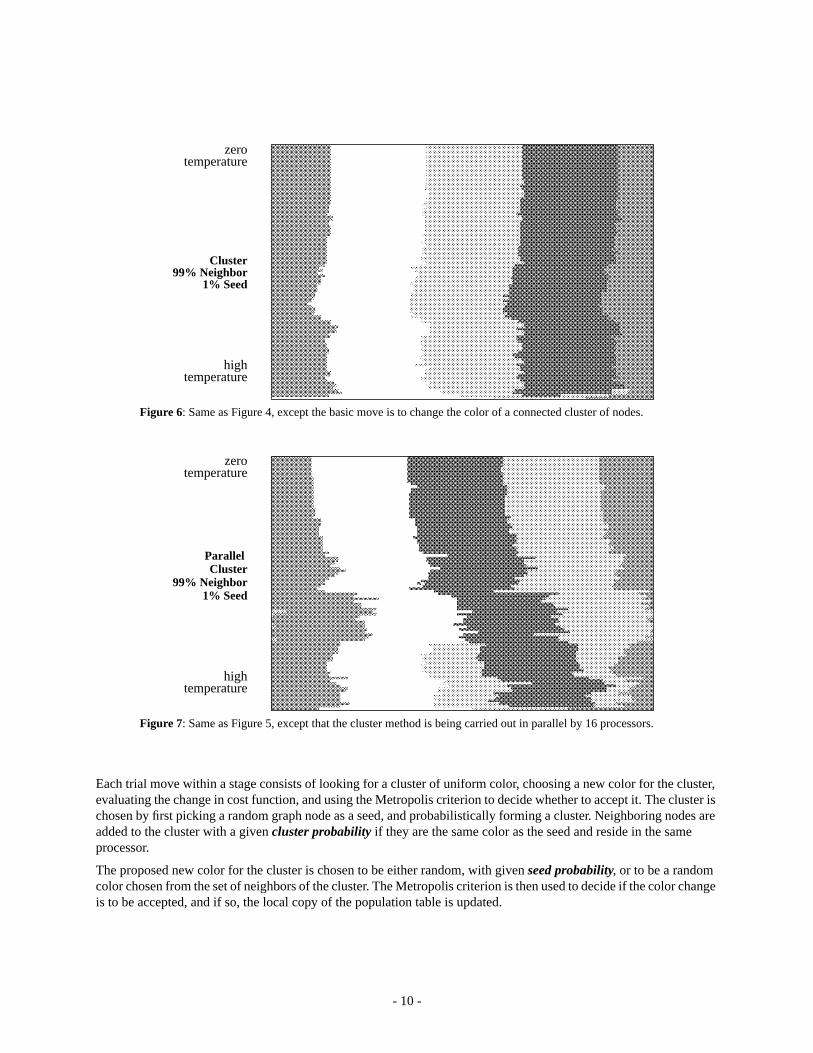
Since the basic change made in the graph coloring problem is to change the color of one node, a boundary can moveat most one node per iteration. The boundaries between processors are diffusing toward their optimal configurations.A better change to make is to take a connected set of nodes which are the same color, and change the color of the entireset at once14. This is shown in Fig.6 where the cluster is chosen first by picking a random node; we then add nodesprobabilistically to the cluster, in this case the neighbor is added with probability 0.8 if it has the same color, and neverif it has a different color. Once a neighbor has failed to be added, the cluster generation finishes. The coloring of thegraph becomes optimal extremely quickly compared to the single color change method of Fig. 4.
Figure 7 shows the clustered simulated annealing running in parallel, where 16 clusters are chosen simultaneously. Theperformance is degraded, but still better than Fig. 5, which is parallel but with single color changes.
5.4 Summary of the Algorithm
The annealing algorithm as presented so far requires several parameters to be chosen for tuning, which are initalicfont in the description below.
First we pick the initial coloring of the graph so that each graph node takes a color corresponding to the processor inwhich is currently resides. We form a population table, of which each processor has a copy, ofNq, the number of nodeswhich have color q. We pick a value forµ, theimportance of communication.
We pick amaximum temperature and thenumber of stages during which the temperature is to be reduced to zero.Each stage consists of a number of changes to the graph coloring which may be accepted or rejected, with nocommunication between the processors. At the end of the stage, each processor has a different idea of the populationtable, and the colors of neighboring graph nodes which are in different processors, because each processor has madechanges without knowledge of the others. At the end of the stage, the processors communicate to update the populationtables and local neighbor information so that each processor has up-to-date information. Each stage consists of eitherhaving a givennumber of accepted changes, or having agiven number of rejected changes, whichever comes first,followed by a loosely synchronous communication between processors.
- 10 -
Each trial move within a stage consists of looking for a cluster of uniform color, choosing a new color for the cluster,evaluating the change in cost function, and using the Metropolis criterion to decide whether to accept it. The cluster ischosen by first picking a random graph node as a seed, and probabilistically forming a cluster. Neighboring nodes areadded to the cluster with a givencluster probability if they are the same color as the seed and reside in the sameprocessor.
The proposed new color for the cluster is chosen to be either random, with given seed probability, or to be a randomcolor chosen from the set of neighbors of the cluster. The Metropolis criterion is then used to decide if the color changeis to be accepted, and if so, the local copy of the population table is updated.
Figure 6: Same as Figure 4, except the basic move is to change the color of a connected cluster of nodes.
zerotemperature
hightemperature
Cluster99% Neighbor
1% Seed
Figure 7: Same as Figure 5, except that the cluster method is being carried out in parallel by 16 processors.
zerotemperature
hightemperature
Parallel
99% Neighbor 1% Seed
Cluster

- 11 -
6. Recursive BisectionRather than coloring the graph by direct minimization of the load balance cost function, we may do better to reducethe problem to a number of smaller problems. The idea of recursive bisection is that it is easier to color a graph withtwo colors than many colors. We first split the graph into two halves, minimizing the communication between thehalves. We can then color each half with two colors, and so on, recursively bisecting each subgraph.
There are two advantages to recursive bisection, firstly that each subproblem (coloring a graph with two colors) iseasier than the general problem, and secondly that there is natural parallelism. While the first stage is splitting a singlegraph in two, and is thus a sequential problem, there is two-way parallelism at the second stage, when the two halvesare being split, and four-way parallelism when the four quarters are being split. Thus coloring a graph withP colors isachieved in a number of stages which is logarithmic inP.
Both of the recursive bisection methods we shall discuss split a graph into two by associating a scalar quantityse witheach graph nodee, which we may call aseparator field. By evaluating the medianS of the se, we can color the graphaccording to whetherse is greater or less thanS. The median is chosen as the division so that the numbers of nodes ineach half are automatically equal; the problem is now reduced to that of choosing the field se so that the communicationis minimized.
6.1 Orthogonal Recursive Bisection
A simple and cheap choice4 for the separator field is based on the position of the finite elements in the mesh. We mightlet the value ofse be the x-coordinate of the center of mass of the element, so that the mesh is split in two by a medianline parallel to they-axis. At the next stage we split the submesh by a median line parallel to thex-axis, alternatingbetweenx andy stage by stage, as shown in Fig. 8.
Extensions of this method might be
• to decide at each stage whether the horizontal or vertical split were better,
• to calculate the moment of inertia tensor of the set of element centers, and take the bisection as the lineperpendicular to the axis of minimum moment.
In each case, the set of elements is considered to be simply a set of points with geometrical position and all connectiveinformation ignored; to have any hope of optimality in this bisection, the geometry of these points must in some sensebe close to the graph we are trying to bisect.
7. Eigenvalue Recursive BisectionBetter but more expensive methods for splitting a graph are based on finding a particular eigenvector of a sparse matrixwhich has the structure of the adjacency matrix of the graph, and using this eigenvector as a separator field15,16,17.
We may express the mincut problem algebraically by associating a variablexe with each node of the graph which maybe 1 or -1 corresponding to the two sides of the cut. The communication part of the cost function may be expressed as:
Figure 8: Load balancing by ORB for four processors. The elements (left) are reduced to points at their centers of mass(middle), then split into two vertically, then each half split into two horizontally. The result (right) shows the assignmentof elements to processors.

- 12 -
where the sum is over nodes which are connected by an edge of the graph. To cut the graph into two equal pieces, werequire that the same number of the xe be 1 as -1, which means that the balance constraint must be satisfied:
The minimization ofHcomm with the balance constraint is a difficult problem. However, if we allow thexe to becontinuous rather than discrete variables, it reduces to a simple eigenvector calculation. Neglecting the factor of 1/4,the matrix associated with the quadratic form ofHcomm may be written asQ = D-A, whereA is the adjacency matrixof the graph, withAef = 1 iff e and f are connected by an edge, and D is the diagonal matrix withDee being the degreeof the graph nodee. Q is known as the Laplacian matrix of the graph.
SinceHcomm is positive semidefinite, all the eigenvalues ofQ are nonnegative; furthermore there is a trivial zeroeigenvalue corresponding to the state with all thexe equal. This state cannot satisfy the balance constraint, so we mustconsider other eigenstates ofQ. If the graph we are trying to split is not connected, there are other zero-eigenvectorstates, such that xe is constant on each connected subgraph. We shall assume at this point that the graph is connected,so that there is only one zero-eigenvalue state.
Let ye be the components of the eigenvector ofQ with smallest positive eigenvalue. The orthogonality of this state tothe zero-eigenvalue state ensures that the balance constraint is satisfied, at least in the continuous sense. Now we maytry to obtain a solution of the original discrete optimization using the eigenvectory.
The simplest approach, which seems to be quite effective, is to use the components of y as a separator field: find themedian value of theye and split the graph according to whetherye is greater or less than the median.
If we split a connected graph in two equal pieces while minimizing the boundary, we would expect each half to be aconnected subgraph of the original graph. This intuition is supported by a theorem of Fiedler18 that when we do thesplitting by the second eigenvector of the Laplacian matrix, as above, then the halves are indeed connected. This meansthat in subsequent bisections, the graph will be connected, as assumed above.
To calculate this second eigenstate, we use the Lanczos method15,19,20. We can explicitly exclude the eigenvector ofvalue zero, because the form of this eigenvector is equal entries for each element of the vector. The accuracy of theLanczos method increases quickly with the number ofLanczos vectors used. We find that 30 Lanczos vectors aresufficient for splitting a graph of 4000 nodes.
A closely related eigenvector method16,17 is based on the second highest eigenvector of the adjacency matrix of thegraph, rather than the second lowest eigenvector of the Laplacian matrix. The advantage of the Laplacian method is inthe implementation: the first eigenvector is known exactly (the vector of all equal elements), so that it can be explicitlydeflated in the Lanczos method.
8. Software for Unstructured Meshes (DIME)Applications such as supersonic and incompressible flow, 3D electrostatics and stress analysis have been implementedwith DIME (Distributed Irregular Mesh Environment)2. DIME is a programming environment for doing distributedcalculations with unstructured triangular meshes. There are sequential tools for defining a domain to be meshed andcoarsely meshing the domain, then the coarse mesh is loaded into a single processor of the distributed machine andmay be refined, topologically changed, and load balanced, these operations being controlled by an application codewhich is linked with the DIME library.
The application code is responsible for defining a set of data which exists at each element, node, boundary node andboundary edge of the mesh, containing data relevant to the application code. For example in the Laplace solver, avariablepsi is stored in each node, being the value of the solution at that node, and geometrical data is associatedwith each element to calculate the stiffness matrix. The application code may loop through all the elements or nodesof the mesh, and for a particular element loop through the neighboring node or element structures.
Hcomm14
xe xf−( ) 2
e f↔∑=
xee∑ 0=

- 13 -
The writer of a DIME application code must be aware of the distributed nature of the calculation in the sense that somefunction calls areloosely synchronous3. This is because whenever a communication occurs between two processors,the receiver must expect the message it is to get from the sender, and will wait until such message is received. If someloosely synchronous function has been called in some processors but not in others, deadlock will occur whileprocessors wait for messages that never come.
An example is the mesh migration function used for load balancing. This function is used by first deciding whichelement of the mesh goes to which processor, and calling a function to inform DIME of each decision. We then callthe loosely synchronous migration functionbalance( ). Load balancing thus has two distinct phases: the decisionabout which element goes where, followed by the loosely synchronous migration of the elements to their newprocessors. This latter part is time-consuming, sending structures with all their application data, memory allocationand freeing, informing other processors of the new locations of the elements and nodes, and acknowledgmentmessages.
Our approach to element migration is to make all the decisions, then migrate all the elements; rather than sendingindividual elements asynchronously and individually.
9. Testing MethodWe have tested these three load balancing methods using a simple DIME application which solves Laplaces’s equation.The testbed application is to solve Laplace’s equation with Dirichlet boundary conditions, in the domain shown in Fig.9. The square outer boundary has voltage linearly increasing vertically from -1.2 to +1.2, the lightly shaded S-shaped
internal boundary has voltage +1, and the dark shaded hook-shaped internal boundary has voltage -1. Contour lines ofthe solution are also shown in the figure, with contour interval 0.08.
The test begins with a relatively coarse mesh of 280 elements, all residing in a single processor, with the others havingnone. The Laplace equation is solved by Jacobi iteration, and the mesh refined based on the solution obtained so far,then the mesh is balanced by the method under test. This sequence: solve, refine, balance, is repeated seven times untilthe final mesh has 5772 elements. The starting and ending meshes are shown in Fig. 10.
Figure 9: Solution of the Laplaceequation used to test loadbalancing methods. The outerboundary has voltage increasinglinearly from -1.2 to 1.2 in thevertical direction, the light shadeis voltage 1 and the dark shadevoltage -1.

- 14 -
The refinement is solution-adaptive, so that the set of elements to be refined is based on the solution that has beencomputed so far. The refinement criterion is the magnitude of the gradient of the solution, so that the most heavilyrefined part of the domain is that between the S-shaped and hook-shaped boundaries where the contour lines are closesttogether. At each refinement the criterion is calculated for each element of the mesh, and a value is found such that agiven proportion of the elements are to be refined, and those with higher values than this are refined looselysynchronously. For this test of load balancing, we refined 40% of the elements of the mesh at each stage.
This choice of refinement criterion is not particularly to improve the accuracy of the solution, but to test the loadbalancing methods as the mesh distribution changes. The initial mesh is essentially a square covered in mesh ofroughly uniform density, and the final mesh is dominated by the long, thin S-shaped region between the internalboundaries, so the mesh changes character from two-dimensional to almost one-dimensional.
We ran this test sequence on 16 nodes of an NCUBE/10 parallel machine, using ORB and ERB and two runs with SA,the difference being a factor of ten in cooling rate, and different starting temperatures.
The Eigenvalue Recursive Bisection used the deflated Lanczos method for diagonalization, with three iterations of 30Lanczos vectors each to find the second eigenvector. These numbers were chosen so that more iterations and Lanczosvectors produced no significant improvement, and fewer degraded the performance of the algorithm.
The parameters used for the collisional annealing were as follows;
• The starting temperature for the run labelled SA1 was 0.2, and for the run labelled SA2 was 1.0. In the formercase movement of the boundaries is allowed, but a significant memory of the initial coloring is retained. In thelatter case large fluctuations are allowed, the system is heated to randomness, and all memory of the initialconfiguration is erased.
• The boundary importance was set at 0.1, which is large enough to make communication important in the costfunction, but small enough that all processors will get their share of elements.
• The curves labelled SA1 correspond to cooling to zero temperature in 500 stages, those labelled SA2 to coolingin 5000 stages.
• Each stage consisted of finding either 1 successful change (per processor) or 200 unsuccessful changes beforecommunicating and thus getting the correct global picture.
Figure 10: Initial and final meshes for the load balancing test. The initial mesh with 280 elements is essentially a uniformmeshing of the square, and the final mesh of 5772 elements is dominated by the highly refined S-shaped region in thecenter.
- 15 -
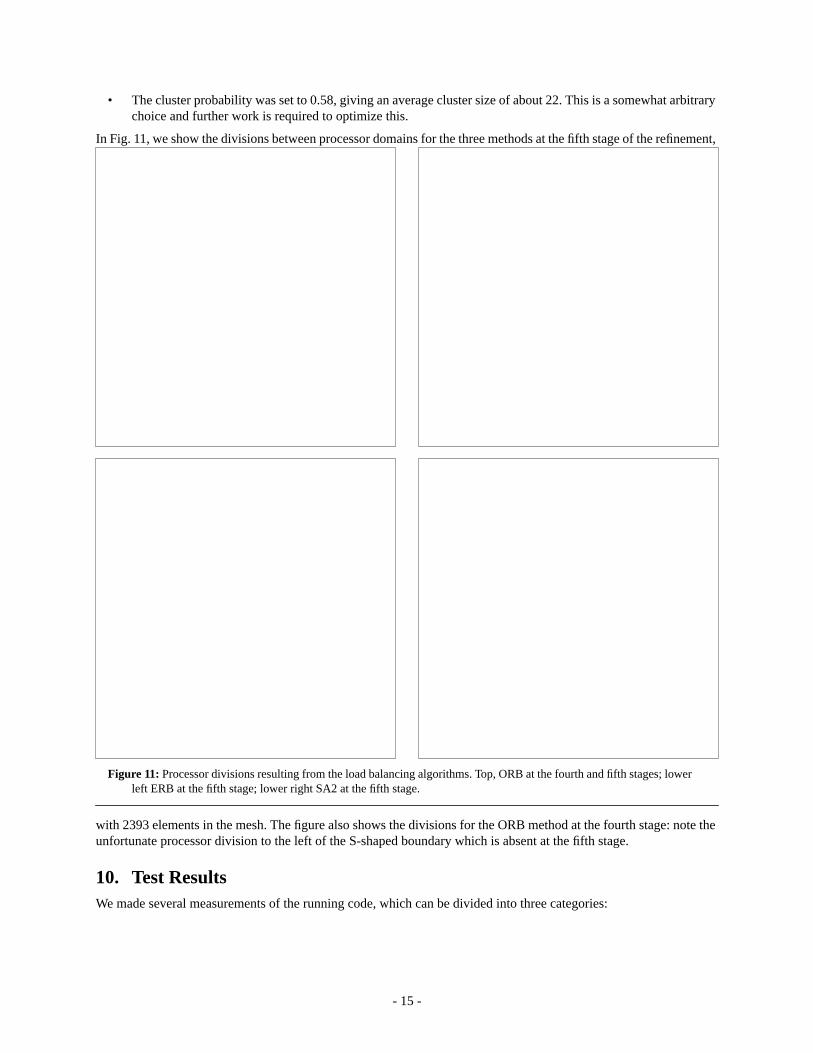
• The cluster probability was set to 0.58, giving an average cluster size of about 22. This is a somewhat arbitrarychoice and further work is required to optimize this.
In Fig. 11, we show the divisions between processor domains for the three methods at the fifth stage of the refinement,
with 2393 elements in the mesh. The figure also shows the divisions for the ORB method at the fourth stage: note theunfortunate processor division to the left of the S-shaped boundary which is absent at the fifth stage.
10. Test ResultsWe made several measurements of the running code, which can be divided into three categories:
Figure 11: Processor divisions resulting from the load balancing algorithms. Top, ORB at the fourth and fifth stages; lowerleft ERB at the fifth stage; lower right SA2 at the fifth stage.

- 16 -
10.1 Machine-independent Measurements
These are measurements of the quality of the solution to the graph coloring problem which are independent of theparticular machine on which the code is run.
Let us defineload imbalance to be the difference between the maximum and minimum numbers of elements perprocessor compared to the average number of elements per processor.
The two criteria for measuring communication overhead are thetotal traffic size, which is the sum over processors ofthe number of floating-point numbers sent to other processors per iteration of the Laplace solver, and thenumber ofmessages, which is the sum over processors of the number of messages used to accomplish this communication.
These results are shown in Fig. 12. The load imbalance is significantly poorer for both the SA runs, because the method
does not have the exact balance built in as do the RB methods, but instead exchanges load imbalance for reducing thecommunication part of the cost function. The imbalance for the RB methods comes about from splitting an odd numberof elements, which of course cannot be exactly split in two.
0 100 200 300 4000
5
10
15
20
25
SA1
SA2
ERB ORB
Elements per Processor
0 100 200 300 4000
200
400
600
800
1000
SA1
SA2
ERB
ORB
Elements per Processor
0 100 200 300 4000
20
40
60
80
100
SA1
SA2 ERB
ORB
Elements per Processor
Figure 12: Machine-independent measures of loadbalancing performance. Left, percentage loadimbalance; lower left, total amount of communication;below, total number of messages.
- 17 -
There is a sudden reduction in total traffic size for the ORB method between the fourth and fifth stages of refinement.This is caused by the geometry of the mesh as shown at the top of Fig. 11; at the fourth stage the first vertical bisectionis just to the left of the light S-shaped region creating a large amount of unnecessary communication, and for the fifthand subsequent stages the cut fortuitously misses the highly refined part of the mesh.
10.2 Machine-dependent Measurements
These are measurements which depend on the particular hardware and message-passing software on which the code isrun. The primary measurement is of course the time it takes the code to run to completion; this is the sum of start-uptime, load balancing time, and the product of the number of iterations of the inner loop times the time per iteration. Forquasi-static load balancing, we are assuming that the time spent in the inner loop is much longer than the load balancetime, so this is our primary measurement of load balancing performance. Rather than use an arbitrary time unit suchas seconds for this measurement, we have counted this time per iteration as an equivalent number of floating pointoperations (flops). For the NCUBE this time unit is 15µs for a 64-bit multiply. Thus we measureflops per iterationof the Jacobi solver.
The secondary measurement is thecommunication time per iteration, also measured in flops. This is just the localcommunication in the graph, and does not include the time for the global combine which is necessary to decide if theLaplace solver has reached convergence.
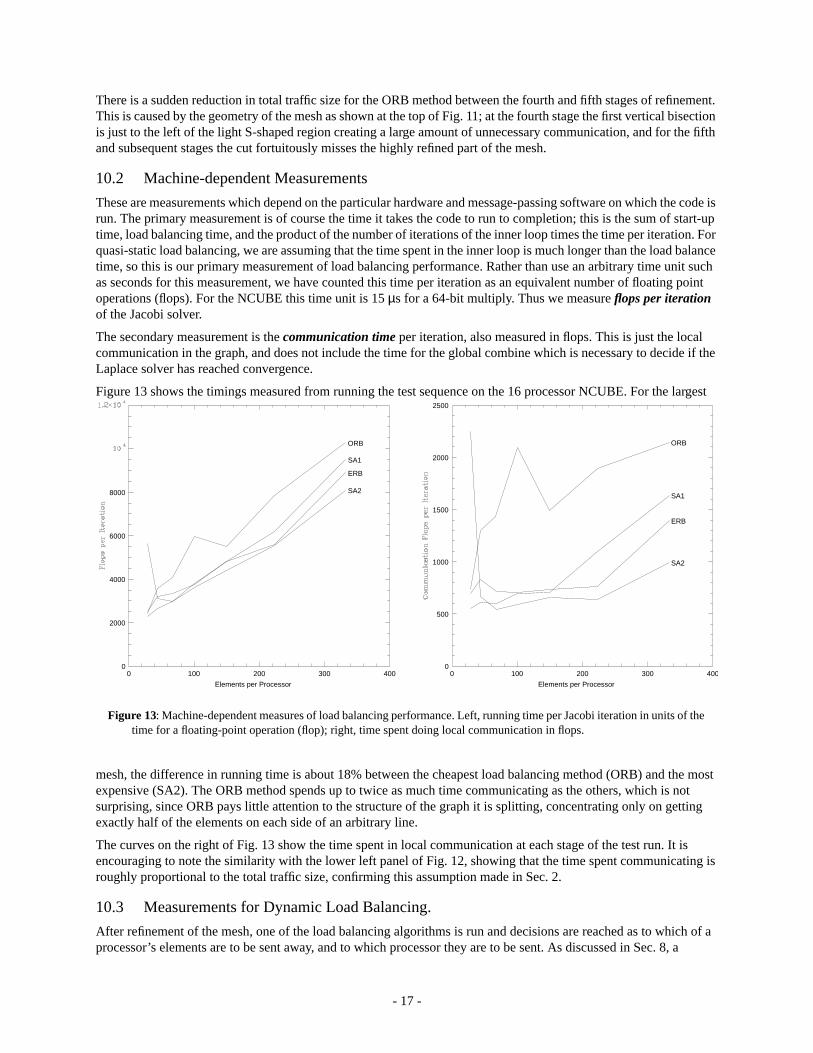
Figure 13 shows the timings measured from running the test sequence on the 16 processor NCUBE. For the largest
mesh, the difference in running time is about 18% between the cheapest load balancing method (ORB) and the mostexpensive (SA2). The ORB method spends up to twice as much time communicating as the others, which is notsurprising, since ORB pays little attention to the structure of the graph it is splitting, concentrating only on gettingexactly half of the elements on each side of an arbitrary line.
The curves on the right of Fig. 13 show the time spent in local communication at each stage of the test run. It isencouraging to note the similarity with the lower left panel of Fig. 12, showing that the time spent communicating isroughly proportional to the total traffic size, confirming this assumption made in Sec. 2.
10.3 Measurements for Dynamic Load Balancing.
After refinement of the mesh, one of the load balancing algorithms is run and decisions are reached as to which of aprocessor’s elements are to be sent away, and to which processor they are to be sent. As discussed in Sec. 8, a
0 100 200 300 4000
2000
4000
6000
8000
SA1
SA2
ERB
ORB
Elements per Processor
0 100 200 300 4000
500
1000
1500
2000
2500
SA1
SA2
ERB
ORB
Elements per Processor
Figure 13: Machine-dependent measures of load balancing performance. Left, running time per Jacobi iteration in units of thetime for a floating-point operation (flop); right, time spent doing local communication in flops.

- 18 -
significant fraction of the time taken by the load balancer is taken in this migration of elements, since not only mustthe element and its data be communicated, but space must be allocated in the new processor and other processors mustbe informed of the new address of the element, and so on. Thus an important measure of the performance of analgorithm for dynamic (in contrast to quasi-dynamic) load balancing is the number of elements migrated, as aproportion of the total number of elements.
Figure 14 shows the percentage of the elements which migrated at each stage of the test run. The one which does best
here is ORB, because refinement causes only slight movement of the vertical and horizontal median lines. The SA runsare different because of the different starting temperatures: SA1 started at a temperature low enough that the edges ofthe domains were just ‘warmed up’, in contrast to SA2 which started at a temperature high enough to completely forgetthe initial configuration and thus essentially all the elements are moved. The ERB method causes the largest amountof element migration, which is because of two reasons. The first is because some elements are migrated several timesbecause the load balancing is done in log2 P stages forP processors; this is not a fundamental problem, and arises fromthe particular implementation of the method used here. The second reason is that a small change in mesh refinementmay lead to a large change in the second eigenvector; perhaps a modification of the method could use the distributionof the mesh before refinement to create an inertial term so that the change in eigenvector as the mesh is refined couldbe controlled.
The migration time is only part of the time take to do the load balancing, the other part being that taken to make thedecisions about which element goes where. The total times for load balancing during the seven stages of the test run(solving the coloring problem plus the migration time) are shown in the table below:
0 100 200 300 4000
50
100
150
SA1
SA2
ERB
ORB
Elements per Processor
Figure 14: Percentage of elements migrated during each load balancing stage. The percentage may be greater than 100 becausethe recursive bisection methods may cause the same element to be migrated several times.
ORB
ERB
SA1
SA2
5
11
25
230
Method Time(minutes)
- 19 -
For the test run, the time per iteration was measured in fractions of a second, and it took few iterations to obtain fullconvergence of the Laplace equation, so that a high-quality load balance is obviously irrelevant for this simple case.The point is that the more sophisticated the algorithm for which the mesh is being used, the greater the time taken inusing the distributed mesh compared to the time taken for the load balance. For a sufficiently complex application, forexample unsteady reactive flow simulation, the calculations associated with each element of the mesh may be enoughthat a few minutes spent load balancing is by comparison completely negligible, so that the quasi-dynamic assumptionwould be justified.
11. ConclusionsThe Laplace solver that we used for the test run embodies the typical operation that is done with finite element meshes,which is matrix-vector multiply. Thus we are not testing load balancing strategies just for a Laplace solver, but for ageneral class of applications, namely those which use matrix-vector multiply as the heart of a scheme which iteratesto convergence on a fixed mesh, then refines the mesh and repeats the convergence.
Each load balancing algorithm may be measured by three criteria;
• The quality of the solution it produces, measured by the time per iteration in the solver,
• The time it takes to do the load balancing, measured by the time it takes to solve the graph coloring problemand by the number of elements which must then be migrated,
• The portability of the method for different kinds of applications with different kinds of meshes, and the numberof parameters that must be set to obtain optimal performance from the method.
Orthogonal Recursive Bisection is certainly cheap, both in terms of the time it takes to solve the graph coloringproblem and the number of elements which must be migrated. It is also portable to different applications, the onlyrequired information being the dimensionality of the mesh, and easy to program. Our tests indicate, however, that moreexpensive methods can improve performance by over 20%. Because ORB pays no attention to the connectivity of theelement graph, one suspects that as the geometry of the underlying domain and solution become more complex, thisgap will widen.
Simulated Annealing is actually a family of methods for solving optimization problems. Even when run sequentially,care must be taken in choosing the correct set of changes that may be made to the state space, and in choosing atemperature schedule to ensure a good optimum. We have tried a ‘brute force’ parallelization of simulated annealing,essentially ignoring the parallelism. For sufficiently slow cooling this method produces the best solution to the loadbalancing problem when measured either against the load balance cost function, or by timings on a real parallelcomputer. Unfortunately it takes a long time to produce this high-quality solution, perhaps because some of thenumerous input parameters are not set optimally. More probably a more sensitive treatment is required to reduce oreliminate parallel collisions8. Clearly further work is required to make SA a portable and efficient parallel loadbalancer for parallel finite element meshes. True portability may be difficult to achieve for SA, because the problembeing solved is graph coloring, and graphs are extremely diverse; perhaps something approaching an expert systemmay be required to decide the optimal annealing strategy for a particular graph.
Eigenvalue Recursive Bisection seems to be a good compromise between the other methods, providing a solution ofquality near that of SA at a price a little more than that of ORB. There are few parameters to be set, which are concernedwith the Lanczos algorithm for finding the second eigenvector. Mathematical analysis of the ERB method takes placein the familiar territory of linear algebra, in contrast to analysis of SA in the jungles of non-equilibriumthermodynamics. A major point in favor of ERB for balancing finite element meshes is that the software for loadbalancing with ERB is shared to a large extent with the body of finite element software: the heart of the eigenvectorcalculation is a matrix-vector multiply, which has already been efficiently coded elsewhere in the finite element library.
12. AcknowledgmentThis work was supported in part by Department of Energy grant DE-AC03-81ER40050.

- 20 -
13. References1. N. P. Chriochoides, C. E. Houstis, E. N. Houstis, P. N. Papachiou, S. K. Kortesis and J. R. Rice,Domain
Decomposer: A Software Tool for Mapping PDE Computations to Parallel Architectures, Perdue UniversityComputer Science Department CSD-TR-1025 (unpublished).
2. R. D. Williams,DIME: A User’s Manual, Caltech Concurrent Computation Report C3P 861, Feb. 1990.
3. G. C. Fox, M. A. Johnson, G. A. Lyzenga, S. W. Otto, J. K. Salmon and D. W. Walker,Solving Problems onConcurrent Processors, Prentice-Hall, Englewood Cliffs, NJ, 1988.
4. G. C. Fox inNumerical Algorithms for Modern Parallel Computers, ed. M. Schultz, Springer-Verlag, Berlin,1988.
5. S. Kirkpatrick, C. D. Gelatt, Jr. and M. P. Vecchi,Optimization by Simulated Annealing, Science220 (1983) 671.
6. R. H. J. M. Otten and L. P. P. P. van Ginneken,The Annealing Algorithm, Kluwer Academic, Boston, MA, 1989.
7. B. Hajek,Cooling Scedules for Optimal Annealing, Math. Oper. Res. 13 (1988) 311.
8. F. Baiardi and S. Orlando,Strategies for a Massively Parallel Implementation of Simulated Annealing, Springer-Verlag Lecture Notes in Comp. Sci.,366 (1989) 273.
9. B. Braschi, A. G. Ferreira and J. Zerovnik,On the Behavior of Parallel Simulated Annealing, in ParallelComputing 90, eds D. J. Evans, G. R. Joubert and F. J. Peters, Elsevier, Amsterdam, 1990.
10. R. D. Williams,Minimization by Simulated Annealing: Is Detailed Balance Necessary?, Caltech ConcurrentComputation Project Report C3P 354, Sep. 1986.
11. F. Barajas and R. D. Williams, Optimization with a Distributed-Memory Parallel Processor, Caltech ConcurrentComputation Project Report C3P 465, Sep. 1987.
12. M. A. Johnson,Concurrent Computation and its Application to the Study of Melting in Two Dimensions, CaltechPhD Thesis (1986), also Caltech Concurrent Computation Report C3P 268; see also Chap 17 in Ref 3.
13. F. Y. Wu, Rev. Mod. Phys.,54 (1982) 235.
14. P. D. Coddington and C. F. Baillie,Cluster Algorithms for Spin Models on MIMD Parallel Computers, Proc. 5thDistrib. Mem. Comput. Conf., ed. D. W. Walker, Charleston, SC, 1990.
15. A. Pothen, H. D. Simon and K. P. Liu,Partitioning Sparse Matrices with Eigenvectors of Graphs, Report RNR-89-009, NASA Ames Research Center, July 1989.
16. E. R. Barnes,An Algorithm for Partitioning the Nodes of a Graph, SIAM J. Alg. Disc. Meth., 3 (1982) 541.
17. R. B. Boppana,Eigenvalues and Graph Bisection: an Average Case Analysis, in 28th Annual Symp. Found.Comp. Sci, 1987.
18. M. Fiedler,Algebraic Connectivity of Graphs, Czech. Math. J.,23 (1973) 298;A Property of Eigenvectors of Non-negative Symmetric Matrics and its Application to Graph Theory, Czech. Math. J.,25 (1975) 619.
19. G. H. Golub and C. F. van Loan,Matrix Computations, Johns Hopkins University Press, Baltimore, MD, 1983.
20. B. Parlett,The Symmetric Eigenvalue Problem, Prentice-Hall, Englewood Cliffs, NJ, 1980.