Embed Size (px)
Citation preview
PerfsonarUI – a Standalone Graphical User Interface for Querying perfSONAR Services
Nina Jeliazkova Luchesar Iliev Vedrin Jeliazkov Institute for Parallel Processing – Bulgarian Academy of Sciences,
Acad. G. Bonchev 25A, 1113 Sofia, Bulgaria {nina|iliev|vedrin}@acad.bg
Abstract
Ensuring high-quality service from one end user to another, over multiple interconnected networks, is central to the aims and approach of GÉANT2, the pan-European research and education network. In order to provide users with reliable and consistent performance monitoring data from multiple networks, GÉANT2's Performance Measurement and Monitoring joint research activity, in co-operation with Internet2 and ESnet, is developing a comprehensive network monitoring facility – perfSONAR. Within the framework of this activity, we have developed an open source, publicly accessible, easy to use, and yet powerful standalone graphical user interface client, capable of querying all available perfSONAR services and displaying the returned data in a concise manner. This paper gives a short overview of the existing state-of-the-art solutions, introduces the fundamental concepts of the perfSONAR infrastructure, and describes the design, implementation, and use cases of PerfsonarUI, while highlighting its main advantages. Possible future enhancements of PerfsonarUI are also outlined. 1. Introduction
National Research and Education Networks (NRENs) provide high performance services to researchers across the world. Typical characteristics of these services include very high throughput and availability, low latency and jitter, as well as access to new technologies, not yet widely deployed and adopted in the commercial Internet. NRENs and various vendors have developed a range of network performance monitoring tools, which help ensuring the high quality of their services and efficient troubleshooting of any potential problems. Some of the
most popular tools are briefly reviewed in section 2. While efficient in a single domain (a NREN or ISP core network, or a client network, for example), many of those tools do not scale well across domain boundaries. On the other hand, end-to-end link monitoring and testing across multiple domains is often desirable or even required for better service transparency and easier problem troubleshooting.
The need for a flexible, secure, scalable, fault tolerant, transparent, and open source multi-domain network performance monitoring framework has inspired the Performance focused Service Oriented Network monitoring ARchitecture (perfSONAR) project [1], jointly developed by 16 European NRENs, Dante, GÉANT2, ESnet, Internet2, RNP, and the University of Delaware. The project name reflects the choice of a Service Oriented Architecture for system’s implementation. The fundamental concepts of the perfSONAR infrastructure are outlined in section 3.
Within the framework of the perfSONAR project, we have developed an open source, publicly accessible, easy to use, and yet powerful standalone graphical user interface client [2], capable of querying all available perfSONAR services and displaying the returned data in a concise manner. A more detailed description of PerfsonarUI’s design, implementation, and use cases is presented in section 4.
We conclude with outlining some possible future enhancements of PerfsonarUI. 2. Popular state-of-the-art network monitoring tools
In this section we briefly present some of the most widely used state-of-the-art network monitoring tools and provide some indications why the multi-domain performance monitoring scenario might be not well suited for most of them.
2.1. Multi Router Traffic Grapher (MRTG)
MRTG [3] consists of a Perl script, which uses SNMP to read the traffic counters of various network devices, and a fast C program, which logs the traffic data and creates graphs, representing the traffic on the monitored network connection. These graphs are then embedded into HTML pages, which in turn can be further served online by an HTTP server. In addition to a detailed daily view, MRTG also has powerful mechanisms to manage and aggregate data over time. It simplifies and automates dealing with missing data and handling of error conditions. MRTG has also built-in hooks for RRDtool [4], enabling a more efficient storage and retrieval of time-series data. Despite its initial design focused on SNMP counters, it has been used to measure and visualize a range of different metrics, including network characteristics, computing system performance and even weather, tides, and traffic jams.
Since the start of its development in 1994, MRTG has become the de facto industry standard for visualizing SNMP interface counters. Its database and visualization facilities are often used as components in other monitoring tools. While very useful, MRTG’s statistics are usually not presented in a seamless way across different domains, hampering their use in more complex environments to certain extent. 2.2. CACTI
CACTI [5] is a complete network graphing solution designed to harness the power of RRDtool’s data storage and graphing functionality. CACTI provides a fast poller, advanced graph templating, multiple data acquisition methods, and user management features. It is PHP driven and stores all of the necessary information to create graphs and populate them with data in a MySQL database. Along with being able to maintain Graphs, Data Sources, and Round Robin Archives in a database, CACTI also handles the data gathering process.
CACTI’s capabilities make it very suitable for deployments in single domain environments. 2.3. SmokePing
Another popular network performance measurement tool is SmokePing [6]. It measures, stores, and displays latency, latency distribution, and packet loss. SmokePing uses RRDtool for maintaining a long term data-store, as well as for its graphing functions. It also implements a latency measurement
plug-in interface for seamless extendibility and features a powerful anomaly detection and alarm reporting mechanism.
When used together, CACTI and SmokePing provide a very good summary and detailed overview of some of the most important network performance metrics like interface rate, round trip time, latency distribution, and packet loss. However, a higher level of integration between metrics reporting across multiple domains is desirable in many cases. 2.4. Commercial tools
A variety of tools for network monitoring and management is offered by commercial vendors. HP OpenView allows for the management of enterprise networks, while Infovista is suitable for the monitoring of nodes and links including the automatic alerting of operations staff. Mercury Interactive’s tools provide an aggregated view of the fulfilment of service level agreements. However, these tools are designed for network provider‘s internal use, and therefore are not tailored for multi-domain environments. 3. Performance focused service oriented network monitoring architecture
The performance focused service oriented network monitoring architecture (perfSONAR) [7] provides efficient means for performance monitoring of data exchange between networks, making it easier to solve performance problems occurring between hosts, interconnected by several networks. It contains a set of services, delivering performance measurements in a multi-domain environment through well defined protocols, introducing intermediate layers between the performance measurement tools and the visualization applications.
The Measurement Points are the lowest layer in the system, performing active or passive measurements and storing network characteristics. The Measurement Point Layer of a domain consists of different monitoring components or agents, deployed within its boundaries. A monitoring agent provides information on a specific metric (e.g., one-way delay, jitter, loss, available bandwidth) by accessing the corresponding Measurement Points. Each network domain can, in principle, deploy Measurement Points of its choice.
The Service Layer [8] is the middle layer of the system and consists of separate administrative domains. It allows for the exchange of measurement data and management information between those domains. In each domain, a set of entities (services) is
responsible for the domain control. Each of them is in charge of a specific functionality, like authentication and authorisation, discovery of the other entities providing specific functionalities, resource management, or measurement of network traffic parameters. In particular, the Measurement Archive (MA) Service is designed as a repository for measurement results. The interaction of the entities inside a domain as well as the access to the Measurement Point Layer or other domains may not be visible to the end user. Some of the entities contain an interface which can be accessed by the User Interface Layer.
The User Interface Layer consists of visualization tools (user interfaces), which adapt the presentation of performance data to be appropriate for the needs of specific user groups. In addition, they may allow users to perform tests, using the lower layers of the framework.
The aim of perfSONAR’s design is to provide the main functionalities at the Service Layer as independent entities, allowing increased flexibility for the system. Existing elements may be replaced easily or new ones can be inserted. Even if the number of entities is large, they can be identified and invoked using discovery functionalities. 4. PerfsonarUI
The development of PerfsonarUI began in Q4 of 2005, triggered by the explicit need to provide an open source, publicly accessible, easy to use, and yet powerful stand alone graphical user interface client, capable of querying all available perfSONAR services and displaying the returned data in a concise manner. At the time of this writing, PerfsonarUI supports all deployed Round Robin Database (RRD) and IP Performance Measurement (IPPM) MA services [9, 10, 11]. 4.1. Design, implementation and requirements
A Java runtime environment on the client system is required for PerfsonarUI, which makes it platform independent. It uses the Apache Axis SOAP implementation [12] to query perfSONAR services. The visualization is based on JFreeChart [13] – an open source Java library for generating charts.
PerfsonarUI is distributed with a fully automated offline installer (PerfsonarUI-vX.YZ-setup.exe), compatible with recent versions of the Microsoft Windows (NT, 2000, XP, 2003) operating system, as well as a ZIP archive. Both distributions include the
source code of the application, released under the GNU LGPLv2.1. Windows users should prefer the automatic installer, while the ZIP archive is suitable for any other platform. 4.2. Functionality
PerfsonarUI provides seamless access to network performance data across different domains through a flexible and universal user interface, integrating an easily extensible set of different performance metrics. The multi-domain scenario is natively supported, thanks to the fully distributed design and implementation of the interactions between the User Interface Layer and the Service Layer.
At present, PerfsonarUI is able to query one or several RRDs and/or IPPM MAs simultaneously (in parallel threads) and visualize the returned data. Users can apply filters (a list of IPv4/IPv6 interface addresses or arbitrary traceroute output) in order to search for a particular subset of interface utilization data. The visualization is done both in tabular and graphical form. A condensed summary of interface utilization is provided in a radar chart. Users can select different criteria for sorting the data. The tool provides a quick overview of the interface utilization vs. capacity in several user-selected domains simultaneously, as well as detailed views for any particular interface. Time intervals for summary and detailed views are selectable through radio buttons and sliders. Another important feature of PerfsonarUI is the ability to visualize one-way delay (OWD), IP Delay Variation (IPDV), and packet loss between IPPM Measurement Points. Graph zooming capabilities are built-in. Users can select source, destination, probe packet size, and date. Support for more options, as well as better error handling and reporting are planned for future releases. 4.3. Use cases
The primary target user groups for PerfsonarUI include Network Operations Centres’ (NOCs) and Performance Enhancement and Response Teams’ (PERTs) staff, as well as projects with demanding network performance requirements. End-users with some basic technical background are supposed to master the tool quite easily too.
In the following subsections we present two typical usage scenarios, highlighting the advantages of our solution. In both cases a higher level of integration between different performance metrics reporting is achieved, while multi-domain lookups are also supported by design. Some of the basic functions could
be provided by previously deployed state-of-the-art tools like MRTG, CACTI, SmokePing, etc. 4.3.1. Traceroute visualization
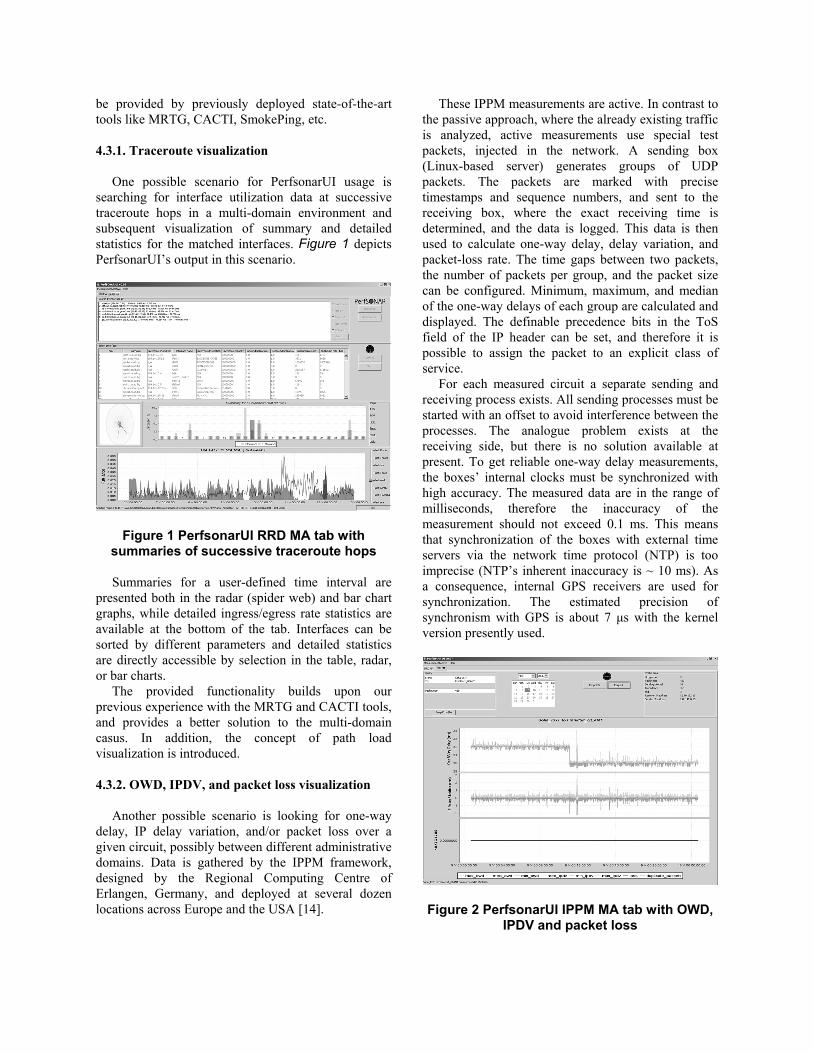
One possible scenario for PerfsonarUI usage is searching for interface utilization data at successive traceroute hops in a multi-domain environment and subsequent visualization of summary and detailed statistics for the matched interfaces. Figure 1 depicts PerfsonarUI’s output in this scenario.
Figure 1 PerfsonarUI RRD MA tab with
summaries of successive traceroute hops
Summaries for a user-defined time interval are presented both in the radar (spider web) and bar chart graphs, while detailed ingress/egress rate statistics are available at the bottom of the tab. Interfaces can be sorted by different parameters and detailed statistics are directly accessible by selection in the table, radar, or bar charts.
The provided functionality builds upon our previous experience with the MRTG and CACTI tools, and provides a better solution to the multi-domain casus. In addition, the concept of path load visualization is introduced. 4.3.2. OWD, IPDV, and packet loss visualization
Another possible scenario is looking for one-way delay, IP delay variation, and/or packet loss over a given circuit, possibly between different administrative domains. Data is gathered by the IPPM framework, designed by the Regional Computing Centre of Erlangen, Germany, and deployed at several dozen locations across Europe and the USA [14].
These IPPM measurements are active. In contrast to the passive approach, where the already existing traffic is analyzed, active measurements use special test packets, injected in the network. A sending box (Linux-based server) generates groups of UDP packets. The packets are marked with precise timestamps and sequence numbers, and sent to the receiving box, where the exact receiving time is determined, and the data is logged. This data is then used to calculate one-way delay, delay variation, and packet-loss rate. The time gaps between two packets, the number of packets per group, and the packet size can be configured. Minimum, maximum, and median of the one-way delays of each group are calculated and displayed. The definable precedence bits in the ToS field of the IP header can be set, and therefore it is possible to assign the packet to an explicit class of service.
For each measured circuit a separate sending and receiving process exists. All sending processes must be started with an offset to avoid interference between the processes. The analogue problem exists at the receiving side, but there is no solution available at present. To get reliable one-way delay measurements, the boxes’ internal clocks must be synchronized with high accuracy. The measured data are in the range of milliseconds, therefore the inaccuracy of the measurement should not exceed 0.1 ms. This means that synchronization of the boxes with external time servers via the network time protocol (NTP) is too imprecise (NTP’s inherent inaccuracy is ~ 10 ms). As a consequence, internal GPS receivers are used for synchronization. The estimated precision of synchronism with GPS is about 7 μs with the kernel version presently used.
Figure 2 PerfsonarUI IPPM MA tab with OWD,
IPDV and packet loss
PerfsonarUI interacts with the IPPM infrastructure
via a perfSONAR IPPM MA service, deployed at DFN-Erlangen. Figure 2 depicts PerfsonarUI’s output in this scenario.
OWD, IPDV, packet loss, and re-ordering for a selected source/destination pair and date are plotted on three aligned graphs for easier comparison. The graphs have built-in zooming capabilities.
The provided functionality represents a significant improvement over SmokePing’s capabilities, in particular with respect to the availability of one-way delay measurements across multiple domains. 5. Conclusion and future work
The perfSONAR network monitoring framework represents a promising approach to closing the gap between different administrative domains and enabling better integration between different network performance metrics monitoring solutions. A range of new services are being implemented and deployed at present, in particular the Lookup Service, the Authentication and Authorisation service, as well as Looking Glass, Telnet/SSH, NetFlow, SNMP, BWCTL, OWAMP Measurement Points, etc.
Support for the Lookup Service and Authentication and Authorisation Service is planned to be available in upcoming versions of PerfsonarUI in the near future. Ultimately, integration between PerfsonarUI and all deployed perfSONAR services could be achieved by using its powerful plug-in interface. References [1] perfSONAR (Performance focused Service Oriented Network monitoring ARchitecture). http://www.perfsonar.net/. [2] PerfsonarUI (Performance focused service oriented network monitoring architecture User Interface). http://www.perfsonar.net/jra1-wiki/index.php/PerfsonarUI.
[3] T. Oetiker. Multi Router Traffic Grapher (MRTG). http://oss.oetiker.ch/mrtg/. [4] T. Oetiker. Round Robin Database Tool (RRDtool). http://oss.oetiker.ch/rrdtool/. [5] CACTI. http://www.cacti.net/. [6] T. Oetiker. SmokePing. http://oss.oetiker.ch/smokeping/. [7] Boote, J. W., Boyd, E. L., Durand, J., Hanemann, A., Kudarimoti, L., Lapacz, R., Simar, N., Trocha, S., “Towards Multi–Domain Monitoring for the European Research Networks”, In “Selected Papers from the TERENA Networking Conference”, TERENA, ISBN 90-77559-04-3, 2005. [8] Hanemann, A., Boote, J. W., Boyd, E. L., Durand, J., Kudarimoti, L., Lapacz, R., Swany, D. M., Zurawski, J., Trocha, S., “PerfSONAR: A Service Oriented Architecture for Multi–Domain Network Monitoring”, In “Proceedings of the Third International Conference on Service Oriented Computing”, Springer Verlag, LNCS 3826, pp. 241–254, ACM Sigsoft and Sigweb, Amsterdam, The Netherlands, December, 2005. [9] RRD type MA service installations. http://www.perfsonar.net/jra1-wiki/index.php/RRD_type_MA_Service_Installations. [10] Availability and response time status for deployed perfSONAR services. http://netmon.acad.bg/smokeping?target=svc.prfs [11] IPPM MA. http://www.perfsonar.net/jra1-wiki/index.php/IPPM_MA. [12] Apache Axis. http://ws.apache.org/axis. [13] JFreeChart. http://www.jfree.org/jfreechart. [14] IPPM - Performance measurement in Internet Backbones. http://www-win.rrze.uni-erlangen.de/ippm/.